Extension of single-step ssgblup to many genotyped individuals. Ignacy Misztal University of Georgia
|
|
|
- Mavis Jasmine Garrison
- 5 years ago
- Views:
Transcription
1 Extension of single-step ssgblup to many genotyped individuals Ignacy Misztal University of Georgia

2 Genomic selection and single-step H -1 =A G -1-1 A 22 Aguilar et al., 2010 Christensen and Lund, 2010 Simplicity No DYD or DP No index No complexity Accuracy Avoids double counting Avoids fixed index Accounts for preselection bias
3 Current implementation of SS -1-1 H = A G A G and A 22 created explicitly Quadratic memory and cubic computations Cost per 100k genotypes hr (Aguilar et al.,2014)
4 Number of genotypes and impending problem > 2 M for Holsteins > 400k for Angus Genomic pre-selection issue (Patry and Ducrocq, 2011; VanRaden et al., 2013) BLUP increasingly biased Need all data on preselection included
5 Unsymmetric equations Misztal et al., 2009 No convergence without good preconditioner No convergence with large H or A

6 No G or A 22 inverse model Slow convergence with few genotypes Divergence with many genotypes Legarra and Ducrocq (2011)

7 SNP model for genotyped animals Legarra and Ducrocq, 2011 No successful programming
8 SNP model for genotyped animals Liu et al, 2014
9 SNP effects for all animals (Fernando et al., 2014) imputed genotypes centered genotypes Cost of imputation Requires new type of programming Extension to complex models unclear
10 Can regular ssgblup be made more efficient?

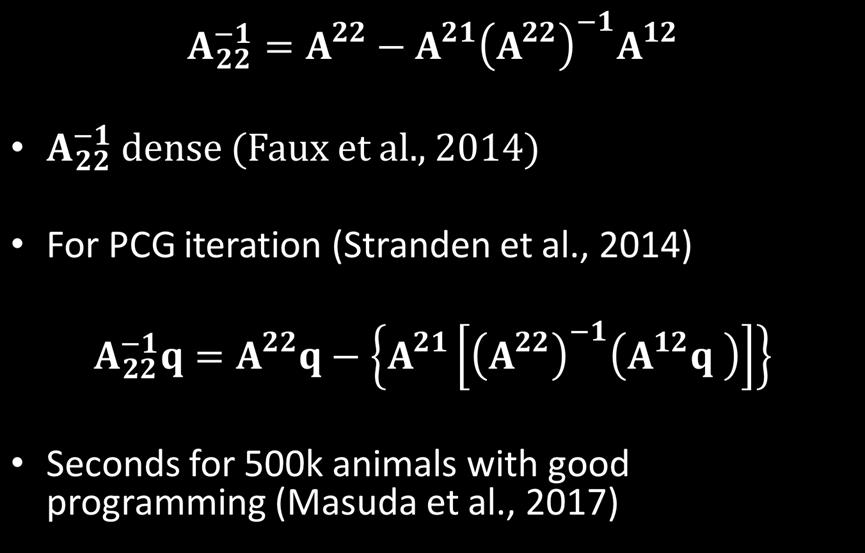
11 Scaling up A 22-1
12 Is dimensionality of genomic information limited? Regular G not positive definite past ~5k Blending with A (VanRaden, 2008) Dimensionality of SNP BLUP small (Maciotta et al., 2013) Success of imputation Manhattan plots noisy until averaged by 300k-10Mb (depending on species)
13
14 Heterogenetic and homogenic tracts in genome (Stam, 1980) E(#tracts)=4NeL (Stam, 1980) Ne effective population size L length of genome in Morgans Holsteins: Ne 100 L=30 Me=12,000


15 Inversion via SVD/eigenvalue decomposition Assume 1 million animals genotyped with 60k chip


16 Inverse by Woodbury formula Mantysaari et al., 2017 Ostersen et al., 2017
17 If G has limited dimensionality, can G -1 be sparse like A -1?


18 Use of a la Henderson s rules? Use of relatives for G -1 Accuracies not good enough Theory not clear
19 Assumption of limited dimensionality s n x 1 vector containing additive information of population (haplotypes, chromosome segments, LD blocks)? Breeding value u= Ts+ e Very small error If u c contains n animals: s T u 1 c c Breeding values of any n animals contains all additive information
20 Choose core c and noncore n animals u u = P u +ε n nc c n c = u c uc I 0 uc = un Pnc I εn var( ε ) = M n nn G I 0 Gcc 0 I Pcn = Pnc I 0 Mnn 0 I G 1 I P 1 cn Gcc 0 I 0 = 1 0 I 0 Mnn Pnc I
21 How to estimate P and inv(g)? var uc Gcc Gcn = σ un Gnc Gnn 2 u G is true relationship matrix u u = G G u, P= G G 1 1 n c nc cc c nc cc Gcc 0 GccGcn -1-1 G = + M G nc'gcc I 0 0 I APY algorithm (Algorithm for Proven and Young)
22 Properties of APY algorithm G G -1 Cost: Quadratic memory and cubic computations G APY G -1 Cost: Almost linear memory and computations

23 EAAP meeting 2016

24 Reliabilities Holsteins (77k) Final score regular G k 8k 14k 19k 77k NeL 2NeL 4NeL Pocrnic et al., 2016b
25 Distribution of segments/haplotypes/.. 100% 4NeL Reliability Assumed dimensionality
26 Costs with 720k genotyped animals 30 M Holsteins 50 M records 764k 60k genotypes Item BLUP ssgblup APY G - 7 h A min rounds Time/round 51 s 83 s Total time 6 h 17 h Masuda et al., 2017
 Simulated populations (QMSim; Sargolzaei and Schenkel, 2009) Ne = 40 #genotyped animals = 50,000 Core")
27 Which core animals in APY? Bradford et al. (2017) Simulated populations (QMSim; Sargolzaei and Schenkel, 2009) Ne = 40 #genotyped animals = 50,000 Core animals: Random gen 6 gen 7 gen8 gen9 gen 10 (y) Random all generations 30


28 Which core animals in APY? G -1 4NeL NeL Bradford et al. (2016) 31
29 Persistence over generations 1.0 GBLUP very large population Reliability GBLUP very large population 90% genome BayesB small population GBLUP small population BLUP Generations Very large equivalent to 4NeL animals with 99% accuracy Are SNP effects from Holstein national populations converging
30 Theory of limited dimensionality Number of haplotypes: 4 Ne L Ne within each ¼ Morgan segment Genome haplotypes QTLs Ne haplotypes Ne haplotypes Ne haplotypes ¼ Morgan Dimensionality of ¼ Morgan case: Ne or number of identified QTLs Reduced dimensionality with weighted GRM Fragomeni et al., 2018


31 ssgblup accuracies using SNP60K and 100 QTNs simulation study Rank Fragomeni et al. (2017) 19k 5k 98
32 Multitrait ssgblup or SNP selection? SNP selection/weighting (BayesB, etc.) Large impact with few genotypes Little or no impact with many
33 Based on SNP limitations REML based on relationships Equations no longer sparse Variance components YAMS sparse matrix package up to 100 times speedup (Masuda et al., 2017) APY for REML Method R (Legarra and Reverter, 2017)
34 Extra topics Matching pedigrees and genomic relationships Missing pedigrees Crossbreeding Causative SNP Haplotypes for crossbreds (Christensen et al., 2016) Metafounders (Legarra et al., 2016) Approximation of reliabilities
35 Conclusions Limited dimensionality of genomic information due to limited effective population size ssgblup suitable for any data set and model With large data sets for Holsteins: Good persistence of predictions Convergence of predictions from different countries


36 Acknowledgements Tom Lawlor, Holstein Assoc Paul VanRaden, AGIL USDA Shogo Tsuruta Ignacio Aguilar Breno Fragomeni Ivan Pocrnic Daniela Lourenco Yutaka Masuda Andres Legarra Heather Bradford
37 Theory for APY Breeding values of core animals linear functions of: Independent chromosome segments (Me) Independent effective SNP E(Me)=4 Ne L (Stam, 1980; VanRaden, 2008) Ne effective population size L length of genome in Morgans Me = 4 (Ne=100) (L=30) =12,000

38 Accuracy and distance from markers to QTL Fragomeni et al. (2017) QTL 46
Limited dimensionality of genomic information and effective population size
 Limited dimensionality of genomic information and effective population size Ivan Pocrnić 1, D.A.L. Lourenco 1, Y. Masuda 1, A. Legarra 2 & I. Misztal 1 1 University of Georgia, USA 2 INRA, France WCGALP,
FOR animals and plants, many genomic analyses with SNP
 INVESTIGATION Inexpensive Computation of the Inverse of the Genomic Relationship Matrix in Populations with Small Effective Population Size Ignacy Misztal 1 Animal and Dairy Science, University of Georgia,
Genotyping strategy and reference population
 GS cattle workshop Genotyping strategy and reference population Effect of size of reference group (Esa Mäntysaari, MTT) Effect of adding females to the reference population (Minna Koivula, MTT) Value of
Crosses. Computation APY Sherman-Woodbury «hybrid» model. Unknown parent groups Need to modify H to include them (Misztal et al., 2013) Metafounders
 Metafounders") Details in ssgblup Details in SSGBLUP Storage Inbreeding G is not invertible («blending») G might not explain all genetic variance («blending») Compatibility of G and A22 Assumption p(u 2 )=N(0,G) If there
Details in ssgblup Details in SSGBLUP Storage Inbreeding G is not invertible («blending») G might not explain all genetic variance («blending») Compatibility of G and A22 Assumption p(u 2 )=N(0,G) If there
Genetic evaluation for three way crossbreeding
 Genetic evaluation for three way crossbreeding Ole F. Christensen olef.christensen@mbg.au.dk Aarhus University, Center for Quantitative Genetics and Genomics EAAP 2015, Warszawa Motivation (pigs) Crossbreeding
Large scale genomic prediction using singular value decomposition of the genotype matrix
 https://doi.org/0.86/s27-08-0373-2 Genetics Selection Evolution RESEARCH ARTICLE Open Access Large scale genomic prediction using singular value decomposition of the genotype matrix Jørgen Ødegård *, Ulf
GBLUP and G matrices 1
 GBLUP and G matrices 1 GBLUP from SNP-BLUP We have defined breeding values as sum of SNP effects:! = #$ To refer breeding values to an average value of 0, we adopt the centered coding for genotypes described
Pedigree and genomic evaluation of pigs using a terminal cross model
 66 th EAAP Annual Meeting Warsaw, Poland Pedigree and genomic evaluation of pigs using a terminal cross model Tusell, L., Gilbert, H., Riquet, J., Mercat, M.J., Legarra, A., Larzul, C. Project funded by:
An Iterative Implementation of the Single Step Approach for Genomic Evaluation which Preserves Existing Genetic Evaluation Models and Software
 INTERBULL BULLETIN NO. 44. Stavanger, Norway, gst 6-9, 011 n Iterative Implementation of the Single Step pproach for enomic Evalation which Preserves Existing enetic Evalation Models and Software V. Dcrocq
A relationship matrix including full pedigree and genomic information
 J Dairy Sci 9 :4656 4663 doi: 103168/jds009-061 American Dairy Science Association, 009 A relationship matrix including full pedigree and genomic information A Legarra,* 1 I Aguilar, and I Misztal * INRA,
BLUP without (inverse) relationship matrix
 relationship matrix") Proceedings of the World Congress on Genetics Applied to Livestock Production, 11, 5 BLUP without (inverse relationship matrix E. Groeneveld (1 and A. Neumaier ( (1 Institute of Farm Animal Genetics, Friedrich-Loeffler-Institut,
Proceedings of the World Congress on Genetics Applied to Livestock Production, 11, 5 BLUP without (inverse relationship matrix E. Groeneveld (1 and A. Neumaier ( (1 Institute of Farm Animal Genetics, Friedrich-Loeffler-Institut,
Bases for Genomic Prediction
 Bases for Genomic Prediction Andres Legarra Daniela A.L. Lourenco Zulma G. Vitezica 2018-07-15 1 Contents 1 Foreword by AL (it only engages him) 5 2 Main notation 6 3 A little bit of history 6 4 Quick
Accounting for read depth in the analysis of genotyping-by-sequencing data
 Accounting for read depth in the analysis of genotyping-by-sequencing data Ken Dodds, John McEwan, Timothy Bilton, Rudi Brauning, Rayna Anderson, Tracey Van Stijn, Theodor Kristjánsson, Shannon Clarke
CAN WE FRAME AND UNDERSTAND CROSS-VALIDATION RESULTS IN ANIMAL BREEDING? A. Legarra 1, A. Reverter 2
 Proc. Assoc. Advmt. Anim. Breed. Genet. 22:73-80 CAN WE FRAME AND UNDERSTAND CROSS-VALIDATION RESULTS IN ANIMAL BREEDING? A. Legarra 1, A. Reverter 2 1 UMR 1388 GenPhySE, INRA, Castanet Tolosan, France
Lecture 28: BLUP and Genomic Selection. Bruce Walsh lecture notes Synbreed course version 11 July 2013
 Lecture 28: BLUP and Genomic Selection Bruce Walsh lecture notes Synbreed course version 11 July 2013 1 BLUP Selection The idea behind BLUP selection is very straightforward: An appropriate mixed-model
Lecture 8 Genomic Selection
 Lecture 8 Genomic Selection Guilherme J. M. Rosa University of Wisconsin-Madison Mixed Models in Quantitative Genetics SISG, Seattle 18 0 Setember 018 OUTLINE Marker Assisted Selection Genomic Selection
Using the genomic relationship matrix to predict the accuracy of genomic selection
 J. Anim. Breed. Genet. ISSN 0931-2668 ORIGINAL ARTICLE Using the genomic relationship matrix to predict the accuracy of genomic selection M.E. Goddard 1,2, B.J. Hayes 2 & T.H.E. Meuwissen 3 1 Department
Orthogonal Estimates of Variances for Additive, Dominance. and Epistatic Effects in Populations
 Genetics: Early Online, published on May 18, 2017 as 10.1534/genetics.116.199406 Orthogonal Estimates of Variances for Additive, Dominance and Epistatic Effects in Populations Z.G. VITEZICA *, 1, A. LEGARRA,
Genomic model with correlation between additive and dominance effects
 Genetics: Early Online, published on May 9, 018 as 10.1534/genetics.118.301015 1 Genomic model with correlation between additive and dominance effects 3 4 Tao Xiang 1 *, Ole Fredslund Christensen, Zulma
Comparison of computing properties of derivative and derivative-free algorithms in variance component estimation by REML.
 April, 000 Comparison of computing properties of derivative and derivative-free algorithms in variance component estimation by REML By Ignacy Misztal University of Illinois, Urbana, Illinois 0, USA 0 0
A first step toward genomic selection in the multi-breed French dairy goat population
 J. Dairy Sci. 96 :794 7305 http://dx.doi.org/ 10.3168/jds.013-6789 American Dairy Science Association, 013. A first step toward genomic selection in the multi-breed French dairy goat population C. Carillier,*
G-BLUP without inverting the genomic relationship matrix
 G-BLUP without inverting the genomic relationship matrix Per Madsen 1 and Jørgen Ødegård 2 1 Center for Quantitative Genetics and Genomics Department of Molecular Biology and Genetics, Aarhus University
A simple method to separate base population and segregation effects in genomic relationship matrices
 Plieschke et al. Genetics Selection Evolution (2015) 47:53 DOI 10.1186/s12711-015-0130-8 Genetics Selection Evolution RESEARCH ARTICLE Open Access A simple method to separate base population and segregation
Multiple-Trait Across-Country Evaluations Using Singular (Co)Variance Matrix and Random Regression Model
Variance Matrix and Random Regression Model") Multiple-rait Across-Country Evaluations Using Singular (Co)Variance Matrix and Random Regression Model Esa A. Mäntysaari M Agrifood Research Finland, Animal Production, SF 31600 Jokioinen 1. Introduction
Multiple-rait Across-Country Evaluations Using Singular (Co)Variance Matrix and Random Regression Model Esa A. Mäntysaari M Agrifood Research Finland, Animal Production, SF 31600 Jokioinen 1. Introduction
Efficient Bayesian mixed model analysis increases association power in large cohorts
 Linear regression Existing mixed model methods New method: BOLT-LMM Time O(MM) O(MN 2 ) O MN 1.5 Corrects for confounding? Power Efficient Bayesian mixed model analysis increases association power in large
Lecture 5: BLUP (Best Linear Unbiased Predictors) of genetic values. Bruce Walsh lecture notes Tucson Winter Institute 9-11 Jan 2013
 of genetic values. Bruce Walsh lecture notes Tucson Winter Institute 9-11 Jan 2013") Lecture 5: BLUP (Best Linear Unbiased Predictors) of genetic values Bruce Walsh lecture notes Tucson Winter Institute 9-11 Jan 013 1 Estimation of Var(A) and Breeding Values in General Pedigrees The classic
Lecture 5: BLUP (Best Linear Unbiased Predictors) of genetic values Bruce Walsh lecture notes Tucson Winter Institute 9-11 Jan 013 1 Estimation of Var(A) and Breeding Values in General Pedigrees The classic
Package bwgr. October 5, 2018
 Type Package Title Bayesian Whole-Genome Regression Version 1.5.6 Date 2018-10-05 Package bwgr October 5, 2018 Author Alencar Xavier, William Muir, Shizhong Xu, Katy Rainey. Maintainer Alencar Xavier
RESTRICTED M A X I M U M LIKELIHOOD TO E S T I M A T E GENETIC P A R A M E T E R S - IN PRACTICE
 RESTRICTED M A X I M U M LIKELIHOOD TO E S T I M A T E GENETIC P A R A M E T E R S - IN PRACTICE K. M e y e r Institute of Animal Genetics, Edinburgh University, W e s t M a i n s Road, Edinburgh EH9 3JN,
Genotype Imputation. Biostatistics 666
 Genotype Imputation Biostatistics 666 Previously Hidden Markov Models for Relative Pairs Linkage analysis using affected sibling pairs Estimation of pairwise relationships Identity-by-Descent Relatives
A mixed model based QTL / AM analysis of interactions (G by G, G by E, G by treatment) for plant breeding
 for plant breeding") Professur Pflanzenzüchtung Professur Pflanzenzüchtung A mixed model based QTL / AM analysis of interactions (G by G, G by E, G by treatment) for plant breeding Jens Léon 4. November 2014, Oulu Workshop
Professur Pflanzenzüchtung Professur Pflanzenzüchtung A mixed model based QTL / AM analysis of interactions (G by G, G by E, G by treatment) for plant breeding Jens Léon 4. November 2014, Oulu Workshop
Genome-wide analysis of zygotic linkage disequilibrium and its components in crossbred cattle
 Jiang et al. BMC Genetics 2012, 13:65 RESEARCH ARTICLE Open Access Genome-wide analysis of zygotic linkage disequilibrium and its components in crossbred cattle Qi Jiang 1, Zhiquan Wang 1, Stephen S Moore
Genomic prediction using haplotypes in New Zealand dairy cattle
 Graduate Theses and Dissertations Iowa State University Capstones, Theses and Dissertations 2016 Genomic prediction using haplotypes in New Zealand dairy cattle Melanie Kate Hayr Iowa State University
INTRODUCTION TO ANIMAL BREEDING. Lecture Nr 3. The genetic evaluation (for a single trait) The Estimated Breeding Values (EBV) The accuracy of EBVs
 The Estimated Breeding Values (EBV) The accuracy of EBVs") INTRODUCTION TO ANIMAL BREEDING Lecture Nr 3 The genetic evaluation (for a single trait) The Estimated Breeding Values (EBV) The accuracy of EBVs Etienne Verrier INA Paris-Grignon, Animal Sciences Department
INTRODUCTION TO ANIMAL BREEDING Lecture Nr 3 The genetic evaluation (for a single trait) The Estimated Breeding Values (EBV) The accuracy of EBVs Etienne Verrier INA Paris-Grignon, Animal Sciences Department
MODELLING STRATEGIES TO IMPROVE GENETIC EVALUATION FOR THE NEW ZEALAND SHEEP INDUSTRY. John Holmes
 MODELLING STRATEGIES TO IMPROVE GENETIC EVALUATION FOR THE NEW ZEALAND SHEEP INDUSTRY John Holmes A thesis submitted for the degree of Doctor of Philosophy at the University of Otago, Dunedin, New Zealand
Genomic best linear unbiased prediction method including imprinting effects for genomic evaluation
 Nishio Satoh Genetics Selection Evolution (2015) 47:32 DOI 10.1186/s12711-015-0091-y Genetics Selection Evolution RESEARCH Open Access Genomic best linear unbiased prediction method including imprinting
Quantitative genetics theory for genomic selection and efficiency of genotypic value prediction in open-pollinated populations
 4 Scientia Agricola http://dx.doi.org/0.590/678-99x-05-0479 Quantitative genetics theory for genomic selection and efficiency of genotypic value prediction in open-pollinated populations José Marcelo Soriano
arxiv: v1 [stat.me] 10 Jun 2018
![arxiv: v1 [stat.me] 10 Jun 2018](/thumbs/79/80338220.jpg "arxiv: v1 [stat.me] 10 Jun 2018") Lost in translation: On the impact of data coding on penalized regression with interactions arxiv:1806.03729v1 [stat.me] 10 Jun 2018 Johannes W R Martini 1,2 Francisco Rosales 3 Ngoc-Thuy Ha 2 Thomas Kneib
Lost in translation: On the impact of data coding on penalized regression with interactions arxiv:1806.03729v1 [stat.me] 10 Jun 2018 Johannes W R Martini 1,2 Francisco Rosales 3 Ngoc-Thuy Ha 2 Thomas Kneib
Solving Large Test-Day Models by Iteration on Data and Preconditioned Conjugate Gradient
 Solving Large Test-Day Models by Iteration on Data and Preconditioned Conjugate Gradient M. LIDAUER, I. STRANDÉN, E. A. MÄNTYSAARI, J. PÖSÖ, and A. KETTUNEN Animal Production Research, Agricultural Research
Impact of Using Reduced Rank Random Regression Test-Day Model on Genetic Evaluation
 Impact of Using Reduced Rank Random Regression Test-Day on Genetic Evaluation H. Leclerc 1, I. Nagy 2 and V. Ducrocq 2 1 Institut de l Elevage, Département Génétique, Bât 211, 78 352 Jouy-en-Josas, France
New imputation strategies optimized for crop plants: FILLIN (Fast, Inbred Line Library ImputatioN) FSFHap (Full Sib Family Haplotype)
 FSFHap (Full Sib Family Haplotype)") New imputation strategies optimized for crop plants: FILLIN (Fast, Inbred Line Library ImputatioN) FSFHap (Full Sib Family Haplotype) Kelly Swarts PAG Allele Mining 1/11/2014 Imputation is the projection
New imputation strategies optimized for crop plants: FILLIN (Fast, Inbred Line Library ImputatioN) FSFHap (Full Sib Family Haplotype) Kelly Swarts PAG Allele Mining 1/11/2014 Imputation is the projection
Mixed-Models. version 30 October 2011
 Mixed-Models version 30 October 2011 Mixed models Mixed models estimate a vector! of fixed effects and one (or more) vectors u of random effects Both fixed and random effects models always include a vector
Multi-population genomic prediction. Genomic prediction using individual-level data and summary statistics from multiple.
 Genetics: Early Online, published on July 18, 2018 as 10.1534/genetics.118.301109 Multi-population genomic prediction 1 2 Genomic prediction using individual-level data and summary statistics from multiple
Heritability estimation in modern genetics and connections to some new results for quadratic forms in statistics
 Heritability estimation in modern genetics and connections to some new results for quadratic forms in statistics Lee H. Dicker Rutgers University and Amazon, NYC Based on joint work with Ruijun Ma (Rutgers),
Computations with Markers
 Computations with Markers Paulino Pérez 1 José Crossa 1 1 ColPos-México 2 CIMMyT-México June, 2015. CIMMYT, México-SAGPDB Computations with Markers 1/20 Contents 1 Genomic relationship matrix 2 3 Big Data!
(Genome-wide) association analysis
 association analysis") (Genome-wide) association analysis 1 Key concepts Mapping QTL by association relies on linkage disequilibrium in the population; LD can be caused by close linkage between a QTL and marker (= good) or by
(Genome-wide) association analysis 1 Key concepts Mapping QTL by association relies on linkage disequilibrium in the population; LD can be caused by close linkage between a QTL and marker (= good) or by
MIXED MODELS THE GENERAL MIXED MODEL
 MIXED MODELS This chapter introduces best linear unbiased prediction (BLUP), a general method for predicting random effects, while Chapter 27 is concerned with the estimation of variances by restricted
Recent advances in statistical methods for DNA-based prediction of complex traits
 Recent advances in statistical methods for DNA-based prediction of complex traits Mintu Nath Biomathematics & Statistics Scotland, Edinburgh 1 Outline Background Population genetics Animal model Methodology
Everyday Multithreading
 Everyday Multithreading Parallel computing for genomic evaluations in R C. Heuer, D. Hinrichs, G. Thaller Institute of Animal Breeding and Husbandry, Kiel University August 27, 2014 C. Heuer, D. Hinrichs,
Calculation of IBD probabilities
 Calculation of IBD probabilities David Evans and Stacey Cherny University of Oxford Wellcome Trust Centre for Human Genetics This Session IBD vs IBS Why is IBD important? Calculating IBD probabilities
Mixed-Model Estimation of genetic variances. Bruce Walsh lecture notes Uppsala EQG 2012 course version 28 Jan 2012
 Mixed-Model Estimation of genetic variances Bruce Walsh lecture notes Uppsala EQG 01 course version 8 Jan 01 Estimation of Var(A) and Breeding Values in General Pedigrees The above designs (ANOVA, P-O
Lecture Notes. Introduction
 5/3/016 Lecture Notes R. Rekaya June 1-10, 016 Introduction Variance components play major role in animal breeding and genetic (estimation of BVs) It has been an active area of research since early 1950
Introduction to second order approximation. SGZ Macro Week 3, Day 4 Lecture 1
 Introduction to second order approximation 1 Outline A. Basic concepts in static models 1. What are first and second order approximations? 2. What are implications for accuracy of welfare calculations
Lecture WS Evolutionary Genetics Part I 1
 Quantitative genetics Quantitative genetics is the study of the inheritance of quantitative/continuous phenotypic traits, like human height and body size, grain colour in winter wheat or beak depth in
Detecting selection from differentiation between populations: the FLK and hapflk approach.
 Detecting selection from differentiation between populations: the FLK and hapflk approach. Bertrand Servin bservin@toulouse.inra.fr Maria-Ines Fariello, Simon Boitard, Claude Chevalet, Magali SanCristobal,
Linear Models for the Prediction of Animal Breeding Values
 Linear Models for the Prediction of Animal Breeding Values R.A. Mrode, PhD Animal Data Centre Fox Talbot House Greenways Business Park Bellinger Close Chippenham Wilts, UK CAB INTERNATIONAL Preface ix
Supporting Information Text S1
 Supporting Information Text S1 List of Supplementary Figures S1 The fraction of SNPs s where there is an excess of Neandertal derived alleles n over Denisova derived alleles d as a function of the derived
Alternative implementations of Monte Carlo EM algorithms for likelihood inferences
 Genet. Sel. Evol. 33 001) 443 45 443 INRA, EDP Sciences, 001 Alternative implementations of Monte Carlo EM algorithms for likelihood inferences Louis Alberto GARCÍA-CORTÉS a, Daniel SORENSEN b, Note a
Introduction to Machine Learning. PCA and Spectral Clustering. Introduction to Machine Learning, Slides: Eran Halperin
 1 Introduction to Machine Learning PCA and Spectral Clustering Introduction to Machine Learning, 2013-14 Slides: Eran Halperin Singular Value Decomposition (SVD) The singular value decomposition (SVD)
Quantitative genetics theory for genomic selection and efficiency of breeding value prediction in open-pollinated populations
 Scientia Agricola http://dx.doi.org/0.590/003-906-04-0383 Quantitative genetics theory for genomic selection and efficiency of breeding value prediction in open-pollinated populations 43 José Marcelo Soriano
Statistical issues in QTL mapping in mice
 Statistical issues in QTL mapping in mice Karl W Broman Department of Biostatistics Johns Hopkins University http://www.biostat.jhsph.edu/~kbroman Outline Overview of QTL mapping The X chromosome Mapping
Methods for QTL analysis
 Methods for QTL analysis Julius van der Werf METHODS FOR QTL ANALYSIS... 44 SINGLE VERSUS MULTIPLE MARKERS... 45 DETERMINING ASSOCIATIONS BETWEEN GENETIC MARKERS AND QTL WITH TWO MARKERS... 45 INTERVAL
Integer Programming in Computational Biology. D. Gusfield University of California, Davis Presented December 12, 2016.!
 Integer Programming in Computational Biology D. Gusfield University of California, Davis Presented December 12, 2016. There are many important phylogeny problems that depart from simple tree models: Missing
FaST linear mixed models for genome-wide association studies
 Nature Methods FaS linear mixed models for genome-wide association studies Christoph Lippert, Jennifer Listgarten, Ying Liu, Carl M Kadie, Robert I Davidson & David Heckerman Supplementary Figure Supplementary
GENOME-ENABLED PREDICTION RIDGE REGRESSION GENOMIC BLUP ROBUST METHODS: TMAP AND LMAP
 GENOME-ENABLED PREDICTION RIDGE REGRESSION GENOMIC BLUP ROBUST METHODS: TMAP AND LMAP RIDGE REGRESSION THE ESTIMATOR (HOERL AND KENNARD, 1979) WAS DERIVED USING A CONSTRAINED MINIMIZATION ARGUMENT Recirocal
Eigen decomposition expedites longitudinal genome wide association studies for milk production traits in Chinese Holstein
 https://doi.org/10.1186/s12711-018-0383-0 Genetics Selection Evolution RESEARCH ARTICLE Open Access Eigen decomposition expedites longitudinal genome wide association studies for milk production traits
Gaussian covariance graph models accounting for correlated marker effects in genome-wide
 1 2 3 4 5 6 7 8 9 10 11 Gaussian covariance graph models accounting for correlated marker effects in genome-wide prediction Carlos Alberto Martínez 1, Kshitij Khare 2, Syed Rahman 2, Mauricio A. Elzo 1
1 Springer. Nan M. Laird Christoph Lange. The Fundamentals of Modern Statistical Genetics
 1 Springer Nan M. Laird Christoph Lange The Fundamentals of Modern Statistical Genetics 1 Introduction to Statistical Genetics and Background in Molecular Genetics 0 0 1 0 0 0 0 0 0 0 0 0 0 0 0 0 0 0 0
Sketched Ridge Regression:
 Sketched Ridge Regression: Optimization and Statistical Perspectives Shusen Wang UC Berkeley Alex Gittens RPI Michael Mahoney UC Berkeley Overview Ridge Regression min w f w = 1 n Xw y + γ w Over-determined:
Genome-wide linkage disequilibrium and past effective population size in three Korean cattle breeds
 SHORT COMMUNICATION doi: 10.1111/age.12488 Genome-wide linkage disequilibrium and past effective population size in three Korean cattle breeds P. Sudrajad*, D. W. Seo*, T. J. Choi, B. H. Park, S. H. Roh,
Figure S1: The model underlying our inference of the age of ancient genomes
 A genetic method for dating ancient genomes provides a direct estimate of human generation interval in the last 45,000 years Priya Moorjani, Sriram Sankararaman, Qiaomei Fu, Molly Przeworski, Nick Patterson,
Introduction to Linkage Disequilibrium
 Introduction to September 10, 2014 Suppose we have two genes on a single chromosome gene A and gene B such that each gene has only two alleles Aalleles : A 1 and A 2 Balleles : B 1 and B 2 Suppose we have
A Novel FHB-Resistance QTL with Uncertain Origin and its Introgression into Durum and Hard Red Spring Wheat
 A Novel FHB-Resistance QTL with Uncertain Origin and its Introgression into Durum and Hard Red Spring Wheat Steven Xu, Chenggen Chu, Timothy Friesen, Shiaoman Chao, Shaobin Zhong, Scott Halley, Xiwen Cai,
Supplementary Information for Efficient Bayesian mixed model analysis increases association power in large cohorts
 Supplementary Information for Efficient Bayesian mixed model analysis increases association power in large cohorts Po-Ru Loh, George Tucker, Brendan K Bulik-Sullivan, Bjarni J Vilhjálmsson, Hilary K Finucane,
A Novel FHB-Resistance QTL with Uncertain Origin and its Introgression into Durum and Hard Red Spring Wheat
 A Novel FHB-Resistance QTL with Uncertain Origin and its Introgression into Durum and Hard Red Spring Wheat Steven Xu, Chenggen Chu, Timothy Friesen, Shiaoman Chao, Shaobin Zhong, Scott Halley, Xiwen Cai,
Modelling correlated marker effects in genome-wide prediction via Gaussian concentration
 Modelling correlated marker effects in genome-wide prediction via Gaussian concentration graph models Carlos Alberto Martínez 1, Kshitij Khare 2, Syed Rahman 2, Mauricio A. Elzo 1 1 Department of Animal
Sampling versus optimization in very high dimensional parameter spaces
 Sampling versus optimization in very high dimensional parameter spaces Grigor Aslanyan Berkeley Center for Cosmological Physics UC Berkeley Statistical Challenges in Modern Astronomy VI Carnegie Mellon
Accuracies of genomically estimated breeding values from pure-breed and across-breed predictions in Australian beef cattle
 Boerner et al. Genetics Selection Evolution 2014, 46:61 Genetics Selection Evolution RESEARCH Open Access Accuracies of genomically estimated breeding values from pure-breed and across-breed predictions
MOLECULAR MAPS AND MARKERS FOR DIPLOID ROSES
 MOLECULAR MAPS AND MARKERS FOR DIPLOID ROSES Patricia E Klein, Mandy Yan, Ellen Young, Jeekin Lau, Stella Kang, Natalie Patterson, Natalie Anderson and David Byrne Department of Horticultural Sciences,
Genetic and molecular background of cattle behaviour and its effects on milk production and welfare
 EAAP Annual Meeting 205, Session 38 Genetic and molecular background of cattle behaviour and its effects on milk production and welfare J. Friedrich, B. Brand 2, J. Knaust 2, C. Kühn 2, F. Hadlich 2, K.
Friday Harbor From Genetics to GWAS (Genome-wide Association Study) Sept David Fardo
 Sept David Fardo") Friday Harbor 2017 From Genetics to GWAS (Genome-wide Association Study) Sept 7 2017 David Fardo Purpose: prepare for tomorrow s tutorial Genetic Variants Quality Control Imputation Association Visualization
Friday Harbor 2017 From Genetics to GWAS (Genome-wide Association Study) Sept 7 2017 David Fardo Purpose: prepare for tomorrow s tutorial Genetic Variants Quality Control Imputation Association Visualization
GENOMIC SELECTION WORKSHOP: Hands on Practical Sessions (BL)
") GENOMIC SELECTION WORKSHOP: Hands on Practical Sessions (BL) Paulino Pérez 1 José Crossa 2 1 ColPos-México 2 CIMMyT-México September, 2014. SLU,Sweden GENOMIC SELECTION WORKSHOP:Hands on Practical Sessions
GENOMIC SELECTION WORKSHOP: Hands on Practical Sessions (BL) Paulino Pérez 1 José Crossa 2 1 ColPos-México 2 CIMMyT-México September, 2014. SLU,Sweden GENOMIC SELECTION WORKSHOP:Hands on Practical Sessions
PCA vignette Principal components analysis with snpstats
 PCA vignette Principal components analysis with snpstats David Clayton October 30, 2018 Principal components analysis has been widely used in population genetics in order to study population structure
Association Testing with Quantitative Traits: Common and Rare Variants. Summer Institute in Statistical Genetics 2014 Module 10 Lecture 5
 Association Testing with Quantitative Traits: Common and Rare Variants Timothy Thornton and Katie Kerr Summer Institute in Statistical Genetics 2014 Module 10 Lecture 5 1 / 41 Introduction to Quantitative
HERITABILITY ESTIMATION USING A REGULARIZED REGRESSION APPROACH (HERRA)
") BIRS 016 1 HERITABILITY ESTIMATION USING A REGULARIZED REGRESSION APPROACH (HERRA) Malka Gorfine, Tel Aviv University, Israel Joint work with Li Hsu, FHCRC, Seattle, USA BIRS 016 The concept of heritability
BIRS 016 1 HERITABILITY ESTIMATION USING A REGULARIZED REGRESSION APPROACH (HERRA) Malka Gorfine, Tel Aviv University, Israel Joint work with Li Hsu, FHCRC, Seattle, USA BIRS 016 The concept of heritability
The E-M Algorithm in Genetics. Biostatistics 666 Lecture 8
 The E-M Algorithm in Genetics Biostatistics 666 Lecture 8 Maximum Likelihood Estimation of Allele Frequencies Find parameter estimates which make observed data most likely General approach, as long as
Repeated Records Animal Model
 Repeated Records Animal Model 1 Introduction Animals are observed more than once for some traits, such as Fleece weight of sheep in different years. Calf records of a beef cow over time. Test day records
Proportional Variance Explained by QLT and Statistical Power. Proportional Variance Explained by QTL and Statistical Power
 Proportional Variance Explained by QTL and Statistical Power Partitioning the Genetic Variance We previously focused on obtaining variance components of a quantitative trait to determine the proportion
Estimation of Parameters in Random. Effect Models with Incidence Matrix. Uncertainty
 Estimation of Parameters in Random Effect Models with Incidence Matrix Uncertainty Xia Shen 1,2 and Lars Rönnegård 2,3 1 The Linnaeus Centre for Bioinformatics, Uppsala University, Uppsala, Sweden; 2 School
This book is dedicated to Professor Dr G. K. Constantinescu, founder of the modern animal husbandry science in Romania, originator of the National
 This book is dedicated to Professor Dr G. K. Constantinescu, founder of the modern animal husbandry science in Romania, originator of the National Animal Husbandry Institute (1926) and initiator of the
R/qtl workshop. (part 2) Karl Broman. Biostatistics and Medical Informatics University of Wisconsin Madison. kbroman.org
 Karl Broman. Biostatistics and Medical Informatics University of Wisconsin Madison. kbroman.org") R/qtl workshop (part 2) Karl Broman Biostatistics and Medical Informatics University of Wisconsin Madison kbroman.org github.com/kbroman @kwbroman Example Sugiyama et al. Genomics 71:70-77, 2001 250 male
R/qtl workshop (part 2) Karl Broman Biostatistics and Medical Informatics University of Wisconsin Madison kbroman.org github.com/kbroman @kwbroman Example Sugiyama et al. Genomics 71:70-77, 2001 250 male
Multi-environment GWAS and genomic prediction: penalized regression and mixed model approaches
 Multi-environment GWAS and genomic prediction: penalized regression and mixed model approaches Montpellier, 9 June 2015 Fred van Eeuwijk & Willem Kruijer Daniela Bustos Korts, Marcos Malosetti, & Martin
Learning Your Identity and Disease from Research Papers: Information Leaks in Genome-Wide Association Study
 Learning Your Identity and Disease from Research Papers: Information Leaks in Genome-Wide Association Study Rui Wang, Yong Li, XiaoFeng Wang, Haixu Tang and Xiaoyong Zhou Indiana University at Bloomington
FaST Linear Mixed Models for Genome-Wide Association Studies
 FaST Linear Mixed Models for Genome-Wide Association Studies Christoph Lippert 1-3, Jennifer Listgarten 1,3, Ying Liu 1, Carl M. Kadie 1, Robert I. Davidson 1, and David Heckerman 1,3 1 Microsoft Research
Mapping multiple QTL in experimental crosses
 Mapping multiple QTL in experimental crosses Karl W Broman Department of Biostatistics and Medical Informatics University of Wisconsin Madison www.biostat.wisc.edu/~kbroman [ Teaching Miscellaneous lectures]
Genetic analysis using the sommer package Giovanny Covarrubias-Pazaran
 Genetic analysis using the sommer package Giovanny Covarrubias-Pazaran 2016-05-06 The sommer package has been developed to provide R users with a powerful mixed model solver for different genetic and non-genetic
Lecture 5 Basic Designs for Estimation of Genetic Parameters
 Lecture 5 Basic Designs for Estimation of Genetic Parameters Bruce Walsh. jbwalsh@u.arizona.edu. University of Arizona. Notes from a short course taught June 006 at University of Aarhus The notes for this
Q1) Explain how background selection and genetic hitchhiking could explain the positive correlation between genetic diversity and recombination rate.
 Explain how background selection and genetic hitchhiking could explain the positive correlation between genetic diversity and recombination rate.") OEB 242 Exam Practice Problems Answer Key Q1) Explain how background selection and genetic hitchhiking could explain the positive correlation between genetic diversity and recombination rate. First, recall
OEB 242 Exam Practice Problems Answer Key Q1) Explain how background selection and genetic hitchhiking could explain the positive correlation between genetic diversity and recombination rate. First, recall
Regression: Lecture 2
 Regression: Lecture 2 Niels Richard Hansen April 26, 2012 Contents 1 Linear regression and least squares estimation 1 1.1 Distributional results................................ 3 2 Non-linear effects and
Elementary Aggregation Using the Country Product Dummy (CPD) Method
 Method") Chapter 23 Elementary Aggregation Using the Country Product Dummy (CPD) Method he country product dummy (CPD) regression has been used by the International Comparison Program (ICP) since the program was
Chapter 23 Elementary Aggregation Using the Country Product Dummy (CPD) Method he country product dummy (CPD) regression has been used by the International Comparison Program (ICP) since the program was
Probability of Detecting Disease-Associated SNPs in Case-Control Genome-Wide Association Studies
 Probability of Detecting Disease-Associated SNPs in Case-Control Genome-Wide Association Studies Ruth Pfeiffer, Ph.D. Mitchell Gail Biostatistics Branch Division of Cancer Epidemiology&Genetics National