Permeability Heterogeneity in Bioturbated Strata, Cardium Formation, Pembina Field, and the Identification of Potential Waterflood Opportunities
|
|
|
- Lizbeth Tyler
- 6 years ago
- Views:
Transcription
 University of British Columbia 2013 Thesis Submitted in Partial Fulfillment of the Requirements for the Degree of Master of Science in the Department of Earth Sciences Faculty of Science Oliver J.")
1 Permeability Heterogeneity in Bioturbated Strata, Cardium Formation, Pembina Field, and the Identification of Potential Waterflood Opportunities by Oliver J. Friesen B.Sc. (Hons.) University of British Columbia 2013 Thesis Submitted in Partial Fulfillment of the Requirements for the Degree of Master of Science in the Department of Earth Sciences Faculty of Science Oliver J. Friesen 2015 SIMON FRASER UNIVERSITY Summer 2015
2 Approval Name: Degree: Title: Examining Committee: Oliver J. Friesen Master of Science (Earth Sciences) Permeability Heterogeneity in Bioturbated Strata, Cardium Formation, Pembina Field, and the Identification of Potential Waterflood Opportunities Chair: Dr. Dirk Kirste, Associate Professor Dr. Shahin Dashtgard Senior Supervisor Associate Professor Dr. James A. MacEachern Supervisor Professor Dr. Dale Leckie External Examiner Adjunct Professor Department of Geoscience University of Calgary Date Defended/Approved: July 23, 2015 ii
3 Abstract Bioturbated sediments representing distal expressions of paralic depositional environments are increasingly being exploited for hydrocarbons in the super-giant Pembina Field (Cardium Formation), Alberta, Canada. These strata were previously considered unproductive due to limited vertical and horizontal connectivity between permeable beds. In these tight oil plays ( md), pressure decay profile permeametry data indicate that sand-filled burrows provide vertical permeable pathways between bioturbated and parallel laminated sandstone beds in the central, north-east and north-west parts of the field. This relationship enables the economic exploitation of hydrocarbons via horizontal drilling and multi-stage hydraulic fracturing. As the exploitation of bioturbated strata progresses in the Pembina Field, additional primary targets are being sought out, and horizontal waterflooding is being considered in areas where current horizontal wells exist. Proximal to historical produced conventional targets, reservoir analyses indicate that areas where the bioturbated facies average permeability lies between 0.35 md and 0.85 md and sandstone isopach thicknesses are between 0.25 m and 2.5 m should be targeted in east-central Pembina. iii
4 Acknowledgements Firstly I would like to thank Dr. Shahin Dashtgard for allowing me to take on this project and for his guidance and mentorship throughout the entire process. I would also like to extend a sincere thank you to Dr. James MacEachern for also providing me with mentorship and feedback throughout the process. Many thanks to my fellow SFU colleagues, and specifically those in the ARISE group including Andrew LaCroix, Korhan Aryanci, Kristyn Smith, Sean Borchert, Amy Hsieh, and Macy Jones who all helped me along during the process. I would also like to thank all of those at ARC Resources Ltd. who allowed me to undertake this project, and provided me with feedback and invaluable mentorship during this process. Finally I would like to thank the SFU Earth Sciences department support staff including Matt Plotnikoff, Rodney Arnold, Glenda Pauls and Tarja Vaisanen who were always available to help when I needed it. iv
5 Table of Contents Approval... ii Abstract... iii Acknowledgements... iv Table of Contents... v List of Tables... vii List of Figures... viii Chapter 1. Introduction Research Objectives Methods Study Area Cardium Stratigraphy History of Ideas Turbidity and Storm Rip-Currents Offshore Terrace Bars Stranded Shoreface Deposits Chapter Facies Descriptions Facies 1 (F1): Silty mudstone to shale with very fine-grained sand laminae Facies 2 (F2): Bioturbated sandy mudstone to muddy sandstone with thin sandstone beds Facies 3 (F3): Massive to bioturbated sandstone with thin mudstone and siltstone beds Facies 4 (F4): Unbioturbated, massive- to hummocky crossstratified sandstone Facies 5 (F5): Clast- and matrix-supported conglomerate Facies Associations Facies Association One (FA1): Sandying-upwards shelf/ramp to upper delta front (middle shoreface equivalent) deposits Facies Association Two (FA2): Conglomeratic Transgressive Deposits Cardium Type Logs Chapter 3. Permeability Heterogeneity in Bioturbated Strata, Cardium Formation, Pembina Field, and the Identification of Potential Waterflood Opportunities Introduction Stratigraphy and Paleogeography Study Area and Pembina Development History Methods Pressure Decay Profile Permeameter (PDPK) Analyses v
6 Permeability Calculations Contouring (using Golden Software Surfer ) Results Facies Facies Association One (FA1): Sandying upwards shelf/ramp to upper delta front (middle shoreface equivalent) deposits Facies Association Two (FA2): Transgressive Conglomerate Deposits PDPK Reservoir Characterization Mapping Reservoir Controls on Production PDPK Sandstone Isopach Bioturbated Facies K geometric Waterflooding and future exploitation potential in east-central Pembina Conclusions Chapter 4. Conclusions References Appendices...88 Appendix A: AppleCore Well Logs Appendix B: Well Compilation Data Appendix C: PDPK Analysis Data Appendix D: Horizontal Well Data vi
7 List of Tables Table 2.1: Facies summary Table 3.1: Facies summary vii
8 List of Figures Figure 1.1: Cardium Formation section... 5 Figure 1.2: Study area map... 6 Figure 1.3: Cardium fm stratigraphy... 8 Figure 1.4: Stott (1963) stratigraphic chart Figure 1.5: Cardium Formation Allostratigraphy Figure 1.6: Evolution of the E5 surface Figure 1.7: Carrot Creek conglomerate depositional model Figure 2.1: Examples of F Figure 2.2: Examples of F2a Figure 2.3: Examples of F2b Figure 2.4: Examples of F2c Figure 2.5: Examples of F Figure 2.6: Examples of F Figure 2.7: Examples of F Figure 2.8: Core litholog W Figure 2.9: Core litholog W Figure 2.10: Cardium type log legend Figure 3.1: Cardium Lithostratigraphy Figure 3.2: Paleogeography Figure 3.3: Study Area Figure 3.4: Facies core images Figure 3.5: Core litholog W Figure 3.6: Cardium type log legend Figure 3.7: PDPK measurement positions ( W5 & W5) Figure 3.8: PDPK versus facies plots Figure 3.9: Sandstone (F3, F4) sandstone isopach map Figure 3.10: Bioturbated facies (F2b, c) permeability map Figure 3.11: Bioturbated facies (F2b, c) isopach thickness map Figure 3.12: Bioturbated facies (F2b, c) versus monthly oil production (horizontal wells) Figure 3.13: Bioturbated facies permeability versus production bar graph viii
9 Figure 3.14: Final waterflood map ix
10 Chapter 1. Introduction The Cardium Formation of the Western Canada Sedimentary Basin (WCSB) comprises a terrigenous clastic wedge deposited along the western margin of the Western Interior Seaway during the Late Turonian and Coniacian (Krause et al., 1994; Plint et al., 1986; Walker, 1983b). The Cardium Formation has been studied for over 50 years since the discovery of significant hydrocarbon reserves, presently estimated to be approximately 10.6 billion barrels of oil originally in place (ERCB, June 2011). While many conventional oil pools in the Cardium Formation are past their peak production, the improvements in multi-stage fracturing techniques has led to the discovery of an additional 1 billion barrels of potential reserves, located mainly in the oil-charged halo of existing pools (Fig. 1; ; New Technology Magazine, 2011). Water flooding through horizontal wellbores is an enhance oil recovery (EOR) scheme that is presently being evaluated in the Pembina Field. This study provides an in depth analysis of permeability heterogeneities of the bioturbated facies in the central Pembina Field, with the intention of establishing how bioturbated reservoirs in the Cardium Formation might respond to waterflooding. The Cardium Formation records a complex depositional history involving tectonic and eustatically controlled changes in sea level that led to the formation of multiple allostratigraphic surfaces (Krause et al., 1994). Deposits of the Cardium Formation are mainly mudstone, sandstone, and conglomerate deposited in and along eastward prograding shoreline-to-shelf clinoforms (Krause et al., 1994). Early exploitation of the Pembina Field targeted high permeability shallow-marine sandstones and foreshore conglomerates through more than 4300 vertical wells (Nielsen, 1957; Parsons, 1955; Parsons and Nielsen, 1954). These wells were drilled between 1953 and 1980, and enhanced oil recovery schemes, including water flooding and infill drilling were implemented shortly after. In fact, in Canada the first use of EOR, horizontal wells, 1
11 and hydrocarbon-based miscible floods were undertaken in 1957 in the Cardium Formation, Pembina Field (Clarkson and Pedersen, 2011; Howes, 1988). Recent advancements in horizontal drilling and multistage hydraulic fracturing have led to a resurgence of interest in the Cardium Formation. New horizontal wells target the halo of the main Pembina Field (Clarkson and Pedersen, 2011), and many have proven to be successful. Three-month initial production (IP3) values for new horizontals are as high as 30,000 bbl oil (e.g., W5). Conversely, some wells have yielded disappointing results indicating that the controls on productivity within the halo are poorly understood. An in-depth analysis of permeability heterogeneities within the target area, including the evaluation of plug and whole core porosity/permeability data and high resolution pressure decay profile permeametry (PDPK) measurements can allow for better prediction of well performance. This analysis can also help predict how the bioturbated facies will respond to horizontal waterflooding schemes at Pembina, where a recent pilot program resulted in increased reservoir pressure and improved sweep efficiency (M. Tuhin, personal communication, August 18 th, 2014). The goal of this study is to use detailed core logging, core-permeability measurements, PDPK permeability, and production data to evaluate areas in east-central Pembina that comprise thick successions of bioturbated muddy sandstones that would respond favorably to horizontal waterflooding or should be targeted for additional horizontal well development Research Objectives The purpose of the research explained in this thesis is to answer the following questions and / or complete the following tasks: 1. Can bioturbated muddy sandstones and sandy mudstones be waterflooded effectively? Rank the best areas of east-central Pembina for waterflooding through horizontal wells. 2. What is the correlation between facies distributions, permeability-porosity characteristics of facies, and production? 3. Is there a correlation between plug and full diameter permeability data and PDPK results? 2
12 1.2. Methods Thirty-eight cores through the Cardium Formation at east-central Pembina were logged as part of this study (Appendix A). Cardium deposits were subdivided into informal flow units, based on the total overall visual sandstone/siltstone percentage (including all discrete beds, burrows, and interstitial grains). The stratigraphic interval of interest encompass the bioturbated sandy mudstones to muddy sandstones, with overall combined sandstone/siltstone content ranging from 30% to 80% (L. Schmitt, personal communication, May 12 th, 2014). This range was determined to contain the economically exploitable resources across Arc Resources Ltd. s land base in east-central Pembina. An additional 171 wells with geophysical well logs and porosity/permeability data were also selected from east-central Pembina to provide data to correlate cored intervals across the field (based on gamma ray cut off values), and to construct porosity/permeability and net-pay maps. The most recently drilled wells were selected preferentially, with preference given to wells with available gamma ray, resistivity, and neutron and density porosity log profiles. Selected wells also needed to have core-analysis data for reservoir intervals below the 30% combined sandstone/siltstone content in order to provide a consistent spread of data throughout the entire section of interest. The positions of core analyses measurements was determined by comparing depth of measurements to gamma curves and to nearby wells that have logged core. Once the 171 additional wells were selected, the core analysis data were compiled (Appendix B). Data pulled from AccuMap included the samples upper and lower depths, upper and lower formation depths, sample thicknesses, K max values and porosity values. Of the 38 Cardium Formation cores, 11 wells were selected for Pressure Decay Profile Permeameter (PDPK) analysis (Appendix C). When selecting core for PDPK analysis, preference was given to: 1) cores that preserve the greatest thickness of section between the upper Cardium Formation marker to the underlying Blackstone Formation (Fig. 1.1), with preference given to cores that penetrate the unconventional bioturbated sandy mudstones; 2) cores that have good quality well-log data, core analyses, and 3
. Sample lengths ranged from 6 25 cm.")
13 production information; 3) cores that are equally spaced across the study area; and, 4) the best quality cores that are at least 7.5 cm in diameter. From the 11 wells, 44 samples were taken (4 samples taken from each well). Sample lengths ranged from 6 25 cm. From the 44 samples, permeability measurements were taken from 11 to 23 points per sample (dependent on the lithological heterogeneities within the samples and sample length) for a total of 758 points. Sample locations from each slab were carefully chosen to ensure measurements were taken across the range of lithologies in the sample, including sandstone/siltstone filled burrows and laminae/beds, and mudstone/siltstone matrix. 4
14 Figure 1.1: Cardium Formation section Core log position and associated gamma-ray log for the Cardium Formation (00/ W5). Cores that preserved the thickest section from underlying Blackstone Formation to upper Cardium reflector were selected. Blackstone and Cardium formation picks from AccuMap. Samples selected for micropermeability measurements were slabbed and micropermeability measurements were performed at Corelab in Calgary, Alberta, using a PDPK-400. Cut samples were lightly sandblasted to ensure a good seal between the slabbed surface and the O-ring attached to the PDPK-400 probe tip (0.4 cm diameter). Following sandblasting, samples were cleaned with a toluene solution to chemically remove any mobile hydrocarbons, and then placed in an oven to allow the sample to dry fully. After drying the samples, permeability measurements were acquired. For each measurement a good seal between the O-ring and the rock was required, and this was ensured using acetone. With an air-tight seal established, gas was allowed to flow from the PDPK-400 into the core at a 70 kpa initial upstream flow pressure. The decay of the initial pressure was measured against time, and the collected data were corrected for Klinkenberg-slippage effects. This accounts for the fact that gas molecules injected into the sample move through the pore throat center and edge at the same speed (whereas in liquids do not). Correction of the data yields Klinkenberg-corrected, liquid-equivalent permeabilities measured in microdarcies Study Area This research project focuses on the Cardium Formation within the east-central Pembina Field (Township 47 50; Range 4 9W5) of Alberta (Fig. 1.2). The study area covers a total area of 1500 km 2 and the majority of the land base is presently either wholly or partially owned by Arc Resources Ltd. As of October 2014, 2527 vertical wells and 374 horizontal wells had been drilled across the study area. The vertical and horizontal wells have an abundance of core, core analyses, and production data, which were imperative for the undertaking this study. 5
15 Figure 1.2: Study area map Maps showing: (A) the location of the Pembina Field on a paleogeography map of the Cardium Formation in Alberta, Canada (after Krause et al., 1994): (B) the location of the study area within the Pembina Field; and (C) the location of logged cores (yellow stars) and logged cores which were also analyzed for micropermeability measurements (green stars). 6
16 1.4. Cardium Stratigraphy The Upper Cretaceous Cardium Formation grades upwards from marine shales of the Blackstone Formation, and passes upwards gradually into marine shales of the overlying Wapiabi Formation (Fig 1.3; Krause et al., 1994). Outcrops of the Cardium Formation have been studied in the north and south-central mountains and foothills of Alberta, wherein the progradational edge of the Musreau and Kawka members are exposed (Duke, 1985; Plint et al., 1988). In the subsurface, the Cardium Formation extends below much of western Alberta, and as far south as the Sweetgrass Arch in northern Montana, USA (Cobban et al., 1959). The Cardium Formation is part of the up to 1200 m thick Colorado Group, which is a regionally extensive succession consisting predominantly of shale that extends across the WCSB (Bloch et al., 1993). The Colorado Group is a dominantly eastward-tapering marine shale package that contains at least three sandstone-dominated units: the Basal Colorado, Viking Formation, and Cardium Formation (Bloch et al., 1993). 7
17 Figure 1.3: Cardium fm stratigraphy Chronostratigraphic and lithostratigraphic breakdown of the Central Plains of Alberta from the Lower to Upper Cretaceous ( Ma). The Cardium Formation (red rectangle on diagram) is part of the Colorado Group and overlies the Blackstone Formation and underlies the Wapiabi Formation. (ERCB, 2013) 8
18 One of the earliest lithostratigraphic frameworks for the Cardium Formation was proposed by Stott (1963). Stott defined six members named the Ram, Kiska, Cardinal, Leyland, Sturrock and Moosehound (Fig. 1.4). These members encompass either major coarsening-upward successions separated by erosional surfaces (Ram, Kiska, Cardinal, Leyland, Sturrock members), or continental deposits (Moosehound Member) visible in outcrops in the Rocky Mountain Foothills (Stott, 1963). The Cardium Formation lithostratigraphic nomenclature was re-evaluated multiple times since Stott s (1963) work, and many studies proposed formal divisions developed for specific Cardium fields. For example, formal names for stratigraphic intervals in the Cardium Formation were proposed by Walker (1983b, c) for Garrington-Caroline-Ricinus, by Krause and Nelson (1984) for Pembina, and by Walker (1985) for Ricinus. Krause and Nelson (1984) attempted to simplify the Pembina Field terminology by proposing that the Cardium Formation be broken into two lithostratigraphic units representing the reservoir and overlying seal, termed the Pembina River Member and Cardium Zone Member, respectively. Plint et al. (1986) pointed out that Krause and Nelson s (1984) member terminology did not follow the standards of the North American Commission on Stratigraphic Nomenclature (NACSN), which does not allow the same name to be used for the formation and member (Cardium Formation & Cardium Zone Member); consequently, the names proposed by Krause and Nelson (1984) were abandoned. 9
19 Figure 1.4: Stott (1963) stratigraphic chart Stratigraphic chart showing the original terminology proposed by Stott (1963) developed from outcrop studies in the Rocky Mountain Foothills. The Moosehound Member represents the continental equivalents of the marginal-marine Leyland, Cardinal, and Kiska members. One shortfall of the early stratigraphic terminology was the assumption that mudstone, sandstone, and conglomeratic intervals within the Cardium Formation were directly correlative as member boundaries therefore resembling a layer cake geometry (Plint et al., 1986). Duke s (1985) outcrop study was the first to recognize that such a layercake stratigraphy was not accurate, recognizing multiple intertonguing marine and nonmarine sequences that make up the Cardium Formation. The Plint et al (1986) proposed stratigraphic framework was built on the outcrop work done by Duke (1985) and included detailed subsurface analysis utilizing over 800 cores and 3000 well logs (Fig. 1.5). The resulting allostratigraphic framework showcased the complexity of the Cardium Formation 10
20 and resulted in the definition of formal members separated by falling stage/lowstand erosional (E) and transgressive erosive (T) surfaces. In total, seven falling stage/lowstand (E1 E7) and transgressive erosive surfaces were identified (TI T7; Fig. 1.5). These surfaces were interpreted to be regionally extensive, and therefore represented chronostratigraphic surfaces. Each falling stage/lowstand erosional surface was paired with a corresponding transgressive surface, as erosion was controlled by allogenic changes in sea level. Within this allostratigraphic framework, Plint et al. (1986) and Plint and Walker (1987) broke the Cardium Formation into twelve members that represented coarsening-upward sequences. Included in this framework were the Burnstick and Raven River members proposed by Walker (1983c). The 12 members represent deposition in three unique sedimentary environments. The conglomeratic sequences were interpreted to have been deposited as roughly shoreline parallel bodies within lowstand or falling stage shorelines, and the coarsening-upward mudstone to sandstone sequences were deposited within a laterally prograding shoreface, or vertically aggrading shelf (Plint et al., 1986; Wadsworth and Walker, 1991; Walker and Eyles, 1991). Another change to the Cardium Formation stratigraphic framework proposed by Plint et al. (1986) was moving the base of the Cardium Formation to the E1 surface, such that the upper portion of the Blackstone Formation be included in the Cardium fm, as the stratigraphic equivalent of the Kawka Member. 11
21 Figure 1.5: Cardium Formation Allostratigraphy Proposed allostratigraphic framework for the Cardium Formation proposed by Plint et al. (1986) which is based on outcrop work by Duke (1985). Diagram shows bounding falling stage/lowstand erosional (E) and transgressive erosive (T) surfaces (amalgamated surface where E and T intersect). The red rectangle marks the stratigraphic interval investigated herein. The member names in capital letters are those used for this study and proposed by Plint et al. (1986), and the member names in lower case letters were proposed by Krause & Nelson (1984). 12
22 The most well studied falling stage/lowstand erosional surface, first introduced by Plint et al. (1986), is the E5 surface. The E5 surface incised into the thickest succession of shallow marine sandstones within the Pembina Field (Bergman and Walker, 1988; Leggitt et al., 1990; Wadsworth and Walker, 1991; Walker and Eyles, 1991). Based on the apparent absence of the P. novimexicanus Ammonite zone across the E5 surface, the vertical transition from shallow marine sandstones into conglomerates is interpreted to represent missing time caused by subaerial exposure and transgression (Braunberger and Hall, 2001a, b; Hall et al., 1994; Krause et al., 1994; Walker and Eyles, 1991). A series of sub-parallel, NW-SE trending erosional troughs with as much as 20 m of relief were created during lowstand and transgression of the E5 T5 amalgamated surface (Fig. 1.6; Bergman and Walker, 1988; Leggitt et al., 1990; Wadsworth and Walker, 1991; Walker and Eyles, 1991). The erosional topography with multiple highs and lows is interpreted to have been incised during step-wise marine transgression, and hence the orientation of paleo-shoreline is parallel to the depositional axis of conglomeratic deposits within the Cardium Formation (Bergman and Walker, 1988; Leggitt et al., 1990; Walker and Eyles, 1991). Owing to the clarity that Plint et al. (1986) s allostratigraphic framework brought to the Cardium Formation, most subsequent workers have adopted it. Additional surfaces were later identified including the E6.5 surface by Walker & Eyles (1988), and the E5.2 and E5.5 surfaces by Shank (2012) which onlap north-westward onto the E5 surface. 13
23 Figure 1.6: Evolution of the E5 surface Sequential depositional diagram showing the proposed formation and preservation of steps present along the E5 surface. A) Normal marine deposition ranging from offshore mudstones to shallow marine sandstones. B) Shoreline regression partially controlled by SE tectonic uplift, creating sanding upward sequences and eventually causing subaeriel exposure of previously inundated paralic deposits. In this paper it was argued that transgression eroded the evidence of continental deposits, which could have been created during subaerial exposure. C) Subsequent step-wise marine transgression leading to shoreline-parallel steps being cut via wave ravinement which controlled the distribution of coarse clastics above the E5 surface (from Leggit and Walker (1990). 14
24 1.5. History of Ideas The depositional history of the Cardium Formation, particularly its oil-bearing sandstones and conglomerates, has been debated for more than 50 years (Beach, 1955; DeWiel, 1956; Plint and Walker, 1987; Plint et al., 1986; Walker, 1983a, c). There are three main hypotheses for the origin and depositional history of Cardium Formation sandstones and conglomerates Turbidity and Storm Rip-Currents Beach (1955) proposed a turbidity-current source for the coarse clastics (sand and gravel) of the Cardium Formation. His theory was based on the fact that the extreme lateral continuity of the coarse clastics within an offshore position was inconsistent with pelagic sedimentation. Beach (1955) believed that the coarse sands to pebbles were delivered to an offshore position by gravity driven turbidity currents. This idea was expanded upon by Walker (1983a, c), who drew on observations of the unit s sedimentary structures to support an argument for turbidity currents within the Western Interior Seaway at the time of Cardium deposition. His evidence included the sharp erosional bases of the conglomerates, which he claimed displayed vertical transitions from upper flow regime (e.g. parallel-lamination) to lower flow regime bedforms (e.g. ripple cross laminations) which are consistent with waning energy conditions in turbidity flows (Walker, 1983c). Wright and Walker (1981) took a numerical approach to explain the emplacement of sands and gravels several kilometers from the paleo-coastline. Based on their results, they proposed a model involving basin-oriented storm-induced rip-currents. The Wright and Walker (1981) argument hinged on the observation of hummocky cross-stratified (HCS) sandstones in the Cardium Formation, which they believed were created by the same long-period storm-generated density currents that transported the sediments below fair-weather wave base. By assuming a 1.60 m/s bedload transport of sand and gravel by offshore-directed storm-generated rip currents, it was concluded that it would take roughly 200 days of consistent storm conditions to emplace 1 cm diameter gravels into a position 16 km offshore (Wright and Walker, 1981). These calculations were ultimately used to 15
25 support the turbidity current model, as sand and gravel could be transported to the same deposition site in only 3.9 hours if entrained in a high-density turbidity current (Walker, 1983c) Offshore Terrace Bars A second depositional model for the Cardium Formation, first proposed by Swagor (1976) and later supported by Griffith (1982) and Nielsen and Porter (1984), interpreted the sandstones and conglomerates of the Cardium as offshore terrace bars. Swagor s (1976) main argument supporting offshore terrace bars was the orientation of the conglomeratic deposits, which in most areas are parallel or sub-parallel to the inferred paleo-shoreline. This orientation was believed to be inconsistent with an offshore-directed delivery mechanism such as tidal, fluvial or turbidity currents (Nielsen and Porter, 1984; Swagor et al., 1976). The slope break, which was interpreted to exist across the basin, would have concentrated the sand and gravels and these sediments would subsequently be transported basinward by storm currents forming shoreline-parallel linear ridges (Griffith et al., 1982; Nielsen and Porter, 1984; Swagor et al., 1976). However, stormgenerated rip-currents were needed to explain the formation of offshore-terrace bars, and (based on unrealistic storm duration), this was discarded as a viable mechanism in favour of the turbidity current model (Wright and Walker, 1981) Stranded Shoreface Deposits Plint et al. (1986) gave support to a hypothesis presented by DeWeil (1956) that proposed the Cardium Formation represents multiple regressions of the shoreline during the Turonian to Coniacian. E1 E7, which were initially thought to represent scouring of underlying sediments by turbidity currents, were reinterpreted to have formed by wave and wind erosion during lowstand conditions (Plint et al., 1986). This placed the deposition of sandstones in a lower to middle shoreface setting, and conglomerates in an upper shoreface to foreshore environment (Plint et al., 1986). At each surface, the paleoshoreline was forced seaward during the lowstand systems tract, with gravel and sand from Carrot Creek being introduced to the paralic realm via river mouth gravel bars, or small coarse clastic deltas (Fig. 1.7; Arnott, 1992, 2003; Wadsworth and Walker, 1991). The fluvially sourced sands and gravels were then redistributed alongshore by wave- 16
26 generated currents during transgression, which lead to the deposition of the shorelineoriented gravel bars found in the Cardium Formation (Arnott, 1992, 2003; Bergman and Walker, 1987, 1988). Figure 1.7: Carrot Creek conglomerate depositional model Conceptual diagram showing the orientation and distribution of Carrot Creek conglomerates within the Western Interior Seaway. Coarse clastics were supplied by the Carrot pale-oriver (which has been vertically exaggerated) into the paralic realm. Southeast directed, wave-generated paleocurrents redestributed the sands and pebbles into shoreline oriented ridges, and some of the conglomerates were preserved in locally incised bevels on top of the E5 surface (scoured during lowstand) (Bergman and Walker, 1988). 17
27 Chapter Facies Descriptions Five main facies have been described, based on the detailed analysis of 38 Cardium Formation cores (Table 2.1). Facies were defined mainly by the combined siltstone/sandstone content, physical sedimentary structures and ichnology. Bioturbation intensities were semi-quantified using the Bioturbation Index (BI), described originally by Reineck (1963) and modified by Taylor and Goldring (1993). This scale is based on grades of bioturbation that can be discerned with the human eye. The Bioturbation Index has seven grades that range from no visible bioturbation (BI 0) to completely bioturbated (BI 6). 18
28 Facies Facies 1: Dark grey- to black silty mudstone to shale with very finegrained sandstone laminae Facies 2: Dark grey bioturbated sandy mudstone to muddy sandstone Facies 3: Massive to bioturbated sandstone with parallel and wavy shale beds Facies 4: Apparently structureless to HCS sandstone Facies 5: Clast- to matrix-supported conglomerate Percent Sandstone/ Siltstone 0 10% 2a 10 30% 2b 30 50% 2c 50 80% 5a 5b % Grain Size Sedimentology Ichnology shale with up to 10% vfg sand inter beds fg sandstone with up to 50% shale inter beds % vfg - fg 0 50% sand matrix 0 50% mud matrix sand matrix with cg sand to cobble clasts Sst/Slst: discontinuous-, paralleland wave-ripple laminated sand beds. Sh: wavy laminae Sst/Slst: HCS, wave-, inclined parallel-, combined flow- and current-ripple laminated sandstones. Sh: wavy laminae and beds Sst/Slst: HCS, wave ripple, inclined parallel, combined flow and current ripple laminated sandstones. Sh: wavy laminae Ch, He, Pa, Ph, Pl, Sc, Sk As, Ch, Cy, Di, Ph, Pl, Sk, Te, Th, Tr, Zo BI (0 6) Average Permeability Average (geometric Porosity mean) Depositional Environment 0 3 N/A N/A shelf/ramp shale with up to 30% Sst/Slst: discontinuous-, parallel- 1 3 lower offshore slst - fg sst, inclined- and wave-ripple As, Ch, Cy, Di, shale with up to 50% laminated, mudstone rip-up Gy, He, Pa, Ph, lower to upper % slst - fg sst clasts, HCS, lenticular bedding md Pl, Rh, Ro, Sc, Sk, offshore Sh: wavy laminae shale with up to 80% Te, Th, Tr, Zo slst - fg sst 2 6 upper offshore mud matrix with cg sand to cobble clasts 0 3 N/A md parallel and inclined laminae Ch, Pl, Ph, Th md 16.40% 7.30% lower delta front (lower shoreface equivalent) lower to upper delta front (middle shoreface equivalent) upper shoreface to foreshore Contacts L = gradational; U = gradational L= gradational; U = gradational, erosional, FS L = gradational, erosional, FS; U = gradational, erosional L = gradational, erosional; U = erosional L = erosional; U= sharp, gradational Table 2.1: Facies summary Summary of five facies identified in east-central Pembina. Sedimentological abbreviations: very fine-grained (vfg), fine-grained (fg), siltstone (slst), sandstone (sst), shale (sh), hummocky cross-stratification (HCS). Trace fossil abbreviations: Asterosoma (As), Chondrites (Ch), Cylindrichnus (Cy), Diplocraterion (Di), Helminthoida (He), Palaeophycus (Pa), Phycosiphon (Ph), Planolites (Pl), Rhizocorallium (Rh), Rosselia (Ro), Scolicia (Sc), Skolithos (Sk), Teichichnus (Te), Thalassinoides (Th), Trichichnus (Tr), Zoophycos (Zo). Bioturbation Index values based on Reineck (1963) and modified by Taylor and Goldring (1993). 19
29 Facies 1 (F1): Silty mudstone to shale with very fine-grained sand laminae Facies 1 comprises weakly to moderately bioturbated (BI 0 3), silty to sandy shale with rare (0 5%) mm- to cm-scale, very fine-grained sandstone to siltstone beds (Fig. 2.1). The combined sand/silt content is less than 10%. Discrete sandstone beds are commonly normally graded, sharp-based, and contain discontinuous parallel- to wave-ripple laminae (Fig. 2.1A). Coarse sandstone beds and large granules are rare (0 3%), and are organized into poorly defined pebble horizons that increase in abundance in proximity to Facies 5 (Fig. 2.1B). Nodular siderite is found throughout. Burrows are generally diminutive (<2 mm diameter) in size, and the overall trace fossil diversity is low to moderate. Identified traces include Chondrites, Helminthoida, Palaeophycus, Phycosiphon, Planolites, Skolithos, and lesser Schaubcylindrichnus. Inoceramid and belemnite fragments are rare throughout. Facies 1 Interpretation: The silty mudstones of Facies 1 are interpreted to have been deposited at or slightly below effective storm wave base on the shelf / ramp of the Western Interior Seaway. Within this environment mud is deposited mainly under low-energy ambient weather conditions, and silt- to sand-sized grains are transported and deposited during and immediately following storm surges either by wave-orbital motion or via offshore-directed storm-induced currents (Plint and Macquaker, 2013; Plint et al., 2012). The scoured bases and rare wave-generated sedimentary structures in these sandstone tempestites of F1 are consistent with this interpretation. F1 is weakly to moderately bioturbated (BI 1-3) and the trace-fossil suite is typical of the Zoophycos Ichnofacies (MacEachern et al., 2010). The low to moderate bioturbation intensity and small diameters of trace fossils reflect infaunal responses to physical-chemical stresses in the depositional environment; likely reduced oxygen levels (Dashtgard et al., in press; MacEachern et al., 2010). In contrast, bioturbation is absent to weak in individual silty to sandy tempestites and is typical of top-down colonization by opportunistic fauna following high energy emplacement of event beds (Vossler and Pemberton, 1988a). Coarse sands and pebbles are only found in F1 where it overlies F5 (Fig. 2.1B). The coarse clastics are interpreted to be tempestites sourced from the laterally adjacent, gravelbearing shoreline, wherein the gravel is carried offshore by storm waves. 20
 Weakly bioturbated (BI 0 3) laminated silty mudstone with 5 10% siltstone/sandstone content and rare siderite (SID) concretions.")
30 Figure 2.1: Examples of F1 Core photographs of Facies 1: Silty mudstone to shale with very fine-grained sandstone laminae. A) Weakly bioturbated (BI 0 3) laminated silty mudstone with 5 10% siltstone/sandstone content and rare siderite (SID) concretions. The bases of discontinuous sandstone tempestites are marked with yellow arrows ( W5, m). B) Mudstone of F1 overlying conglomerate of F5. The mudstone contains 5% scattered coarse-grained sand to pebbles, and fine-grained sandstone to siltstone beds are not evident. The conglomerate bed at the top of the photo is 4 cm thick and occurs within F1 ( W5, m). Trace fossil abbreviations: Asterosoma (As), Chondrites (Ch), Phycosiphon (Ph), Planolites (Pl), and Skolithos (Sk). 21
31 Facies 2 (F2): Bioturbated sandy mudstone to muddy sandstone with thin sandstone beds content. Facies 2 is subdivided into 3 subfacies based on the combined siltstone and sandstone Facies 2a (F2a): Sandy mudstone with 10 30% siltstone/sandstone content Facies 2a comprises weakly to moderately bioturbated (BI 0 3) silty to sandy mudstone with rare (5 10%) mm- to cm-scale, very fine- to fine-grained sandstone beds. The combined sand/silt content ranges from 10 30%. Siltstone and sandstone is contained either within graded beds in weakly bioturbated (BI 0 1) sediments, or as interstitial grains distributed in moderately bioturbated intervals (BI 2 3). Sedimentary structures in sandstone beds include wave ripples with lesser parallel lamination. Sandstone beds commonly have scoured bases, with mudstone rip-up clasts, and are graded. Black shale beds and laminae are found throughout and are discontinuous, wavy-parallel to wavy non-parallel laminated (Fig. 2.2). Medium- to coarse-grained sand in F2a are present as floating grains or as weakly defined sandstone lenses (Fig. 2.2A). Burrows are generally diminutive in size (< 2 mm diameter) and the overall trace fossil diversity is low to moderate (eleven distinct forms encountered). The commonly observed trace assemblage includes Asterosoma, Chondrites, Helminthoida, Phycosiphon, Planolites, Rhizocorallium, Schaubcylindrichnus, Scolicia, Teichichnus, Trichichnus, and Zoophycos. Nodular siderite is found throughout. Pyrite is rare throughout and is present either as scattered round nodules or occurs in nodular micritic siderite concretions (cm-scale). 22
 Moderately to intensely bioturbated (BI 2 5) sandy/silty mudstone (15% sand/silt content) with 2% floating coarse-grained sand grains (CS).")
32 Figure 2.2: Examples of F2a Core photographs of Facies 2a: bioturbated sandy mudstone. A) Moderately to intensely bioturbated (BI 2 5) sandy/silty mudstone (15% sand/silt content) with 2% floating coarse-grained sand grains (CS). Silt/sand content is manifest as discontinuous beds and laminae. Yellow arrows mark bases of discontinuous tempestites and red arrows mark bases of wavy shale laminae ( W5, m). B) Weakly to intensely bioturbated (BI 1 6) sandy/silty mudstone (30% sand/silt content). Sandstone/siltstone is contained in laterally discontinuous tempestites and in burrow fills ( W5, m). Trace fossil abbreviations: Asterosoma (As), Phycosiphon (Ph), Planolites (Pl), Rosselia (Ro), and Thalassinoides (Th). Facies 2b (F2b): Sandy mudstone 30 50% siltstone/sandstone content Facies 2b comprises weakly to moderately bioturbated (BI 1 4) silty to sandy mudstone with rare to moderate (5 25%) cm-scale, fine- to very fine-grained sandstone beds. The combined sand/silt content ranges from 30 50%. Siltstone and sandstone is distributed either in weakly to moderately bioturbated discrete graded beds (BI 1 3) or as interstitial grains mottled by bioturbation (BI 3 4). Sedimentary structures in sandstone beds include planar- and wave ripple- 23
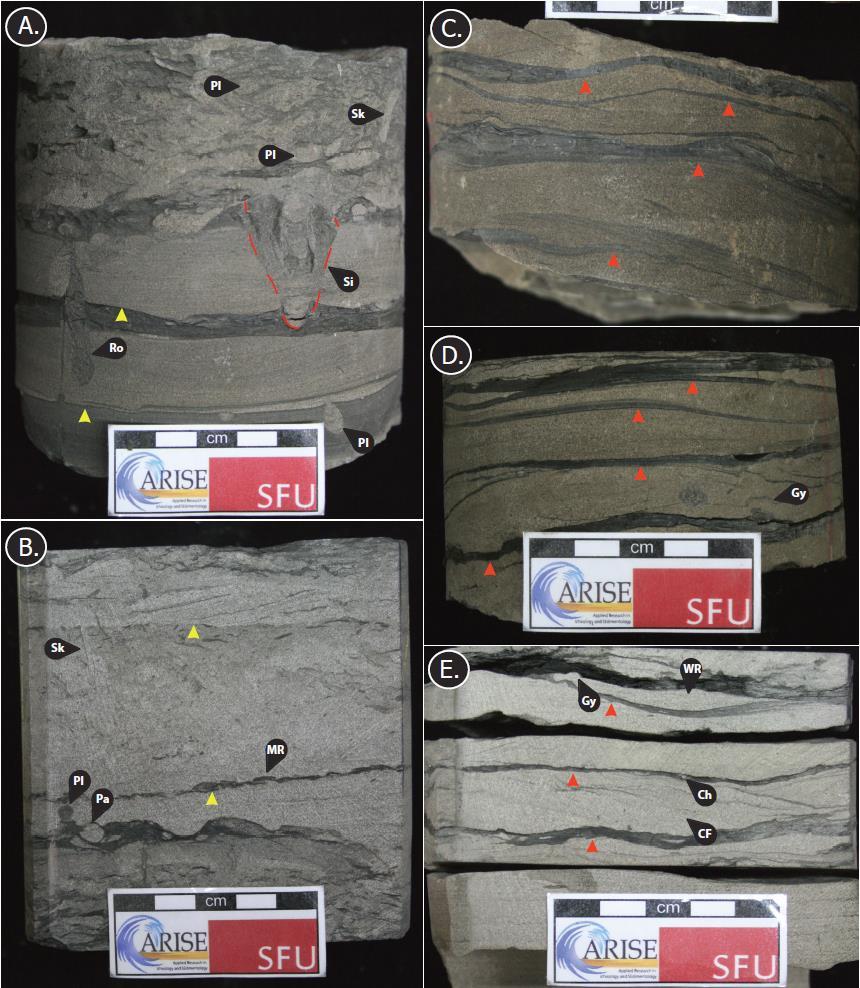
33 laminae, wavy-parallel, hummocky cross-stratification, and lenticular bedding (Fig. 2.3A). Locally, sandstones may appear structureless. Sandstone beds commonly have scour bases with mudstone rip-up clasts, and are normally graded (Fig. 2.3A). Black shale beds and laminae occur throughout and are discontinuous, wavy-parallel to wavy non-parallel (Fig. 2.3). Medium- to coarse-grained sand is rare and occurs as floating grains or as weakly defined lenses, typically in close stratigraphic proximity to facies contacts. Burrows are generally diminutive (< 2 mm diameter) to moderate (2 8 mm diameter) in size, and the overall trace-fossil diversity is 12 (Seilacher, 1974). Chondrites, Cylindrichnus, Diplocraterion, Helminthoida, Palaeophycus, Phycosiphon, Planolites, Schaubcylindrichnus, Skolithos, Teichichnus, Trichichnus, and Zoophycos are commonly observed. Nodular siderite is common within F2b. Pyrite is rare throughout and occurs in nodular micritic siderite concretions (cm-scale). 24
 Weakly to moderately bioturbated (BI 1 4) sandy mudstone (50% combined sand/silt content) with a 4.")
34 Figure 2.3: Examples of F2b Core photographs of Facies 2b: Bioturbated sandy mudstone to muddy sandstone. A) Weakly to moderately bioturbated (BI 1 4) sandy mudstone (50% combined sand/silt content) with a 4.5 cm thick wavy-parallel (WP) laminated sandstone tempestite with a scoured base and a mudstone rip-up clast (MR; base of tempestites marked with yellow arrow). Base of wavy shale laminae marked with red arrow ( W5, m). B) Moderately to intensely bioturbated (BI 3 5) sandy mudstone (40% total sand content; W5, m). C) Moderately bioturbated (BI 4 5) sandy mudstone (45% total sand content; W5, m). Trace fossil abbreviations: Chondrites (Ch), Phycosiphon (Ph), Planolites (Pl), Rhizocorallium (Rh), Rosselia (Ro), Schaubcylindrichnus (Sc), Skolithos (Sk), Teichichnus (Te), Thalassinoides (Th), and Trichichnus (Tr). Facies 2c (F2c): Muddy sandstones with 50 80% siltstone/sandstone content Facies 2c comprises moderately to intensely bioturbated (BI 3 5) muddy sandstones with moderate to abundant (10 35%) cm-scale, fine- to very fine-grained sandstone beds. The combined sand/silt content ranges from 50 80%. Siltstone and sandstone units display weakly to moderately bioturbated, discrete graded beds (BI 1 3) or show interstitial grains mottled by 25
35 bioturbation (BI 3 5). Sedimentary structures in sandstone beds include planar-, inclined- and wave-ripple laminae, hummocky cross-stratification, and lesser lenticular bedding that is rarely preserved due to high intensities of bioturbation (Fig. 2.4C). Sandstone beds commonly have scoured bases with mudstone rip-up clasts (Fig. 2.4D), are commonly normally graded, and are bioturbated towards the top of the bed. Black shale beds and laminae occur throughout and are discontinuous, or wavy-parallel to wavy non-parallel laminated (Fig. 2.4). Rare medium- and coarse-grained sands are rare throughout and are present as floating grains or as weakly defined pebble lenses. Burrows in Facies 2c range from diminutive (<2 mm diameter) to robust (>8 mm diameter) in size. The overall trace-fossil diversity is 16. The trace assemblage includes Chondrites, Cylindrichnus, Diplocraterion, Helminthoida, Palaeophycus, Phycosiphon, Planolites, Schaubcylindrichnus, Skolithos, Teichichnus, Trichichnus, and Zoophycos. Asterosoma, Rosselia, Rhizocorallium, and Thalassinoides also occur rarely in this facies. Pyrite is rare throughout, and occurs in nodular siderite concretions (cm-scale). 26
 Moderately to intensely bioturbated (BI 3 5) muddy sandstone (50% combined siltstone/sandstone content). Bases of wavy shale beds are marked with red arrows (03-07-048-08W5, 1652.3 m).")
36 Figure 2.4: Examples of F2c Core photographs of Facies 2c: Moderately to intensely bioturbated sandy mudstone to muddy sandstone. A) Moderately to intensely bioturbated (BI 3 5) muddy sandstone (50% combined siltstone/sandstone content). Bases of wavy shale beds are marked with red arrows ( W5, m). B) Moderately to intensely bioturbated (BI 2 6) muddy sandstone (65% combined siltstone/sandstone content). Bases of discontinuous tempestites are marked with a yellow arrow ( W5, m). C) Weakly to moderately bioturbated (BI 1 4) muddy sandstone (75% combined siltstone/sandstone content). This sample also has a cm-scale wave-ripple (WR) laminated tempestite ( W5, m). D) Weakly to intensely bioturbated (BI 1 5) muddy sandstone (70% combined siltstone/sandstone content) ( W5, m). Trace fossil abbreviations: Asterosoma (As), Chondrites (Ch), Cylindrichnus (Cy), Helminthoida (He), Phycosiphon (Ph), Planolites (Pl), Rosselia (Ro), Schaubcylindrichnus (Sc), Siphonichnus (Si) red outline, Skolithos (Sk), Thalassinoides (Th), Trichichnus (Tr), and Zoophycos (Zo). 27
37 Facies 2 Interpretation: The bioturbated sandy mudstones to muddy sandstones of facies 2a are interpreted to have been deposited at or just above effective storm wave base in a lower offshore environment. Facies 2b is interpreted to have been deposited above effective storm wave base, and below fairweather wave base in a lower to upper offshore environment. Facies 2c is interpreted to have been deposited below fair-weather wave base in an upper offshore environment. Within these environments, mud is deposited mainly under low-energy ambient conditions or by hyperpycnal plumes initiated during the waning stages of a storm surge resultant from the increase in overland precipitation and subsequent increased river sediment supply; and the silt- to sand-sized grains are likely transported and deposited during and immediately following storm surges either by wave-orbital motion or via offshore-directed storm-induced currents (Mulder and Syvitski, 1995; Plint and Macquaker, 2013; Plint et al., 2012). The scoured base, and wave-generated sedimentary structures present within the sandstone deposits in F2 is consistent with this interpretation. An overall increase in the sandstone/siltstone fraction from F1 to F2 indicates that deposition occurred in progressively shallowing water depths, initiated by normal regression (Plint et al., 1986). The bioturbation intensity, diversity and trace fossil sizes vary between the F2 subfacies.1) F2a is weakly to moderately bioturbated and the trace-fossil suite is typical of the Cruziana and Zoophycos Ichnofacies (MacEachern et al., 2010). The low to moderate bioturbation intensity and small diameters of trace fossils within F2a are a manifestation of animal growth in a physicochemically stressed environment. In this case, low oxygen levels likely limit animal size (Dashtgard et al., in press; MacEachern et al., 2010). Bioturbation is absent to weak within individual sandstone tempestites, and tempestites increase in thickness and frequency from F1 to F2a. F2b is moderately to intensely bioturbated, and the trace-fossil suite is typical of the Cruziana Ichnofacies (MacEachern et al., 2010). The bioturbation intensities and moderate trace fossil diameters within F2b are indicative of limited physico-chemically stresses within this depositional environment (MacEachern et al., 2010). Bioturbation is absent to weak within individual sandy tempestites, which increase in thickness and recurrence from F2a to F2b. 3) F2c is moderately to intensely bioturbated, and the trace-fossil suite is typical of the Cruziana Ichnofacies (MacEachern et al., 2010). The high bioturbation intensity and moderate to large trace fossil diameters (Fig. 2.4A; Fig. 2.4D) within F2c are indicative of a depositional environment with minimal physico-chemical stresses (Dashtgard et al., in press; MacEachern et al., 2010). Bioturbation is absent to weak within individual sandstone storm deposits which increase in thickness and frequency from F2b to F2c. The nature of bioturbation within individual tempestites 28
38 in F2 is typical of top-down colonization by opportunistic fauna (Pemberton and MacEachern, 1997; Vossler and Pemberton, 1988b) The coarse-grained sands and pebbles found in F2 are interpreted to be tempestites sourced from the laterally adjacent shallow-marine environments that contain gravel, wherein the gravel is carried offshore by storm waves (e.g., Fig. 2.2A) Facies 3 (F3): Massive to bioturbated sandstone with thin mudstone and siltstone beds Facies 3 comprises structureless to weakly bioturbated (BI 0 2) muddy sandstone to sandstone, with absent to abundant (0 50%) mm- to cm-scale mudstone beds (locally up to 80% wavy-bedded shale). The shale beds commonly have scoured bases and are either undulatory-, wavy non-parallel, or planar-laminated (Fig. 2.5). The sandstones are locally massive to hummocky cross-stratified or wave-ripple laminated. Other sedimentary structures include inclined and parallel, combined-flow and current ripple-laminae that are commonly demarcated by carbonaceous detritus (Fig. 2.5D). Sandstones commonly contain mudstone rip-up clasts and nodular siderite (Fig. 2.5B). Pyrite is rare throughout, and occurs in nodular micritic siderite concretions (cm-scale). Burrows in F3 are generally diminutive (< 2 mm diameter) to moderate (2 8 mm diameter) in size, and the overall trace-fossil diversity is 13 (Fig. 2.5). Chondrites, Cylindrichnus, Diplocraterion, Phycosiphon, Planolites, Skolithos, Teichichnus, Trichichnus, and Zoophycos with rare Asterosoma and Thalassinoides are commonly observed in muddier (10 20% mud) sandstone intervals. Discrete wavy-bedded shales are bioturbated exclusively with Chondrites (BI 0 2). Sandstone intervals are weakly bioturbated (BI 0 1) and only Gyrochorte are present. Facies 3 Interpretation: Facies 3 sandstones are considered to be deposited on the lower delta front (lower shoreface equivalent) of a wave-dominated delta. Within this depositional environment, high volumes of mud was delivered from rivers to the delta front during and immediately following periods of high elevated discharge (Mulder and Syvitski, 1995; Wheatcroft, 2000). When suspended sediment concentrations and water salinity parameters allow, these muds were transported via bottom-hugging hyperpycnal flows onto the delta front (Bhattacharya and MacEachern, 2009). These mud-rich deposits can mantle existing bedforms and be remobilized by storm waves (Fig. 2.5). 29
39 F3 is weakly bioturbated and the trace-fossil suite is typical of a stressed expression of the Cruziana Ichnofacies (MacEachern et al., 2005). Only facies-crossing, opportunistic fauna are able to inhabit such deltaic environments, which regularly experience fluctuations in water salinities, oxygen levels, and water turbidity (Gingras and MacEachern, 1998; MacEachern et al., 2005). Bioturbation is highly variable within this heterolithic facies and it is dependent on the periodicity of seasonal and annual storm events. Sandstone and mudstone layers devoid of bioturbation represent periods with high sediment influx and when hyperpycnal conditions dominated over hypopycnal (Fig. 2.5C). Bioturbated muddy sandstones are indicative of prolonged ambient conditions allowing for the colonization by opportunistic fauna (Fig. 2.5A; MacEachern et al., 2005). 30
40 31
41 Figure 2.5: Examples of F3 Core photographs of Facies 3: Sandstone with thin mudstone laminae and beds. A) The lower portion of the sample comprises absent to weak bioturbation (BI 0 2) in stacked hummocky cross-stratified (HCS) tempestites that grade into wavy shale laminae (base of individual tempestites marked with yellow arrow). Upper portion of sample comprises intensely bioturbated (BI 5) muddy sandstone (70% combined sandstone/siltstone content; W5, m). B) Absent to moderately bioturbated (BI 0 3) stacked wavy parallel- to combined-flow ripple laminated tempestites (80% combined siltstone/sandstone content). Base of middle tempestite (marked by yellow arrow) is lined with mudstone rip-up clasts (MR). The middle sandstone bed is moderately bioturbated (BI 3) with bioturbation increasing towards the top of the bed. This reflects top-down post-depositional colonization of the tempestite ( W5, m). C) Sandstone with mm- cm-scale wave-ripple and wavy shale laminae. Base of shale laminae is marked with a red arrow ( W5, m). D) Sandstone with mm- to cm-scale wave-ripple and wavy parallel shale laminae ( W5, m). E) Wave- to (WR) combined flow-ripple (CF) laminated sandstone with mm-scale wavy shale laminae ( W5, m). Trace fossil abbreviations: Asterosoma (As), Chondrites (Ch), Gyrochorte (Gy), Palaeophycus (Pa), Phycosiphon (Ph), Planolites (Pl), Rosselia (Ro), Siphonichnus (Si), Skolithos (Sk), and Zoophycos (Zo) Facies 4 (F4): Unbioturbated, massive- to hummocky crossstratified sandstone Facies 4 comprises apparently structureless to hummocky cross-stratified (HCS) sandstones (Fig. 2.6). Beds are dominantly massive, hummocky cross-stratified, or wave-ripple laminated, although some beds also show lesser combined-flow and current-ripple laminae. Parallel, combined flow ripple, and wave ripple laminae are commonly lined with carbonaceous detritus (Fig. 2.6). Sandstones also commonly contain mudstone rip-up clasts at the bases of beds (Fig. 2.6B). Burrows in F4 are generally diminutive in size and the overall trace-fossil diversity is very low. Clean sandstone intervals are weakly bioturbated (BI 0 1) and only Macaronichnus is observed. Pyrite is rare throughout, and occurs in nodular micritic siderite concretions (cm-scale). Sandstones are also locally calcite cemented, which coincides with visibly reduced oil staining (Fig. 2.6D). Facies 4 Interpretation: Facies 4 sandstones are interpreted to have been deposited on the lower to upper delta front (middle shoreface equivalent) front of a wave-dominated delta. This environment is characterized by very high sedimentation rates, which is the result of the abrupt velocity drop across the transition from flow confined to the channel to unconfined flow in the shallow-marine environment. Wave processes extensively rework the upper to middle delta front and as a result, these deposits bear many similarities to wave-dominated shorelines. 32
42 Bioturbation is generally absent in F4 and this is attributed to the physico-chemical stresses affecting the upper delta front (Fig. 2.6). These include extremely high sedimentation rates, low water salinity, and elevated turbidity (MacEachern et al., 2005). The only trace fossil found in F4 are diminutive Macaronichnus, which have been shown to have preservation potential in environments with high sedimentation rates (Clifton and Thompson, 1978). 33
 Carbonaceous detritus rich HCS sandstone. Mudstone rip-up (MR) clasts are evident towards the bottom of the sample (03-07-048-08W5, 1640.5 m).")
43 Figure 2.6: Examples of F4 Core photographs of Facies 4: Unbioturbated, massive to hummocky cross-stratified (HCS) sandstones. A) Carbonaceous detritus-rich HCS sandstone ( W5, m). B) Carbonaceous detritus rich HCS sandstone. Mudstone rip-up (MR) clasts are evident towards the bottom of the sample ( W5, m). C) Hummocky cross-stratified (red arrow) to combined flow-rippled (yellow arrow) stacked tempestites. The base of the upper tempestite is scoured and undulatory, reflecting scouring in association with deposition of the overlying bed ( W5, m). D) Sandstone with mud and carbonaceous detritus lining inclined parallel laminae. Sample is locally calcite cemented (CC) which coincides with a visible decrease in oil stain ( W5, m). 34
44 Facies 5 (F5): Clast- and matrix-supported conglomerate Facies 5 is subdivided into 2 subfacies based on the matrix types present. Facies 5a (F5a): Clast-supported polymictic conglomerates Facies 5a comprises polymictic, clast-supported, granule to medium-pebble conglomerates. F5a is dominantly clast-supported with medium- to coarse-grained sand matrix. No grading is visible within F5a conglomerates. Sedimentary structures are rarely observed, although inclined and parallel laminae and bedding occurs locally, particularly where intervening sandstone and mudstone beds are present (Fig. 2.5B). Clast composition is dominated by chert with lesser quartz and lithic fragments. Clasts are sub-rounded to well-rounded. Bioturbation is mainly absent (BI 0 1) with only firmground Thalassinoides present noted (Fig. 2.7A). Facies 5b (F5b): Mud matrix-supported polymictic conglomerates Facies 5b comprises polymictic, matrix-supported, granule to medium-pebble conglomerates. F5b is dominantly matrix-supported with mud to fine-grained silt matrix. No grading is visible within F5b conglomerates. Sedimentary structures are rarely observed, although inclined and parallel laminae and bedding occurs locally (Fig. 2.5B). Nodular siderite concretions are abundant and are most common in intervals with a high mud-matrix component. Complete sideritization of the mud matrix also occurs in some intervals (Fig. 2.7D). Clast composition is dominated by chert with lesser quartz and lithic fragments. Clasts are sub-rounded to wellrounded. Bioturbation is mainly absent (BI 0 1) with only Chondrites, Planolites and Phycosiphon being observed within isolated mud dominated intervals. Facies 5 Interpretation: The clast-supported conglomerates (F5a) of are interpreted to have been deposited in an upper shoreface to foreshore environment (or proximal delta front) during the later stages of marine progradation or subsequent transgression (mud matrix-supported; F5b). Coarse clastics sourced from fluvial point sources and eroded strandplains were deposited proximal to the shoreline and subjected to extensive winnowing and reworking by wave-action; this is consistent with the high textural maturity and well-sorted character of F5a progradational conglomerates (Fig. 2.7). F5 also has mud-supported conglomerates of variable thicknesses (F5b). While it is possible that thin bedded mud-supported conglomerates could have formed during the later stages of progradation when mud-laden waters can percolate through coarse beach deposits 35
45 depositing mud matrix; the overall thicknesses viewed within east-central Pembina suggests that the majority were formed during the initial stages of marine transgression (Dashtgard and Gingras, 2007; Dashtgard et al., 2006). The presence of firmground Thalassinoides and the Glossifungites Ichnofacies (Fig. 2.7A) is evidence that some of the exhumed substrates were subjected to early diagenesis and therefore represent hardground conditions prior to deposition (MacEachern et al., 2010). The overall lack of trace fossil diversity and low bioturbation intensity noted in F5 is a result of the poor preservation potential of ichnological structures within conglomerates (Dashtgard et al., 2008b). 36
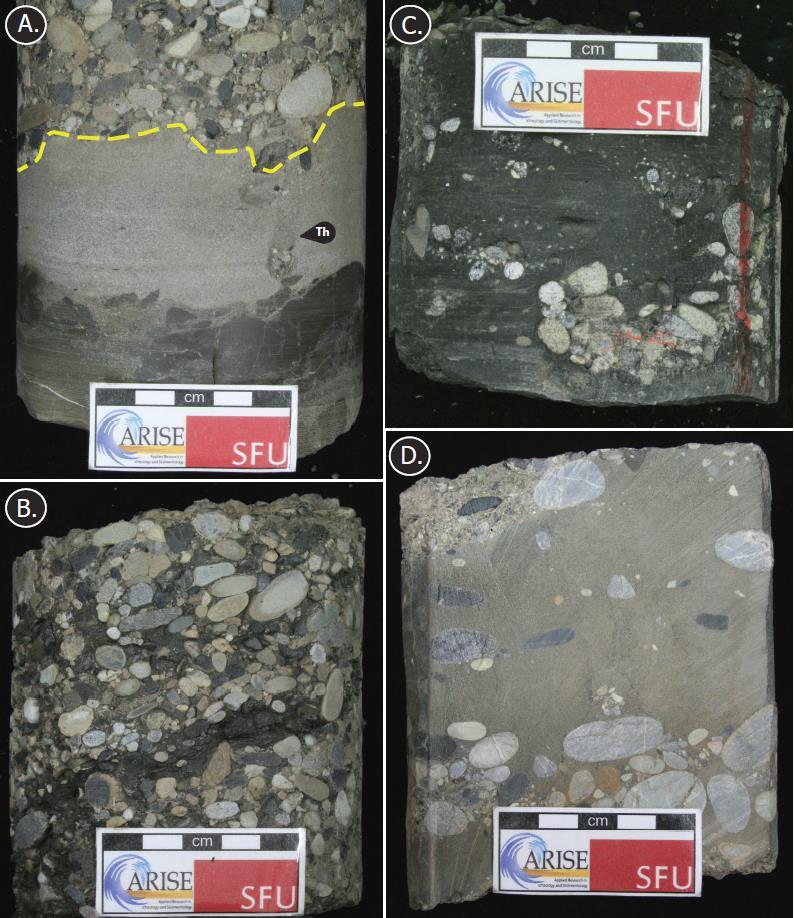
46 37
47 Figure 2.7: Examples of F5 Core photographs of Facies 5: Clast- to matrix-supported conglomerates. A) Sample with a burrowed contact between F5a and F4 below (yellow dashed line). The base of the F5a conglomerates is erosional. The upper clast-supported conglomerate has medium- to coarse-grained sand matrix. Clasts are polymictic, well-rounded and vary in size from cm. There is a vertical firmground Thalassinoides (Th) that extends from the F4-F5a contact into F4 ( W5, m). B) Mud-matrix supported polymictic conglomerate (F5b). There is a cm-scale moderately inclined shale bed in the middle of the sample ( W5, m). C) Mud-matrix supported polymictic conglomerate (F5b). Clast diameters range from 0.25 mm (medium-grained sand) to 1 cm (small pebble) ( W5, m). D) Siderite cemented mud-matrix polymictic conglomerate with well-rounded 0.5 mm to 2 cm (medium pebble) clasts (F5b). Sample has a sharp inclined contact with a sand matrix-supported polymictic conglomerate (F5a) in the upper left portion of the sample ( W5, m) Facies Associations Two vertical facies associations are observed in the cores logged for this study Facies Association One (FA1): Sandying-upwards shelf/ramp to upper delta front (middle shoreface equivalent) deposits Facies association 1 (FA1) includes sanding-upwards successions (F1 F2a F2b F2c F3 F4) that represent normal progradation from a shelf/ramp setting (F1) to an upper delta front (middle shoreface equivalent) environment (F4; Fig. 3.5), or normal progradation from a shelf/ramp (F1) to the upper offshore (F2c). Where the entire progradation sequence is complete, the poorly sorted clast-supported conglomerates of F5a overlie shoreface sandstones of F4. Internal flooding surfaces often exist separating thinner sanding-upward successions F1 FA2 (a/b/c) below from thicker more complete FA1 successions above (F2a F2b F2c F3 F4). Complete FA1 successions that do not contain internal flooding surfaces are rare. FA1 has a gradational lower contact with the underlying Blackstone Formation and an upper sharp erosional upper contact with overlying progradational clast-supported or mud-supported transgressive conglomeratic deposits (FA2). The contacts between bioturbated facies in FA1 (F1-F2) are gradational and are characterized by an increase in combined siltstone and sandstone content. Several allogenic and autogenic surfaces exist within FA1 and it is common for bioturbated facies with lower sandstone/siltstone contents to overlie sandier and siltier units. Additionally, deltaic deposits may transition to normal shoreface deposits and vice versa as a result of autogenic lobe switching. The internal flooding surfaces noted above (allogenic surfaces) are locally marked by 38
48 scattered coarse sands to pebbles and siderite nodules. As many as five of these allogenic and autogenic diastems were noted in some cores. The thickness of FA1 ranges from 6 13 m Facies Association Two (FA2): Conglomeratic Transgressive Deposits F1 and F5 comprise FA2 and were deposited in an upper shoreface to foreshore environment during transgression and during the later stages of marine progradation. The transgressive surface of erosion upon which the conglomerates are deposited is highly irregular, with many steps and lows along its extent (Leggitt et al., 1990). This surface was locally subaerially exposed during forced regression, and the erosional topography controlled the distribution and character of the transgressive conglomerates within the Cardium Formation (Krause et al., 1994; Walker and Eyles, 1991). As a result, the contact between FA2 with FA1 is irregular and has highly variable vertical relief across the study area. The contacts between mudsupported (F5b) and sand-supported conglomerates (F5a) are typically gradational and are marked by an increase in siderite cementation as they grade from sandy to muddy matrices. While no reproducible stacking pattern between sand- and mud-matrix supported conglomerates was observed, the poorly sorted mud matrix-supported (transgressive) conglomerates (F5b) often overlie the (progradational) clast-supported conglomerates (F5a). F1 always gradationally overlies F5 conglomerates and was deposited during the later stages of transgression. The bioturbation intensity is absent to weak (BI 0 1) within F5, and this reflects the poor preservation potential of trace fossils in conglomerates, while the bioturbation intensity is absent to moderate (BI 0 3) within F1 mudstones. The preserved thickness of F5 is highly variable depending on the proximity to steps or lows along the E5 surface and ranges from 1 cm 8 m (Fig. 2.8, Fig. 2.9), while the thickness of FA2 as a whole is unknown as cored intervals do not include the full F1 thickness in any well analyzed Cardium Type Logs The gamma-ray and resistivity log responses of two wells ( W5, W5) within the study area are shown (Fig. 2.8; Fig. 2.9). The two wells show the distribution of facies and their log responses along deposition dip from the SW ( W5) to NE ( W5) portions of the study area. Two pronounced sandying-upwards successions are shown in the SW section, which are capped by a several meter-thick conglomerate unit. By 39
49 contrast, one sandying upwards succession is capped by a sub-metre thick conglomerate unit characterizes the NE area. The two log profiles show the differences in gamma-ray responses for the same facies across the study area, as well as the corresponding resistivity responses. Figure 2.8: Core litholog W5 40
, and it is one of the few that contains all described facies and facies associations.")
50 Core litholog with gamma-ray and resistivity log profiles for 100/ W5/0 representing the vertical facies changes within the SW part of the study area. The well was chosen because it is one of the best preserved and newest cores logged (RR: ), and it is one of the few that contains all described facies and facies associations. Sandstone grain size is very fine upper throughout. Bioturbation Index, after Taylor and Goldring (1993), is defined in the legend (Fig. 2.10). Sandstone grain size remains consistent throughout the section (fine upper to fine lower). 41
51 Figure 2.9: Core litholog W5 Core litholog with gamma-ray and resistivity log profile for 100/ W5 representing the vertical facies changes within the NE part of the study area. Bioturbation index, after Taylor and Goldring (1993), is defined in the legend (Figure 10). Sandstone grain size remains consistent throughout the section (fine upper to fine lower). Figure 2.10: Cardium type log legend Legend of symbols used for Cardium type log sections (Fig. 2.8, Fig. 2.9). 42
52 Chapter 3. Permeability Heterogeneity in Bioturbated Strata, Cardium Formation, Pembina Field, and the Identification of Potential Waterflood Opportunities 1 1 A version of this chapter is intended for publication in the AAPG Bulletin Introduction Bioturbated sediments representing distal expressions of paralic depositional environments are increasingly being exploited for oil in the super-giant Cardium Formation reservoir, Pembina Field, Alberta, Canada. Oil exploitation from these sedimentary strata was previously was considered uneconomic due to the limited vertical and horizontal connectivity between permeable beds. However, recent use of horizontal drilling and multi-stage hydraulic fracturing has enabled the economic exploitation of hydrocarbons from these reservoirs. This approach has unlocked an additional 1.0 billion barrels of potential reserves, raising the total reserve estimate for the Pembina-Cardium Formation to 10.4 billion barrels (Krause et al., 1994; New Technology Magazine, 2011). To assess the viability of waterflooding these strata and to determine the reservoir controls on production, bioturbated reservoirs in the Cardium Formation of east-central Pembina Field are evaluated. Full diameter- and core plug-permeability data are compared to production data and to sedimentary facies to determine which factors most influence horizontal well production in east-central Pembina. Studies of bioturbated reservoirs have shown that bioturbation can either reduce (La Croix et al., 2013; Pemberton and Gingras, 2005; Tonkin et al., 2010) or enhance primary porosity and permeability (Dawson, 1978; Gingras et al., 2007; Gingras et al., 2004a; Gingras et al., 1999; Gingras et al., 2004b; La Croix et al., 2013; Lemiski et al., 2011; MacEachern and Gingras, 2007; Pemberton and Gingras, 2005; Zenger, 1992). The degree to which the reservoir is affected is largely dependent on the magnitude of bioturbation, nature of the trace-fossil assemblages, fill of the burrows, and the overall facies characteristics (Hsieh et al., 2015). It is generally accepted that moderately bioturbated facies (BI 2 3), dominated by grain-selective (i.e., coarser-grained fill than surrounding matrix), horizontal and vertical feeding strategies (e.g., Chondrites, Planolites, Skolithos, Thalassinoides), exhibit enhanced permeability, because vertical burrows connect high permeability horizontal beds. In intensely bioturbated facies (BI 4 6), diminished permeabilites 43
53 persist as a result of full admixing (homogenization) of high permeability sand/silt layers with low permeability clay. The Cardium Formation at Pembina is considered to be a dual-permeability system, wherein sand-filled horizontal and vertical burrows are largely permeable, and the matrix is effectively impermeable (Pemberton and Gingras, 2005; Solano et al., 2012). Dual-permeability systems commonly have enhanced effective permeability with high permeability layers are connected via horizontal and vertical burrow networks. However, the degree to which bioturbation has altered primary porosity and permeability at Pembina has not previously been evaluated. To that end, the impact of bioturbation on primary horizontal well production and its potential effects on horizontal water flooding is unknown. Unconventional, low-permeability light-oil (light-tight oil or LTO) reservoirs are broken down into three contrasting play types: tight oil, shale oil, and halo-oil plays (Clarkson and Pedersen, 2011). The distinguishing factors between these three play types is the source of the oil (e.g., the reservoir is also the source) and the average matrix permeability. Tight-oil plays have very low matrix permeabilities (< 0.1 md) and the hydrocarbon source is distinct from the reservoir (Clarkson and Pedersen, 2011). Shale oil plays are those wherein the hydrocarbon source is also the reservoir, and the matrix permeability is very low (generally < 0.1 md). Halo-oil plays refer to production of bypassed pay proximal to existing conventional production, but where low reservoir permeabilities limit the economic exploitation of hydrocarbon using vertical and horizontal wells. Exploitation of oil from halo-oil plays requires multi-stage hydraulic fracturing along horizontal wellbores (Clarkson and Pedersen, 2011). The focus of this study is halo-oil production from the Cardium Formation of the Pembina Field, in bioturbated reservoirs that exhibit relatively high matrix permeabilities ( md) Stratigraphy and Paleogeography The Upper Cretaceous Cardium Formation grades upwards from marine shales of the Blackstone Formation, and passes upwards gradually into marine shales of the Wapiabi Formation (Fig. 3.1; Krause et al., 1994). The Cardium Formation is part of the regionally extensive Colorado Group, which reaches 1200 m in thickness in the Alberta foothills (Bloch et al., 1993). The Colorado Group is a dominantly eastward-tapering marine shale package that contains at least three sandstone-dominated units: the Basal Colorado, Viking fm, and Cardium fm (Bloch et al., 1993). 44
")
54 Figure 3.1: Cardium Formation Stratigraphy Chronostratigraphic and lithostratigraphic breakdown of the Cretaceous through the central plains, Alberta. Shown on the chart are the names of bedrock strata from the Lower (144 Ma) to Upper Cretaceous (66.4 Ma). The Cardium Formation (red rectangle on diagram) is part of the Colorado Group and overlies the Blackstone Formation and underlies the Wapiabi Formation. Modified from (ERCB, 2013). 45
55 Cardium Formation deposition occurred during the Cenomanian and Turonian when the Cretaceous global sea-level was near an all-time high (Smith, 1994). Deposition occurred along the western margin of the Western Interior Seaway and sediments were sourced from the Cordillera to the west (Fig. 3.2; Williams and Stelck, 1975). Following the early stages of Cardium deposition, there was an overall lowering of relative sea-level causing the eastward and southeastward progradation of the shoreline (Krause et al., 1994). At Pembina, this progradation is typified by coarsening-upward parasequences of bioturbated sandy mudstones to hummocky cross-stratified sandstones interpreted to reflect normal progradation from an offshore environment to the shallow marine (lower shoreface to delta front). Mudstone to sandstone successions are overlain unconformably by foreshore conglomerates (deposited during the lowstand to falling stage systems tract) that were reworked during subsequent transgression. Several cycles of relative sea level rise and fall led to the deposition of multiple parasequences, all of which are separated by widespread marine flooding surfaces. 46
56 Figure 3.2: Cardium Paleogeography Paleogeographic reconstruction of the Western Interior Seaway of North America during the early Turonian (Williams and Stelck, 1975). Paleolatitudes are from Irving et al. (1993) Study Area and Pembina Development History Research was focused on the Cardium Formation in east-central Pembina Field (Township 47 50; Range 4 9W5) of Alberta (Fig. 3.3). As of October, 2014, the study area contains 2527 vertical wells and 374 horizontal wells. East-central Pembina has had extensive historical development targeting the conventional conglomerate and sandstone deposits, as well as recent development focused on the bioturbated sandy mudstones to muddy sandstone deposits. The vertical and horizontal wells within this area also have an abundance of core, core analysis, and production data which were imperative for the undertaking of this study. 47
; (B) the location of the study area within the Pembina Field, and; (C) the location of logged cores (yellow stars) and logged cores that were also analyzed for micropermeability values (green")
57 Figure 3.3: Study Area Maps showing: (A) the location of the Pembina Field on a paleogeographic map of the Cardium Formation in Alberta, Canada (after Krause et al., 1994); (B) the location of the study area within the Pembina Field, and; (C) the location of logged cores (yellow stars) and logged cores that were also analyzed for micropermeability values (green stars). The Cardium Formation (Pembina Field) was discovered in 1953 when Socony Vacuum Exploration (present day ExxonMobil) drilled the Socony Seaboard Pembina No. 1 discovery wildcat well (100/ W5; Nielsen, 1957; Parsons and Nielsen, 1954). The Socony 48
58 Seaboard Pembina No. 1 produced hydrocarbons from thick shallow marine sandstone and conglomerates. To date, the discovery well has produced over 865,000 bbl of oil and 360,000 mcf of gas (Nielsen, 1957; Nielsen and Porter, 1984; Parsons and Nielsen, 1954). Enhanced oil recovery schemes (EOR; waterflooding) began in 1960 following seven years of highly variable success within Pembina using primary production. Strong production continued until the late 1980s, at which point it was believed that the field was nearing maturity (Krasey, 1985; Todd and Grand, 1993). Other enhanced oil recovery schemes, including CO 2 injection, were attempted in Pembina in the years to follow (Dashtgard et al., 2008a). While horizontal wells were drilled at Pembina prior to 2008, the introduction of horizontal wells with multi-stage hydraulic fracturing in 2008 brought about a resurgence of interest in the Cardium Formation and the Pembina Field in particular (Clarkson and Pedersen, 2011). To date, over 2700 horizontal wells have been drilled into the Cardium Formation, including 951 within the Pembina Field Methods Data was compiled from 38 cores and 171 wireline logs for a total of 209 total wells (Fig. 3.3c). When selecting cores and wireline logs for inclusion in this study, preference was given to the most recently drilled wells, and especially those with gamma-ray, resistivity, and neutron and density porosity log profiles. Core analysis data (e.g., porosity and permeability measurements) were obtained from Accumap and were compiled and analyzed using Microsoft Excel. Geophysical well-log responses were compared to core descriptions to determine the log character of facies, and then facies isopach mapping was undertaken using the log responses for the 209 wells. Cardium fm facies were subdivided based on the visual sandstone/siltstone percentage (including all discrete beds, burrows, and interstitial grains), grain-sizes, physical sedimentary structures, and ichnology. Bioturbation intensities were semi-quantified using the Bioturbation Index (BI), described originally by Reineck (1963)) and modified by Taylor and Goldring (1993). This scale is based on grades of bioturbation that can be discerned with the human eye. The Bioturbation Index has seven grades that range from no visible bioturbation (BI 0) to completely bioturbated (BI 6). 49
59 Pressure Decay Profile Permeameter (PDPK) Analyses A total of 44 samples from 11 wells (Fig. 3.3c) were chosen for Pressure Decay Profile Permeameter (PDPK or micro-perm) analysis. The wells chosen for sampling have good overall core integrity, a core diameter >7.5 cm, and contain bioturbated sandy mudstones to muddy sandstones. Sample lengths range from 6 25 cm, and between 11 and 23 PDPK measurements were taken per core sample for a total of 758 datapoints. Measurement locations on each slab were carefully chosen to ensure permeability values were collected for all lithologies (e.g., sandfilled burrow, parallel laminated mudstone) in each sample. Core samples selected for PDPK measurements were slabbed to 1/3 of their original diameter. Cut samples were lightly sandblasted to ensure that a good seal formed between the slabbed surface and the O-ring attached to the probe tip (0.4 cm diameter) of the PDPK-400 machine. Samples were then cleaned with a toluene solution to chemically remove any mobile hydrocarbons and placed in an oven to allow the sample to fully dry. Sample preparation and permeability measurements were performed at the Core Laboratories facilities in Calgary, Alberta. Once the seal between the O-ring and the rock was confirmed gas was allowed to flow from the PDPK-400 into the core at 70 kpa (initial upstream flow pressure). The decay of the initial pressure was measured against time and the collected data was corrected for Klinkenberg-slippage effects (Fathi et al., 2012). Klinkenberg-slippage correction accounts for the fact that gas molecules injected into a sample move through the centre and edges of pore throats at the same speed, whereas liquids (i.e., oil) do not. Correction of the data yields Klinkenberg-corrected liquid equivalent permeability measured in microdarcys Permeability Calculations An equivalent permeability value (k eq ) was estimated using the arithmetic, geometric, and harmonic means. Assuming steady-state, single-phase flow, the upper bound represents the equivalent permeability along layering in a perfectly laminated system and is equal to the arithmetic mean (Eq. 1): k arithmetic = n i=1 k id i d (Eq. 1) 50
60 where k i is the permeability of an individual layer, d i is the thickness of that layer, and d is the total thickness of the facies under investigation. The lower bound of this analysis is equivalent to the harmonic mean (Eq. 2), which is the permeability across layering in a perfectly laminated system: k harmonic = 1 n i=1 d i k i d (Eq. 2) where k i is the permeability of an individual layer, d i is the thickness of that layer, and d is the total thickness of the facies under investigation. The actual effective permeability ( k eq ) a single permeability value that best represents a heterogeneous system as if it were homogeneous is equivalent to the geometric mean (Eq. 3). This value lies within the upper and lower bounds described above and is the best analog for single phase-flow in a natural reservoir where fluid flow can occur in all directions (Freeze and Cherry, 1979; Gelhar, 1986; Warren and Price, 1961; Wiener, 1912). ln (k geometric ) = n i=1 ln (k i)d i d (Eq. 3) In order to calculate effective permeabilities for the heterogeneous reservoir under investigation, the geometric mean equation (Eq. 3) described above was used. It was applied to three hydrodynamically similar units: 1) bioturbated reservoir ranging from 30 80% combined sand/silt content; 2) conventionally targeted sandstone reservoirs; and 3) conventionally targeted conglomeratic reservoirs. Statistical analyses were completed on core analysis data for each individual hydrodynamic unit within a single well before the geometric mean was calculated. Only permeability values that were determined to lie within the statistically defined upper and lower bounds were used. This is computed using an interquartile range (IQR), which is defined as 50% of the dataset that lies between the 1 st and 3 rd quartile (Upton and Cook, 1996). The upper and lower bounds are therefore (Eq. 4): 51
61 Upper Bound = Q *IQR Lower Bound = Q3 1.5*IQR (Eq. 4) Only permeability data points that lie within the upper and lower bounds were used in order to retain the integrity of the dataset and to ensure geometric mean values had statistical significance. This methodology ensured that anomalously high or low permeability measurements within an individual hydrodynamic unit would not skew the representative geometric mean values calculated Contouring (using Golden Software Surfer ) Sandstone isopach thicknesses were calculated from the 209 vertical wells, and variable sandstone gamma-ray, resistivity, and porosity cut-offs were used depending on proximity to well control points (38 logged wells). Variable cut-offs were used in order to minimize sedimentological (e.g., radioactivity of clay minerals) and operational bias (e.g., data collected over several decades), which exists within the study area. Where well-log data was limited or outdated, porosity and permeability cut-offs were applied to core analysis data to determine the contact between bioturbated sandy mudstone and sandstone facies. Advanced kriging, based on deposition trends mapped in the study area (anisotropy: 1.5, angle: 150 ) was applied to the datasets to interpolate between datapoints and produce contour maps that extend across the entire study area. Data northwest of the Pembina- Cardium pool boundary were removed from contour maps (insignificant thickness and extent). Data poor areas exist in the NE, SE, and NW portions of the study area, as well as the NW-SE trending embayment located in the east-central portion of the study area Results Facies Five facies are defined in the Cardium Formation and across the study area (Table 3.1). Of the 5 facies, Facies 2 (F2) includes bioturbated sandy mudstones and muddy sandstones (target reservoir facies in this study), and is subdivided into 3 subfacies based on the total 52
62 percentage of combined sandstone and siltstone. Facies 2 represents sediments interpreted to be deposited below fair-weather wavebase and above storm-wave base; hence, they are interpreted as offshore to shoreface (prodelta to distal delta front equivalent) deposits. Below are descriptions of the main reservoir facies (F2b and c, F3 5), with a focus on how sedimentologic and ichnologic characteristics impact permeability. Subfacies 2a (F2a) comprises weakly to moderately bioturbated (BI 0 3) silty to sandy mudstone with rare (5 10%) mm- to cm-scale, very fine- to fine-grained sandstone beds (Table 3.1; Fig. 3.4A). The combined sand/silt content ranges from 10 30%. The sandstone-siltstone content of F2a is below the 30% threshold for economic exploitation, and hence F2a is not included in reservoir mapping. Subfacies 2b (F2b) comprises weakly to moderately bioturbated (BI 1 4) silty to sandy mudstones with rare to moderate (5 25%) cm-scale, fine- to very fine-grained sandstone beds (Fig. 3.4B). The combined sand/silt content ranges from 30 50%, and siltstone and sandstone is distributed either in weakly to moderately bioturbated discrete graded beds (BI 1 3), or as interstitial grains mottled by bioturbation (BI 3 4). Black shale beds and laminae occur throughout and are discontinuous, and wavy-parallel to wavy non-parallel laminated (Fig. 3.4B). Medium- to coarse-grained sand is rare throughout and occurs as floating grains or as weakly defined sandstone lenses, commonly in close proximity to facies contacts. Sand-filled burrows are generally diminutive (< 2 mm diameter) to moderate (2 8 mm diameter) in size and the overall trace-fossil diversity is 12 (Table 3.1; Seilacher, 1974). Subfacies 2c (F2c) comprises moderately to intensely bioturbated (BI 3 5) muddy sandstones with moderate to abundant (10 35%) cm-scale, fine- to very fine-grained sandstone beds (Fig. 3.4C). The combined sand/silt content ranges from 50 80%. Siltstone and sandstone content is manifest either as weakly to moderately bioturbated, discrete graded beds (BI 1 3) or as interstitial grains mottled by bioturbation (BI 3 5). Black shale beds and laminae occur throughout and are discontinuous, and wavy-parallel to wavy non-parallel laminated. Sand-filled burrows in Facies 2c range from diminutive (< 2 mm diameter) to robust (> 8 mm diameter) in size. The overall trace-fossil diversity is 16 (Table 3.1; Seilacher, 1974). Facies 3 comprises structureless to weakly bioturbated (BI 0 2) muddy sandstone (> 80% combined silt/sand content) to sandstone, with absent to abundant (0 50%) mm- to cm-scale shale beds (locally up to 80% shale; Fig. 3.4D). The shale beds commonly have scoured bases and are either undulatory-, wavy non-parallel, or planar parallel laminated (Fig. 3.4D). Sandstones are locally massive to hummocky cross-stratified (HCS) or are wave-ripple laminated. Other sedimentary structures include inclined and parallel, combined-flow ripple and current ripple 53
63 laminae that are commonly lined with carbonaceous detritus (Fig. 3.4D). Sand-filled burrows in F3 are generally diminutive (< 2 mm diameter) to moderate (2 8 mm diameter) in size and the overall trace-fossil diversity is 13 (Table 3.1; Seilacher, 1974). Facies 4 comprises apparently structureless to HCS sandstones. Beds are dominantly massive, contain HCS, or are wave-ripple laminated, although some beds contain parallel, inclined, combined-flow ripple and current ripple laminae (Fig. 3.4E). Parallel, combined flow and wave-ripple laminae are commonly lined with carbonaceous detritus (Fig. 3.4E). Burrows in F4 are generally diminutive in size and the overall trace-fossil diversity is 1 (only Macaronichnus is present). Facies 5 consists of polymictic, clast- (F5a) and matrix-supported (F5b), granule to medium-pebble conglomerates (Fig. 3.4F). They are dominantly clast-supported with a mediumto coarse-grained sand matrix (F5a); however, the conglomerate is locally matrix-supported within beds that have a high mud-matrix component (F5b). The mud-matrix supported conglomerates commonly overlie the sand clast-supported conglomerates. Clast compositions are dominated by quartz and lithic fragments. Clasts are sub-rounded to well-rounded. F5 varies in thickness from m. Bioturbation is mainly absent (BI 0 1) with only firmground Thalassinoides that extend down from the basal contact of F5 (Fig. 3.4F), and Chondrites, Planolites, and Phycosiphon locally within the mud matrix-supported F5b conglomerates. 54
64 Table 3.1: Facies Facies 1: Dark grey- to black silty mudstone to shale with very finegrained sandstone laminae Facies 2: Dark grey bioturbated sandy mudstone to muddy sandstone Facies 3: Massive to bioturbated sandstone with parallel and wavy shale beds Facies 4: Apparently structureless to HCS sandstone Facies 5: Clast- to matrix-supported conglomerate Percent Sandstone/ Siltstone 0 10% 2a 10 30% 2b 30 50% 2c 50 80% 5a 5b % Facies summary Grain Size Sedimentology Ichnology shale with up to 10% vfg sand inter beds fg sandstone with up to 50% shale inter beds % vfg - fg 0 50% sand matrix 0 50% mud matrix sand matrix with cg sand to cobble clasts mud matrix with cg sand to cobble clasts Sst/Slst: discontinuous-, paralleland wave-ripple laminated sand beds. Sh: wavy laminae Sst/Slst: HCS, wave-, inclined parallel-, combined flow- and current-ripple laminated sandstones. Sh: wavy laminae and beds Sst/Slst: HCS, wave ripple, inclined parallel, combined flow and current ripple laminated sandstones. Sh: wavy laminae Ch, He, Pa, Ph, Pl, Sc, Sk As, Ch, Cy, Di, Ph, Pl, Sk, Te, Th, Tr, Zo Summary table of lithological, textural, sedimentological, ichnology, reservoir characteristics (permeability and porosity), and interpreted depositional environments for facies identified in the Pembina Oil Field (this study). Sedimentological abbreviations: siltstone (slst), sandstone (sst), shale (sh), hummocky cross-stratification (HCS). Trace fossil abbreviations: Asterosoma (As), Chondrites (Ch), Cylindrichnus (Cy), Diplocraterion (Di), Helminthoida (He), Macaronichnus (Ma), Palaeophycus (Pa), Phycosiphon (Ph), Planolites (Pl), Rhizocorallium (Rh), Rosselia (Ro), Scolicia (Sc), Skolithos (Sk), Teichichnus (Te), Thalassinoides (Th), Trichichnus (Tr), Zoophycos (Zo). Bioturbation index (BI) values based on Reineck (1963) and modified by Taylor and Goldring (1993). BI (0 6) Average Permeability Average (geometric Porosity mean) Depositional Environment 0 3 N/A N/A shelf/ramp shale with up to 30% Sst/Slst: discontinuous-, parallel- 1 3 lower offshore slst - fg sst, inclined- and wave-ripple As, Ch, Cy, Di, shale with up to 50% laminated, mudstone rip-up Gy, He, Pa, Ph, lower to upper % slst - fg sst clasts, HCS, lenticular bedding md Pl, Rh, Ro, Sc, Sk, offshore Sh: wavy laminae shale with up to 80% Te, Th, Tr, Zo slst - fg sst 2 6 upper offshore 0 3 N/A md parallel and inclined laminae Ch, Pl, Ph, Th md 16.40% 7.30% lower delta front (lower shoreface equivalent) lower to upper delta front (middle shoreface equivalent) upper shoreface to foreshore Contacts L = gradational; U = gradational L= gradational; U = gradational, erosional, FS L = gradational, erosional, FS; U = gradational, erosional L = gradational, erosional; U = erosional L = erosional; U= sharp, gradational 55

65 Figure 3.4: Facies core images Facies photographs. A) Facies 2a: Weakly to moderately bioturbated (BI 1 4) sandy/silty mudstone (30% sand/silt content). Sandstone/siltstone is contained in laterally discontinuous tempestites and in burrow fills. Yellow arrows mark bases of discontinuous tempestites and red arrows mark bases of wavy shale laminae ( W5, m). B) Facies 2b: Moderately to intensely bioturbated (BI 3 5) sandy mudstone (40% total sand content; W5, m). C) Facies 2c: Moderately to intensely bioturbated (BI 2 6) muddy sandstone (65% combined siltstone/sandstone content; W5, m). D) Facies 3: Sandstone with mm- to cm-scale wave-ripples ( W5, m). E) Facies 4: Carbonaceous detritus-rich HCS sandstone. Mudstone rip-up (MR) clasts are evident towards the bottom of the sample ( W5, m). F) Bioturbated contact between F5a and F4 (yellow dashed line). The base of the F5a conglomerates is erosional. There is a vertical firmground Thalassinoides (Th) that extends from the F4 F5a contact into F4 ( W5, m). Trace fossil abbreviations: Chondrites (Ch), Gyrochorte (Gy), Phycosiphon (Ph), Planolites (Pl), Rosselia (Ro), Schaubcylindrichnus (Sc), Skolithos (Sk), Teichichnus (Te), Thalassinoides (Th), and Trichichnus (Tr). 56
66 Facies Association One (FA1): Sandying upwards shelf/ramp to upper delta front (middle shoreface equivalent) deposits Facies association 1 (FA1) includes sanding-upwards successions (F1 F2a F2b F2c F3 F4) that represent normal progradation from a shelf/ramp setting (F1) to an upper delta front (middle shoreface equivalent) environment (F4; Fig. 3.5), or normal progradation from a shelf/ramp (F1) to the upper offshore (F2c). Where the entire progradation sequence is complete, the poorly sorted clast-supported conglomerates of F5a overlie shoreface sandstones of F4. Internal flooding surfaces often exist separating thinner sanding upward successions F1 FA2 (a/b/c) below from thicker more complete FA1 successions above (F2a F2b F2c F3 F4). Complete FA1 successions that do not contain internal flooding surfaces are rare. FA1 has a gradational lower contact with the underlying Blackstone Formation and an sharp erosional upper contact with overlying progradational clast-supported or mud-supported transgressive conglomeratic deposits (FA2). The contacts between bioturbated facies in FA1 (F1 F2) are gradational and are characterized by an increase in combined siltstone and sandstone content. Several allogenic and autogenic surfaces exist within FA1 and it is common for bioturbated facies with lower sandstone/siltstone content to overlie sandier and siltier units. Additionally, deltaic deposits may transition to normal shoreface deposits and vice versa as a result of autogenic lobe switching. The internal flooding surfaces noted above (allogenic surfaces) are locally marked by scattered coarse sands to pebbles and siderite nodules. As many as five of these allogenic and autogenic diastems were noted in some cores. The thickness of FA1 ranges from 6 13 m Facies Association Two (FA2): Transgressive Conglomerate Deposits F1 and F5 comprise FA2 and were deposited in an upper shoreface to foreshore environment during transgression and during the later stages of marine progradation. The transgressive surface of erosion upon which the conglomerates are deposited is highly irregular, with many steps and lows along its extent (Leggitt et al., 1990). This surface was locally subaerially exposed during forced regression, and the erosional topography controlled the distribution and character of the transgressive conglomerates within the Cardium Formation (Krause et al., 1994; Walker and Eyles, 1991). As a result, the contact between FA2 with FA1 is irregular and has highly variable vertical relief across the study area. The contacts between mudsupported (F5b) and sand-supported conglomerates (Fba) are typically gradational and are marked by an increase in siderite cementation as they grade from sandy to muddy matrices. While 57
67 no reproducible stacking pattern between sand- and mud-matrix supported conglomerates was observed, the poorly sorted mud matrix-supported (transgressive) conglomerates often overlie the (progradational) clast-supported conglomerates (F5a). F1 always gradationally overlies F5 conglomerates and was deposited during the initial and later stages of transgression The bioturbation intensity is absent to weak (BI 0 1) within F5, and this likely reflects the poor preservation potential of trace fossils in conglomerates, while the bioturbation intensity is absent to moderate (BI 0 3) within F1 mudstones (Dashtgard et al., 2008b). The preserved thickness of F5 is highly variable depending on the proximity to steps or lows along the E5 surface and ranges from 1 cm 8 m (Fig. 3.5), while the thickness of FA2 is unknown as cored intervals do not include the full F1 thickness in any well analyzed 58
68 Figure 3.5: Core litholog W5 Core litholog with gamma-ray and resistivity log profiles for 100/ W5/0 representing the vertical facies changes within the SW part of the study area. The well was chosen because it is one of the best preserved and newest cores logged (RR: ), and it is one of the few that contains all described facies and facies associations. Sandstone grain size is very-fine upper throughout. Bioturbation Index, after Taylor and Goldring (1993), is defined in the legend (Fig. 3.6). Sandstone grain size remains consistent throughout the section (fine upper to fine lower). 59
69 Figure 3.6: Cardium type log legend Legend of symbols used for Cardium type log sections PDPK Micropermeability was measured from 758 points across 44 core samples taken from Facies 2a, 2b, 2c and 3. Annotated core photographs for PDPK analyses of two samples are shown in Figure 3.7. Individual measurements were taken from one of three permeability elements: 1) vertical and horizontal silt/sand filled burrows (burrow), 2) sand beds with preservation of primary stratification (tempestites), and 3) indistinct bioturbated muddy-sandstone to sandy mudstone lithologies (matrix). Micropermeabilities across the 44 samples range from md to 65.4 md, with an average of 0.72 md. The K geometric value calculated for each well 60

70 was then plotted against the range of PDPK measurements taken for samples from the same well, and by permeability element (e.g., burrow, tempestite, or matrix; Fig. 3.8). Wells with higher K geometric values have higher average PDPK values and a wider range of permeability values. Of note, below an average K geometric of 0.35 md, all microperm values (n = 237) remain below md, and are not appreciably higher than matrix permeability. For average K geometric values between 0.35 md and 0.65 md, burrows show permeabilities up to 2.18 md, which is more than 40 times greater than the average matrix permeability. However, when the average permeability of F2b and F2c in a well exceeds 0.6 md, individual permeability measurements taken from burrows and tempestites range up to 65.4 md, which is roughly 730 times higher than the average matrix permeability. Figure 3.7: PDPK measurement positions ( W5 & W5) A) Core photograph of F2b (Kgeometric = 0.39 md) showing the PDPK analysis points and their corresponding permeability values ( W5, m). B) Core photograph of F2b (Kgeometric = 0.95 md) showing the PDPK analysis points and their corresponding permeability values ( W5, m). All permeability measurements are in millidarcies (md). 61
, red represents tempestites (tempestite), and grey represents bioturbated matrix (matrix).")
71 Figure 3.8: PDPK versus facies plots A) Plot comparing Kgeometric for each well against PDPK measurements taken from samples from the same well. Blue represents vertical and horizontal silt/sand filled burrows (burrow), red represents tempestites (tempestite), and grey represents bioturbated matrix (matrix). B) Plot comparing Kgeometric for each well against PDPK matrix measurements only. There is no discernible trend in PDPK matrix permeabilities with increasing facies 2b/2c Kgeometric values Reservoir Characterization Tight-oil plays in the study area are divided into two distinct regions: acreage with prospective halo-oil and acreage with prospective perm-oil. 1) Halo-oil plays were defined loosely by Clarkson and Pedersen (2011) as oil production from areas proximal to and immediately surrounding convention oil reservoirs that do not meet traditional net-pay and petrophysical cutoffs (average matrix permeability > 0.1 md). We have revised this definition to include oil production from areas that are up to 5 km away from the 2.5 m sandstone isopach contour. 2) 62
72 Perm-oil plays include all horizontal wells that have horizontal-leg midpoints further than 5 km from the 2.5 m sandstone isopach contour. This distinction is made because of the impact of conventional oil production (extensive waterflooding from 1953 ~1980) on production rates of recently drilled horizontal wells. Multiple contour maps including porosity, permeability (K geometric), facies thickness, and combinations of porosity/permeability and facies thicknesses were constructed to compare reservoir characteristics to horizontal production. Horizontal wells within east-central Pembina are generally drilled horizontally to the bottom of the economically exploitable bioturbated reservoirs (~30% combined sandstone/siltstone content), and hydraulically fracked upwards into the overlying porous and permeable bioturbated subfacies. Qualitative spatial and quantitative graphical analyses were undertaken to determine which reservoir properties listed above had the greatest impact on oil production (3 rd month daily average production). The reservoir properties that appear to show the closest correlation to oil production include sandstone facies thicknesses, and bioturbated facies K geometric, and these maps are included herein (Figs ). The midpoint between the surface-hole location and location of the terminal fracture-stimulation position was chosen for plotting the position of horizontal-well production on the maps Mapping The sandstone isopach map shows the thicknesses of facies 3 and 4 (Fig. 3.9). Four isolated and semi-continuous thick sandstone trends are evident on the map: 1) a globular geobody that approaches 7 m thick in W5; 2) a semi-linear geobody that is approximately 6 m thick in W5; 3) a globular geobody that exceeds 7 m thick in / 08W5; and 4) a prominent linear geobody in the SW corner the study area where the combined F3 / F4 sand thickness exceeds 8 m (Fig. 3.9). The 0 m sandstone line marks the termination of F3 and F4 deposition. Of note is the embayed character of the sandstone towards the SE end of the study area, and the presence of thin sandstones immediately east of the intersection of townships 48 and 49, and ranges 8 and 9W5. The sandstone isopach map does not extend through the northeast end of the study area due to the position of the pool edge boundary (Fig 3.9). 63
 in Surfer and are based on data from 209 vertical wells in the study area.")
73 Figure 3.9: Sandstone (F3, F4) sandstone isopach map Sandstone (F3, F4) isopach map. Contours were created using advanced kriging methods (anisotropy 1.5, angle 150 ) in Surfer and are based on data from 209 vertical wells in the study area. The midpoint of all horizontal wells drilled in the area are shown with corresponding 3 rd month average daily production (m 3 /d). The halo-oil play includes all areas of the map that contain contours, and do not fall into either the effective conventional production (red) or perm-oil play (green) areas. The prominent geobodies identified as 1 to 4 are referred to in the text (see Section 3.3.6). Contour interval is 0.5 m. 64
74 The bioturbated facies (F2b and F2c) permeability (K geometric) contour map is shown in Figure Five isolated and semi-continuous permeability trends are evident on the map: 1) a narrow NW-SE-oriented trend of low permeability that coincides with the embayment in the eastcentral portion of the study area; 2) a more globular permeability low in / 08W5 and / 08W5; and 3-5) three globular K geometric permeability highs found in the north-east (#3; 048 / W5), west-central (#4; / 07W5), and south-west (#5; 047 / W5) quadrants of the study area (shown in yellow on Fig. 3.10). In areas 1 and 2, K geometric values are as low as 0.11 md. In areas 3 to 5, K geometric values exceed 1.8 md, 1.7 md and 1.1 md, respectively. The K geometric map shows a roughly inverse correlation to the sandstone isopach map in that sandstone thick generally coincide with low permeability zones in the bioturbated facies. 65
 in Surfer, and are based on data from 209 vertical wells in the study area.")
75 Figure 3.10: Bioturbated facies (F2b, c) permeability map Contour map of Kgeometric values of bioturbated facies (F2b, c). Contours were created using advanced kriging methods (anisotropy 1.5, angle 150 ) in Surfer, and are based on data from 209 vertical wells in the study area. The midpoint of all horizontal wells drilled in the area are shown with corresponding 3 rd month average daily production (m 3 /d). Prominent trends in Facies 2b, c permeabilities described in the text are labelled for easy reference (yellow refers to higher permeability areas 3 5). Sandstone geobodies shown in Figure 3.9 are overlain for reference, and highlight areas of conventional production and waterflooding. Contour interval is 0.1 md. 66
76 The bioturbated facies (F2b and F2c) thickness contour map is shown in Figure Four discernable thickness trends are evident on the map: 1) a narrow to globular NW-SE-oriented thin that coincides with the embayment in the east-central portion of the study area; 2) an E-W trending thin in / 08W5 that has a combined F2b/F2c thickness less than 6 m; 3) a globular zone of thin bioturbated facies located in the northwest part of the study area (049-08W5); and 4) an elongate thin in the northern part of the study area (050-07W5) that is truncated to the east by the approximate pool edge boundary. The bioturbated facies thickness appears to have exerted limited influence on horizontal well production within east-central Pembina. Above 7 m isopach thickness there is no discernable spatial correlation between increasing reservoir thickness and horizontal well production. 67
 in Surfer, and are based on data from 209 vertical wells in the study area.")
77 Figure 3.11: Bioturbated facies (F2b, c) isopach thickness map Contour map of bioturbated facies (F2b, c) thicknesses. Contours were created using advance kriging methods (anisotropy 1.5, angle 150 ) in Surfer, and are based on data from 209 vertical wells in the study area. The midpoint of all horizontal wells drilled in the area are shown with corresponding 3 rd month average daily production (m 3 /d). The prominent thin geobodies described in the text are labelled 1 to 5 and yellow fill highlights areas of thicker bioturbated facies. Sandstone geobodies shown in Figure 3.9 are overlain for reference and indicate areas of conventional production and waterflooding. Contour interval is 0.5 m. 68
78 3.4. Reservoir Controls on Production PDPK Analysis of PDPK data indicates that sandstone-filled burrows and horizontally laminated sandstone beds (tempestites) are the most permeable components of the bioturbated reservoir facies (Fig. 3.8), and that the sandstones beds and sandstone-filled burrows likely serve as the primary flow pathways for hydrocarbons. Matrix permeability is negligible throughout facies 2b and 2c (Fig. 3.8B). Bioturbation increases effective permeability when discrete vertical and horizontal burrows connect highly permeability horizontal beds in dual-permeability systems (Gingras et al., 1999; La Croix et al., 2013; Pemberton and Gingras, 2005). There is an abrupt increase in sandstone-filled burrow and tempestite spot permeabilities where the average bioturbated facies permeability (k geometric) exceeds 0.35 md (Fig 3.8). Below this threshold, the sandstone burrows and tempestites have permeabilities similar to the matrix. A second abrupt increase in sandstone burrow and tempestite permeabilites occurs where k geometric exceeds ~ 0.65 md. Diagenetic and sedimentological variations that commonly exist across large areas are likely the main reason why sandstone burrows and tempestites show orders of magnitude increases in permeability across k geometric. Cardium Formation conventional sandstone permeabilities increase updip from the southwest to the northeast across the Pembina-Cardium pool (MacKenzie, 1975; MacKenzie and Russum, 1976). The decrease in permeability to the southwest can be attributed to: precipitation of calcareous and/or siderite cements, increased interstitial clays, or secondary quartz overgrowths within the sandstones (Krause and Nelson, 1984; MacKenzie, 1975). Similar diagenetic alterations likely affected the bioturbated facies in the southern portion of the study area, causing sandstone burrows and tempestites to have permeabilities that are an order of magnitude lower than similar features located updip Sandstone Isopach The majority of horizontal wells drilled in east-central Pembina target the fringes of sandstone isopach thicks (i.e., halo-oil play). These horizontal wells are generally the best producers. The permeabilities and net-pay thickness (k h) in the halo-oil play were insufficient to enable economic exploitation through primary production, and hence these areas remained under or undeveloped (Nielsen and Porter, 1984; Patterson and Arneson, 1957). Bypassed banked oil 69
79 commonly accumulates in areas immediately surrounding extensively produced and waterflooded conventional reservoirs such as the Pembina-Cardium pool (Shepherd, 2009). Qualitative spatial analysis of Figure 3.9 indicates that much of the primary (unswept) and banked hydrocarbons in east-central Pembina likely exist on the margins of conventional oil targets within the 0.25 m to 2.5 m sandstone isopach contour; a hypothesis supported by the linear arrangement of the best oil producers equidistant from sandstone contour lines (e.g., /06W5, Fig. 3.9). Consequently, we rank reservoirs that have between 0.25 and 2.5 m of sandstone (Facies 3 and 4) as highly prospective and the most suitable for waterflooding. Wells drilled immediately below historically effective conventional production targets in east-central Pembina are generally very poor producers (Fig. 3.9). It is likely that hydrocarbons immediately underlying conventionally produced reservoir were depleted during extensive conventional production and waterflooding. Based on this, we hypothesize that oil exploitation from bioturbated facies below effective conventional production targets (areas 1 4, Fig. 3.9) will be largely uneconomic. A third grouping of horizontal wells have been drilled greater than 5 km from the 2.5 m sandstone isopach contour and are considered to be largely unaffected by conventional oil production and associated enhanced oil recovery schemes. This part of the Pembina pool is referred to as a perm-oil play, and includes the majority of the wells drilled in W5, W5, and W5 (Fig. 3.9). Qualitative spatial analysis of horizontal production data within this zone does not reveal any discernable trends in relation to sandstone isopach data Bioturbated Facies Kgeometric In east-central Pembina, the K geometric of F2b and F2c is the most important control on production in unconventional light-tight halo-oil and perm-oil plays. This is because the horizontal wells are drilled into F2b and hydraulically fracked upward into F2c. The importance of bioturbated facies permeability is best shown when comparing K geometric of F2b and F2c to monthly oil production (m 3 ; Figure 3.12). Permeabilities of bioturbated facies from the wells drilled within the halo-oil plays (circles, Fig. 3.12) have a clear Gaussian relationship with respect to third-month oil production, with the lowest production rates coming from areas that have both very low (e.g. < 0.35 md) and very high (e.g. > 0.85 md) bioturbated facies (F2b and F2c) K geometric. As a result, an ideal range for future drilling is between 0.35 md > K geometric > 0.85 md (Figs and 3.13). For wells that have a bioturbated facies K geometric less than 0.35 md, is it hypothesized that production is poor because hydrocarbon migration is ineffective owing to limited connectively 70
80 between sandstone burrows and tempestites. Further, halo-oil play wells that have a bioturbated facies K geometric greater than 0.85 md have poor production because hydrocarbons were likely produced during the preceding 55 years of conventional production proximal to the halo-oil play areas. There is no definitive relationship between the K geometric of F2b and F2c and production from wells in the perm-oil play. That said, a weak and positive linear relationship does exist between production and increasing K geometric values (Fig. 3.12). However, as previously mentioned there is a clear contrasting relationship between perm-oil and halo-oil plays shown by Figure Perm-oil play wells have an average F2b, 2c K geometric that exceeds that of halo-oil play wells. The upper limit proposed for wells within the halo-oil play area does not apply to perm-oil play wells. 71

81 Figure 3.12: Bioturbated facies (F2b, c) versus monthly oil production (horizontal wells) Kgeometric of bioturbated facies (F2b and F2c) versus monthly oil production (3 rd month; m 3 ). The Kgeometric of F2b and F2c at the horizontal wells midpoint were interpolated from Figure These values were plotted against the 3 rd month total oil production. Circles correspond to horizontal wells drilled within defined halo-oil play areas and below conventional production, and crosses to wells drilled within perm-oil play areas. Sandstone thickness is coloured based on thicknesses 0 2 m, 2 3 m, and > 3 m (F3 and F4 combined thickness). A Gaussian curve best fits the production from halo-oil play wells, and a very poorly defined positive linear relationship fits perm-oil play wells. The area on the graph that encompasses the majority of the halo-oil and perm-oil play wells are coloured blue and green, respectively. The wells drilled within the halo are binned in Figure 3.13 showing the average production for all wells with specific bioturbated facies permeabilities. 72

82 Figure 3.13: Bioturbated facies permeability versus production bar graph Bar-graph of halo-oil play wells showing the average production for six binned bioturbated facies permeability groupings (see Fig. 3.12) Waterflooding and future exploitation potential in eastcentral Pembina Production versus F2b/F2c K geometric (Fig. 3.12) reveals the data spread between wells drilled proximal (<5 km) and distal (>5 km) to previously exploited conventional targets. While the focus of this study was wells located proximal (<5 km) to sandstone isopach thicks (i.e., halo-oil play where vertical well spacing was the most dense), analyses uncovered details or lack thereof about perm-oil play wells that were determined to exist near the NW and SE portions of the study area. Figure 3.14 highlights the areas that have the optimal reservoir properties for halo-oil play horizontal production in east-central Pembina. The dark blue areas indicate where the K geometric of bioturbated facies occurs within the optimal range of md, and the sandstone facies (F3 and F4) thicknesses are between 0.25 m and 2.5 m. Consequently, the dark blue areas that exist outside of effective conventional production targets are the optimal locations for exploiting light tight-oil within the halo (red polygons in Fig. 3.12). Where oil production has already commenced, 73
83 the dark blue areas are the ideal locations for initiating a waterflood in the tight-oil area (as the bioturbated facies permeabilities are adequate to support efficient horizontal sweep). Secondary targets include all areas colored light blue (in the optimal range of at least one of the reservoir properties evaluated) that exist outside of effective conventional production targets within the halo. Similarly, areas with poor well spacing should be targeted for initial primary horizontal production, whereas areas with dense well spacing should be targeted for horizontal waterflooding. The reservoir controls on production within the perm-oil play in east-central Pembina was not resolved with the analyses presented in this paper. As a result, no recommendation for future drilling targets within these zones can be put forward at this time. 74
; these areas are highlighted in dark blue.")
84 Figure 3.14: Final waterflood map Contour map showing the intersection between the ideal range for sandstone (F3, F4) thicknesses ( m) and bioturbated facies Kgeometric (0.35 md > Kgeometric > 0.85 md); these areas are highlighted in dark blue. The dark blue areas are the optimal locations for exploiting light tight-oil and therefore should be targeted for future horizontal production (where there is low horizontal well density, red boxes) and horizontal waterflooding (where there is high horizontal well density). The semi-transparent red blobs correspond to areas of high-density primary and secondary production, and are derived from Figure
85 3.6. Conclusions 1. The matrix in east-central Pembina had negligible permeability (<0.6 md) in all samples analyzed (Fig. 3.8B). 2. Sandstone burrows and tempestites in the southern portion of the study area have an order of magnitude lower permeabilities than equivalent deposits to the northeast. This is likely attributed to diagenetic and sedimentological variation across the field (downdip = tighter). 3. The best oil production comes from light tight-oil reservoirs with a K geometric of F2b and F2c between 0.35 md and 0.85 md (Fig. 3.12), and sandstone (F3 and F4) isopach thickness between 0.25 m and 2.5 m (Fig. 3.9). These areas form part of the halo-oil play of the Pembina-Cardium pool. 4. Future horizontal wells drilled within the halo at east-central Pembina should target zones that fall within the two ideal ranges listed above. Areas with low well spacing should be target for primary production via horizontal wells and multistage hydraulic fracturing, and areas with high well spacing should be targeted for horizontal waterflooding. The data and analyses presented herein provide an in-depth examination of horizontal production trends which exist in east-central Pembina. While future development in the basin should never consider one single reservoir property, this paper shows the clear correlation of sandstone isopach thicknesses and bioturbated facies permeability with horizontal production. The methodology employed herein provides a novel way to evaluate reservoirs which have extensive vertical and horizontal production, and to understand light tight-oil plays. It is recommended that this methodology by applied to smaller study areas when making decisions for future well placement due to the geological complexity of subsurface reservoirs. 76
86 Chapter 4. Conclusions Summary Technological advancements related to horizontal drilling and multi-stage hydraulic fracturing have resulted in a renewed interest in unconventional, lowpermeability, light-tight oil reservoirs. In particular, these advancements have allowed for the economic exploitation from the bioturbated lower to upper offshore muddy-sandstones to sandy-mudstones within the super-giant Pembina oil field. The analyses presented herein focus on the reservoir characteristics and trends of light-tight oil reservoirs in eastcentral Pembina, and also provide information on facies distributions and stratigraphic architecture. The techniques used can be applied to similar low-permeability fields as a way to better predict zones that should be targeted for the economic recovery of hydrocarbons. Analysis of 38 vertical wells within the study area revealed a total of five facies and two facies associations. This includes: 1) a silty mudstone (0 10% combined sandstone/siltstone); 2) bioturbated sandy mudstones to muddy sandstone (10 80% combined sandstone/siltstone); 3) massive to bioturbated sandstone with mudstone laminae and beds; 4) HCS sandstone; 5) and a clast to locally matrix-supported conglomerate. Facies 2 is being targeted in east-central Pembina and therefore was broken down into three subfacies to highlight ichnological, sedimentological, and lithological variations present (e.g., 10 30%, 30 50%, and 50 80% combined sandstone/siltstone). The facies associations were determined to represent sandying upwards shelf/ramp to upper delta front (middle shoreface equivalent) deposits, and conglomeratic transgressive deposits. Core analysis data and formation picks were compiled for 209 wells within eastcentral Pembina. These data were used to create contour maps in Surfer which highlighted the subsurface changes of selected reservoir properties. This includes porosities, permeabilities, facies thicknesses, as well as select combinations of these three reservoir properties (e.g., facies thickness (m) * porosity (ɸ). Once contoured maps were finalized, horizontal well mid-point positions were overlain. Spatial analysis of trends were conducted in order to determine the reservoir properties that had some degree of control on horizontal well production within east-central Pembina. Once this was completed, quantitative analysis was used in order to confirm or deny suspected reservoir 77
87 controls on production. The precise value of the reservoir property at the horizontal well mid-point was interpolated within the contouring software; which was determined to be representative of the entire horizontal well distance. This value was then graphically compared to set production intervals for that well (e.g., 1-month, 3-month, 6-month). Using the analysis presented above, it was determined that the most dominant controls on production were the sandstone facies isopach thickness (and therefore the proximity to conventional sandstone targets) and the permeability (K geometric) of the bioturbated facies (30 80% combined sandstone/siltstone exclusively) of which the optimal ranges were 0.25 m to 2.5 m and 0.35 md to 0.85 md respectively. Reservoir evaluations similar to the one presented in this thesis can be conducted on other reservoirs as a way to improve the understanding of production trends and results from horizontal wells. The work order undertaken in this study that could potentially be applied elsewhere includes the following steps: 1) facies analysis should be completed on a minimum of four equally spaced vertical wells within a single township (100 km 2 area). 2) To supplement logged intervals, a minimum of sixteen additional wells per township, with well-logs and preferably with core analysis data, should be analyzed. 3) Contour maps should be created which show the distribution of facies dependent core analysis data (e.g., porosity, permeability). 4) Available horizontal well midpoints should be plotted onto contour maps and reservoir data interpolated. 5) Interpolated reservoir data should then be plotted against available production data in order to deduce the reservoir properties and facies that have an impact on production from horizontal wells. Future wells drilled should adhere to significant reservoir trends deduced from the above analysis. The contribution to petroleum geoscience that this thesis makes is that it represents a new and unique way to evaluate large scale subsurface reservoir trends within fields that contain historical vertical well and core analysis data, as well as newly drilled horizontal well production data. 4.1 Study limitations and future work Limitations and potential sources of error related to the methodology and data availability existed during the undertaking of this study. This includes, but is not limited to: 1) errors related to facies well picks, specifically within older wells where only vintage E logs, micrologs and SP logs were available. 2) Contouring limitations related to imperfect well spacing within the study area (wells analyzed were chosen based on availability and 78
88 quality of core, core analysis, and well log profiles). 3) Limitations related to PDPK data, which only allowed for the analysis of unique features that were greater than 0.4 cm in diameter (burrows that were smaller than this were not measured). Similarly, horizontal and vertical burrows were not analyzed separately which limits the analysis of horizontal versus vertical permeability. 4) An arbitrary distance value of 5 km from conventional sandstone reservoirs, representing the distinction between halo-oil and perm-oil plays, and this break is only loosely based on quantified data. As a result it likely does not represent the definitive boundary between areas that are affected by extensive conventional oil production within east-central Pembina. Future work should focus on improving on some of the limitations and potential sources of error listed above. Additionally, the dataset used can be refined in order to provide recommendations for future horizontal wells drilled within east-central Pembina. It is recommended that the methodology presented in this thesis be applied to a smaller study area (< 400 km 2 ). Within a smaller study area, the well spacing should be decreased which will allow for a better representation (higher resolution) of how reservoir properties change in the subsurface. It is also recommended that future work improve on our understanding of horizontal and vertical changes in reservoir properties. As well, parasequences located between laterally continuous discontinuities should be evaluated individually, instead of being grouped into a single unit. Figure 3.5 highlights a well that has at least one stratigraphically significant surface (located within Facies 2) that likely has implications on horizontal wells drilled proximal to that boundary. Furthermore, additional stratigraphic work should be completed on determining the nature of surfaces (allogenic versus autogenic) as well as the degree of deltaic influence across the study area (based on the percentage of discrete mudstone laminae and beds). 79
89 4.1. References Arnott, R. W. C., 1992, The role of fluvial processes during the deposition of the (Cardium) Carrot Creek/ Cyn-Pem conglomerates: Bulletin of Canadian Petroleum Geology, v. 40, p Arnott, R. W. C., 2003, The role of fluid- and sediment-gravity flow processes during deposition of deltaic conglomerates (Cardium Formation, Upper Cretaceous), west-central Alberta: Bulletin of Canadian Petroleum Geology, v. 51, p Beach, F. K., 1955, Cardium a turbidity current deposit.: Journal of the Alberta Society of Petroleum Geologists, v. 3, p Bergman, K. M., and R. G. Walker, 1987, The importance of sea level fluctuations in the formation of linear conglomerate bodies; Carrot Creek Member of the Cardium Formation, Cretaceous Western Interior Seaway, Alberta, Canada: Journal of Sedimentary Petrology, v. 57, p Bergman, K. M., and R. G. Walker, 1988, Formation of Cardium erosional serface E5, and associated deposition of conglomerate: Carrot Creek Field, Cretaceous Interior Seaway, Alberta, in D. P. James, and D. A. Leckie, eds., Sequences, Stratigraphy, Sedimentology: Surface to Subsurface: Memoir, v. 15: Calgary, p Bhattacharya, J. P., and J. A. MacEachern, 2009, Hyperpycnal rivers and prodeltaic shelves in the Cretaceous seaway of North America: Journal of Sedimentary Research, v. 79, p Bloch, J., C. Schroder-Adams, D. A. Leckie, D. J. McIntyre, J. Craig, and M. Staniland, 1993, Revised stratigraphy of the lower Colorado Group (Albian to Turonian), Westen Canada: Bulletin of Canadian Petroleum Geology, v. 41, p Braunberger, W. F., and R. L. Hall, 2001a, Ammonoid faunas from the Cardium Formation (Turonian-Coniacian; Upper Ctretaceous) and contiguous units, Alberta, Canada: I. Scaphitidae: Canadian Journal of Earth Sciences, v. 38, p Braunberger, W. F., and R. L. Hall, 2001b, Ammonoid faunas from the Cardium Formation (Turonian-Coniacian; Upper Ctretaceous) and contiguous units, Alberta, Canada: II. Collignoniceratidae and Placenticeratidae: Canadian Journal of Earth Sciences, v. 38, p Clarkson, C. R., and P. K. Pedersen, 2011, Production Analysis of Western Canadian Unconventional Light Oil Plays: Canadian Unconventional Resources Conference, Calgary, Alberta., p
90 Clifton, H. E., and J. K. Thompson, 1978, Macaronichnus segregatis: a feeding structure of shallow marine polychaetes: Journal of Sedimentary Petrology, v. 48, p Cobban, W. A., C. E. Erdmann, R. W. Lemke, and E. K. Maughan, 1959, Revision of Colorado Group on Sweetgrass Arch Montana: Bulletin of the American Association of Petroleum Geologists, v. 43, p Dashtgard, S. E., M. B. E. Buschkuehle, B. Fairgrieve, and M. Berhane, 2008a, Geological characterization and potential for Carbon Dioxide (CO2) storage and enhanced oil recovery in the Cardium Formation, Pembina Field, west-central Alberta: Bulletin of Canadian Petroleum Geology, v. 56, p Dashtgard, S. E., and M. K. Gingras, 2007, Tidal controls on the morphology and sedimentology of gravel-dominated deltas and beaches: Examples from the megatidal Bay of Fundy, Canada: Journal of Sedimentary Research, v. 77, p Dashtgard, S. E., M. K. Gingras, and K. E. Butler, 2006, Sedimentology and stratigraphy of a transgressive, muddy gravel beach: Waterside Beach, Bay of Fundy, Canada: Sedimentology, v. 53, p Dashtgard, S. E., M. K. Gingras, and S. G. Pemberton, 2008b, Grain-size controls on the occurrence of bioturbation: Palaeogeography, Palaeoclimatology, Palaeoecology, v. 257, p Dashtgard, S. E., J. W. Snedden, and J. A. MacEachern, in press, Unbioturbated sediments on a modern mud-dominated shelf: evidence of hypoxia?: Palaeogeography, Palaeoclimatology, Palaeoecology. Dawson, W. C., 1978, Improvement of sandstone porosity during bioturbation: American Association of Petroleum Geologists Bulletin, v. 62, p DeWiel, J. E. F., 1956, Viking and Cardium Not Turbidity Current Deposits: Journal of the Alberta Society of Petroleum Geologists, v. 4, p Duke, W. L., 1985, Hummocky cross-stratification, tropical hurricanes, and intense winter storms: Sedimentology, v. 32, p ERCB, E. R. C. B., June 2011, Annual Reserves Data, in E. R. C. B. (ERCB), ed. Fathi, E., A. Tinni, and Y. I. Akkutlu, 2012, Correction to Klinkenberg slip theory for gas flow in nano-capillaries: International Journal of Coal Geology, v. 103, p Freeze, R. A., and J. A. Cherry, 1979, Groundwater, in Prentice-Hall, ed.: New Jersey. 81
91 Gelhar, L. W., 1986, Stochastic Subsurface Hydrology From Theory to Applications: Water Resources Research, v. 22, p Gingras, M. K., K. L. Bann, J. A. MacEachern, J. Waldron, and S. G. Pemberton, 2007, A conceptual framework for the application of trace fossils, in J. A. MacEachern, K. L. Bann, M. K. Gingras, and S. G. Pemberton, eds., Applied Ichnology, v. Short Course Notes 52: Tulsa, USA, SEPM (Society for Sedimentary Geology), p Gingras, M. K., and J. A. MacEachern, 1998, A comparitive analysis of the ichnology of wave- and river-dominated allomembers of the Upper Cretaceous Dunvegan Formation: Bulletin of Canadian Petroleum Geology, v. 46, p Gingras, M. K., C. A. Mendoza, and S. G. Pemberton, 2004a, Fossilized worm burrows influence the resource quality of porous media: American Assoication of Petroleum Geologists Bulletin, v. 88, p Gingras, M. K., S. G. Pemberton, C. A. Mendoza, and F. Henk, 1999, Assessing the anisotropic permeability of Glossifungites surfaces: Petroleum Sciences, v. 5, p Gingras, M. K., S. G. Pemberton, K. Muehlenbachs, and H. Machel, 2004b, Conceptual models for burrow-related, selective dolomitization with textural and isotopic evidence from the Tyndall Stone, Canada: Geobiology, v. 2, p Griffith, L. A., F. F. Krause, and T. A. Oliver, 1982, Cardium Formation, Alberta - exemplified by Ferrier Field: Cutler, W.G. (Ed.), Canada's Giant Hydrocarbon Reservoirs. Calgary, Alberta: Canadian Society of Petroleum Geologists, p Hall, R. L., F. F. Krause, S. D. Joiner, and K. B. Deutsch, 1994, Biostratigrahic evaluation of a sequence stratigraphic bounding surface: the Cardinal/Leyland unconformity ("E5/T5 surface") in the Cardium Formation (Upper Cretaceous; upper Turonian-lower Coniacian) at Seebe, Alberta: Bulletin of Canadian Petroleum Geology, v. 42, p Howes, B. J., 1988, Enhanced Oil Recovery in Canada: Success in Progress: Journal of Canadian Petroleum Technology, v. 27. Hsieh, A. I., D. M. Allen, and J. A. MacEachern, 2015, Statistical modelling of biogenically enhanced permeability in tight reservoir rock: Journal of Marine and Petroleum Geology, v. 65, p Irving, E., P. J. Wynne, and B. R. Globerman, 1993, Cretaceous paleolatitudes and overprints of North American craton, in W. G. E. C. a. E. G. Kauffman, ed., Evolution of the Western Interior Basin, v. 39, Geolological Association of Canada Special Paper, p
92 Krasey, R., 1985, A First-Look Method for Analyzing Mature Waterfloods: Journal of Canadian Petroleum Technology, v. 24, p Krause, F. F., K. B. Deutsch, S. D. Joiner, J. E. Barclay, R. L. Hall, and L. V. Hills, 1994, Chapter 23: Cretaceous Cardium Formation if the Western Canada Sedimentary Basin, in G. D. Mossop, and I. Shetson, eds., Geological Atlas of the Western Canada Sedimentary Basin: Calgary, Canada, Canadian Society of Petroleum Geologists and Alberta Research Council, p Krause, F. F., and D. A. Nelson, 1984, Storm event sedimentation: lithofacies associations in the Cardium Formation, Pembina area, west-central Alberta, Canada, in D. F. Stott, and D. J. Glass, eds., The Mesozoic of Middle North America: Memoir, v. 9: Calgary, p La Croix, A. D., M. K. Gingras, S. G. Pemberton, C. A. Mendoza, J. A. MacEachern, and R. T. Lemiski, 2013, Biogenically enhanced reservoir properties in the Medicine Hat gas field, Alberta, Canada: Marine and Petroleum Geology, v. 43, p Leggitt, S. M., R. G. Walker, and C. H. Eyles, 1990, Control of reservoir geometry and stratigraphic trapping by erosional surface E5 in the Pembina-Carrot Creek area, upper Cretaceous Cardium Formation, Alberta, Canada: American Association of Petroleum Geologists Bulletin, v. 74, p Lemiski, R. T., G. S. Pemberton, J. Hovikoski, and M. K. Gingras, 2011, Sedimentological, ichnological and reservoir characteristics of the lowpermeability, gas-charged Alderson Member (Hatton gas field, southwest Saskatchewan): Implications for resource development: Bulletin of Canadian Petroleum Geology, v. 59, p MacEachern, J. A., K. L. Bann, J. P. Bhattacharya, and C. D. J. Howell, 2005, Ichnology of deltas: Organism responses to the dynamic interplay of rivers, waves, storms, and tides, in L. Giosan, and J. P. Bhattacharya, eds., River Deltas - Concepts, Models, and Examples, v. Special Publication 83: Tulsa, USA, SEPM Society for Sedimentary Geology, p MacEachern, J. A., and M. K. Gingras, 2007, Recognition of brackish-water trace-fossil suites in the Cretaceous interior seaway of Alberta, Canada, in R. G. Bromley, L. A. Buatois, G. M. Mángano, J. F. Genise, and R. N. Melchor, eds., Sediment- Organism Interactions: A Multifaceted Ichnology, v. Special Publication No. 88: Tulsa, Oklahoma, SEPM, p MacEachern, J. A., G. S. Pemberton, M. K. Gingras, and K. L. Bann, 2010, Ichnology and Facies Models, Facies Models 4: St. Johns, Newfoundland & Labrador, Geological Association of Canada. 83
93 MacKenzie, W. T., 1975, Petrophysical study of the Cardium sand in the Pembina Field, 50th Annual meeting of the Society of Petroleum Engineers of AIME, Dallas, Texas, American Institute of Mining, Metallurgical, and Petroleum Engineers, Inc. MacKenzie, W. T., and D. A. Russum, 1976, The Pembina Field - Cardium Pool: Joint Convention on Enhanced Recovery: Core Conference, p Mulder, T., and J. P. M. Syvitski, 1995, Turbidity currents generated at river mouths during exceptional discharges to the world oceans: Journal of Geology, v. 103, p Nielsen, A. R., 1957, Cardium Statigraphy of the Pembina Field: Journal of the Alberta Society of Petroleum Geologists, v. 5, p Nielsen, A. R., and J. W. Porter, 1984, Pembina oil field - in retrospect, in D. F. Stott, and D. J. Glass, eds., The Mesozoic of middle North America: Memoir, v. 9: Calgary, p Parsons, H. E., 1955, Developments in Western Canada in 1954: Bulletin of the American Association of Petroleum Geologists, v. 39, p Parsons, H. E., and A. R. Nielsen, 1954, The Pembina Oil Field: Western Miner and Oil Review, v. 27, p Patterson, A. M., and A. A. Arneson, 1957, Geology of Pembina field, Alberta.: American Association of Petroleum Geologists Bulletin, v. 41, p Pemberton, S. G., and M. K. Gingras, 2005, Classification and characterizations of biogenically enhanced permeability: American Association of Petroleum Geologists Bulletin, v. 89, p Pemberton, S. G., and J. A. MacEachern, 1997, Ichnological signature of storm deposits; the use of trace fossils in event stratigraphy, in C. E. Brett, and G. C. Baird, eds., Paleontological Events; Stratigraphic, Ecological, and Evolutionary Implications: New York, USA, Columbia University Press, p Plint, A. G., and R. G. Walker, 1987, Cardium Formation 8. Facies and environments of the Cardium shoreline and coastal plain in the Kakwa field and adjacent areas, northwestern Alberta: Bulletin of Canadian Petroleum Geology, v. 35, p Plint, A. G., R. G. Walker, and K. M. Bergman, 1986, Cardium Formation 6. Stratigraphic framework of the Cardium in subsurface: Bulletin of Canadian Petroleum Geology, v. 34, p Plint, A. G., R. G. Walker, and W. L. Duke, 1988, An outcrop to subsurface correlation of the Cardium Formation in Alberta, in D. P. James, and D. A. Leckie, eds., 84
94 Sequences, Stratigraphy, Sedimentology: Surface and Subsurface: Memoir, v. 15: Calgary, p Plint, G. A., and J. H. S. Macquaker, 2013, Bedload transport of mud across a wide, storm influenced ramp: Cenomanian-Turonian Kaskapau Formation, Western Canada Foreland Basin Reply: Journal of Sedimentary Research, v. 83, p Plint, G. A., J. H. S. Macquaker, and B. L. Varban, 2012, Bedload transport of mud across a wide, storm influenced ramp: Cenomanian Turonian Kaskapau Formation, Western Canada Foreland Basin: Journal of Sedimentary Research, v. 82, p Reineck, H.-E., 1963, Sedimentgefüge im Bereich der südlichen Nordsee, v. 505: Stuttgart, Abhandlungen der Senckenbergischen Naturforschenden Gesellschaft, 138 p. Seilacher, A., 1974, Flysch trace fossils: Evolution of behavioral diversity in the deep sea: Neues Jahrbuch fur Geologie und Paläontologie, v. 4, p Shank, J. A., 2012, Sedimentology and Allostratigraphy of the Cardium Formation (Turonian-Coniacian) in Southern Alberta, And Equivalent Strata in Northern Montana, The University of Western Ontario, London, Ontario. Shepherd, M., 2009, Locating the Remaining Hydrocarbons, Oil Field Production Geology: AAPG Memoir, p Smith, D. G., 1994, Paleogeographic evolution of the Western Canada Foreland Basin, Geological Atlas of the Western Canada Sedimentary Basn: Edmonton, Alberta. Solano, N. A., F. F. Krause, and C. R. Clarkson, 2012, Quantification of cm-scale Heterogeneities in Tight-Oil Intervals of the Cardium Formation at Pembina, WCSB, Alberta, Canada, Society of Petroleum Engineers-Canadian Unconvetional Resources Conference, Calgary, Alberta, Canada. Stott, D. F., 1963, The Cretaceous Alberta Group and equivalent rocks, Rocky Mountain Foothills, Alberta, v. Memoir 317: Ottawa, Ontario, Geological Survey of Canada, 306 p. Swagor, N. S., T. A. Oliver, and B. A. Johnson, 1976, Carrot Creek field, central Alberta, in M. M. Lerand, ed., The Sedimentology of Selected Clastic Oil and Gas Reservoirs in Alberta: Calgary, Canada, Canadian Society of Petroleum Geologists, p Taylor, A. M., and R. Goldring, 1993, Descriptions and analysis of bioturbation and ichnofabric: Journal of the Geological Society (London), v. 150, p
95 Todd, M. R., and G. V. Grand, 1993, Enhanced Oil Recovery Using Carbon Dioxide: Energy Conversion and Management, v. 34, p Tonkin, N. S., D. McIlroy, R. Meyer, and A. Moore-Turpin, 2010, Bioturbation influence on reservoir quality: A case study from the Cretaceous Ben Nevis Formation, Jeanne d'arc Basin, offshore Newfoundland, Canada: AAPG Bulletin, v. 94, p Upton, G., and I. Cook, 1996, Understanding Statistics. Vossler, S. M., and S. G. Pemberton, 1988a, Ichnology of the Cardium Formation (Pembina Oilfield): Implications for depositional and sequence stratigraphic interpretations, in D. P. James, and D. A. Leckie, eds., Sequences, Stratigraphy, Sedimentology: Surface and Subsurface, v. Memoir 15: Calgary, Canadian Society of Petroleum Geologists, p Vossler, S. M., and S. G. Pemberton, 1988b, Skolithos in the Upper Cretaceous Cardium Formation: an ichnofossil example of opportunistic ecology: Lethaia, v. 21, p Wadsworth, J. A., and R. G. Walker, 1991, Morphology and origin of erosion surfaces in the Cardium Formation (Upper Cretaceous, Western Interior Seaway, Alberta) and their implications for rapid sea level flucuations: Canadian Journal of Earth Sciences, v. 28, p Walker, R. G., 1983a, Cardium Formation 1. "Cardium, A Turbidity Current Deposit" (Beach, 1955): A Brief History of Ideas: CSPG Reservoir, v. 31, p Walker, R. G., 1983b, Cardium Formation 2. Sand-body geometry and stratigraphy in the Garrington-Caroline-Ricinus area, Alberta - the "ragged blanket" model: Bulletin of Canadian Petroleum Geology, v. 31, p Walker, R. G., 1983c, Cardium Formation 3. Sedimentology and stratigraphy in the Garrington-Caroline area, Alberta: Bulletin of Canadian Petroleum Geology, v. 31, p Walker, R. G., 1985, Cardium Formation at Ricinus field, Alberta: a channel cut and filled by turbidity currents in Cretaceous Western Interior Seaway: American Association of Petroleum Geologists Bulletin, v. 69, p Walker, R. G., and C. H. Elyles, 1988, Geometry and facies of stacked shallow-marine sandier upward sequences dissected by erosion surface, Cardium Formation, Willesden Green, Alberta: American Assoication of Petroleum Geologists Bulletin, v. 72, p
96 Walker, R. G., and C. H. Eyles, 1991, Topography and Significance of a Basinwide Sequence-Bounding Erosion Surface in the Cretaceous Cardium Formation, Alberta, Canada.: Journal of Sedimentary Research, v. 61, p Warren, J. E., and H. S. Price, 1961, Flow in Heterogeneous Porous Media: Society of Petroleum Engineers Journal, v. 1, p Wheatcroft, R. A., 2000, Oceanic flood sedimentation: a new perspective: Continental Shelf Research, v. 20, p Wiener, O., 1912, The theory of composites for the field of steady flow. First treatment of mean value estimates for force, polarization and energy: Abhandlungen der mathematischphysischen Klasse der Koniglich Gesellschoftder Wissenschoften, v. 32, p Williams, G. D., and C. R. Stelck, 1975, Speculations on the Cretaceous paleogeography of North America, in W. G. E. Caldwell, ed., The Cretaceous System in the Western Interior of North America, v. Special Paper 13: St. John's, Canada, Geological Assocation of Canada, p Wright, M. E., and R. G. Walker, 1981, Cardium Formation (U. Cretaceous) at Seebe, Alberta - storm-transported sandstones and conglomerates in shallow marine depositional environments below fair-weather wave base: Canadian Journal of Earth Sciences, v. 18, p Zenger, D. H., 1992, Burrowing and dolomitization patterns in the Steamboat Point Member, Bighorn Dolomite (Upper Ordivician), northeast Wyoming.: Contributions to Geology, v. 29, p
97 Appendices 88
98 Appendix A: AppleCore Well Logs 89
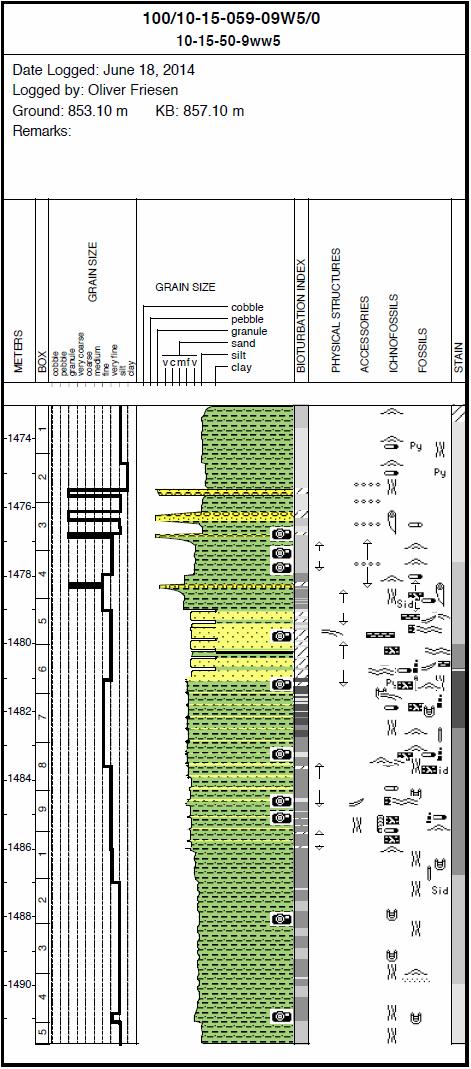
99 90
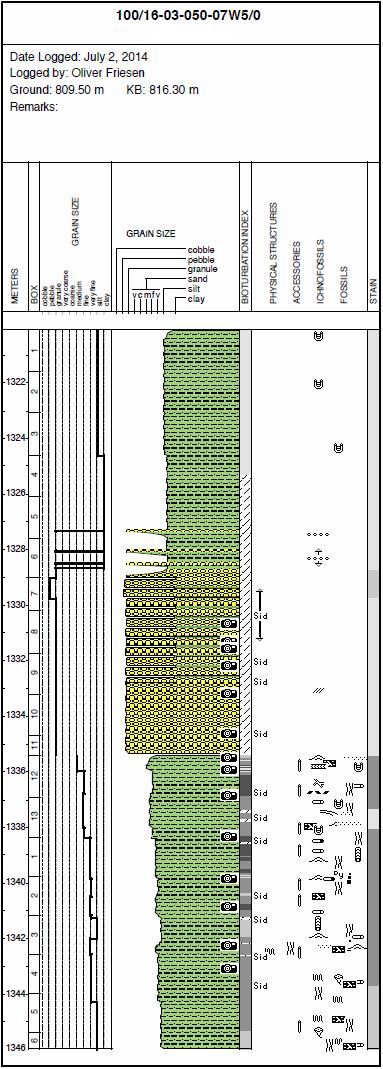
100 91
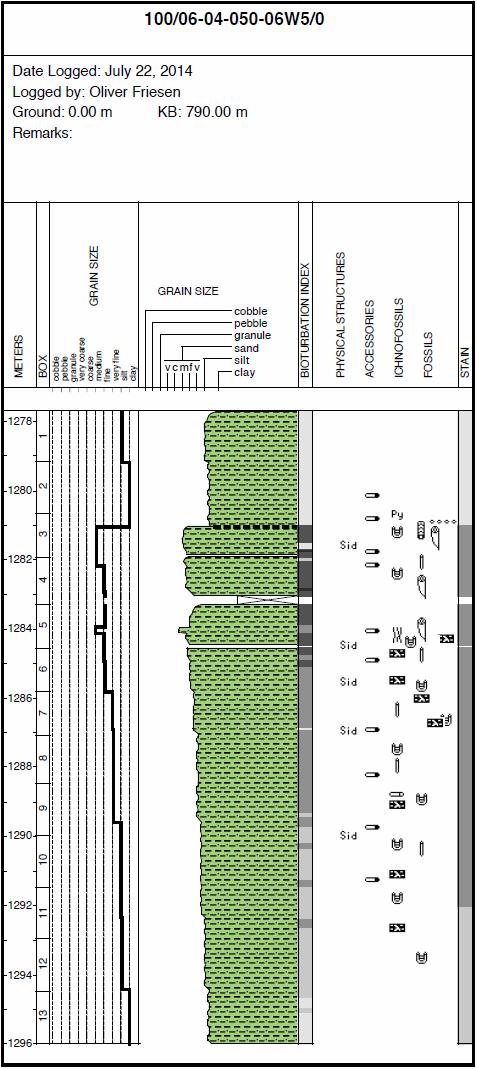
101 92
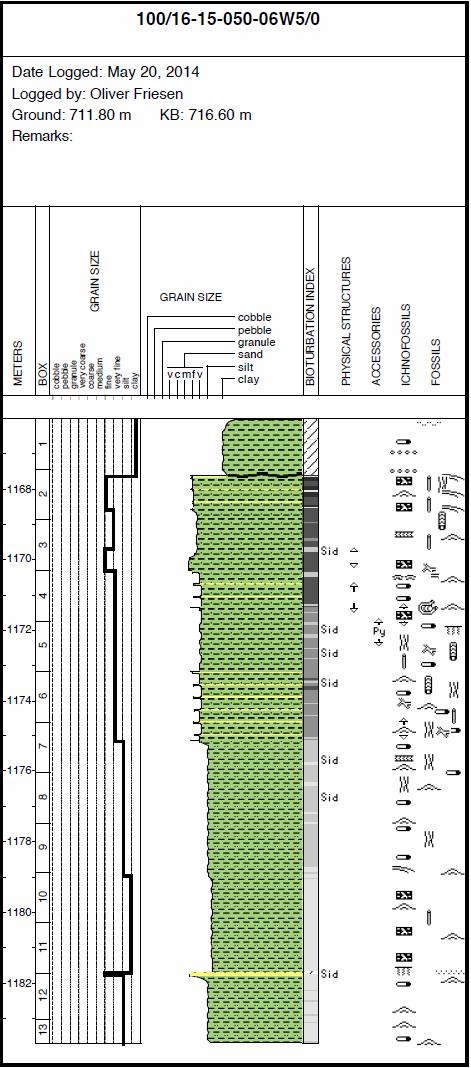
102 93
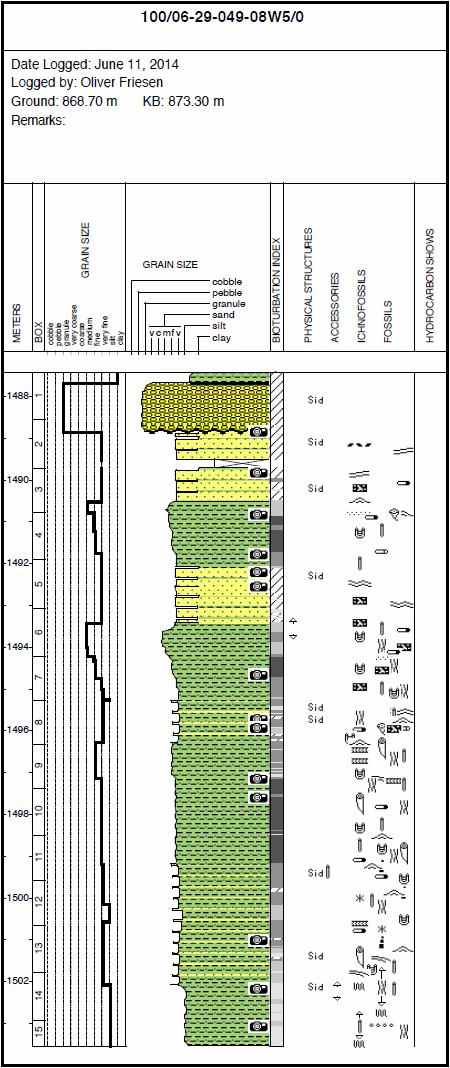
103 94

104 95

105 96

106 97

107 98
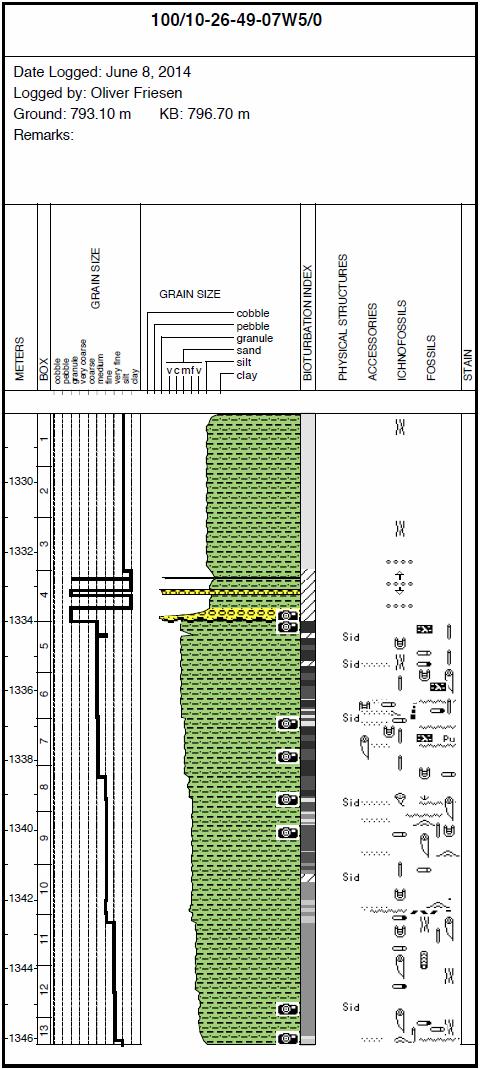
108 99
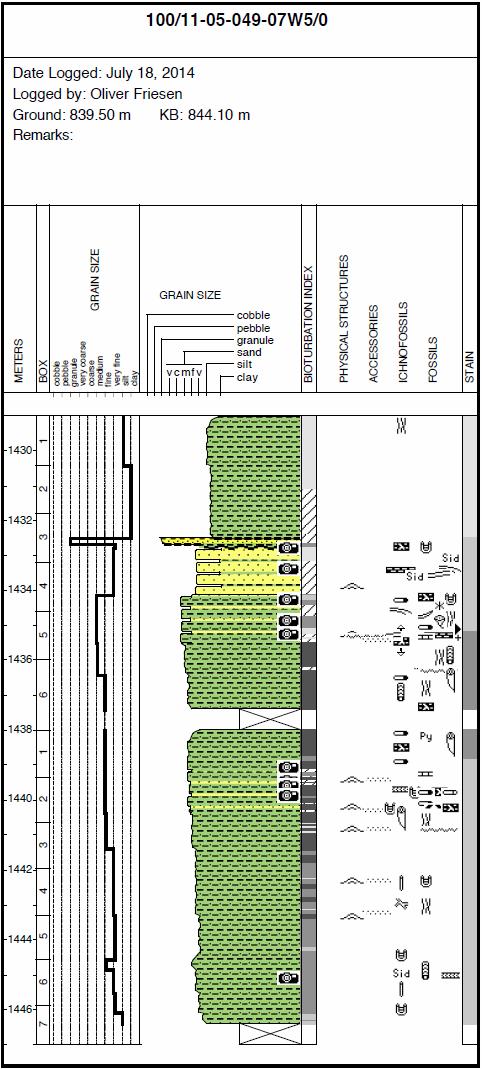
109 100
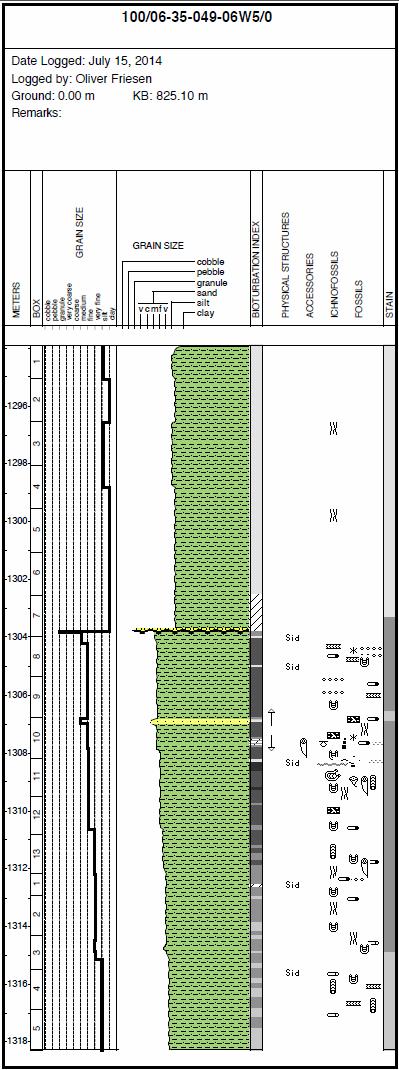
110 101
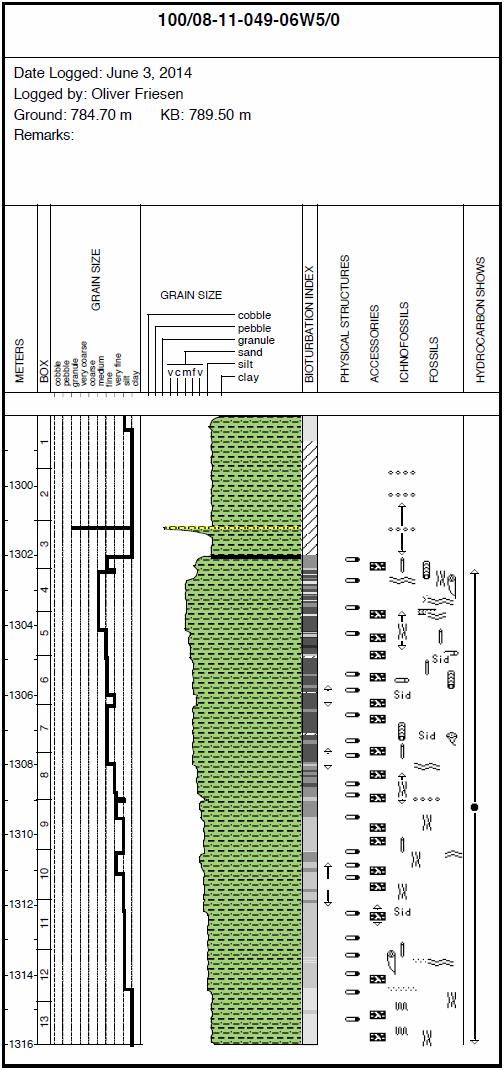
111 102
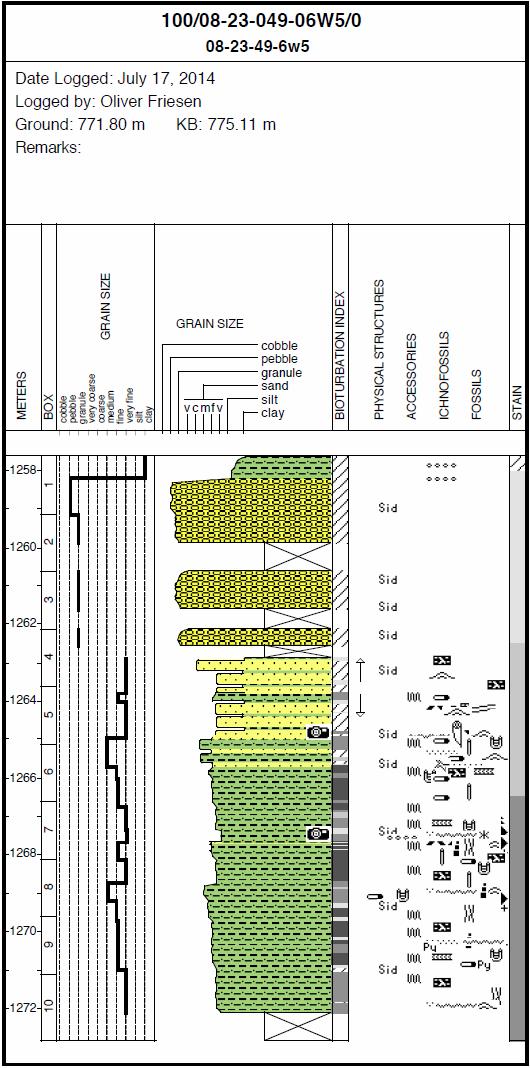
112 103
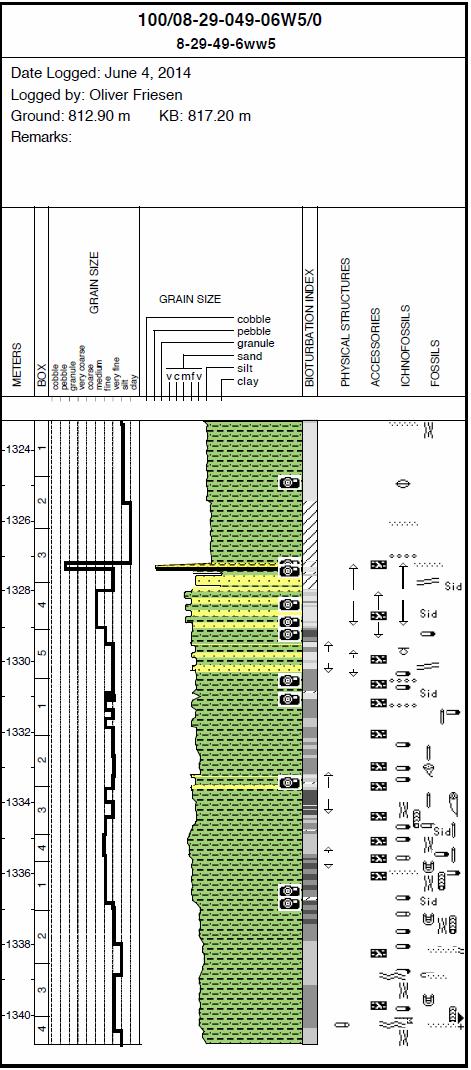
113 104
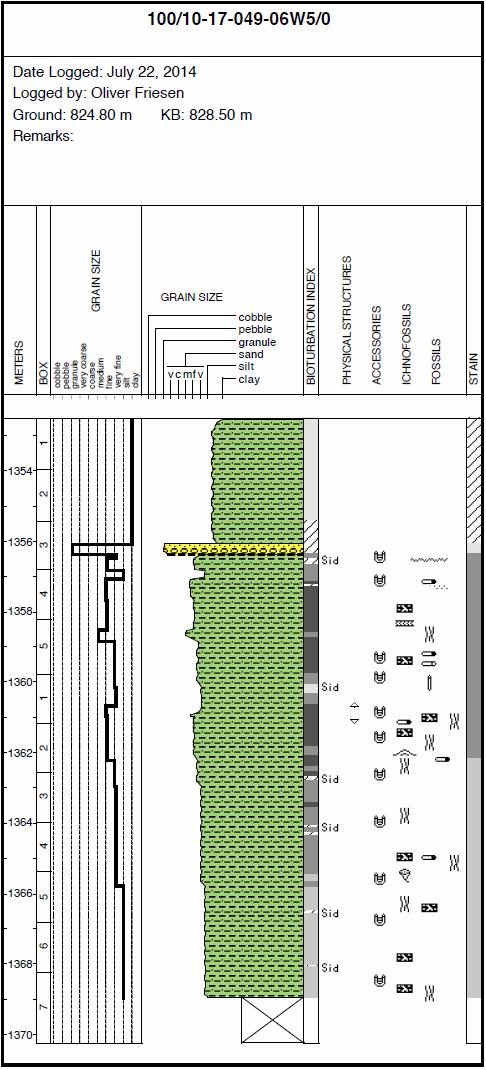
114 105
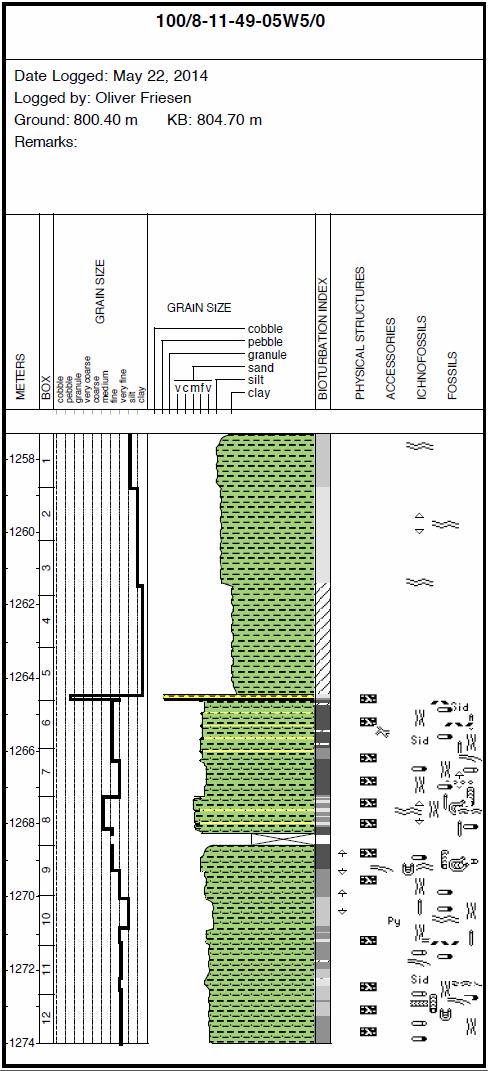
115 106

116 107
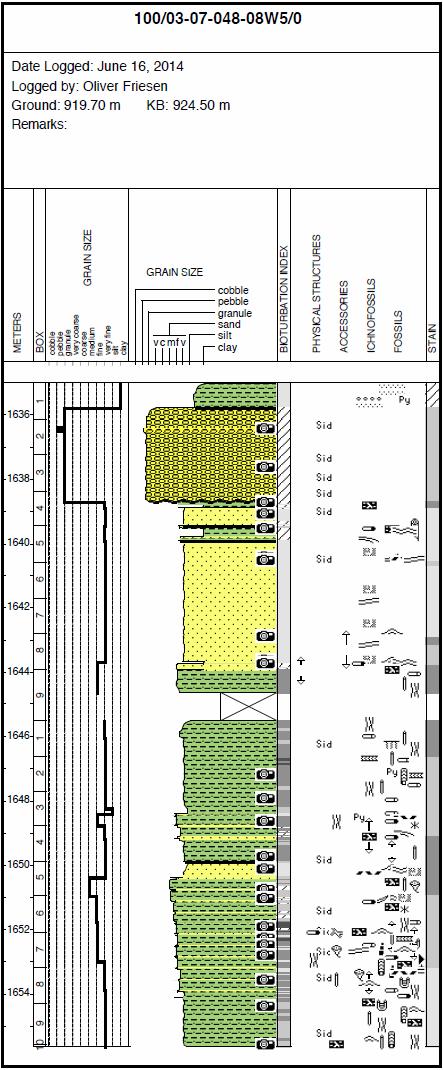
117 108
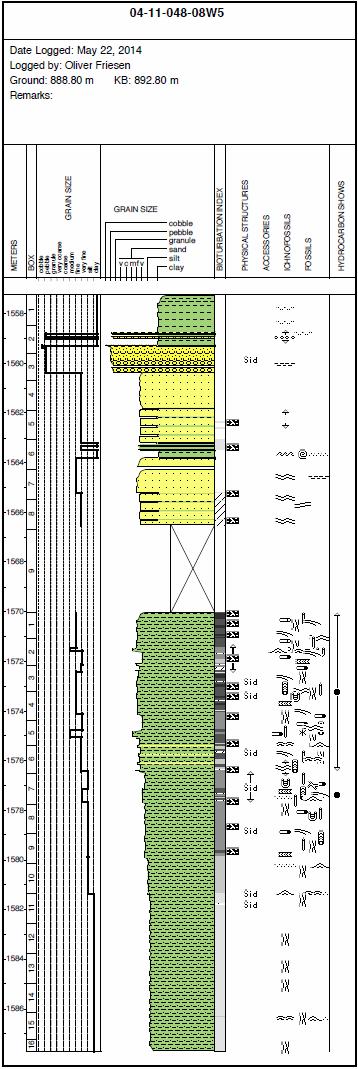
118 109

119 110

120 111
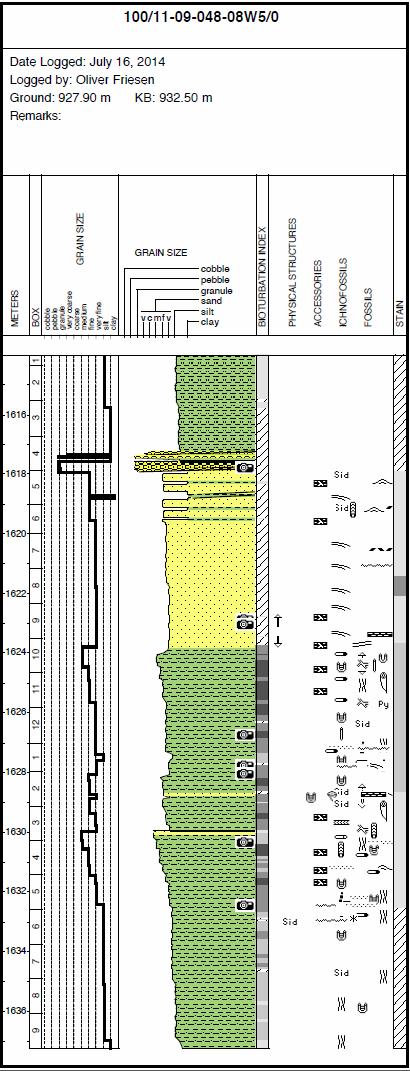
121 112
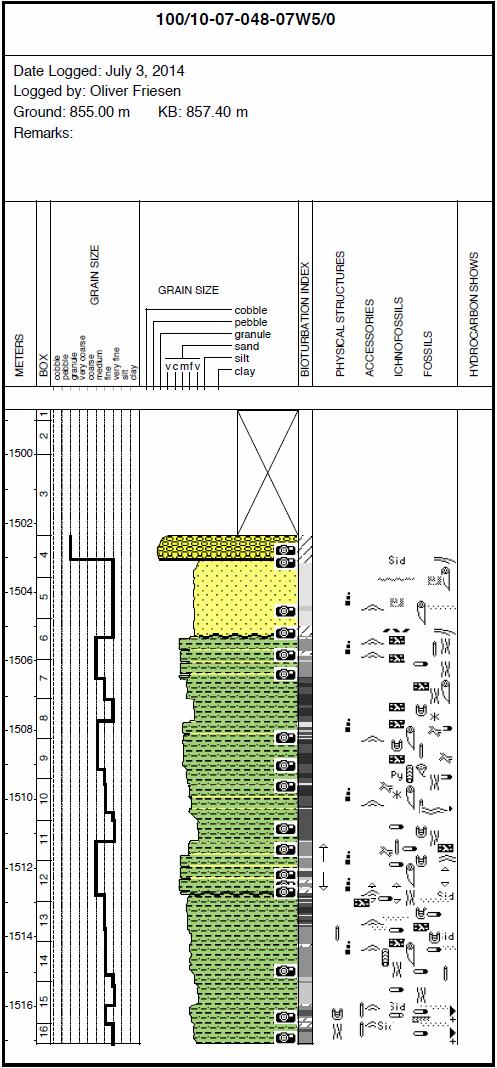
122 113
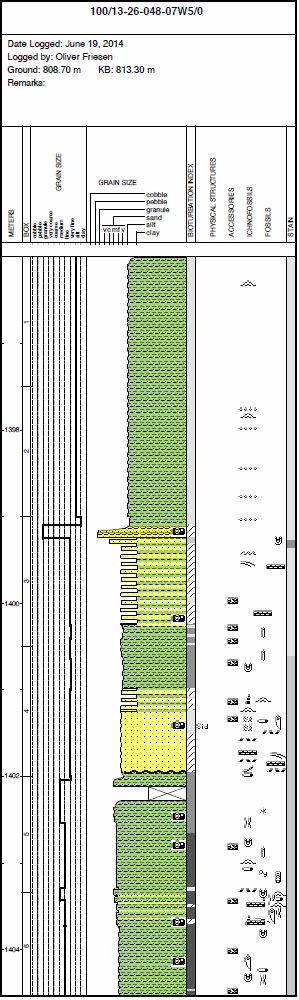
123 114
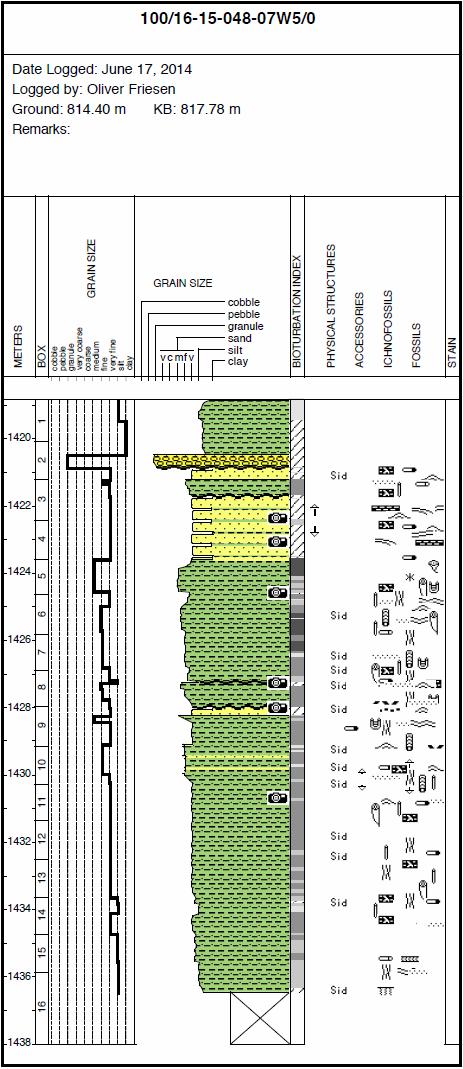
124 115
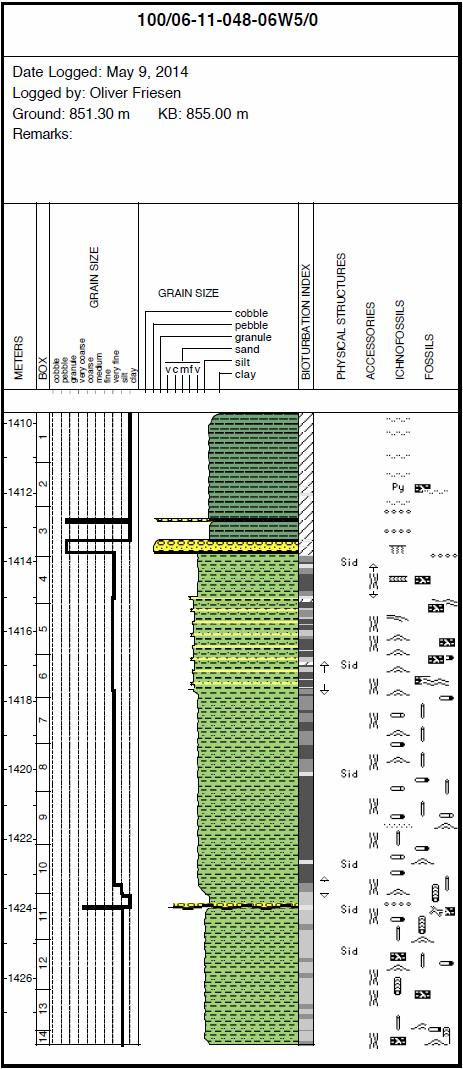
125 116
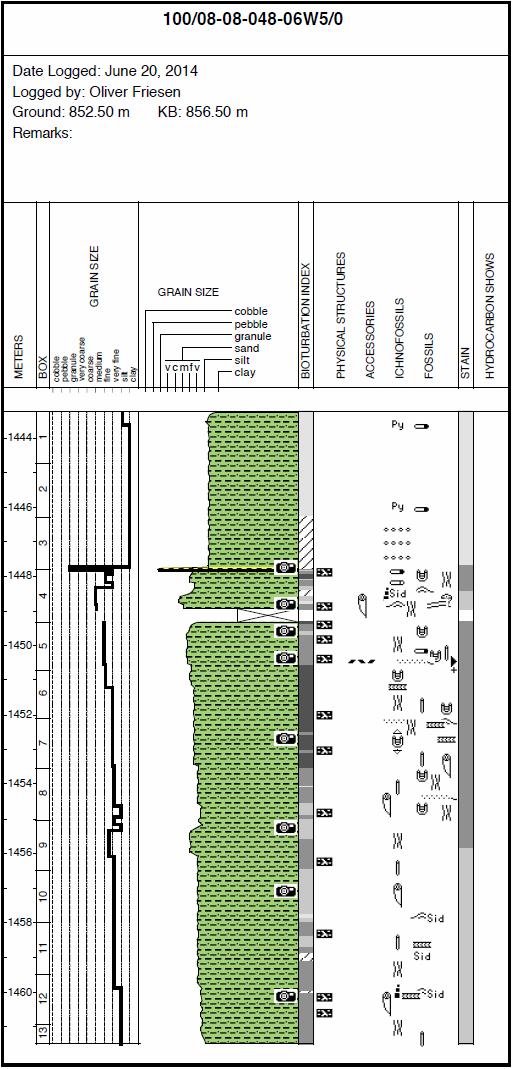
126 117
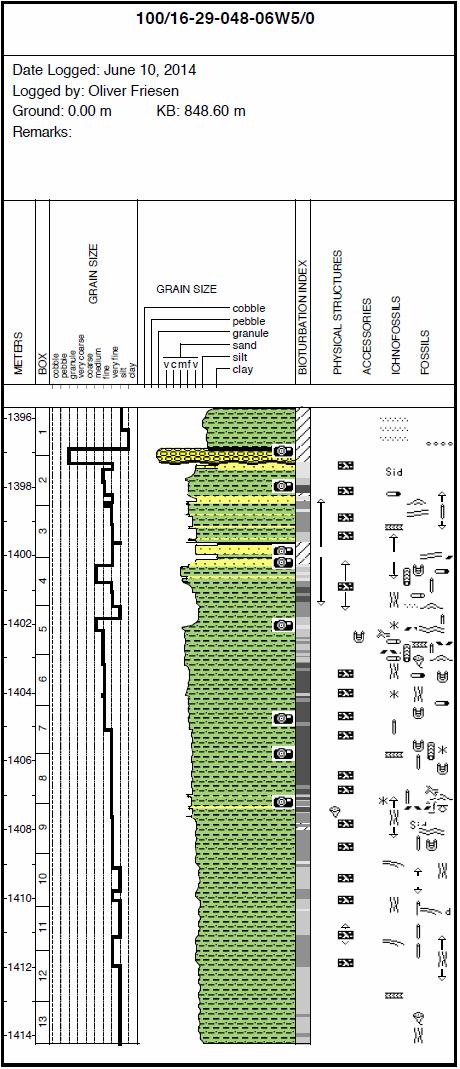
127 118
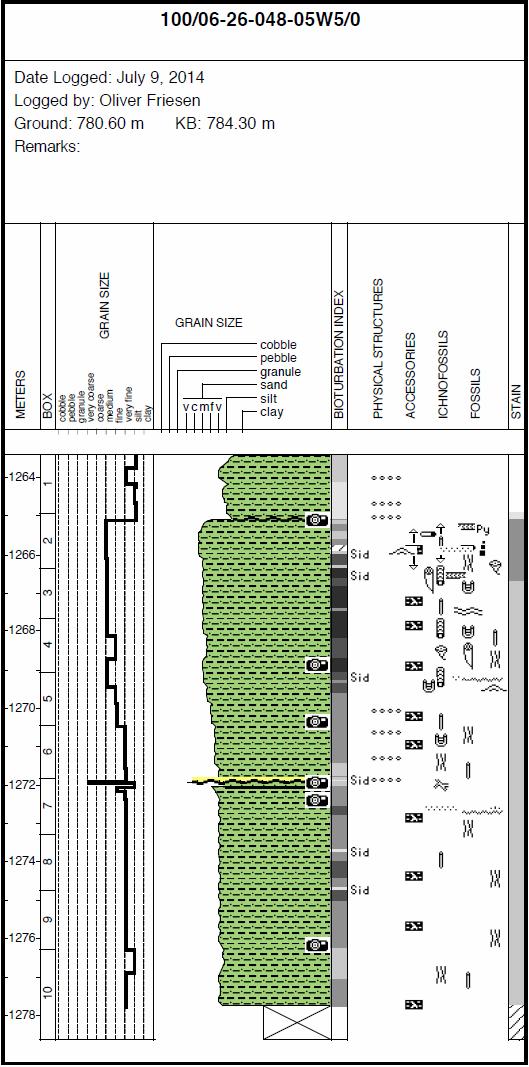
128 119
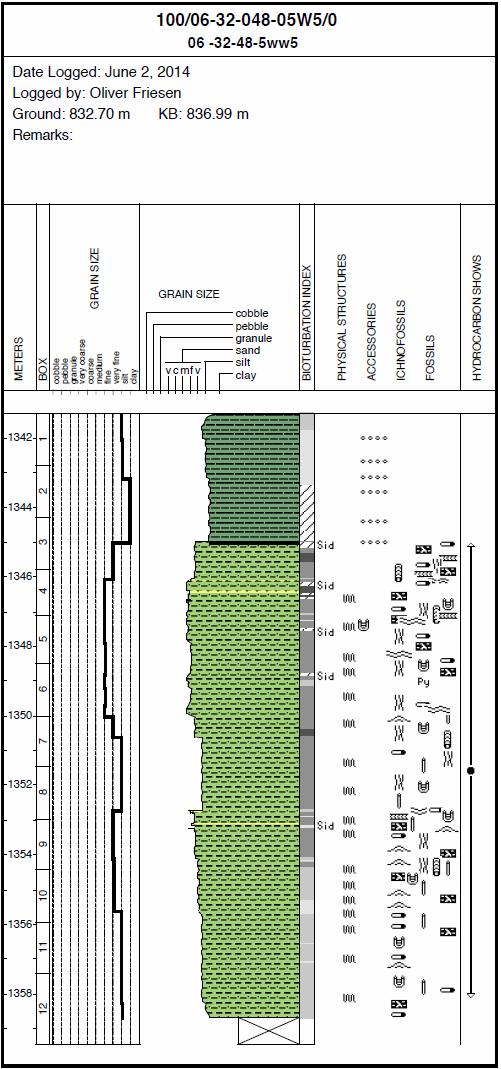
129 120
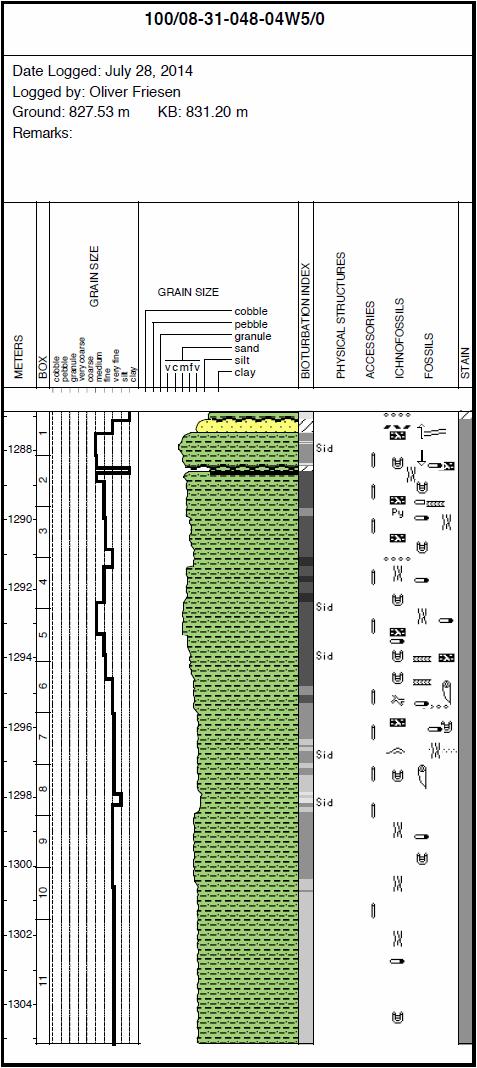
130 121
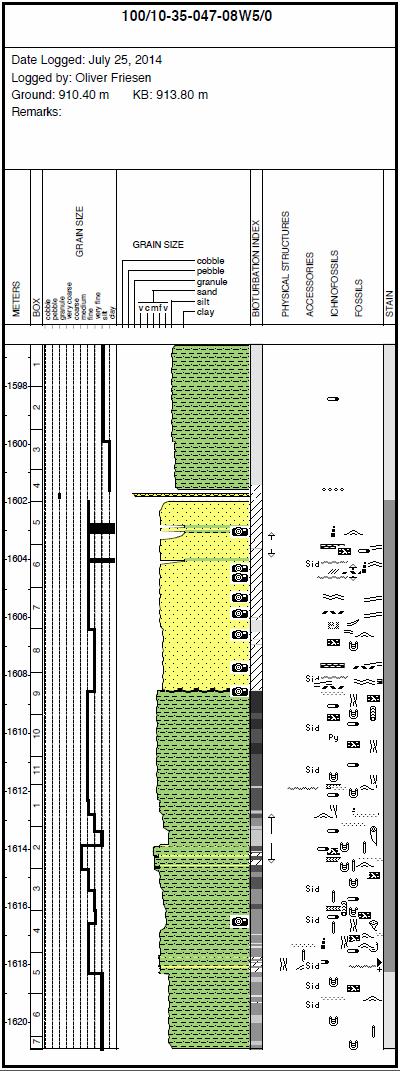
131 122
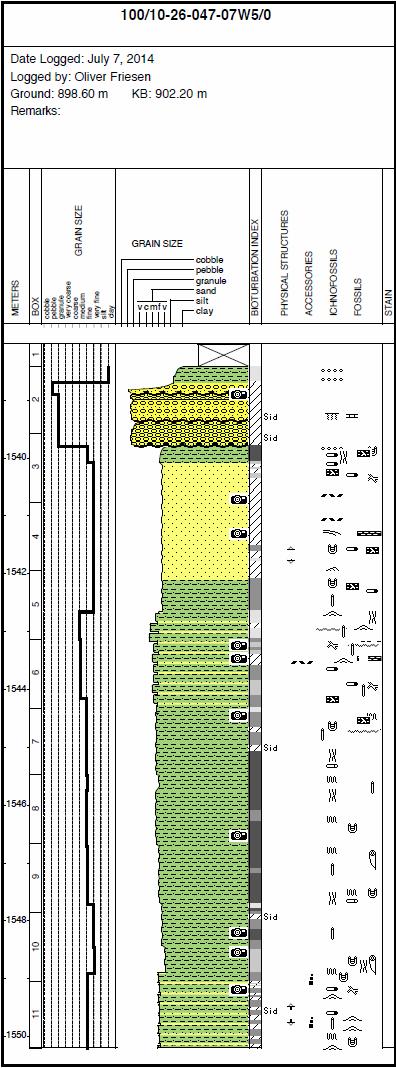
132 123

133 124
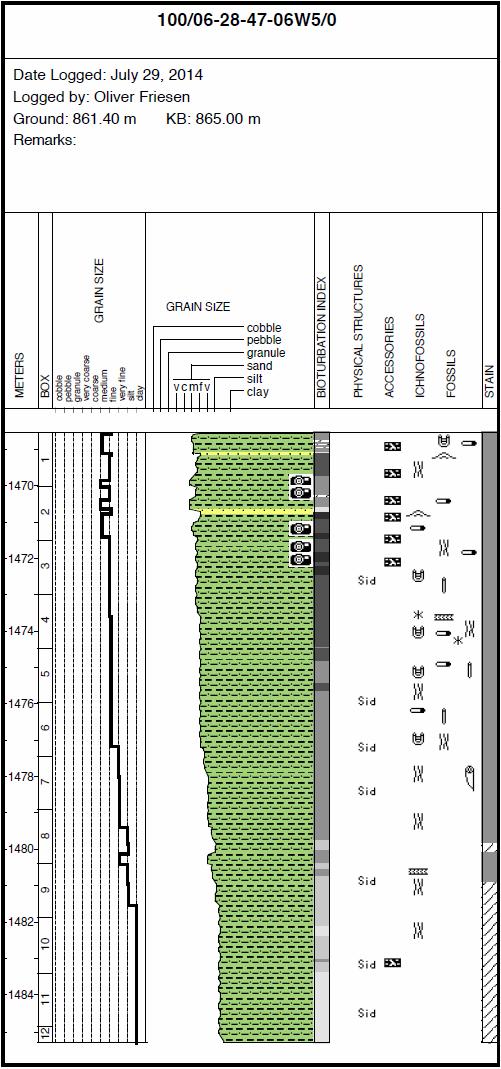
134 125

135 126
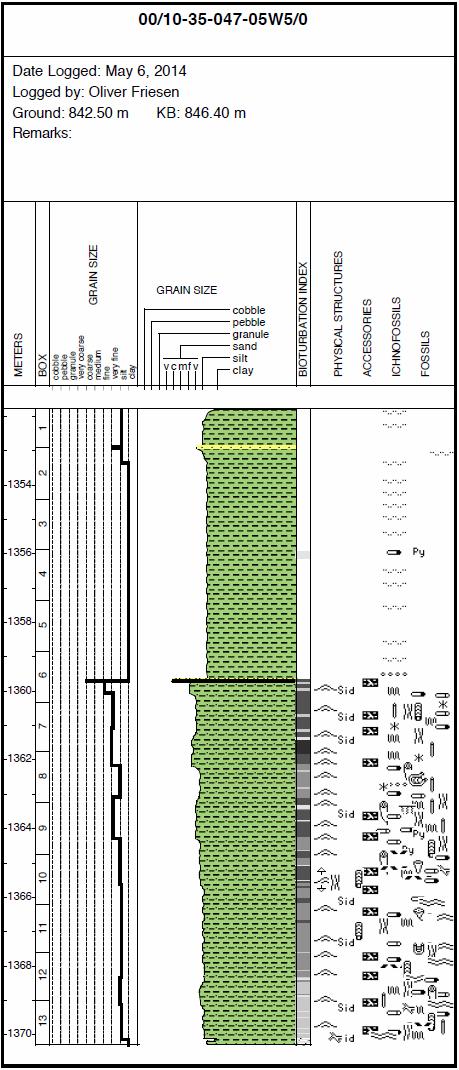
136 127
Sedimentary and Stratigraphic Analysis of the Viking Sand in the Edgerton/Wainwright Area, Central Alberta* By Russell Walz 1
 Sedimentary and Stratigraphic Analysis of the Viking Sand in the Edgerton/Wainwright Area, Central Alberta* By Russell Walz 1 Search and Discovery Article #50030 (2006) Posted June 25, 2006 *Extended abstract
UNIVERSITY OF CALGARY. High Resolution Sequence Stratigraphy and Reservoir Characterization of Shoreline Deposits of
 UNIVERSITY OF CALGARY High Resolution Sequence Stratigraphy and Reservoir Characterization of Shoreline Deposits of the Cardium Formation at West Pembina, Alberta by J. ADAM FRASER A THESIS SUBMITTED TO
Facies Analysis of the Lower Cretaceous Wilrich Member (Lower Falher) of the Spirit River Formation.
 of the Spirit River Formation.") Facies Analysis of the Lower Cretaceous Wilrich Member (Lower Falher) of the Spirit River Formation. Kerrie L. Bann, Ichnofacies Analysis Inc. and Daniel J. K. Ross, Tourmaline Oil Corp. Historically,
Facies Analysis of the Lower Cretaceous Wilrich Member (Lower Falher) of the Spirit River Formation. Kerrie L. Bann, Ichnofacies Analysis Inc. and Daniel J. K. Ross, Tourmaline Oil Corp. Historically,
Viking Lowstand Deposits in West Central Saskatchewan: Depositional Model for the Reservoir Units in Dodsland-Hoosier Area, Saskatchewan, Canada
 Viking Lowstand Deposits in West Central Saskatchewan: Depositional Model for the Reservoir Units in Dodsland-Hoosier Area, Saskatchewan, Canada Hasan Ferdous* PetroSed Geoconsulting Resources, Calgary,
The Wilrich Member, Alberta deep basin: An example of a topsetdominated delta deposited into a low-accommodation shallow sea.
 The Wilrich Member, Alberta deep basin: An example of a topsetdominated delta deposited into a low-accommodation shallow sea. Kerrie Bann & Michael Fawcett Ichnofacies Analysis Inc. & Tourmaline Oil Corp.
The Clearwater Formation: A Facies Study for SAGD Water Source in the Athabasca Oil Sands
 The Clearwater Formation: A Facies Study for SAGD Water Source in the Athabasca Oil Sands Wallace, J. and Lavigne, J Introduction Water source has become an increasingly important issue recently with the
ALBERTA S CARDIUM OIL AND THE EVOLUTION OF CUTOFFS AND EVALUATION PROCEDURES IN RESPONSE TO HORIZONTAL DRILLING
 ALBERTA S CARDIUM OIL AND THE EVOLUTION OF CUTOFFS AND EVALUATION PROCEDURES IN RESPONSE TO HORIZONTAL DRILLING Alberta s Cardium Oil and the Evolution of Cutoffs and Evaluation Procedures in Miranda Stoffman,
Transgressive Shoreline Deposits of the Lower Cretaceous (Albian) Bluesky Formation in the Boyer and Steen Field Areas of Northwestern Alberta*
 Bluesky Formation in the Boyer and Steen Field Areas of Northwestern Alberta*") Transgressive Shoreline Deposits of the Lower Cretaceous (Albian) Bluesky Formation in the Boyer and Steen Field Areas of Northwestern Alberta* Shaun O Connell 1 Search and Discovery Article #2298 (215)
Transgressive Shoreline Deposits of the Lower Cretaceous (Albian) Bluesky Formation in the Boyer and Steen Field Areas of Northwestern Alberta* Shaun O Connell 1 Search and Discovery Article #2298 (215)
Facies Analysis Of The Reservoir Rocks In The. Sylhet Trough, Bangladesh. Abstract
 Facies Analysis Of The Reservoir Rocks In The Sylhet Trough, Bangladesh Joyanta Dutta Petroleum Geoscience Program, Department of Geology, Faculty of Science, Chulalongkorn University, Bangkok 10330, Thailand
AAPG Search and Discovery Article #90173 CSPG/CSEG/CWLS GeoConvention 2011, Calgary, Alberta, Canada, May 9-11, 2011
 Use of Image Logs in Differentiating Point Bar and Tidal Bar Deposits in the Leismer Area: Implications for SAGD Reservoir Definition in the Athabasca Oilsands Howard Brekke and Andrew Couch Introduction
Michael D. Hearn* and S. George Pemberton Ichnology Research Group, University of Alberta, Edmonton, AB, T6G 2E3
 Wave and River-Dominated Deltaic Deposits in the Lower Cretaceous (Neocomian) Kamik Formation in the Parsons Lake Gas Field, Mackenzie Delta Region, Northwest Territories Michael D. Hearn* and S. George
Depositional Facies of Plover Formation in the Abadi Field, Eastern Indonesia Based on Core Sedimentology*
 Depositional Facies of Plover Formation in the Abadi Field, Eastern Indonesia Based on Core Sedimentology* Aswan Aswan 1, Yahdi Zaim 1, Koichi Kihara 2, and Kukuh Hadianto 3 Search and Discovery Article
High-resolution Sequence Stratigraphy of the Glauconitic Sandstone, Upper Mannville C Pool, Cessford Field: a Record of Evolving Accommodation
 Page No. 069-1 High-resolution Sequence Stratigraphy of the Glauconitic Sandstone, Upper Mannville C Pool, Cessford Field: a Record of Evolving Accommodation Thérèse Lynch* and John Hopkins, Department
Lab 8: Facies Analysis and Correlations: Sequence Stratigraphy in the Book Cliffs, Utah
 Geology 109L Lab 8: Facies Analysis and Correlations: Sequence Stratigraphy in the Book Cliffs, Utah Goal: In this lab, you will put together your knowledge of near-shore facies and sequence stratigraphy
The unknown giants - low-permeability shallow gas reservoirs of southern Alberta and Saskatchewan, Canada.
 The unknown giants - low-permeability shallow gas reservoirs of southern Alberta and Saskatchewan, Canada. Shaun O'Connell* Belfield Resources Inc., Calgary belfield@shaw.ca ABSTRACT The gas reserves contained
Geologic influence on variations in oil and gas production from the Cardium Formation, Ferrier Oilfield, west-central Alberta, Canada
 Geologic influence on variations in oil and gas production from the Cardium Formation, Ferrier Oilfield, west-central Alberta, Canada Marco Venieri and Per Kent Pedersen Department of Geoscience, University
Dakota Sandstone. of the Moxa Arch and Surrounding Green River Basin
 Dakota Sandstone of the Moxa Arch and Surrounding Green River Basin Dakota Sandstones of the Green River Basin Overview The Dakota sandstones of the Moxa Arch and surrounding Green River Basin remain attractive
Depositional Sequences Sequences
 Depositional Sequences Transgressive and Regressive packages can be bound by unconformities Because sediment can only be preserved during net aggradation and progradation All other times there is either
Fluid-Mud Deposits of the Lower Jurassic Tilje Formation, Offshore Mid-Norway By Aitor A. Ichaso and Robert W. Dalrymple 1
 Fluid-Mud Deposits of the Lower Jurassic Tilje Formation, Offshore Mid-Norway By Aitor A. Ichaso and Robert W. Dalrymple 1 Search and Discovery Article #50107 (2008) Posted August 10, 2008 *Adapted from
Modeling Lateral Accretion in McMurray Formation Fluvial- Estuarine Channel Systems: Grizzly Oil Sands May River SAGD Project, Athabasca
 Modeling Lateral Accretion in McMurray Formation Fluvial- Estuarine Channel Systems: Grizzly Oil Sands May River SAGD Project, Athabasca Duncan Findlay, Thomas Nardin, Alex Wright, Raheleh Salehi Mojarad
Sediment and sedimentary rocks Sediment
 Sediment and sedimentary rocks Sediment From sediments to sedimentary rocks (transportation, deposition, preservation and lithification) Types of sedimentary rocks (clastic, chemical and organic) Sedimentary
Core Examples from Modern Estuarine Tidal Bars, Tillamook Bay, Oregon
 Core Examples from Modern Estuarine Tidal Bars, Tillamook Bay, Oregon Rares Bistran* University of Alberta, Edmonton, Alberta, Canada rares.bistran@ualberta.ca David Herbers, Murray Gingras, John-Paul
Unbioturbated Marine Mudstones: Environmental Stress or Rapid Deposition? A Worked Example from the Ordovician Beach Formation, Newfoundland, Canada*
 Unbioturbated Marine Mudstones: Environmental Stress or Rapid Deposition? A Worked Example from the Ordovician Beach Formation, Newfoundland, Canada* Dario Harazim 1, Duncan McIlroy 1, Joe Macquaker 1,
GeoCanada 2010 Working with the Earth
 Lithofacies Identification and the Implications for SAGD Well Planning in the McMurray Formation, Christina Lake Area, Alberta Travis Shackleton*, Robert Gardner, Sung Youn, Grace Eng and Lori Barth Cenovus
Accommodation. Tectonics (local to regional) Subsidence Uplift
 Subsidence Uplift") Accommodation Accommodation varies over time; it is the distance between a reference horizon and the sea surface (i.e. relative sea level). The space to be filled in with sediments or water What are the
Accommodation Accommodation varies over time; it is the distance between a reference horizon and the sea surface (i.e. relative sea level). The space to be filled in with sediments or water What are the
Paleo Lab #4 - Sedimentary Environments
 Paleo Lab #4 - Sedimentary Environments page - 1. CHARACTERISTICS OF SEDIMENT Grain size and grain shape: The sizes and shapes of sedimentary particles (grains) are modified considerably during their transportation
David Piper and Atika Karim ABSTRACT
 David Piper and Atika Karim ABSTRACT Hyperpycnal flow deposits, or delta-front turbidites, are becoming increasingly recognised as important components of some deltaic systems. The presence of Bouma Tabce
Sediment and Sedimentary rock
 Sediment and Sedimentary rock Sediment: An accumulation of loose mineral grains, such as boulders, pebbles, sand, silt or mud, which are not cemented together. Mechanical and chemical weathering produces
UPPER MANZANILLA FORMATION AT FISHING POND VILLAGE FIELDTRIP GUIDE
 UPPER MANZANILLA FORMATION AT FISHING POND VILLAGE FIELDTRIP GUIDE Saturday 10 th March 2012 Trip Leader: Georgia Huggins INTRODUCTION MANZANILLA Formation Author of name: WARING (G.A.) (1926.). The geology
Sup. Mat. 1. Figure DR1. Map showing the distribution of the Vanrhynsdorp Group. 02
 GSA DATA REPOSITORY 2013142 Buatois, Almond and Germs Treptichnus pedum - List of supplementary materials: Sup. Mat. 1. Figure DR1. Map showing the distribution of the Vanrhynsdorp Group. 02 Sup. Mat.
EARTH SURFACE PROCESSES AND SEDIMENTATION!
 Sed and Strat EARTH SURFACE PROCESSES AND SEDIMENTATION! 2/27 Lecture 7- Exposure: Weathering and the Sediment Factory 3/04 Lecture 8 - Rivers and Landscapes 3/06 Lecture 9 - Waves (not Tides) 3/11 Lecture
Image: G. Parker. Presenters: Henry Chan, Kayla Ireland, Mara Morgenstern, Jessica Palmer, Megan Scott
 Image: G. Parker Presenters: Henry Chan, Kayla Ireland, Mara Morgenstern, Jessica Palmer, Megan Scott Is the Ross Formation a suitable analog for sand-rich turbidite plays in passive margin basins? Play:
LOWER GRAND RAPIDS BITUMEN POOLS AT COLD LAKE, ALBERTA VARIATIONS IN STRATIGRAPHIC SETTING AND DEPOSITIONAL ENVIRONMENTS
 RAPIDS BITUMEN POOLS AT COLD LAKE, ALBERTA VARIATIONS IN STRATIGRAPHIC SETTING AND DEPOSITIONAL ENVIRONMENTS Brad J. Hayes, Petrel Robertson Consulting Ltd. Garrett M. Quinn, OSUM Oil Sands Corp. Summary
Bulletin of Earth Sciences of Thailand
 Depositional Environments and Stratigraphic Development of the Grand Taman Sari Circuit Outcrop: an Analogue for Transgressive Mahakam Delta Successions Ridha Santika Riadi Petroleum Geoscience Program,
SEPM Society for Sedimentary Geology
 SEPM Society for Sedimentary Geology 4111 S Darlington Suite 100 Tulsa, Oklahoma 74135 USA Phone: 918-610-3361 Fax: 918-621-1685 www.sepm.org This PDF Content is made available by SEPM Society for Sedimentary
Modeling Lateral Accretion in McMurray Formation Fluvial-Estuarine Channel Systems: Grizzly Oil Sands May River SAGD Project, Athabasca*
 Modeling Lateral Accretion in McMurray Formation Fluvial-Estuarine Channel Systems: Grizzly Oil Sands May River SAGD Project, Athabasca* Duncan Findlay 1, Thomas Nardin 1, Alex Wright 1, and Raheleh Salehi
Sediment. Weathering: mechanical and chemical decomposition and disintegration of rock and minerals at the surface
 Sediment Some basic terminology Weathering: mechanical and chemical decomposition and disintegration of rock and minerals at the surface Erosion: removal of weathered rock and minerals from one place to
Hydrocarbon Distribution in the Mannville Waseca Member, Edam Oil Field, West-central Saskatchewan
 Hydrocarbon Distribution in the Mannville Waseca Member, Edam Oil Field, West-central Saskatchewan Peter Hill 1 Information from this publication may be used if credit is given. It is recommended that
Continuity and Compartmentalization of Viking Formation gas production from the Ricinus / Bearberry area of the Rocky Mountain Triangle Zone
 Page No. 001-1 Continuity and Compartmentalization of Formation gas production from the Ricinus / Bearberry area of the Rocky Mountain Triangle Zone David Halwas* (Senior Staff Geologist), Darryl Parry
Sequence Stratigraphy as a tool for water resources management in alluvial coastal aquifers: application to the Llobregat delta (Barcelona, Spain)
") Sequence Stratigraphy as a tool for water resources management in alluvial coastal aquifers: application to the Llobregat delta (Barcelona, Spain) Desiré Gàmez Torrent December 2007 CHAPTER 1: Introduction
Sequence Stratigraphy as a tool for water resources management in alluvial coastal aquifers: application to the Llobregat delta (Barcelona, Spain) Desiré Gàmez Torrent December 2007 CHAPTER 1: Introduction
Paleoenviromental and Sequence Stratigraphic Studies of the D7.000 Sand, Eme Field, Niger Delta, Nigeria
 ISSN: 2276-7851 Impact Factor 2012 (UJRI): 0.7799 ICV 2012: 5.88 Paleoenviromental and Sequence Stratigraphic Studies of the D7.000 Sand, Eme Field, Niger Delta, Nigeria By Soronnadi-Ononiwu G.C. Omoboriowo
Glauconitic Oil Reservoirs in Southern Alberta Creating the Correct Geological Model to Guide Development Drilling
 Glauconitic Oil Reservoirs in Southern Alberta Creating the Correct Geological Model to Guide Development Drilling Brad Hayes* Petrel Robertson Consulting Ltd, Calgary, AB bhayes@petrelrob.com Lisa Griffith
October 13, 2015 CSPG Gussow Conference
 October 13, 2015 CSPG Gussow Conference TOC: up to 8% MEM, 2011 Perm: 100-300 nanodarcy BCOGC, 2010 Liard B. Horn River B. Horn River Basin (HRB) Area: 1.3 million hectares Estimated gas resource: 500
Data Repository item
 Data Repository (B25407): Localities and descriptions of measured sections of study areas Table 1. Localities of the measured sedimentary sections in the NW Sichuan Basin Section Number Stratigraphy Locality
ES120 Sedimentology/Stratigraphy
 Midterm Exam 5/05/08 NAME: 1. List or describe 3 physical processes that contribute to the weathering of rocks (3pts). exfoliation frost wedging many others. roots, thermal expansion/contraction also credit
Facies Characterization of the Lower Cretaceous Sparky, Waseca, and McLaren Formations (Mannville Group) of West-central Saskatchewan
 of West-central Saskatchewan") Facies Characterization of the Lower Cretaceous Sparky, Waseca, and McLaren Formations (Mannville Group) of West-central Saskatchewan Alireza Morshedian 1, James A. MacEachern 1, and Shahin E. Dashtgard
Facies Characterization of the Lower Cretaceous Sparky, Waseca, and McLaren Formations (Mannville Group) of West-central Saskatchewan Alireza Morshedian 1, James A. MacEachern 1, and Shahin E. Dashtgard
Summary. Introduction. Observations and Interpretations
 Lower McMurray Formation sinkholes and their fill fabrics: effects of salt dissolution collapse-subsidence across the northern Athabasca oil sands deposit Paul L. Broughton, Chevron Canada Resources, Calgary,
Geo 302D: Age of Dinosaurs. LAB 2: Sedimentary rocks and processes
 Geo 302D: Age of Dinosaurs LAB 2: Sedimentary rocks and processes Last week we covered the basic types of rocks and the rock cycle. This lab concentrates on sedimentary rocks. Sedimentary rocks have special
DETAILED THIN-BEDDED FACIES ANALYSIS OF MANCOS C IN THE UPPER MANCOS SHALE, NEW MEXICO. By CRISTINA GENOVESE, B.Sc. (Hons.)
") DETAILED THIN-BEDDED FACIES ANALYSIS OF MANCOS C IN THE UPPER MANCOS SHALE, NEW MEXICO By CRISTINA GENOVESE, B.Sc. (Hons.) A Thesis Submitted to the School of Graduate Studies in Partial Fulfilment of
DETAILED THIN-BEDDED FACIES ANALYSIS OF MANCOS C IN THE UPPER MANCOS SHALE, NEW MEXICO By CRISTINA GENOVESE, B.Sc. (Hons.) A Thesis Submitted to the School of Graduate Studies in Partial Fulfilment of
Cored Successions from a Modern Estuarine Channel, Willapa Bay, Washington
 Cored Successions from a Modern Estuarine Channel, Willapa Bay, Washington Jesse Schoengut* University of Alberta, Edmonton, Alberta, Canada jesse@ualberta.ca Greg Baniak, Rares Bistran, Luke McHugh, S.
The Impact of Parasequence Stacking Patterns on Vertical Connectivity Between Wave-Dominated, Shallow Marine Parasequences, Book Cliffs, Eastern Utah
 The Impact of Parasequence Stacking Patterns on Vertical Connectivity Between Wave-Dominated, Shallow Marine Parasequences, Book Cliffs, Eastern Utah MALCOLM J. ARNOT and TIMOTHY R. GOOD* MALCOLM J. ARNOT
Lecture Outline Wednesday - Friday February 14-16, 2018
 Lecture Outline Wednesday - Friday February 14-16, 2018 Quiz 2 scheduled for Friday Feb 23 (Interlude B, Chapters 6,7) Questions? Chapter 6 Pages of the Past: Sedimentary Rocks Key Points for today Be
Anatomy of a Fluvial to Estuarine Valley Fill, North Cactus Lake McLaren Reservoir
 Anatomy of a Fluvial to Estuarine Valley Fill, North Cactus Lake McLaren Reservoir J. Edward Mathison Alethia Geologica, Filling of the north Cactus Lake post Waseca paleovalley, during McLaren sea level
Lab 7: Sedimentary Structures
 Name: Lab 7: Sedimentary Structures Sedimentary rocks account for a negligibly small fraction of Earth s mass, yet they are commonly encountered because the processes that form them are ubiquitous in the
UNIT 4 SEDIMENTARY ROCKS
 UNIT 4 SEDIMENTARY ROCKS WHAT ARE SEDIMENTS Sediments are loose Earth materials (unconsolidated materials) such as sand which are transported by the action of water, wind, glacial ice and gravity. These
The Nature of Sedimentary Rocks
 The Nature of Sedimentary Rocks Sedimentary rocks are composed of: Fragments of other rocks Chemical precipitates Organic matter or biochemically produced materials The Nature of Sedimentary Rocks Sedimentary
ESC102. Sedimentary Rocks. Our keys to the past. Monday, February 11, 13
 ESC102 Sedimentary Rocks Our keys to the past Sedimentary Rocks Sedimentary rocks are rocks that form through the accumulation of sediment and the process of lithification. Lithification occurs after deposition
sedimentary cover a) marine sediments b) continental sediments depth of crust: 5-10 km
 marine sediments b) continental sediments depth of crust: 5-10 km") Deformation and Brittle Fracture I. Primary Rock Structure A. Tectonic Control of Rock Structure 1. Lithospheric Plates a. plate = crust + upper mantle above asthenosphere (1) Layered Crust (a) oceanic
Deformation and Brittle Fracture I. Primary Rock Structure A. Tectonic Control of Rock Structure 1. Lithospheric Plates a. plate = crust + upper mantle above asthenosphere (1) Layered Crust (a) oceanic
Feet. SAND; clayey, fine grained; shells are common; rounded quartz grains. SHELLS; muddy; almost no sand, shells and fragments common
 SAND; clayey, fine grained; shells are common; rounded quartz grains SHELLS; muddy; almost no sand, shells and fragments common SAND; back to medium to fine; has a mottled appearance and looks burrowed;
=%REPORT RECONNAISSANCE OF CHISHOLM LAKE PROSPECT. October 25, 1977
 =%REPORT ON FIELD RECONNAISSANCE OF CHISHOLM LAKE PROSPECT October 25, 1977 Bruce D. Vincent Imperial Oil Limited, Minerals - Coal, CALGARY, ALBERTA CHISHOLM LAKE PROSPECT Introduction The Chisholm Lake
4.1 Sediment accommodation space principles and controls
 58 The sedimentary record of sea-level change 4. Sediment accommodation space principles and controls Sequence stratigraphy emphasizes the importance of the space that is made available within a basin
Seismic stratigraphy, some examples from Indian Ocean, interpretation of reflection data in interactive mode
 Seismic stratigraphy, some examples from Indian Ocean, interpretation of reflection data in interactive mode K. S. Krishna National Institute of Oceanography, Dona Paula, Goa-403 004. krishna@nio.org Seismic
Geologic Considerations of Shallow SAGD Caprock; Seal Capacity, Seal Geometry and Seal Integrity, Athabasca Oilsands, Alberta Canada
 Geologic Considerations of Shallow SAGD Caprock; Seal Capacity, Seal Geometry and Seal Integrity, Athabasca Oilsands, Alberta Canada Gordon T. Stabb, Michael Webb Durando Resources Corp, Suncor Energy
Sequence Stratigraphy of the Upper Cretaceous Niobrara Formation, A Bench, Wattenberg Field, Denver Julesburg Basin, Colorado*
 Sequence Stratigraphy of the Upper Cretaceous Niobrara Formation, A Bench, Wattenberg Field, Denver Julesburg Basin, Colorado* Lisa E. Remington LaChance 1 and Mark C. Robinson 1 Search and Discovery Article
Sedimentary Rocks. Origin, Properties and Identification. Geology Laboratory GEOL 101 Lab Ray Rector - Instructor
 Sedimentary Rocks Origin, Properties and Identification Geology Laboratory GEOL 101 Lab Ray Rector - Instructor Sedimentary Rock Origin and Identification Lab Pre-Lab Internet Link Resources 1) http://www.rockhounds.com/rockshop/rockkey/index.html
The Eocene Gir Formation of the Ghani and Ed Dib Fields, Eastern Libya - an example of "Virtual Core Study"
 The Eocene Gir Formation of the Ghani and Ed Dib Fields, Eastern Libya - an example of "Virtual Core Study" Henry Williams*, Suncor Energy Inc., Calgary, AB hwilliams@suncor.com Summary The Gir Formation
Sediments and Sedimentary Rocks
 Sediments and Sedimentary Rocks (Shaping Earth s Surface, Part 2) Science 330 Summer 2005 What is a sedimentary rock? Products of mechanical and chemical weathering Account for about 5 percent of Earth
Sedimentary Rocks. Origin, Properties and Identification. Physical Geology GEOL 100. Ray Rector - Instructor
 Sedimentary Rocks Origin, Properties and Identification Physical Geology GEOL 100 Ray Rector - Instructor Sedimentary Rock Origin and Identification Lab Pre-Lab Internet Link Resources 1) http://www.rockhounds.com/rockshop/rockkey/index.html
Bulletin of Earth Sciences of Thailand
 Quantitative Seismic Geomorphology of Early Miocene to Pleistocene Fluvial System of Northern Songkhla Basin, Gulf of Thailand Oanh Thi Tran Petroleum Geoscience Program, Department of Geology, Faculty
Evan K. Franseen, Dustin Stolz, Robert H. Goldstein, KICC, Department of Geology, University of Kansas
 Reservoir Character of the Avalon Shale (Bone Spring Formation) of the Delaware Basin, West Texas and Southeast New Mexico: Effect of Carbonate-rich Sediment Gravity Flows Evan K. Franseen, Dustin Stolz,
Chapter 8: Learning objectives
 Chapter 8: Learning objectives Understand concept of sedimentary facies Signinifance of lateral and vertical facies associations Walther s Law Understand the sedimentary facies of alluvial fans, eolian
Outcrops from Every Continent and 20 Countries in 140 Contributions. Tor H. Nilsen, Roger D. Shew, Gary S. Steffens, and Joseph R.J. Studlick.
 Paper VIII Tor H. Nilsen, Roger D. Shew, Gary S. Steffens, and Joseph R.J. Studlick Editors Outcrops from Every Continent and 20 Countries in 140 Contributions http://bookstore.aapg.org Length ~ 23 m (75.5
Chapter 5. The Sedimentary Archives
 Chapter 5 The Sedimentary Archives Factors affecting Sedimentary Characteristics 1. Tectonic setting 2. Physical, chemical, and biological processes in the depositional environment 3. Method of sediment
Conventional oil petroleum system of the Cenomanian - Turonian Blackstone Formation, Ferrier - Willesden Green - Gilby area, west-central Alberta
 Conventional oil petroleum system of the Cenomanian - Turonian Blackstone Formation, Ferrier - Willesden Green - Gilby area, west-central Alberta Kevin Greff, Department of Earth Sciences, Western University,
Dalhousie University- Petroleum Geoscience Field Methods- Trinidad Summary Report
 Dalhousie University- Petroleum Geoscience Field Methods- Trinidad Summary Report Submitted to: Offshore Energy Research Association of Nova Scotia (OERA) To fulfill requirements of the Undergraduate Student
3rd-order sequence stratigraphy and lithostratigraphy of the Bearpaw Horseshoe Canyon transition, Alberta plains
 3rd-order sequence stratigraphy and lithostratigraphy of the Bearpaw Horseshoe Canyon transition, Alberta plains Ben Hathway, Alberta Geological Survey, Alberta Energy Regulator, Edmonton, Alberta, ben.hathway@aer.ca
The Eocene Gir Formation of the Ghani and Ed Dib Fields, Eastern Libya -An example of "Virtual Core Study"*
 The Eocene Gir Formation of the Ghani and Ed Dib Fields, Eastern Libya -An example of "Virtual Core Study"* Henry Williams 1 Search and Discovery Article #20288 (2014) Posted December 29, 2014 *Adapted
Bulletin of Earth Sciences of Thailand. Controls on Reservoir Geometry and Distribution, Tantawan Field, Gulf of Thailand.
 Controls on Reservoir Geometry and Distribution, Tantawan Field, Gulf of Thailand Atchara Praidee Petroleum Geoscience Program, Department of Geology, Faculty of Science, Chulalongkorn University, Bangkok
Sequence Stratigraphy. Historical Perspective
 Sequence Stratigraphy Historical Perspective Sequence Stratigraphy Sequence Stratigraphy is the subdivision of sedimentary basin fills into genetic packages bounded by unconformities and their correlative
Core Photo. CORE DESCRIPTIONS VISUAL CORE DESCRIPTIONS, SITE A-1W message openfile IMAGES/1276A1W.PDF. MUDSTONE interbedded with GRAINSTONE
 VISUAL CORE S, SITE 7 7A-W message openfile IMS/7AW.PDF Site 7 Hole A Core W Cored 7.0-800.0 mbsf 79 78 77 7 7 7 very very ACCEORIES FOILS GY/, GY/ G/, GY/ GY/, GY/ GY/, GY/ MUDSTONE interbedded with GRAINSTONE
NAME: GEL 109 Final Winter 2010
 GEL 109 Final Winter 2010 1. The following stratigraphic sections represents a single event followed by the slow accumulation of background sedimentation of shale. Describe the flows that produced the
Seismic interpretation. Principles of seismic stratigraphic interpretation
 Seismic interpretation Principles of seismic stratigraphic interpretation Seismic interpretation Seismic stratigraphy is a technical for interpreting stratigraphic information from seismic data. The resolution
American Institute of Professional Geologists South Dakota Section
 American Institute of Professional Geologists South Dakota Section 2015 Field Trip Guide Deadwood Formation in the Black Hills of South Dakota and Frac Sand Potential Saturday, September 12, 2015 1 Field
SUPPLEMENTAL INFORMATION DELFT 3-D MODELING: MODEL DESIGN, SETUP, AND ANALYSIS
 GSA DATA REPOSITORY 2014069 Hajek and Edmonds SUPPLEMENTAL INFORMATION DELFT 3-D MODELING: MODEL DESIGN, SETUP, AND ANALYSIS Each experiment starts from the initial condition of a straight channel 10 km
by Amy I. Hsieh B.Sc. (Earth Sciences), Simon Fraser University, 2013
, Simon Fraser University, 2013") Geostatistical Modeling and Upscaling Permeability for Reservoir Scale Modeling in Bioturbated, Heterogeneous Tight Reservoir Rock: Viking Fm, Provost Field, Alberta by Amy I. Hsieh B.Sc. (Earth Sciences),
Geostatistical Modeling and Upscaling Permeability for Reservoir Scale Modeling in Bioturbated, Heterogeneous Tight Reservoir Rock: Viking Fm, Provost Field, Alberta by Amy I. Hsieh B.Sc. (Earth Sciences),
The boundary between two formations (or any distinct layers) is called a contact. Sedimentary rocks cover 75% of continents.
 is called a contact. Sedimentary rocks cover 75% of continents.") Sedimentary Rocks Sedimentary rocks form at the Earth s surface through interactions of the hydrologic system and the crust. Fortunately, many of these processes are in operation today, and geologists
Sedimentary Rocks Sedimentary rocks form at the Earth s surface through interactions of the hydrologic system and the crust. Fortunately, many of these processes are in operation today, and geologists
Case Study of the Structural and Depositional-Evolution Interpretation from Seismic Data*
 Case Study of the Structural and Depositional-Evolution Interpretation from Seismic Data* Yun Ling 1, Xiangyu Guo 1, Jixiang Lin 1, and Desheng Sun 1 Search and Discovery Article #20143 (2012) Posted April
Understanding Earth Fifth Edition
 Understanding Earth Fifth Edition Grotzinger Jordan Press Siever Chapter 5: SEDIMENTATION: Rocks Formed by Surface Processes Lecturer: H Mohammadzadeh Assistant professors, Department of Geology, FUM Copyright
Sedimentary Rocks. Origin, Properties and Identification. Physical Geology GEOL 101 Lab Ray Rector - Instructor
 Sedimentary Rocks Origin, Properties and Identification Physical Geology GEOL 101 Lab Ray Rector - Instructor Sedimentary Rock Origin and Identification Lab Pre-Lab Internet Link Resources 1) http://www.rockhounds.com/rockshop/rockkey/index.html
Geology Stratigraphic Correlations (Lab #4, Winter 2010)
") Name: Answers Reg. lab day: Tu W Th Geology 1023 Stratigraphic Correlations (Lab #4, Winter 2010) Introduction Stratigraphic correlation is the process of comparing rocks at one locality with related rocks
Name: Answers Reg. lab day: Tu W Th Geology 1023 Stratigraphic Correlations (Lab #4, Winter 2010) Introduction Stratigraphic correlation is the process of comparing rocks at one locality with related rocks
GEOS 302 Lab 3: Sedimentary Structures (Reference Boggs, Chap.4)
") GEOS 302 Lab 3: Sedimentary Structures (Reference Boggs, Chap.4) Objectives: 1. Become familiar with the different sedimentary structures 2. Understand the origin of these different structures and be able
GEOS 302 Lab 3: Sedimentary Structures (Reference Boggs, Chap.4) Objectives: 1. Become familiar with the different sedimentary structures 2. Understand the origin of these different structures and be able
Characteristics of the Triassic Upper Montney Formation (Unit C), West-Central Area, Alberta
, West-Central Area, Alberta") Characteristics of the Triassic Upper Montney Formation (Unit C), West-Central Area, Alberta Omar Derder NeoSeis Technology Group Ltd., Calgary, Alberta omarderder@neoseis.com Abstract Unconventional hydrocarbon
Characteristics of the Triassic Upper Montney Formation (Unit C), West-Central Area, Alberta Omar Derder NeoSeis Technology Group Ltd., Calgary, Alberta omarderder@neoseis.com Abstract Unconventional hydrocarbon
Optimizing Completions within the Montney Resource Play Mike Seifert, Mark Lenko, Joshua Lee Canadian Discovery Ltd.
 URTeC: 2139640 Optimizing Completions within the Montney Resource Play Mike Seifert, Mark Lenko, Joshua Lee Canadian Discovery Ltd. Introduction The Montney resource play covers 57,000 square miles from
Sand. Sand is any eroded material (igneous, metamorphic or sedimentary) that has a grain size from 1/16 th to 2 millimeters in size.
 that has a grain size from 1/16 th to 2 millimeters in size.") Sedimentology 001 What is sedimentology? Sedimentology...encompasses the study of modern sediments such as sand [1], mud (silt) [2] andclay [3] and understanding the processes that deposit them.[4] It
Sedimentology 001 What is sedimentology? Sedimentology...encompasses the study of modern sediments such as sand [1], mud (silt) [2] andclay [3] and understanding the processes that deposit them.[4] It
SAND DISTRIBUTION AND RESERVOIR CHARACTERISTICS NORTH JAMJUREE FIELD, PATTANI BASIN, GULF OF THAILAND
 SAND DISTRIBUTION AND RESERVOIR CHARACTERISTICS NORTH JAMJUREE FIELD, PATTANI BASIN, GULF OF THAILAND Benjawan KIinkaew Petroleum Geoscience Program, Department of Geology, Faculty of Science, Chulalongkorn
Facies Analysis and Depositional Environments of Khabour Formation/ from Iraqi Kurdistan Region Northern Iraq
 Facies Analysis and Depositional Environments of Khabour Formation/ from Iraqi Kurdistan Region Northern Iraq By Dr.Muhamed F. Omer Assistant Professor of Sedimentology Salahaddin University- Science College
Abstract. 1. Introduction
 Sedimentary Facies Distribution of the Upper Devonian Lower Mississippian Bakken Formation, Williston Basin, Southeastern Saskatchewan: Implications for Understanding Reservoir Geometry, Paleogeography,
GEOL 440 Sedimentology and stratigraphy: processes, environments and deposits Lectures 16 & 17: Deltaic Facies
 GEOL 440 Sedimentology and stratigraphy: processes, environments and deposits Lectures 16 & 17: Deltaic Facies What controls morphology and facies of the Nile Delta? Basic processes Classification Facies
Introduction to sequence stratigraphy and its application to reservoir geology
 Introduction to sequence stratigraphy and its application to reservoir geology Massimo Zecchin Istituto Nazionale di Oceanografia e di Geofisica Sperimentale - OGS Historical development Definitions Systems
Journal of Sedimentary Environments Published by Universidade do Estado do Rio de Janeiro SM2: doi: /jse SUPPLEMENTARY MATERIAL
 Appendix 2 Citation: Bergamaschi, S., Duarte, A.C.F., Serrano, J.S., Figueiredo, A.M.B., Vasconcelos, L.C., Oliveira, R.M.A.G., Ade, M.V.B., Pinheiro, A.E.P.P., Martins, M.V.A., 2016. Regional outcrops