SUPPLEMENTARY INFORMATION
|
|
|
- Diane Lucas
- 6 years ago
- Views:
Transcription
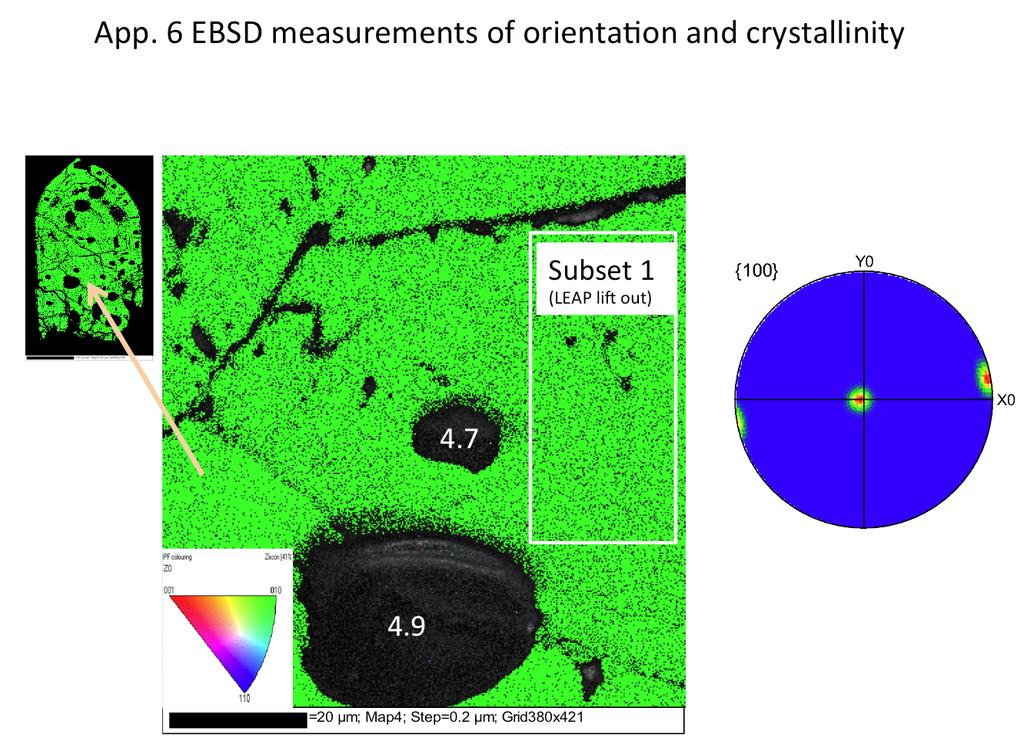
1 SUPPLEMENTARY INFORMATION DOI: /NGEO2075 Appendixes: Hadean age for a post-magma-ocean zircon confirmed by atom-probe tomography JOHN W. VALLEY, AARON J. CAVOSIE, TAKAYUKI USHIKUBO, DAVID A. REINHARD, DANIEL F. LAWRENCE, DAVID J. LARSON, PETER H. CLIFTON, THOMAS F. KELLY, SIMON A. WILDE, DESMOND E. MOSER, MICHAEL J. SPICUZZA Appendix 1 Analytical techniques and references for zircon separation, mounting and polishing, imaging, SIMS analysis, and Atom-Probe Tomography. Appendix 2 Tables of SIMS U-Pb and APT Pb data for zircon 01JH36-69 from the Jack Hills, Western Australia. Appendix 3 Table of major and trace element compositions measured by APT for inside and outside of clusters from the core of zircon 01JH36-69 from Jack Hills, Western Australia. Appendix 4 3-D rotating images of Pb ( 207 Pb and 206 Pb only) and Y measured by APT in specimen #2 from the core of zircon 01JH36-69 from Jack Hills, Western Australia. Scale in nm with no vertical exaggeration. App. 4A: atoms of Y including background for the full 1000-nm-long specimen shown in Fig. 3A. App. 4B: Y & Pb for the enlarged ~100 nm domain shown in Fig. 3B. Only data from within the 3-at.% contour are shown to accentuate clusters. Appendix 5 Full spectra measured by APT from the core of zircon 01JH36-69 from Jack Hills, Western Australia. Enlarged view of mass 101 to showing peaks for 206 Pb ++, 207 Pb ++, and 208 Pb ++ & 104 (Si 2 O 3 ) +. The peaks for 206 Pb and 207 Pb are without detectable interferences, whereas Si 2 O 3 interference prevents accurate measurements of 208 Pb. Appendix 6 Electron backscatter diffraction (EBSD) measurement of lattice orientation of zircon 01JH36-69 from Jack Hills, Western Australia, with subset of orientation data shown in the area of APT lift outs (specimens) adjacent to a SIMS spot with a date of 4382 Ma. Values of δ 18 O correlate to pits shown in Fig. 1C. Green pixels represent high electron diffraction and indexing whereas black pixels could not be indexed as zircon due to topographic effects (fractures, pits, SIMS spots), loss of crystallinity due to radiation damage (correlated to dark disturbed CL zones labelled D in Fig. 1A) and SIMS ablation, or inclusions of phases other than zircon. Note that the a-axis is normal to the section throughout the grain, including the region of interest where crystallographic orientations are uniform (see stereo net plot of poles to {100} from area in Subset 1). Appendix 7 Oxygen 2-isotope and oxygen 3-isotope data for zircon 01JH36-69 measured at WiscSIMS. NATURE GEOSCIENCE 1
2 Appendix 1. Analytical technique and references for zircon separation, mounting and polishing, imaging, SIMS analysis, and Atom-Probe Tomography. Sample 01JH36-69 is a detrital zircon (ZrSiO 4 ) recovered by electric pulse disaggregation of metamorphosed sandstone from the Jack Hills, Western Australia 12,20. The zircon was cast in epoxy and polished four times revealing surfaces successively deeper into the 230 x 230 x 430 µm prismatic crystal (Fig. 1). Surfaces 1 and 2 were shallow, only revealing the outer portion of the grain. This study reports new data from surfaces 3 and 4, which are closely spaced and exposed the core of the zircon for the first time. These surfaces were imaged by scanning electron microscopy (SEM) and analyzed by secondary ion mass spectrometry (SIMS) in 10 to 20 µm diameter spots, 1 to a few µm deep, to determine the age, stable isotope ratios, and trace element compositions. Surface 4 was analyzed by electron backscatter diffraction (EBSD). Needle-shaped specimens of zircon were prepared using standard site-specific focused ion beam (FIB) methods to dimensions of ca. 100 x 100 x up to 1000 nm for atom probe analysis; up to 4 x 10 8 ions/ specimen were field evaporated into a time-of-flight mass spectrometer and located at sub-nanometer scale by a position-sensitive detector with an efficiency of ~37%. Surface 3 of zircon 01JH36-69 was analyzed to determine the U- Pb age using the SHRIMP II ion microprobe at Curtin University with methodology outlined previously 20,28. Age determinations involved 7 measurement cycles for each mass, and were calibrated using zircon U- Pb standard CZ3 (age = 564 Ma; U = 551ppm) 29. Grains of CZ3 were located within the same epoxy mount as the sample. Five analyses of CZ3 were made, using a bracketing strategy, whereby standard analyses were made before, during (between sample analyses #3 and #4), and after analyses of grain 01JH Data were reduced using the program Squid 30 ; sample analyses were corrected for common Pb using measured 204 Pb. The 2σ uncertainty in the mean of the Pb/U ratio for the standard analyses was 0.55%. Graphical representations of the U- Pb data were prepared using the program Isoplot 31. Surface 4 of zircon 01JH36-69 was analyzed in multiple SIMS sessions to determine the oxygen three-isotope ratios 26,27,32 (IMS-1280, UW-Madison, δ 18 O, δ 17 O); and trace element composition 33 (IMS-1280, UW-Madison). The analytical techniques of each analysis are reported in these papers. EBSD mapping was performed after SIMS analysis using a Hitachi SU and Oxford HKL camera (at the University of Western Ontario ZAPLab) at an accelerating voltage of 20kV and step size of 200 nm. No noise reduction of raw data was performed beyond wildspike correction. Atom Probe measurements were made using a LEAP 4000X HR at the CAMECA Atom Probe Technology Center, Madison, Wisconsin. Zircon slices measuring ~3 x 30 µm were removed from the polished face of the crystal and milled to needle-like specimens using a FIB guided by SEM and CL (Fig. 1). Six specimens were obtained from one FIB lift out (Fig. 1A,C). The orientation of each specimen is normal to, and pointing towards, the polished surface in the (100) plane. The local electrode atom probe (LEAP) is described in detail elsewhere 6, Using a LEAP, equipped with laser pulsing capability 37, analysis of bulk insulators has recently become a standard capability 38. In this instrument, the specimen is a sharp needle cooled to 50K at high vacuum and a high voltage (typically 4-14 kv) is applied. In this study, a 355 nm wavelength
3 laser (pulse energy 400 pj, pulsed at 200 khz) was focused on the specimen to promote field evaporation of, on average, approximately ions/ pulse. Ions travel through a time-of-flight mass spectrometer and are recorded by a position-sensitive detector. Each laser pulse starts the clock for time-of-flight. For the specimens used in this study (which measure ~100 nm in diameter), the spatial resolution of detected atoms is ±0.3 nm in X-Y-Z coordinates. A total of 6 x10 8 ions were detected; 2 x10 8 from specimen #1 (R ) and 4 x10 8 from specimen #2 (R ) at rates of ~10 7 ions/hour. In principle, all ions are detected with an equal efficiency of ~37% and a minimum detection limit, determined primarily by the volume of the analysis, of 10 ppma (atomic) for these data. However, spectra must be individually evaluated as some elements ionize poorly or form ionized molecules and isobaric interferences. Mass resolving power is ~1000 (FWHM). 28. Williams, I. S. U Th Pb geochronology by ion microprobe. In: McKibben, M.A., Shanks III, W.C., Ridley, W.I. (Eds.), Applications of Microanalytical Techniques to Understanding Mineralizing Processes. Rev. Econ. Geol. 7, 1 35 (1998) 29. Pidgeon, R. T., Furfaro, D., Kennedy, A. K., Nemchin, A. A., Van Bronswjk, W. Calibration of zircon standards for the Curtin SHRIMP II. United States Geol. Surv. Circ. 1107, 251 (abstract) (1994) 30. Ludwig, K. R. User s Manual for Isoplot/Ex rev. 2.49: A Geochronological Toolkit for Microsoft Excel. Berkeley Geochronological Center Special Publication No. 1a. (2001a) 31. Ludwig, K. R. SQUID 1.02, A User s Manual. Berkeley Geochronological Center Special Publication No. 2. (2001b) 32. Kita N. T., Ushikubo, T., Fu, B. & Valley, J. W. High precision SIMS oxygen isotope analyses and the effect of sample topography. Chem. Geol. 264, (2009) 33. Page F. Z., Fu B., Kita N. T., Fournelle J., Spicuzza M. J., Schulze D. J., Viljoen V., Basei M. A. S., Valley J. W. Zircons from kimberlites: New insights from oxygen isotopes, trace elements, and Ti in zircon thermometry. Geochim. Cosmochim. Acta, 71, (2007) 34. Kelly, T. F. & Larson D. J. Atom Probe Tomography Ann. Rev. Materials Res. 42, 1-31 (2012) 35. Larson, D.J., Prosa, T.J., Ulfig R.M., Geiser B.P., Kelly, T.F. Local Electrode Atom Probe Tomography: A User s Guide. Springer (2013) 36. Hellman, O.C., Vandenbroucke, J.A., Rusing, J., Isheim, D. & Seidman, D.N. Analysis of Three-dimensional Atom-probe Data by the Proximity Histogram. Microsc. Microanal. 6, (2000). 37. Kellogg, G.L. & Tsong, T.T. Pulsed-laser atom-probe field-ion microscopy. J. Applied Phys. 51(2), (1980) 38. Larson, D.J., Alvis, R.A., Lawrence, D.F., Prosa, T.J., Ulfig, R.M., Reinhard, D.A., Clifton, P.H., Gerstl, S.S.A., Bunton, J.H., Lenz, D.R., Kelly, T.F., Stiller, K. Analysis of Bulk Dielectrics with Atom Probe Tomography. Microscopy and Microanalysis 14(S2), (2008) 2
4 App. 2A. Summary of U- Th- Pb data and age measured by SIMS for surface 3 of zircon 01JH App. 2B. Full U- Th- Pb data and age measured by SIMS for surface 3 of zircon 01JH36-69.
5 App. 3. Trace elements detected by APT in the core of zircon 01JH Element Matrix Clusters Zr at. % Si at. % O at. % Hf ppma P ppma Y ppma Al ppma Li ppma Ca ppma Mn ppma 7 60 Mg ppma 8 50 Pb ppma U ppma 30 nd Lu ppma nd 1000 Yb ppma Tm ppma Er ppma nd 7000 Ho ppma nd 700 Dy ppma nd 4000 Tb ppma nd 60 Gd ppma nd 1000 nd = not detected ppma = atoms x 10-6
6
7
GSA Data Repository
 GSA Data Repository 2018087 Ge et al., 2018, A 4463 Ma apparent zircon age from the Jack Hills (Western Australia) resulting from ancient Pb mobilization: Geology, https://doi.org/10.1130/g39894.1. DR1:
The University of Alabama 1 st APT Workshop for Earth Sciences
 The University of Alabama 1 st APT Workshop for Earth Sciences January 2016 David Reinhard LEAP 5000 www.cameca.com Microstructure characterization technique (UHV) that uses field evaporation (high electric
Cloudland gneisses, Mars Hill terrane, NC-TN: New SHRIMP U-Pb ages for detrital zircon and. monazite
 GSA DATA REPOSITORY 2013302 J.N. Aleinikoff et al. Late Mesoproterozoic (ca. 1.0 Ga) deposition of protoliths of the high grade Carvers Gap and Cloudland gneisses, Mars Hill terrane, NC-TN: New SHRIMP
Nano- and micro-geochronology in Hadean and Archean zircons by atom-probe tomography and SIMS: New tools for old minerals k
 American Mineralogist, Volume 100, pages 1355 1377, 2015 Presidential Address SPECIAL COLLECTION: NANOMINERALS AND MINERAL NANOPARTICLES Nano- and micro-geochronology in Hadean and Archean zircons by atom-probe
McClelland & Oldow, p. 1
 McClelland & Oldow, p. 1 U-Pb Analytical Methods Zircons were separated from each of the seven 1 to 4 kg samples samples (see Fig. 1 for locations) by standard crushing and gravimetric techniques, picked
LAACHER SEE REVISITED: HIGH SPATIAL RESOLUTION ZIRCON DATING IMPLIES RAPID FORMATION OF A ZONED MAGMA CHAMBER -
 LAACHER SEE REVISITED: HIGH SPATIAL RESOLUTION ZIRCON DATING IMPLIES RAPID FORMATION OF A ZONED MAGMA CHAMBER - DATA REPOSITORY ANALYTICAL PROCEDURES Ion microprobe U-Th measurements Th-U dating was performed
DATA REPOSITORY ITEM: METAMORPHIC-AGE DATA AND TEXTURES
 Berman et al. - page 1 DATA REPOSITORY ITEM: METAMORPHIC-AGE DATA AND TEXTURES This data repository contains details of pressure (P) - temperature (T) and age methods and data (Tables DR1, DR2, DR3). Figures
Record of ancient Martian hydrosphere preserved in zircon from a Martian meteoritie
 SUPPLEMENTARY INFORMATION DOI: 1.138/NGEO2231 Record of ancient Martian hydrosphere preserved in zircon from a Martian meteoritie A. A. Nemchin 1,2, M. Humayun 3, M. J. Whitehouse 1, R. H. Hewins 4,5,
MT Electron microscopy Scanning electron microscopy and electron probe microanalysis
 MT-0.6026 Electron microscopy Scanning electron microscopy and electron probe microanalysis Eero Haimi Research Manager Outline 1. Introduction Basics of scanning electron microscopy (SEM) and electron
Chemical Geology 264 (2009) Contents lists available at ScienceDirect. Chemical Geology. journal homepage:
 Contents lists available at ScienceDirect. Chemical Geology. journal homepage:") Chemical Geology 264 (2009) 43 57 Contents lists available at ScienceDirect Chemical Geology journal homepage: www.elsevier.com/locate/chemgeo High precision SIMS oxygen isotope analysis and the effect
Chemical Geology 264 (2009) 43 57 Contents lists available at ScienceDirect Chemical Geology journal homepage: www.elsevier.com/locate/chemgeo High precision SIMS oxygen isotope analysis and the effect
Metcalf and Buck. GSA Data Repository
 GSA Data Repository 2015035 Metcalf and Buck Figure DR1. Secondary ionization mass-spectrometry U-Pb zircon geochronology plots for data collected on two samples of Wilson Ridge plutonic rocks. Data presented
MT Electron microscopy Scanning electron microscopy and electron probe microanalysis
 MT-0.6026 Electron microscopy Scanning electron microscopy and electron probe microanalysis Eero Haimi Research Manager Outline 1. Introduction Basics of scanning electron microscopy (SEM) and electron
TABLE DR1. Summary of SHRIMP U-Pb zircon results for migmatitic rocks at Stowe Mountain. Total Radiogenic ratios Ages (in Ma) 204 Pb f U/ ±
 204 Pb f U/ ±") TABLE DR1. Summary of SHRIMP U-Pb zircon results for migmatitic rocks at Stowe Mountain Grain U Th Th/U Pb* Total Radiogenic ratios Ages (in Ma) 204 Pb f 238 206 U/ ± 207 Pb/ ± 206 Pb/ ± 206 Pb/ ± Spot
TABLE DR1. Summary of SHRIMP U-Pb zircon results for migmatitic rocks at Stowe Mountain Grain U Th Th/U Pb* Total Radiogenic ratios Ages (in Ma) 204 Pb f 238 206 U/ ± 207 Pb/ ± 206 Pb/ ± 206 Pb/ ± Spot
Secondary Ion Mass Spectrometry (SIMS) Thomas Sky
 Thomas Sky") 1 Secondary Ion Mass Spectrometry (SIMS) Thomas Sky Depth (µm) 2 Characterization of solar cells 0,0 1E16 1E17 1E18 1E19 1E20 0,2 0,4 0,6 0,8 1,0 1,2 P Concentration (cm -3 ) Characterization Optimization
1 Secondary Ion Mass Spectrometry (SIMS) Thomas Sky Depth (µm) 2 Characterization of solar cells 0,0 1E16 1E17 1E18 1E19 1E20 0,2 0,4 0,6 0,8 1,0 1,2 P Concentration (cm -3 ) Characterization Optimization
Details for EPMA analyzes
 GSA Data Repository 2016142 Partial resetting of the U-Th-Pb systems in experimentally altered monazite: Nanoscale evidence of incomplete replacement Grand Homme et al. Details for EPMA analyzes All electron
X Rays & Crystals. Characterizing Mineral Chemistry & Structure. J.D. Price
 X Rays & Crystals Characterizing Mineral Chemistry & Structure J.D. Price Light - electromagnetic spectrum Wave behavior vs. particle behavior If atoms are on the 10-10 m scale, we need to use sufficiently
XM1/331 XM1/331 BLFX-3 XM1/331
 a b AkC AkC strontian fluoro-apatite clinopyroxene phlogopite K-richterite XM1/331 clinopyroxene XM1/331 Fe-Ti ox c d clinopyroxene kric AkC ilmenite Sr-barite AkC XM1/331 BLFX-3 Supplementary Figure 1.
SUPPLEMENTARY INFORMATION
 SUPPLEMENTARY INFORMATION doi:10.1038/nature11021 Sample Description Tuff beds and granular iron formation Tuff beds were identified in the basal Frere Formation in diamond drill-core from drill hole TDH26
Electron Microprobe Analysis and Scanning Electron Microscopy
 Electron Microprobe Analysis and Scanning Electron Microscopy Electron microprobe analysis (EMPA) Analytical technique in which a beam of electrons is focused on a sample surface, producing X-rays from
Breeding et al., Data Repository Material Figure DR1. Athens. Study Area
 Breeding, Ague, and Brocker 1 Figure DR1 21 o 24 Greece o A 38 o Athens Tinos 37 o Syros Attic-Cycladic Blueschist Belt Syros Kampos B Study Area Ermoupoli N Vari Unit Cycladic HP-LT Unit Marble horizons
APPENDICES. Appendix 1
 Corthouts, T.L., Lageson, D.R., and Shaw, C.A., 2016, Polyphase deformation, dynamic metamorphism and metasomatism of Mount Everest s summit limestone, east central Himalaya, Nepal/Tibet: Lithosphere,
The effect of weathering on U-Th-Pb and oxygen isotope systems of ancient
 *Manuscript 1 2 The effect of weathering on U-Th-Pb and oxygen isotope systems of ancient zircons from the Jack Hills, Western Australia. 3 4 By 5 6 R.T.Pidgeon a, *, A.A. Nemchin a,b, M J. Whitehouse
DR DATA REPOSITORY
 DR2009092 DATA REPOSITORY ANALYTICAL TECHNIQUES Zircons were separated from 3-5 kg samples using standard crushing and grinding techniques, followed by three rounds of magnetic separation at increasing
Spot Name U-Pb ages (Ma) Plagioclase ages (Ma) Biotite age (Ma) Whole rock age (Ma)
 Plagioclase ages (Ma) Biotite age (Ma) Whole rock age (Ma)") Table 1. Average U-Pb ages from this study in comparison with previous ages from Sherrod and Tosdal (1991, and references therein). Previous study ages are reported as ranges including uncertainty (i.e.
Table 1. Average U-Pb ages from this study in comparison with previous ages from Sherrod and Tosdal (1991, and references therein). Previous study ages are reported as ranges including uncertainty (i.e.
3.2 Ga detrital uraninite in the Witwatersrand Basin, South. Africa: Evidence of a reducing Archean atmosphere
 GSA Data Repository 2018085 https://doi.org/10.1130/g39957.1 1 2 3 4 3.2 Ga detrital uraninite in the Witwatersrand Basin, South Africa: Evidence of a reducing Archean atmosphere Ian Burron 1, Giuliana
Supporting Online Material for
 www.sciencemag.org/cgi/content/full/1142021/dc1 Supporting Online Material for Remnants of the Early Solar System Water Enriched in Heavy Oxygen Isotopes Naoya Sakamoto, Yusuke Seto, Shoichi Itoh, Kiyoshi
Additional Analytical Methods. Detrital zircon samples were collected from nine fine-, medium-, and coarse-grained
 GSA Data Repository 2016214 Leary, R.J., DeCelles, P.G., Quade, J., Gehrels, G.E., and Waanders, G., 2016, The Liuqu Conglomerate, southern Tibet: Early Miocene basin development related to deformation
AP5301/ Name the major parts of an optical microscope and state their functions.
 Review Problems on Optical Microscopy AP5301/8301-2015 1. Name the major parts of an optical microscope and state their functions. 2. Compare the focal lengths of two glass converging lenses, one with
When good zircons go bad Redistribution of Radiogenic Pb in Granulite Grade Zircon, Snowbird Tectonic Zone, Canada
 When good zircons go bad Redistribution of Radiogenic Pb in Granulite Grade Zircon, Snowbird Tectonic Zone, Canada Nicole Rayner, Bill Davis, Tom Pestaj Geological Survey of Canada, SHRIMP Lab 2 J.C. Roddick
Trace Element Characterisation of MAD-559 Zircon Reference Material for Ion Microprobe Analysis
 Trace Element Characterisation of MAD-559 Zircon Reference Material for Ion Microprobe Analysis Matthew A. Coble (1)*,JorgeA.Vazquez (2), AndrewP.Barth (3), Joseph Wooden (1), Dale Burns (1), AndrewKylander-Clark
Making Maps on a Micrometer Scale
 Making Maps on a Micrometer Scale Geographic information system software, created for mapping cities and continents, works equally well with the minuscule layers and inclusions that record a crystal s
Supplementary Information for: Giant Kiruna-type deposits form by. efficient flotation of magmatic magnetite suspensions
 GSA DATA REPOSITORY 2015206 1 2 Supplementary Information for: Giant Kiruna-type deposits form by efficient flotation of magmatic magnetite suspensions 3 4 Jaayke L. Knipping, Laura D. Bilenker, Adam C.
129.6 ± ± 2.0. U (ppm) T ± 2.9
 T ± 2.9") DR00. ±. 0. ±.. ±.0. ±.. ±..0 ±..0 ±. 00 µm. ±.. ±..0 ±.. ±.. ±. 0. ±.. ±. 0. ±.0. ±. 0. ±. 0. ±.. ±..0 ±.. ±. 0 0. ±.. ±. 0 DL0- DJ- CM- QG- ZG-. ±. (d). QG- U (ppm). ±.. ±.. ±.. ±.. ±.. ±. (c). CM- (b).
DR00. ±. 0. ±.. ±.0. ±.. ±..0 ±..0 ±. 00 µm. ±.. ±..0 ±.. ±.. ±. 0. ±.. ±. 0. ±.0. ±. 0. ±. 0. ±.. ±..0 ±.. ±. 0 0. ±.. ±. 0 DL0- DJ- CM- QG- ZG-. ±. (d). QG- U (ppm). ±.. ±.. ±.. ±.. ±.. ±. (c). CM- (b).
Cosmochemical application of High Precision Multi-collector SIMS
 Cosmochemical application of High Precision Multi-collector SIMS Oxygen Three Isotopes in Chondrules Early Solar System Chronology of Refractory Inclusions Noriko Kita Wisc-SIMS Laboratory, University
To avoid potential biasing, zircon fractions were not magnetically separated following
 GSA Data Repository 2018352 DR Item 2018352 accompanies Christe, G., LaMaskin, T.A., and Schweickert, R.A., 2018, Implications of new detrital-zircon data for the depositional history, provenance, and
A guide to SIMS targeting in difficult samples. WiscSIMS. Department of Geoscience University of Wisconsin-Madison
 A guide to SIMS targeting in difficult samples WiscSIMS Department of Geoscience University of Wisconsin-Madison images and text by K.H. Williford, 2012 A zero point is chosen and photographed at low magnification
Application of NanoSIMS on Organo Mineral Structures
 Application of NanoSIMS on Organo Mineral Structures Carmen Höschen*, Carsten W. Mueller, Katja Heister, Johann Lugmeier and Ingrid Kögel-Knabner Lehrstuhl für Bodenkunde, TU München, 85350 Freising-Weihenstephan,
Secondary ion mass spectrometry (SIMS)
") Secondary ion mass spectrometry (SIMS) Lasse Vines 1 Secondary ion mass spectrometry O Zn 10000 O 2 Counts/sec 1000 100 Li Na K Cr ZnO 10 ZnO 2 1 0 20 40 60 80 100 Mass (AMU) 10 21 10 20 Si 07 Ge 0.3 Atomic
Secondary ion mass spectrometry (SIMS) Lasse Vines 1 Secondary ion mass spectrometry O Zn 10000 O 2 Counts/sec 1000 100 Li Na K Cr ZnO 10 ZnO 2 1 0 20 40 60 80 100 Mass (AMU) 10 21 10 20 Si 07 Ge 0.3 Atomic
Secondary ion mass spectrometry (SIMS)
") Secondary ion mass spectrometry (SIMS) ELEC-L3211 Postgraduate Course in Micro and Nanosciences Department of Micro and Nanosciences Personal motivation and experience on SIMS Offers the possibility to
Secondary ion mass spectrometry (SIMS) ELEC-L3211 Postgraduate Course in Micro and Nanosciences Department of Micro and Nanosciences Personal motivation and experience on SIMS Offers the possibility to
Hadean diamonds in zircon from Jack Hills, Western Australia
 Hadean diamonds in zircon from Jack Hills, Western Australia Martina Menneken 1, Alexander A. Nemchin 2, Thorsten Geisler 1, Robert T. Pidgeon 2 & Simon A. Wilde 2 1 Institut fur Mineralogie, WestfalischeWilhelms-Universitat,
LETTERS. Hadean diamonds in zircon from Jack Hills, Western Australia
 Vol 448 23 August 2007 doi:10.1038/nature06083 Hadean diamonds in zircon from Jack Hills, Western Australia LETTERS Martina Menneken 1, Alexander A. Nemchin 2, Thorsten Geisler 1, Robert T. Pidgeon 2 &
Laser Ablation for Chemical Analysis: 50 Years. Rick Russo Laser Damage Boulder, CA September 25, 2012
 Laser Ablation for Chemical Analysis: 50 Years Rick Russo Lawrence Berkeley National Laboratory Applied Spectra, Inc 2012 Laser Damage Boulder, CA September 25, 2012 Laser Ablation for Chemical Analysis:
Th) ) dating of micro-baddeleyite
 ) dating of micro-baddeleyite") U-Pb (and U-ThU Th) ) dating of micro-baddeleyite 30 μm Axel K. Schmitt UCLA SIMS, NSF National Ion Microprobe Facility Collaborators: T. Mark Harrison (UCLA) Kevin Chamberlain (University of Wyoming)
U-Pb (and U-ThU Th) ) dating of micro-baddeleyite 30 μm Axel K. Schmitt UCLA SIMS, NSF National Ion Microprobe Facility Collaborators: T. Mark Harrison (UCLA) Kevin Chamberlain (University of Wyoming)
Laser-assisted field evaporation and three-dimensional atom-byatom mapping of diamond isotopic homojunctions
 Supplementary Information Laser-assisted field evaporation and three-dimensional atom-byatom mapping of diamond isotopic homojunctions Samik Mukherjee, Hideyuki Watanabe, Dieter Isheim, David N. Seidman,
TECHNIC A L WORK ING GROUP ITWG GUIDELINE ON SECONDARY ION MASS SPECTROMETRY (SIMS)
") NUCLE A R FORENSIC S INTERN ATION A L TECHNIC A L WORK ING GROUP ITWG GUIDELINE ON SECONDARY ION MASS SPECTROMETRY (SIMS) EXECUTIVE SUMMARY Secondary Ion Mass Spectrometry (SIMS) is used for elemental
NUCLE A R FORENSIC S INTERN ATION A L TECHNIC A L WORK ING GROUP ITWG GUIDELINE ON SECONDARY ION MASS SPECTROMETRY (SIMS) EXECUTIVE SUMMARY Secondary Ion Mass Spectrometry (SIMS) is used for elemental
Towards SHRIMP SI: Developments in Stable Isotope Analysis with SHRIMP
 Towards SHRIMP SI: Developments in Stable Isotope Analysis with SHRIMP Trevor Ireland Research School of Earth Sciences The Australian National University Acknowledgments Ryan Ickert, Joe Hiess Peter Holden,
GSA DATA REPOSITORY Topuz et al. ANALYTICAL PROCEDURE
 GSA DATA REPOSITORY 2013062 Topuz et al. ANALYTICAL PROCEDURE 40 Ar/ 39 Ar Dating Samples were selected, prepared and analysed following procedures described in Rolland et al. (2008). Pure white mica and
Chapter 9. Electron mean free path Microscopy principles of SEM, TEM, LEEM
 Chapter 9 Electron mean free path Microscopy principles of SEM, TEM, LEEM 9.1 Electron Mean Free Path 9. Scanning Electron Microscopy (SEM) -SEM design; Secondary electron imaging; Backscattered electron
Transmission Electron Microscopy
 L. Reimer H. Kohl Transmission Electron Microscopy Physics of Image Formation Fifth Edition el Springer Contents 1 Introduction... 1 1.1 Transmission Electron Microscopy... 1 1.1.1 Conventional Transmission
HOW TO APPROACH SCANNING ELECTRON MICROSCOPY AND ENERGY DISPERSIVE SPECTROSCOPY ANALYSIS. SCSAM Short Course Amir Avishai
 HOW TO APPROACH SCANNING ELECTRON MICROSCOPY AND ENERGY DISPERSIVE SPECTROSCOPY ANALYSIS SCSAM Short Course Amir Avishai RESEARCH QUESTIONS Sea Shell Cast Iron EDS+SE Fe Cr C Objective Ability to ask the
MSE 321 Structural Characterization
 Auger Spectroscopy Auger Electron Spectroscopy (AES) Scanning Auger Microscopy (SAM) Incident Electron Ejected Electron Auger Electron Initial State Intermediate State Final State Physical Electronics
Electron probe microanalysis - Electron microprobe analysis EPMA (EMPA) What s EPMA all about? What can you learn?
 What s EPMA all about? What can you learn?") Electron probe microanalysis - Electron microprobe analysis EPMA (EMPA) What s EPMA all about? What can you learn? EPMA - what is it? Precise and accurate quantitative chemical analyses of micron-size
Electron probe microanalysis - Electron microprobe analysis EPMA (EMPA) What s EPMA all about? What can you learn? EPMA - what is it? Precise and accurate quantitative chemical analyses of micron-size
TRACE ELEMENT ANALYSIS OF DIAMOND BY LAM ICPMS: STANDARDISATION, RESULTS AND DIRECTIONS
 TRACE ELEMENT ANALYSIS OF DIAMOND BY LAM ICPMS: STANDARDISATION, RESULTS AND DIRECTIONS W.L. Griffin 1, 3, Sonal Rege 1, Rondi M. Davies 1, 2, Simon Jackson 1, Suzanne Y. O Reilly 1 1.ARC National Key
MICRO-TOMOGRAPHY AND X-RAY ANALYSIS OF GEOLOGICAL SAMPLES
 THE PUBLISHING HOUSE PROCEEDINGS OF THE ROMANIAN ACADEMY, Series A, OF THE ROMANIAN ACADEMY Volume 18, Number 1/2017, pp. 42 49 MICRO-TOMOGRAPHY AND X-RAY ANALYSIS OF GEOLOGICAL SAMPLES Ion GRUIA University
Imaging Methods: Scanning Force Microscopy (SFM / AFM)
") Imaging Methods: Scanning Force Microscopy (SFM / AFM) The atomic force microscope (AFM) probes the surface of a sample with a sharp tip, a couple of microns long and often less than 100 Å in diameter.
Imaging Methods: Scanning Force Microscopy (SFM / AFM) The atomic force microscope (AFM) probes the surface of a sample with a sharp tip, a couple of microns long and often less than 100 Å in diameter.
Massachusetts Institute of Technology. Dr. Nilanjan Chatterjee
 Massachusetts Institute of Technology Dr. Nilanjan Chatterjee Electron Probe Micro-Analysis (EPMA) Imaging and micrometer-scale chemical compositional analysis of solids Signals produced in The Electron
EDS User School. Principles of Electron Beam Microanalysis
 EDS User School Principles of Electron Beam Microanalysis Outline 1.) Beam-specimen interactions 2.) EDS spectra: Origin of Bremsstrahlung and characteristic peaks 3.) Moseley s law 4.) Characteristic
Appendix 1. Supplementary data presented here include isotopic and concentration data for
 267 Appendix 1 Chronology of Pluton Emplacement and Regional Deformation in the Southern Sierra Nevada Batholith, California-Supplementary Data and Discussions Saleeby, J., Division of Geological and Planetary
CBE Science of Engineering Materials. Scanning Electron Microscopy (SEM)
") CBE 30361 Science of Engineering Materials Scanning Electron Microscopy (SEM) Scale of Structure Organization Units: micrometer = 10-6 m = 1µm nanometer= 10-9 m = 1nm Angstrom = 10-10 m = 1Å A hair is
CBE 30361 Science of Engineering Materials Scanning Electron Microscopy (SEM) Scale of Structure Organization Units: micrometer = 10-6 m = 1µm nanometer= 10-9 m = 1nm Angstrom = 10-10 m = 1Å A hair is
CHEM-E5225 :Electron Microscopy. Diffraction 1
 CHEM-E5225 :Electron Microscopy Diffraction 1 2018-10-15 Yanling Ge Text book: Transmission electron microscopy by David B Williams & C. Barry Carter. 2009, Springer Outline Diffraction in TEM Thinking
GSA Data Repository Denyszyn, et al., 2018, A bigger tent for CAMP: Geology,
 GSA Data Repository 2018306 Denyszyn, et al., 2018, A bigger tent for CAMP: Geology, https://doi.org/10.1130/g45050.1 SPPLEMENTARY FILE: Methods and Data Geochemistry Methods Bulk-rock compositions of
PHI 5000 Versaprobe-II Focus X-ray Photo-electron Spectroscopy
 PHI 5000 Versaprobe-II Focus X-ray Photo-electron Spectroscopy The very basic theory of XPS XPS theroy Surface Analysis Ultra High Vacuum (UHV) XPS Theory XPS = X-ray Photo-electron Spectroscopy X-ray
Surface analysis techniques
 Experimental methods in physics Surface analysis techniques 3. Ion probes Elemental and molecular analysis Jean-Marc Bonard Academic year 10-11 3. Elemental and molecular analysis 3.1.!Secondary ion mass
Zircons were separated using standard techniques of mineral separation, including a Wilfley
 GSA DATA REPOSITORY 2011129 Dhuime et al. Analytical methods Zircons were separated using standard techniques of mineral separation, including a Wilfley table, a Frantz isodynamic separator and heavy liquid.
Q. WANG, Q-K. XIA, S. Y. O REILLY, W. L. GRIFFIN, E. E. BEYER AND H. K. BRUECKNER
 Pressure- and stress-induced fabric transition in olivine from peridotites in the Western Gneiss Region (Norway): implications for mantle seismic anisotropy Q. WANG, Q-K. XIA, S. Y. O REILLY, W. L. GRIFFIN,
Secondary Ion Mass Spectroscopy (SIMS)
") Secondary Ion Mass Spectroscopy (SIMS) Analyzing Inorganic Solids * = under special conditions ** = semiconductors only + = limited number of elements or groups Analyzing Organic Solids * = under special
Secondary Ion Mass Spectroscopy (SIMS) Analyzing Inorganic Solids * = under special conditions ** = semiconductors only + = limited number of elements or groups Analyzing Organic Solids * = under special
TABLE DR1. SUMMARY OF SHRIMP U-Pb ZIRCON RESULTS FOR SAMPLES D2-83 AND D2-24.
 Data Repository Item, Siddoway p. 1 DR20008 TABLE DR1. SUMMARY OF SHRIMP U-Pb ZIRCON RESULTS FOR SAMPLES D2-83 AND D2-24. Grain Spot U (ppm) Th (ppm) Th/U Pb * (ppm) 204 Pb 206 Pb f 208 % 238 U 206 Pb
CHARACTERIZATION of NANOMATERIALS KHP
 CHARACTERIZATION of NANOMATERIALS Overview of the most common nanocharacterization techniques MAIN CHARACTERIZATION TECHNIQUES: 1.Transmission Electron Microscope (TEM) 2. Scanning Electron Microscope
Antonio Simonetti University of Notre Dame
 Antonio Simonetti University of Notre Dame Precision and accuracy on individual isotopic measurements suffer due to matrix effects and isobaric interferences? Availability of suitable reference materials,
Resolving Questions of Biological Interface Chemistry with TOF-SIMS and FIB-TOF Tomography
 Resolving Questions of Biological Interface Chemistry with TOF-SIMS and FIB-TOF Tomography Gregory L. Fisher, John S. Hammond & Scott R. Bryan, Physical Electronics With acknowledgements to: Prof. Reinhard
Recent advances in the analysis of volatiles and fluid-mobile elements in melt inclusions by Secondary Ion Mass Spectrometry (SIMS)
") Edinburgh Research Explorer Recent advances in the analysis of volatiles and fluid-mobile elements in melt inclusions by Secondary Ion Mass Spectrometry (SIMS) Citation for published version: De Hoog,
Edinburgh Research Explorer Recent advances in the analysis of volatiles and fluid-mobile elements in melt inclusions by Secondary Ion Mass Spectrometry (SIMS) Citation for published version: De Hoog,
All work was carried out at the Advanced Analytical Centre, at James Cook
 Appendix LA-ICP-MS U-Pb dating of monazite All work was carried out at the Advanced Analytical Centre, at James Cook University (Townsville, Australia). We used a Coherent GeolasPro 193 nm ArF Excimer
published sources and U-Pb geochronology performed in this study. We analyzed six
 Data Repository: Uba, Strecker, and Schmitt U-Pb radiometric dating The age controls for the stable isotopic records presented here are from both published sources and U-Pb geochronology performed in this
FIB - SIMS. Focussed Ion Beam Secondary Ion Mass Spectrometry.
 FIB - SIMS Focussed Ion Beam Secondary Ion Mass Spectrometry Outline Introduction to Hiden Analytical Introduction to SIMS FIB-SIMS - Introduction and key features FIB-SIMS - Applications data Hiden SIMS
MS482 Materials Characterization ( 재료분석 ) Lecture Note 4: XRF
 Lecture Note 4: XRF") 2016 Fall Semester MS482 Materials Characterization ( 재료분석 ) Lecture Note 4: XRF Byungha Shin Dept. of MSE, KAIST 1 Course Information Syllabus 1. Overview of various characterization techniques (1 lecture)
2016 Fall Semester MS482 Materials Characterization ( 재료분석 ) Lecture Note 4: XRF Byungha Shin Dept. of MSE, KAIST 1 Course Information Syllabus 1. Overview of various characterization techniques (1 lecture)
Environmental Sample Analysis Advances and Future Trends
 Environmental Sample Analysis Advances and Future Trends D.Donohue Office of Safeguards Analytical Services Environmental Sample Laboratory International Atomic Energy Agency Contents Introduction Bulk
Modern Optical Spectroscopy
 Modern Optical Spectroscopy X-Ray Microanalysis Shu-Ping Lin, Ph.D. Institute of Biomedical Engineering E-mail: splin@dragon.nchu.edu.tw Website: http://web.nchu.edu.tw/pweb/users/splin/ Backscattered
Characterisation of Catalysts Using Secondary and Backscattered Electron In-lens Detectors
 Platinum Metals Rev., 2014, 58, (2), 106 110 FINAL ANALYSIS Characterisation of Catalysts Using Secondary and Backscattered Electron In-lens Detectors Heterogeneous catalysis often involves the use of
Nu Plasma II - Collector Configuration
 Nu Plasma II - Collector Configuration Nu Plasma II - Collector Configuration U-Th-Pb mass array 238U 232Th 207Pb 206Pb 208Pb 202Hg 204Pb, 204Hg Peak Alignment/Coincidence 238 U 232 Th 208 Pb 207 Pb 206
ToF-SIMS or XPS? Xinqi Chen Keck-II
 ToF-SIMS or XPS? Xinqi Chen Keck-II 1 Time of Flight Secondary Ion Mass Spectrometry (ToF-SIMS) Not ToF MS (laser, solution) X-ray Photoelectron Spectroscopy (XPS) 2 3 Modes of SIMS 4 Secondary Ion Sputtering
XUV 773: X-Ray Fluorescence Analysis of Gemstones
 Fischer Application report vr118 HELM UT FISCHER GMBH + CO. KG Institut für Elektronik und Messtechnik Industriestrasse 21-7169 Sindelfingen, Germany Tel.: (+49) 731 33- - Fax: (+49) 731 33-79 E-Mail:
Evaluation of Detection Efficiency of Atom Probe Tomography
 Paper Evaluation of Detection Efficiency of Atom Probe Tomography Masato Morita 1,2 *, Masanobu Karasawa 1, Takahiro Asaka 1 and Masanori Owari 1,3 1 Institute of Industrial Science, The University of
Secondary Ion Mass Spectrometry (SIMS)
") CHEM53200: Lecture 10 Secondary Ion Mass Spectrometry (SIMS) Major reference: Surface Analysis Edited by J. C. Vickerman (1997). 1 Primary particles may be: Secondary particles can be e s, neutral species
CHEM53200: Lecture 10 Secondary Ion Mass Spectrometry (SIMS) Major reference: Surface Analysis Edited by J. C. Vickerman (1997). 1 Primary particles may be: Secondary particles can be e s, neutral species
Data Repository. GSA Data Repository Item
 GSA Data Repository Item 2018299 Montalvo, P.E., Cavosie, A.J., Kirkland, C.L., Evans, N.J., McDonald, B.J., Talavera, C., Erickson, T.M., and Lugo-Centeno, C., 2018, Detrital shocked zircon provides first
Two-dimensional homologous perovskites as light absorbing materials for solar cell applications
 Supporting Information for Two-dimensional homologous perovskites as light absorbing materials for solar cell applications Duyen H. Cao, Constantinos C. Stoumpos, Omar K. Farha,, Joseph T. Hupp, and Mercouri
TESCAN S New generation of FIB-SEM microscope
 TESCAN S New generation of FIB-SEM microscope rising standards in sample preparation Key Features SEM COLUMN Versatile system for unlimited applications: resolution imaging (0.9 nm at 15 kev, 1.4 nm at
Fire Creek Gold-Silver Mine, NV
 NDSU Petrology 422 2018 Fire Creek Gold-Silver Mine, NV By Sam Marolt Photo from article Comments sought on Fire Creek mitigation by Elko Daily Free Press Images from Google Earth Pro Locality Northern
Electron Microprobe Analysis 1 Nilanjan Chatterjee, Ph.D. Principal Research Scientist
 12.141 Electron Microprobe Analysis 1 Nilanjan Chatterjee, Ph.D. Principal Research Scientist Massachusetts Institute of Technology Electron Microprobe Facility Department of Earth, Atmospheric and Planetary
Electron Microprobe Analysis 1 Nilanjan Chatterjee, Ph.D. Principal Research Scientist
 12.141 Electron Microprobe Analysis 1 Nilanjan Chatterjee, Ph.D. Principal Research Scientist Massachusetts Institute of Technology Electron Microprobe Facility Department of Earth, Atmospheric and Planetary
EDS Mapping. Ian Harvey Fall Practical Electron Microscopy
 EDS Mapping Ian Harvey Fall 2008 1 From: Energy Dispersive X-ray Microanalysis, An Introduction Kevex Corp. 1988 Characteristic X-ray generation p.2 1 http://www.small-world.net/efs.htm X-ray generation
SUPPLEMENTARY INFORMATION
 SUPPLEMENTARY INFORMATION Extreme oxygen isotope anomaly with a solar origin detected in meteoritic organics Ko Hashizume, Naoto Takahata, Hiroshi Naraoka & Yuji Sano Supplementary Discussions Basic descriptions
A DIVISION OF ULVAC-PHI. Time-of-Flight Secondary Ion Mass Spectrometer with Parallel Imaging MS/MS for Confident Molecular Identification
 A DIVISION OF ULVAC-PHI Time-of-Flight Secondary Ion Mass Spectrometer with Parallel Imaging MS/MS for Confident Molecular Identification Designed for Confident Molecular Identification and Superior Imaging
Orientation imaging microscopy analysis of bulk, melt-textured YBCO superconductors
 Crystal Engineering 5 (2002) 265 272 www.elsevier.com/locate/cryseng Orientation imaging microscopy analysis of bulk, melt-textured YBCO superconductors A. Koblischka-Veneva a,, M.R. Koblischka b, K. Ogasawara
EE 527 MICROFABRICATION. Lecture 5 Tai-Chang Chen University of Washington
 EE 527 MICROFABRICATION Lecture 5 Tai-Chang Chen University of Washington MICROSCOPY AND VISUALIZATION Electron microscope, transmission electron microscope Resolution: atomic imaging Use: lattice spacing.
Opportunities with collinear laser spectroscopy at DESIR:
 Opportunities with collinear laser spectroscopy at DESIR: the LUMIERE facility GOALS of LUMIERE experiments: Gerda Neyens, K.U. Leuven, Belgium (1) measure ground state properties of exotic isotopes: (see
Supplementary information
 Supplementary information Sample details Samples used were from the Natural History Museum, London, UK: collections BM1968 P37 and BM1957 1056, and are listed in Supplementary Table1 and Table 2. Supplementary
An Introduction to Auger Electron Spectroscopy
 An Introduction to Auger Electron Spectroscopy Spyros Diplas MENA3100 SINTEF Materials & Chemistry, Department of Materials Physics & Centre of Materials Science and Nanotechnology, Department of Chemistry,
Lecture 22 Ion Beam Techniques
 Lecture 22 Ion Beam Techniques Schroder: Chapter 11.3 1/44 Announcements Homework 6/6: Will be online on later today. Due Wednesday June 6th at 10:00am. I will return it at the final exam (14 th June).
Trace Elements - Definitions
 Trace Elements - Definitions Elements that are not stoichiometric constituents in phases in the system of interest For example, IG/MET systems would have different trace elements than aqueous systems Do
Nova 600 NanoLab Dual beam Focused Ion Beam IITKanpur
 Nova 600 NanoLab Dual beam Focused Ion Beam system @ IITKanpur Dual Beam Nova 600 Nano Lab From FEI company (Dual Beam = SEM + FIB) SEM: The Electron Beam for SEM Field Emission Electron Gun Energy : 500