Erosion, Sediment Sources, and Channel Analysis in the Crystal River, Colorado
|
|
|
- Horatio Thompson
- 6 years ago
- Views:
Transcription
1 Earth Systems Institute Erosion, Sediment Sources, and Channel Analysis in the Crystal River, Colorado Lee Benda and Sandra (Sam) Litschert Mt Shasta, CA/ Fort Collins, CO
2 Contents Introduction... 2 Methods... 2 Gully and Shallow Landsliding... 2 Hillslope Surface Erosion... 5 Road Surface Erosion... 6 Basin-scale and Channel Analysis... 6 Results... 7 Coarse Sediment: Gullying and Shallow Landsliding... 7 Fine (Suspendable) Sediment: Hillslope and Road Surface Erosion Channel Sedimentation in the Redstone, Colorado Area Controllable Sources of Sediment in Coal Basin Summary Acknowledgements References Figures... Error! Bookmark not defined. 1
3 Erosion, Sediment Sources, and Channel Analysis in the Crystal River, Colorado Introduction The Roaring Fork Conservancy commissioned an analysis of erosion sources in the Crystal River watershed (938 km 2 ) with a focus on sediment sources in Coal Creek Basin (69 km 2 ). Study objectives include identifying the relative contribution of sediment supply to the mainstem Crystal River from the Coal Creek Basin (Figure 1) compared to the Upper Crystal River basin (342 km 2 ), and to determine what proportion of erosion sources in Coal Creek Basin are controllable. Further objectives are to determine the causes and potential mitigation of the channel sedimentation and associated flooding in the vicinity of the community of Redstone, CO, located immediately downstream of the Coal Creek confluence along the mainstem Crystal River. The community analysis system NetMap ( comprised of digital landscapes and analysis tools was used in all components of this analysis (Benda et al. 2007, 2009) Methods A digital landscape of the Crystal River basin was developed using a 10 m digital elevation model (DEM, National Elevation Dataset [NED]). The digital landscape includes a synthetically derived stream layer using a set of flow routing algorithms within NetMap. Based on discussions with Brian McMullen (US Forest Service) and Sharon Clarke (Roaring Fork Conservancy) the dominant erosion sources in the Crystal River basin include: (1) gully erosion, (2) shallow landsliding, (3) hillslope surface erosion, and (4) road surface erosion (unpaved roads). Gully erosion and shallow landsliding (Figure 2) deliver a range of particles sizes to channels from boulders to silt/clay. Bedload size sediment (cobble, gravel, sand) is implicated in accelerated sediment storage in channels and hence flooding in the mainstem Crystal River below the Coal Basin confluence. Hillslope surface erosion and road surface erosion contribute mostly fine sediment to streams and rivers (sand and smaller), and is considered suspended load. Although suspended load can increase turbidity and impact aquatic life, it is not a significant contributor to in-channel sediment storage and thus flooding. Each of the four sediment sources is evaluated in this study. Gully and Shallow Landsliding Gully erosion and shallow landsliding are considered together since the topography associated with each is similar. Both processes are driven by hillslope (or swale) gradient, degree of topographic convergence, and contributing drainage area (Montgomery and Dietrich 1995, 2
 compared to the upper Crystal basin")
4 Figure 1. An erosion and sediment source analysis was conducted in the Crystal River basin (938 km 2 ). Of particular interest is the relative importance of the Coal Basin (69 km 2 ) compared to the upper Crystal basin (342 km 2 ). 3
.")
5 Figure 2. The dominant erosion processes in the Coal Basin are gullying and shallow failures. Miller and Burnett 2007, Parker et al. 2010). To analyze these processes we use the parameter in NetMap called Generic Erosion Potential (GEP). GEP provides a relative measure of potential erosion based on slope steepness and convergence, recognized topographic indicators of shallow landsliding and gully erosion. GEP is based on topographic attributes of slope gradient, local contributing area, and topographic convergence derived from the DEM: GEP = S*aL/b where S is slope gradient (m/m), al is a measure of local contributing area to a DEM pixel equal to the number of adjacent pixels that drain into it (varies between 0 and 8), and b is a measure of topographic convergence equal to the projection of flow direction out of a pixel onto the pixel edges. Values of b are 1 on planar slopes, less than 1 on convergent topography, and greater than 1 on divergent topography. Higher values of GEP are calculated in areas of steeper, more convergent topography. Higher values of GEP correspond to higher landslide densities and to higher gully-initiation-point densities (Miller and Burnett 2007). GEP can stand alone providing a relative index of erosion potential. We convert GEP indices into spatially distributed sediment supply (t/km 2 /yr) using estimates of basin sediment yield. However, there are no independent estimates of sediment yield for the Crystal basin to convert 4
6 GEP. As an approximation, we apply two erosion rates estimated by different methods. The first rate (35 t/km 2 /yr) is based on regional denudation (a region encompassing eastern CO, including the western slope) determined from suspended sediment records (Judson and Ritter 1964). The second rate is estimated using a surface erosion model (WEPP) for post fire conditions in forested areas of Colorado; rates in the general vicinity of the Crystal basin range between 50 and 200 t/km 2 /yr (Miller et al. 2011). Studies of postfire erosion have shown increases ranging from one to three orders of magnitude after wildfire (Morris and Moses 1987, DeBano 2000, Benavides-Solorio and MacDonald 2005). Considering that post fire erosion rates in semi-arid areas are likely much higher than during non-fire periods, a conservative basin average erosion rate for the Crystal River basin is 10t/km 2 /yr. Since the estimated hillslope surface erosion in the Crystal basin is approximately 1 t/km 2 /yr (see below), we apply a value of 10 t/km 2 /yr to illustrate the average rate of erosion associated with gullying and shallow landsliding. Hillslope Surface Erosion A surface erosion model in NetMap, Watershed Erosion Prediction Project or WEPP (Flanagan and Livingston 1995, Elliot et al. 2001) was applied using 100 years of simulated climate. The WEPP model incorporates relationships between slope steepness and erosion, the slope profile and sediment delivery to streams, influence of soil and vegetation types, and the frequency and magnitude of rain storms, all recognized universal drivers of surface erosion. Thus, required parameters in WEPP include vegetation type (forest, grass land, etc.), soil texture (clay loam, loam, silt loam, sandy loam,), slope steepness, slope length and profile, and distance of hillslopes to streams. NetMap s digital landscape was used to derive the necessary topographic indicators. The four soil textures used in WEPP are those used in the Disturbed WEPP interface 1 and they reflect site specific parent rock and geomorphic features. Clay loams are soils derived from shales, limestone and similar decomposing fine-grained sedimentary rock. They also are found in lakebeds and areas of ancient lacustrian deposits. Silt loams are ash cap and loess soils, soils derived from siltstone or similar sedimentary rock, or are found in highly erodible mica/schist geologies. Sandy loam is found in glacial outwash areas or areas of decomposed granites and sandstone, and sand deposits. Loams are found in areas of glacial till and alluvium. Soil data were obtained from the NRCS 2 and converted to the four types used within WEPP (Brian McMullen, US Forest Service). The climate simulator in WEPP (CLIGEN, Nicks et al. 1995) is based on empirically derived time series of 24-hr storm magnitudes in the US. For the WEPP analysis, CLIGEN stations included Crested Butte and Glenwood Springs (CO). Land cover data were obtained from the National
7 Land Cover Database (NLCD) and GAP data (USGS); data were converted to the vegetation types required for WEPP (Sharon Clarke, Roaring Fork Conservancy). Road Surface Erosion Surface erosion on unpaved roads is governed by road gradient, length of road that is hydrologically connected (e.g., length of overland flow on a road surface), road width, road surfacing (native, gravel), traffic level (high to low), and time since grading (Luce and Black 1999, Sugden and Woods 2007). The WEPP road surface erosion model 3 in NetMap employs road width, drainage length, road gradient, surface material, soil type, and traffic level. Since WEPP predicts sediment delivery to streams (t/yr), the intervening hillslope distance and gradient between individual road segments and the nearest stream (referred to as the buffer ) influences the amount of sediment delivered to channels. If the road drains directly to a stream channel, no buffer is considered. We obtained a shapefile of varying road widths and traffic levels (Brian McMullen US Forest Service). NetMap divides roads into hydrologically connected segments to calculate road drainage diversion and road surface erosion potential; road segments are broken into smaller segments that reflect road drainage into streams and drainage from roads at other locations (e.g., road drain points). The road drainage tool is used to create a segmented road layer for use in the WEPP road surface erosion model. Roads do not effect either the predictions of GEP landslide and gullying or the WEPP surface erosion. However, the occurrence of roads could be used to modify the model predictions similarly to how lithology is used to modify the landslide and gully prediction of erosion and sediment supply. Basin-scale and Channel Analysis Erosion results were aggregated to basin-scale and ranked to indicate which subbasins have higher erosion rates. Profiling tools in NetMap were used to examine how longitudinal profiles, valley gradients, and valley (floodplain) widths correspond to predicted point influxes of sediment. Cross sectional profiles were used to measure the proximity of river elevations to nearby valley floor elevations. NetMap hillslope aggregation and channel routing tools were used to calculate cumulative or aggregated sediment yield from hillslopes and roads to channels. In this application, predicted sediment supply (flux) is summed and area weighted downstream. Sediment is not physically routed in terms of predicting bedload transport rates (based on channel gradient, stream power, grain size etc.). However, NetMap s tools and sediment supply predictions could be used to inform physically or statistically based sediment transport models in the Crystal River watershed
8 Results The analysis is divided into two parts based on sediment grain size and thus the type of impact associated with different erosion processes: (1) gullying and shallow landsliding and (2) surface erosion on hillsides and along unpaved roads. Gullying and shallow landsliding are responsible for supplying bedload size sediment to channels (i.e., 2 mm to > 250 mm; coarse sand, pebbles, gravel, cobbles and boulders). Bedload constitutes the vast majority of in-channel sediment stores in the Crystal watershed and thus is associated with channel processes including channel bed aggregation, channel changes and flooding. Sediment particles less than 2 mm (less than coarse sand and including silt and clay) are derived from surface erosion processes on hillsides and on unpaved roads. Suspended load contributes to turbidity which can threaten aquatic life, including fish, and also water quality. Coarse Sediment: Gullying and Shallow Landsliding The generic erosion potential index (GEP) is used to estimate the location and magnitude of gullying and shallow landsliding sediment. In the Crystal River, as elsewhere, lithology (rock type) strongly influences erosion. In Coal Basin and in other areas of the watershed, the most erosion prone rock types are the Maroon Formation (siltstones) and the Mancos shale (Figure 3). To account for the role of rock type on erosion potential, GEP values were modified by an estimated factor of increase, a numerical value between 1 and 3 that was used to multiply the original GEP value (Figure 4). The highest factor of increase (3) is associated with Mancos shale and siltstone; the second highest factor (2) is associated with conglomerate. All other rock types were assigned a value of one, that is, the erosion potential was not modified. The resulting modified GEP values mapped across the Crystal basin, and in Coal Basin specifically, are shown in Figures 5 and 6. Coal Basin has a concentration of high magnitude gully and shallow landslide potential, a pattern that occurs within the central part of the Crystal River watershed, due, in part, to steep and highly dissected topography in association with the Mancos formation. Figure 7 shows an example of how modified GEP represents steep, dissected areas in the Coal Basin that are being eroded by gullies and associated shallow failures. NetMap was used to translate modified GEP values into hillslope erosion rates with units of tons per square kilometer per year. An average basin sediment yield value of 10 t/km 2 /yr was used; this value is spatially distributed across the basin with values higher than average corresponding to areas of high GEP and lower values than average in areas of low GEP. NetMap uses its flow direction grids, via drainage wings, to transfer predicted hillside erosion to individual stream segments throughout the basin (Figures 8 and 9). Predicted stream segment erosion values ranged between less than one and 33 t/km 2 /yr. Converting GEP into cumulative and basin sediment yield requires that channel segment sediment yields aggregated 7
 are dominated by sandstone,")
9 Figure 3. Lithological units in the Crystal River basin (Colorado Division of Geology) are dominated by sandstone, shale and siltstone of the Mancos Formation. Coal Basin and upper Crystal River basin are outlined. 8
 values in the Crystal River basin on the left with the erosion factor of increase values on the right (linked to")
10 Figure 4. Original Generic Erosion Potential (GEP) values in the Crystal River basin on the left with the erosion factor of increase values on the right (linked to rock types, Figure 3). Factors of increase are used to multiply the original GEP values to account for the role of rock types on erosion potential. 9
 GEP values in the Crystal River watershed reveal distinct spatial patterns of erosion potential,")
11 Figure 5. The final (modified) GEP values in the Crystal River watershed reveal distinct spatial patterns of erosion potential, with the highest values associated with the steep and highly dissected terrain of the Mancos Formation.. 10

12 Figure 6. A comparison between the original GEP values of gully and shallow landslide potential (left panel) and the modified GEP values (right panel) in the Coal Basin. 11
.")
13 Figure 7. An example of how NetMap s GEP index corresponds to steep, highly dissected and erodible terrain in the upper Coal Basin. Boxes 1 and 3 correspond to steep, dissected and erodible terrain. Box 2 highlights an area of low erosion potential (e.g., lower gradient, less dissected). 12

14 Figure 8. GEP values were converted to sediment yield units in the Crystal River basin. With a basin wide average of 10 t/km 2 /yr, predicted values as reflected at the scale of individual drainage wings and 100 m stream segments ranged between less than one and 33 t/km 2 /yr. 13
 be equal to the average sediment yield value in the lower most stream segment (e.g., 10 t/km 2 /yr).")
15 Figure 9. The predicted gully and shallow landslide sediment yield (average), highlighting the Coal Basin. downstream (and area normalized) be equal to the average sediment yield value in the lower most stream segment (e.g., 10 t/km 2 /yr). The sediment yield values provide a numeric baseline to consider sediment yields in the Crystal River watershed. Nevertheless, accurate values of sediment yield are not required because the relative differences in predicted erosion potential and sediment yield provide sufficient information about spatial variability in erosion rates. To examine large scale patterns in predicted sediment sources (and sediment yields) in the Crystal River basin, the predicted average annual sediment yields are summarized by 12 digit (6 th field), Hydrologic Unit Code (HUC) boundaries. The classification reveals that Coal Basin and adjacent areas have the highest predicted erosion and sediment yields at t/km 2 /yr. 14
16 (Figure 10). Coal Basin has approximately a one third higher average erosion rate compared to the upper Crystal River watershed. To estimate how predicted sediment yields accumulate downstream revealing tributary scale patterns of erosion potential, NetMap aggregates individual hillslope-channel segment values (Figures 8 and 9) downstream (Figure 11). High values of predicted sediment yield (13 42 t/km 2 /yr) are concentrated in Coal Basin, as well as in nearby areas, revealing the significant erosion source areas at those locations. By removing all first, second, and third order channels (Strahler 1952), the spatial pattern of predicted erosion is evident in the largest streams in the Crystal basin (Figure 12). Fine (Suspendable) Sediment: Hillslope and Road Surface Erosion Hillslope surface erosion and road surface from unpaved roads were predicted in the Crystal River basin. These potential erosion sources are easier to control compared the gully erosion (Figure 7), in particular road surface erosion. The values displayed in the following figures refer to sediment that reaches stream channels, of a size range typical of suspended load (generally < 1-2 mm, sand size and finer). Hillslope Surface Erosion Predicting hillslope surface erosion using the WEPP model in NetMap revealed that the majority of the Crystal River basin has low to zero predicted sediment yield (Figure 13). Even within the Coal subbasin, predicted WEPP surface erosion yields are concentrated in a couple of dozen hillslopes, steep areas with some vegetation. Many of the unvegetated areas in the Crystal River watershed, including in the Coal Basin (Figure 14), are predicted to have zero or close to zero erosion because they are classified as bedrock, and thus have no soil to erode. Low values of surface erosion are predicted in areas of low gradient or dense vegetation, including forests, or some combination of these factors. WEPP Predicted surface erosion (annual average) mapped to channels (Figure 15) indicates that surface erosion risk is quite variable across the Crystal River watershed, with the highest surface erosion in areas of the Coal subbasin and in the lower portion of the Crystal River watershed (Figure 15). In contrast, gully and shallow landslide potential is concentrated in the steeper and highly dissected areas of the Mancos Formation located in the central part of the Crystal River watershed, including Coal Basin (Figures 5, 8, 10 and 11). The channel segment sediment yield values are range widely from < 1.0 t/km 2 /yr to 46 t/km 2 /yr. High values also occur in the upper most areas of the Coal subbasin (Figure 16). A classification of HUC 12-digit (6 th field) basins using mean surface erosion reveals that the Coal subbasin and the lower basin HUCs have relatively high rates of predicted hillslope surface erosion (Figure 17). Surface erosion summed across the entire Crystal River watershed is approximately 150 t/yr, equivalent to approximately 1 t/km 2 /yr (Figure 18). 15

17 Figure 10. A HUC 12 subbasin classification of average predicted sediment yields reveals that Coal Basin and adjacent areas have the highest values across the Crystal River watershed. 16
18 Figure 11. NetMap is used to aggregate the predicted individual hillslope-channel sediment yield values (Figures 8 and 9) downstream, revealing tributary scale patterns. Coal Basin and surrounding areas are predicted to have the highest concentrated erosion potential. Numbers 1-5 correspond to tributary point sources of sediment in Figure 14 (lower panel). 17
19 Figure 12. With Strahler (1952) order streams three and lower removed, the pattern of cumulative sediment yields are shown for the larger channels. Coal Basin stands out as a high sediment producer. 18

20 Figure 13. The WEPP model in NetMap is used to calculate the average hillslope erosion rate in t/km 2 /yr. Areas of low erosion are typically bare rock, forested or low gradient. 19

21 Figure 14. NetMap: WEPP is used to calculate the average hillslope erosion rate in t/km 2 /yr. The Coal subbasin is highlighted and it contains several hillslopes with rates above 20 t/km 2 /yr. 20
22 Figure 15. WEPP hillslope erosion is aggregated to channel segments and indicates a wide range of values across the Crystal Basin up to 46 t/km 2 /yr. 21

23 Figure 16. WEPP hillslope erosion is aggregated to channel segments. Coal subbasin contains several stream segments where aggregated sediment rates are above 10 t/km 2 /yr. 22

24 Figure 17. Average subbasin hillslope sediment yield (t/km 2 /yr) of the Crystal Basin by HUC 12s. Predictions show that the Coal subbasin produces the highest sediment yield at 0.3 t/km 2 /yr. 23
25 Figure18. WEPP hillslope erosion aggregated to channels and accumulated downstream indicating that the entire Crystal basin produces about 153 t/yr or about 1 t/km 2 /yr and sediment accumulation is high all along the mainstem Crystal River. Road Surface Erosion Road surface erosion is generally considered a controllable source of fine sediment to streams and rivers. Important factors in the WEPP model are road segment length (hydrologically connected), road gradient, climate, road surface type, road width, road traffic level, soils (ditch), and distance of the road segment to the stream. Road Input parameters (including the US Forest Service road layer) were provided by Jane Frambach (US Forest Service) including data on extra wide road widths in the Coal Basin. WEPP: Road used the same Cligen climate stations that were used for hillslope erosion (Crested Butte, Glenwood Springs, CO). NetMap 24
26 predicts road segment length and slope based on the alignment of the road layer on the DEM and determines road high and low points (e.g., drain points), as well as all road-stream crossings. In NetMap s digital landscape, the distance between all road segments and the stream segments they drain into are used in the WEPP calculation of surface erosion. The WEPP road surface erosion model used in NetMap predicted a wide range of road surface erosion rates for each road segment (t/yr) (Figure 19). The highest values > 0.1 t/yr occur in the steepest parts of the Crystal River watershed, including in the Coal Basin (Figure 20). The lowest predicted road erosion rates occur along valley bottoms. Paved roads will have zero surface erosion (ditches notwithstanding). A basin classification of average road erosion rates (Figure 21) reveals the highest average rates occur in the southeastern most set of HUC 6 basins due to the highest erosion values in the few road segments located there. Predicted road surface erosion was also mapped to streams in NetMap (Figure 22) revealing spatial patterns in the channel network. Channel Sedimentation in the Redstone, Colorado Area Another study objective is to determine the relationship between spatial patterns of erosion potential in the Crystal River, and in Coal Basin in particular, and the channel sedimentation in the vicinity of the community of Redstone, Colorado. Redstone (population 130) is located immediately downstream of the Coal Basin confluence (Figure 1). A longitudinal profile along the Crystal River mainstem reveals a relatively linear elevation gradient between River Kilometer (RK) 1 and 50 with an abrupt steepening in the river s headwaters (RK 50 to 70). There are several elevation perturbations in the lower section with one of them located just downstream of the Coal Basin confluence at about RK30 (Figure 23). The elevation perturbation near the Coal Basin confluence reveals a distinct bulge in the longitudinal profile approximately 5 km long and about 60 m thick at its deepest (Figure 24, top panel). Bulges in channel longitudinal profiles are often caused by sediment wedges, or standing waves of sediment, linked to tributaries with high sediment loads (Benda and Dunne 1997, Benda 2008). The standing wave of sediment that is located below Coal Creek is also located immediately downstream of four other major sediment producing tributaries, all within four river kilometers of Redstone (Figure 24, bottom panel). Locations of all five tributaries are also shown in Figure 11. An approximate 2-km long canyon located between RK 23 and 25 may be altering the river longitudinal profile, creating a steeper elevation gradient (Figure 25). Using the alternate profile, the sediment wedge or standing wave of sediment just downstream of Coal Basin remains evident. With the alternate profile, the sediment wedge is approximately 4 km long and 30 m deep. The slope gradient on the sediment wedge is considerably less than either long profile (approximately 0.1 to 1.5% on the wedge compared to twice that steep upstream and 25
27 Figure 19. NetMap WEPP: Road was used to calculate road surface erosion per road segment. Higher erosion rates correspond to steeper terrain in the Crystal River basin. 26

28 Figure 20. NetMap WEPP: Road was used to calculate road surface erosion per road segment. The focus is on the Coal subbasin within the Crystal River basin where several road segments yield above 0.1 t/yr. 27
29 28

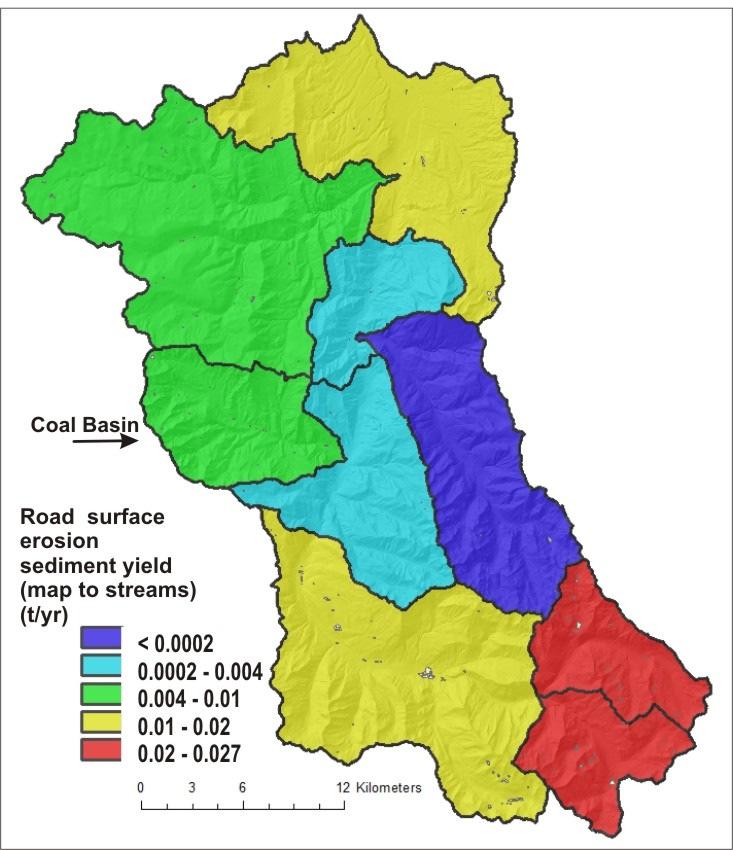
30 Figure 21. A HUC 12 basin classification of predicted and basin-averaged road surface erosion rates reveal that the southeast subbasins the North Fork and South Fork Crystal River subbasins - have the highest average road erosion values across the Crystal River watershed. Figure 22. Netmap WEPP:Road predicted road surface erosion mapped to channel segments. The sediment yields range broadly from less than t/yr with a few hotspots of up to 19 t/yr. 29
 50 with profile steepening")
31 Figure 23. A longitudinal profile along the Crystal River mainstem reveals a relatively linear elevation gradient to River Kilometer (RK) 50 with profile steepening occurring upstream. There are several elevation perturbations in the lower section with one of them located just downstream of the Coal Basin confluence. 30

32 Figure 24. Upper panel-river elevations A-A reveals a large bulge in the profile between River Kilometer 25 and 31. The bulge is approximately 5 km long and 60 m thick at its deepest point. The budge or hypothesized standing wave of sediment occurs immediately downstream of Coal Basin and also within 4 river kilometers of four other high sediment producing tributaries (tributaries numbered in Figure 11). Lower panel-a longitudinal plot of cumulative sediment yield (Figures 11 and 12) reveal how the predicted sediment yield abruptly increases from RK34 through RK 31 (Coal Basin) associated with five intersecting tributaries. The length of the horizontal step in the plot scales with the magnitude of the tributary s input of sediment (in terms of annual sediment yield, t/km 2 /yr). 31
 still reveals a sediment wedge between approximately RK 28 and 31; the sediment wedge is approximately 4 km long and 30 deep.")
33 Figure 25. A canyon located between approximately RK 23 and 25 may be influencing the river long profile upstream of it. An alternate profile (B-B ) still reveals a sediment wedge between approximately RK 28 and 31; the sediment wedge is approximately 4 km long and 30 deep. The lower gradient on the sediment wedge (C-C ), compared to river reaches upstream and downstream, would enhance sediment deposition in the standing wave of sediment. downstream of it). The lower gradient of the sediment wedge is likely enhancing sediment storage in that area. The Crystal River located on the 4 to 5 km sediment wedge located immediately downstream of the Coal Basin is characterized by braiding and large gravel bars (Figure 26). This is characteristic of fluvial river forms in areas of low gradient and high sediment supply, as evidenced by plots of river elevation and cumulative sediment supply (Figures 24 and 25). The sediment wedge effectively fills the valley floor with sediment, creating a low relief environment between the channel and the adjacent valley floor. This is apparent in a comparison of valley floor cross sections on the wedge (in Redstone) and upstream and downstream of it (Figure 27). The cross sections reveal that in the vicinity of the sediment wedge the change in elevation between the relatively flat valley floor and the Crystal River is relatively small (< 4 m) and thus these areas are prone to flooding. Upstream and downstream, the elevation difference between the channel and valley floor is considerably greater. The pattern of local valley widening is also evident using NetMap s floodplain mapping tool (Figure 28). 32

34 Figure 26. The approximate area of the sediment wedge that corresponds to Figure 24 is illustrated. The low gradient channel is characterized by large gravel bars and braiding, fluvial forms indicative of high sediment supply and sediment storage. 33
, the change in elevation between the channel and adjacent valley floors is minimal (< 2 to 5 m).")
35 Figure 27. Valley floor cross sections on the sediment wedge downstream of Coal Basin (in the vicinity of Redstone) and upstream and downstream of the wedge reveal very different patterns of relief. On the sediment wedge (middle), the change in elevation between the channel and adjacent valley floors is minimal (< 2 to 5 m). In comparison, the change in elevation between channels and valley floors both upstream and downstream (lower and upper panels) is considerably greater. The low relief on the wedge would promote over bank flooding in the area of Redstone. 34

36 Figure 28. NetMap s floodplain tool was used to map floodplains and terraces at varying elevations above the channel. 1X through 4X corresponds to one multiple through 4 multiples of bank full depth above the channel. Hence, 1X and 2X likely represents the zone of floodplains that are frequently inundated during floods (e.g., once every one or two years). 3X and 4X likely represent terraces that are infrequently inundated by flood waters. 35
37 In addition to the zone of high sediment supply and the sediment bulge between RK 31 and 25, there is an overall higher predicted sediment supply that extends downstream from that area to RK 10. Hence, the zone of higher sediment supply, and potentially greater sediment storage along the mainstem Crystal River, may extend over this larger length of channel. This may have consequences for flooding potential and also for water extraction since larger sediment stores would create larger opportunities for inter-gravel flow (hyporheic flow) and thus less available surface flow. Controllable Sources of Sediment in Coal Basin An additional study objective is to determine what proportion of sediment supply to the Crystal River, specifically from Coal Basin, is controllable by reclamation or restoration techniques. Using Google Earth, areas of obvious land use disturbance (mining and roads related) were mapped (Figure 29) and polygons created (Figure 30). [Road related surface erosion is calculated using another method, see below.] For this analysis, we assume that erosion on disturbed areas (bare ground) in mining areas and on slopes below and above roads are controllable to some extent. The sum of the GEP index (Figure 6, right panel) encompassed by both the mining and road disturbed areas (polygons, Figure 30) were tallied and compared to the total summed GEP over the entire Coal Basin. The mining areas encompassed 1.7% of the Coal Basin GEP index and the road related areas encompassed 0.3%. In other words, approximately 98% of the coarse sediment supply to channels originating from gully and shallow landslide landforms in Coal Basin are not associated with human activities (past or present) and cannot be practicably controlled. Note that most of the mining areas have already received some type of erosion control (e.g., Figure 29, lower panel). The 2% estimate of controllable erosion sources contains errors of approximation. First, the GEP analysis omits the role of vegetation in controlling erosion because only the effects of variations of lithology on erosion was considered (e.g., GEP values on hillslopes with the same gradient and curvature are the same whether a slope is vegetated or not). Hillslopes not vegetated should have a higher erosion rate. The majority of controllable sources of erosion, particularly those associated with roads, are unvegetated. Second, most of the mining areas have received some type of erosion control, and many of these areas are revegetated to some extent, or some areas are contoured to reduce erosion. Third, there are other, smaller disturbed areas that were not mapped. Fourth, erosion control will not be 100% effective, particularly on steep, dissected and unvegetated portions of hillslopes associated with roads (e.g., Figure 29, upper panel). All of these approximations will lead to errors in estimating the proportion of sediment that is controllable. But given all the available information, the controllable sources of sediment probably do not exceed 10% of the total sediment sources in the Coal Basin. 36
 and mine related ground")
38 Figure 29. Controllable sources of sediment in the Coal Basin include eroding hillslopes below and above roads (upper panel) and mine related ground disturbance (lower panel). Controllable sources of sediment in Coal Basin make up approximately 2% of all potential sediment sources. 37
 mapped using Google Earth of mining and road related land disturbance areas (Figure 18) that were used to estimate the proportion of predicted erosion that is controllable.")
39 Figure 30. Areas (white polygons) mapped using Google Earth of mining and road related land disturbance areas (Figure 18) that were used to estimate the proportion of predicted erosion that is controllable. In addition, the sediment wedge downstream of Coal Basin in the vicinity of Redstone (RK 31-26) is likely being supplied from areas of upstream of the Coal Basin confluences from the closely spaced set of 4 tributaries (Figures 24-25). Thus, consideration of controllable sources of sediment, if the target was reducing sediment supply to the mainstem Crystal River in the vicinity of Redstone, would need to consider these other sources. In that case, controllable sources of sediment may diminish to 1% or less. 38
40 If an objective was protecting Redstone from flooding because of the enhanced sedimentation on the standing wave just downstream of the Coal Basin, controlling sediment sources in Coal Basin or in the nearby upstream tributaries (e.g., Figure 24) does not appear to be a viable option. Rather, mitigation might take the form of gravel mining (in the lower reaches of Coal Basin or more likely on the Crystal sediment wedge itself or the construction of dikes between Redstone and the Crystal River. Summary Our analysis indicates the importance of gully and shallow failure erosion in supplying channels in the Crystal River with coarse sediment and how its distribution varies across the watershed. In particular, the supply of coarse sediment from a closely spaced set of five tributaries, including Coal Basin, in the center of the Crystal River watershed appears to be a major contributor to a standing wave of sediment, or sediment wedge, located in the vicinity of the Coal Basin confluence near the community of Redstone, CO. The sediment wedge is likely causing increased potential for overbank flooding in the vicinity of the Coal Basin confluence and Redstone. Fine sediment sources in the Crystal River watershed are predicted using WEPP technology, although the relative magnitude of fine sediment supply appears to be considerably smaller compared to sediment supply from gullying and shallow landsliding. However, an absolute comparison between the relative magnitudes of sediment supply is not feasible given the two different methods used to estimate them and because of the differences in grain sizes of the sediment involved. Nevertheless, the maps of surface erosion potential from hillsides and from roads could be used to help prioritize erosion control aimed at reducing fine sediment delivery to streams. The type of analysis conducted here on the Crystal River basin, using fluvial and aquatic tools in NetMap, can be used for restoration projects or management planning (Benda et al. 2009). NetMap tools combined with readily available data were used to create a multi-scale analysis that conveys relative insights into road, channel, and basin scale potential erosion or sediment yields. The data and maps can be used to identify candidate sites for restoration by examining highly productive sites at the different scales. We recommend that field visits are used in conjunction with the NetMap analysis for a final restoration site determinations. Earth Systems Institute is providing the data and NetMap tools used in this analysis to the Roaring Fork Conservancy in case further analyses are needed or data are updated. No field work was conducted during this study, although consultations occurred with individuals who have extensive on the ground experience within the Crystal River basin (Brian McMullen, White River NF, US Forest Service; Sharon Clarke, Roaring Fork Conservancy; Sandra Ryan-Burkett, RMRS, US Forest Service). 39
41 Acknowledgements Many thanks to the following for sharing their insights: Sharon Clarke (RFC), Brian McMullen (USFS), Sandra Ryan-Burkett (USFS) References Benavides-Solorio J., and L.H., MacDonald, Measurement and prediction of postfire erosion at the hillslope scale, Colorado Front Range. Int. J. of Wildland Fire 14:1-18. Benda, L., D. J. Miller, K. Andras, P. Bigelow, G. Reeves, and D. Michael, NetMap: A new tool in support of watershed science and resource management. Forest Science 52: Benda, L., D. Miller, S. Lanigan, and G. Reeves, Future of applied watershed science at regional scales. EOS, Transaction American Geophysical Union 90: Benda, L., Miller, D., and J. Barquín, Creating a catchment scale perspective for river restoration, Hydrol. Earth Syst. Sci., 15, , doi: /hess , DeBano, L., The role of fire and soil heating on water repellency in wildland environments: a review. J. of Hydrology : Elliot, W.J., P.R. Robichaud, and C.D. Pannkuk A probabilistic approach to modeling erosion for spatially-varied conditions. Proceedings of the Seventh Federal Interagency Sedimentation Conference, March 25 to 29, 2001, Reno, Nevada. Volume 2, Section VI, "Data Quality Assurance." p. VI VI-40. ] Flanagan, D. C., and S. J. Livingston WEPP User Summary: USDA Water Erosion Prediction Project (WEPP). NSERL Report No. 11. W. Lafayette, Ind.: USDA ARS National Soil Erosion Research Laboratory. Luce, C.H. and T.A.Black Sediment production from forest roads in western Oregon. Water Resources Research 35(8) : Miller, D. J., and K. M. Burnett, Effects of forest cover, topography, and sampling extent on the measured density of shallow, translational landslides, Water Resources Res., 43, W03433, doi: /2005wr Miller, M.E., MacDonald, L.H., Robichaud, P.R., Elliott, W.J., Predicting post-fire erosion in forest lands of the western United States. Int. J. of Wildland Fire 20(8): Morris, S.E., Moses, T.A., Forest Fire and the Natural Soil Erosion Regime in the Colorado Front Range, Annals of the Association of American Geographers, 77:2, Montgomery, D. R. and W. E. Dietrich (1994). "A physically based model for the topographic control on shallow landsliding." Water Resources Research 30(4): Nicks, A. D., L. J. Lane, and G. A. Gander Chapter 2: Weather generator. In USDA-Water Erosion Prediction Project: Hillslope Profile and Watershed Model Documentation. D. C. Flanagan and M. A. Nearing, eds. NSERL Report No. 10. West Lafayette, Ind.: USDA-ARS National Soil Erosion Research Lab. Sugden, B.D. and S.W. Woods, Sediment production from forest roads in western Montana. Journal of the American Water Resources Association, 43(1):
Erosion, Sediment Sources, and Channel Analysis in the Crystal River Watershed, Colorado
 Earth Systems Institute Erosion, Sediment Sources, and Channel Analysis in the Crystal River Watershed, Colorado Lee Benda and Sandra (Sam) Litschert Mt Shasta, CA/ Fort Collins, CO 10-23-2013 Contents
This Powerpoint presentation summarizes the use of NetMap for a Fire Decision Support System. Created on Sept 25, 2015 by Dr. Lee Benda and Kevin
 This Powerpoint presentation summarizes the use of NetMap for a Fire Decision Support System. Created on Sept 25, 2015 by Dr. Lee Benda and Kevin Andras (TerrainWorks). 1 The general approach strategy:
What is a watershed or landscape perspective?
 What is a watershed or landscape perspective? -remove sediment -add sediment -add wood, riparian manipulation -alter (engineer) channel/floodplain morphology -restore/abandon roads You are here What is
Dan Miller + Kelly Burnett, Kelly Christiansen, Sharon Clarke, Lee Benda. GOAL Predict Channel Characteristics in Space and Time
 Broad-Scale Models Dan Miller + Kelly Burnett, Kelly Christiansen, Sharon Clarke, Lee Benda GOAL Predict Channel Characteristics in Space and Time Assess Potential for Fish Use and Productivity Assess
Welcome to NetMap Portal Tutorial
 Welcome to NetMap Portal Tutorial Potential Applications What Can you do with the Portal? At least 25 things! 1) Locate the best potential fish habitats. 2) Identify biological hotspots. 3) Map floodplain
Watershed concepts for community environmental planning
 Purpose and Objectives Watershed concepts for community environmental planning Dale Bruns, Wilkes University USDA Rural GIS Consortium May 2007 Provide background on basic concepts in watershed, stream,
Stream Geomorphology. Leslie A. Morrissey UVM July 25, 2012
 Stream Geomorphology Leslie A. Morrissey UVM July 25, 2012 What Functions do Healthy Streams Provide? Flood mitigation Water supply Water quality Sediment storage and transport Habitat Recreation Transportation
Vermont Stream Geomorphic Assessment. Appendix E. River Corridor Delineation Process. VT Agency of Natural Resources. April, E0 - April, 2004
 Vermont Stream Geomorphic Assessment Appendix E River Corridor Delineation Process Vermont Agency of Natural Resources - E0 - River Corridor Delineation Process Purpose A stream and river corridor delineation
Recent findings related to measuring and modeling forest road erosion
 18 th World IMACS / MODSIM Congress, Cairns, Australia 13-17 July 2009 http://mssanz.org.au/modsim09 Recent findings related to measuring and modeling forest road erosion W. J. Elliot 1, R. B. Foltz 1
Why Geomorphology for Fish Passage
 Channel Morphology - Stream Crossing Interactions An Overview Michael Love Michael Love & Associates mlove@h2odesigns.com (707) 476-8938 Why Geomorphology for Fish Passage 1. Understand the Scale of the
3.12 Geology and Topography Affected Environment
 3 Affected Environment and Environmental Consequences 3.12 Geology and Topography 3.12.1 Affected Environment 3.12.1.1 Earthquakes Sterling Highway MP 45 60 Project Draft SEIS The Kenai Peninsula is predisposed
Analysis of coarse sediment connectivity in semiarid river channels
 Sediment Transfer tlirongh the Fluviai System (Proceedings of a symposium held in Moscow, August 2004). IAHS Publ. 288, 2004 269 Analysis of coarse sediment connectivity in semiarid river channels J. M.
Stream Classification
 Stream Classification Why Classify Streams? Communication Tool Describe Existing Conditions & Trends Describe Restoration Goals Research Tool Morphologic Stream Classification Systems Schumm (1977) Alluvial
Diagnostic Geomorphic Methods for Understanding Future Behavior of Lake Superior Streams What Have We Learned in Two Decades?
 Diagnostic Geomorphic Methods for Understanding Future Behavior of Lake Superior Streams What Have We Learned in Two Decades? Faith Fitzpatrick USGS WI Water Science Center, Middleton, WI fafitzpa@usgs.gov
6.11 Naas River Management Unit
 6.11 Naas River Management Unit 6.11.1 Site 41 Issue: Bed and bank erosion Location: E 0685848 N 6058358 Waterway: Naas River Management Unit: Naas River Facing downstream from Bobeyan Rd bridge Facing
PolyMet NorthMet Project
 RS 26 Draft-01 December 8, 2005 RS26 Partridge River Level 1 Rosgen Geomorphic Survey Rosgen Classification Partridge River from Headwaters to Colby Lake Prepared for PolyMet NorthMet Project December
Analysis of Road Sediment Accumulation to Monumental Creek using the GRAIP Method
 Analysis of Road Sediment Accumulation to Monumental Creek using the GRAIP Method Introduction (from http://www.neng.usu.edu/cee/faculty/dtarb/graip/#over): The Geomorphologic Road Analysis and Inventory
APPENDIX E. GEOMORPHOLOGICAL MONTORING REPORT Prepared by Steve Vrooman, Keystone Restoration Ecology September 2013
 APPENDIX E GEOMORPHOLOGICAL MONTORING REPORT Prepared by Steve Vrooman, Keystone Restoration Ecology September 2 Introduction Keystone Restoration Ecology (KRE) conducted geomorphological monitoring in
Erosion Surface Water. moving, transporting, and depositing sediment.
 + Erosion Surface Water moving, transporting, and depositing sediment. + Surface Water 2 Water from rainfall can hit Earth s surface and do a number of things: Slowly soak into the ground: Infiltration
River Response. Sediment Water Wood. Confinement. Bank material. Channel morphology. Valley slope. Riparian vegetation.
 River Response River Response Sediment Water Wood Confinement Valley slope Channel morphology Bank material Flow obstructions Riparian vegetation climate catchment vegetation hydrological regime channel
A probabilistic approach to modeling postfire erosion after the 2009 Australian bushfires
 18 th World IMACS / MODSIM Congress, Cairns, Australia 13-17 July 2009 http://mssanz.org.au/modsim09 A probabilistic approach to modeling postfire erosion after the 2009 Australian bushfires P.R. Robichaud
Summary. Streams and Drainage Systems
 Streams and Drainage Systems Summary Streams are part of the hydrologic cycle and the chief means by which water returns from the land to the sea. They help shape the Earth s surface and transport sediment
Overview of fluvial and geotechnical processes for TMDL assessment
 Overview of fluvial and geotechnical processes for TMDL assessment Christian F Lenhart, Assistant Prof, MSU Research Assoc., U of M Biosystems Engineering Fluvial processes in a glaciated landscape Martin
Upper Truckee River Restoration Lake Tahoe, California Presented by Brendan Belby Sacramento, California
 Upper Truckee River Restoration Lake Tahoe, California Presented by Brendan Belby Sacramento, California Mike Rudd (Project Manager), Charley Miller & Chad Krofta Declines in Tahoe s Water Clarity The
Aquifer an underground zone or layer of sand, gravel, or porous rock that is saturated with water.
 Aggradation raising of the streambed by deposition that occurs when the energy of the water flowing through a stream reach is insufficient to transport sediment conveyed from upstream. Alluvium a general
Dams, sediment, and channel changes and why you should care
 Dams, sediment, and channel changes and why you should care Gordon E. Grant USDA Forest Service PNW Research Station Corvallis, Oregon Dam effects on river regimes FLOW (Q) SEDIMENT (Qs) TEMP CHEMISTRY
Squaw Creek. General Information
 General Information is a tributary to the Salmon River. It enters the north side of the river about 0 miles downstream of North Fork, Idaho. The study reach is about a 30 ft length of stream about 2 miles
Geomorphology Geology 450/750 Spring Fluvial Processes Project Analysis of Redwood Creek Field Data Due Wednesday, May 26
 Geomorphology Geology 450/750 Spring 2004 Fluvial Processes Project Analysis of Redwood Creek Field Data Due Wednesday, May 26 This exercise is intended to give you experience using field data you collected
Monitoring Headwater Streams for Landscape Response to
 Monitoring Headwater Streams for Landscape Response to Climate Change Matthew Connor, PhD Connor nvironmental, nc. www.oe-i.com icom Healdsburg, California verview Headwater stream geomorphology Response
mountain rivers fixed channel boundaries (bedrock banks and bed) high transport capacity low storage input output
 high transport capacity low storage input output") mountain rivers fixed channel boundaries (bedrock banks and bed) high transport capacity low storage input output strong interaction between streams & hillslopes Sediment Budgets for Mountain Rivers Little
mountain rivers fixed channel boundaries (bedrock banks and bed) high transport capacity low storage input output strong interaction between streams & hillslopes Sediment Budgets for Mountain Rivers Little
SECTION G SEDIMENT BUDGET
 SECTION G SEDIMENT BUDGET INTRODUCTION A sediment budget has been constructed for the for the time period 1952-2000. The purpose of the sediment budget is to determine the relative importance of different
Cattaraugus Creek: A Story of Flowing Water and the Geology of the Channel It Flows Through Presentation to West Valley Citizen Task Force 4/27/16
 Cattaraugus Creek: A Story of Flowing Water and the Geology of the Channel It Flows Through Presentation to West Valley Citizen Task Force 4/27/16 Raymond C. Vaughan, Ph.D. What happens if you drop a
Landscape Development
 Landscape Development Slopes Dominate Natural Landscapes Created by the interplay of tectonic and igneous activity and gradation Deformation and uplift Volcanic activity Agents of gradation Mass wasting
Wetland & Floodplain Functional Assessments and Mapping To Protect and Restore Riverine Systems in Vermont. Mike Kline and Laura Lapierre Vermont DEC
 Wetland & Floodplain Functional Assessments and Mapping To Protect and Restore Riverine Systems in Vermont Mike Kline and Laura Lapierre Vermont DEC NWI+ Hydro-Geomorphic Characterization of Wetlands and
Sediment and sedimentary rocks Sediment
 Sediment and sedimentary rocks Sediment From sediments to sedimentary rocks (transportation, deposition, preservation and lithification) Types of sedimentary rocks (clastic, chemical and organic) Sedimentary
Each basin is surrounded & defined by a drainage divide (high point from which water flows away) Channel initiation
 Channel initiation") DRAINAGE BASINS A drainage basin or watershed is defined from a downstream point, working upstream, to include all of the hillslope & channel areas which drain to that point Each basin is surrounded &
DRAINAGE BASINS A drainage basin or watershed is defined from a downstream point, working upstream, to include all of the hillslope & channel areas which drain to that point Each basin is surrounded &
ADDRESSING GEOMORPHIC AND HYDRAULIC CONTROLS IN OFF-CHANNEL HABITAT DESIGN
 ADDRESSING GEOMORPHIC AND HYDRAULIC CONTROLS IN OFF-CHANNEL HABITAT DESIGN Conor Shea - Hydrologist U.S. Fish and Wildlife Service Conservation Partnerships Program Arcata, CA Learning Objectives Examine
The last three sections of the main body of this report consist of:
 Threatened and Endangered Species Geological Hazards Floodplains Cultural Resources Hazardous Materials A Cost Analysis section that provides comparative conceptual-level costs follows the Environmental
Linking the WEPP Model to Stability Models
 Paper No. 002150. An ASAE Meeting Presentation Linking the WEPP Model to Stability Models by W. J. Elliot S. A. Lewis Project Leader Civil Engineer Soil and Water Engineering, Rocky Mountain Research Station
ROAD SEDIMENT ASSESSMENT & MODELING: KOOTENAI-FISHER TMDL PLANNING AREA ROAD GIS LAYERS & SUMMARY STATISTICS
 ROAD SEDIMENT ASSESSMENT & MODELING: KOOTENAI-FISHER TMDL PLANNING AREA ROAD GIS LAYERS & SUMMARY STATISTICS Prepared by: ATKINS Water Resources Group 820 North Montana Avenue Helena, MT 59601 November
Unit E: Basic Principles of Soil Science. Lesson 2: Understanding Soil Formation
 Unit E: Basic Principles of Soil Science Lesson 2: Understanding Soil Formation Important Terms Alluvium Bedrock Chemical weathering Climate Glacial till Loess Native vegetation Organic matter Outwash
Stream Simulation: A Simple Example
 Stream Simulation: A Simple Example North Thompson Creek, CO Paul T. Anderson U.S.D.A. Forest Service Here s How We Started May 2011 2-1 USDA-Forest Service Here s How We Finished Forest Service Aquatic
Rivers T. Perron
 1 Rivers T. Perron 12.001 After our discussions of large-scale topography, how we represent topography in maps, and how topography interacts with geologic structures, you should be frothing at the mouth
Rosgen Classification Unnamed Creek South of Dunka Road
 Rosgen Classification Unnamed Creek South of Dunka Road Prepared for Poly Met Mining Inc. September 2013 Rosgen Classification Unnamed Creek South of Dunka Road Prepared for Poly Met Mining Inc. September
PREDICTING BACKGROUND AND RISK-BASED SEDIMENTATION FOR FOREST WATERSHED TMDLS
 This is not a peer-reviewed article. Watershed Management to Meet Water Quality Standards and TMDLS (Total Maximum Daily Load) Proceedings of the Fourth Conference 10-14 March 2007 (San Antonio, Texas
Betsy Stevenson and Allison Mohrs (Skagit County Planning and Development Services) Jenny Baker, The Nature Conservancy
 Jenny Baker, The Nature Conservancy") TC Fisher Slough Final Design and Permitting Subject: Well Review Memorandum To: From: Betsy Stevenson and Allison Mohrs (Skagit County Planning and Development Services) Jenny Baker, The ature Conservancy
TC Fisher Slough Final Design and Permitting Subject: Well Review Memorandum To: From: Betsy Stevenson and Allison Mohrs (Skagit County Planning and Development Services) Jenny Baker, The ature Conservancy
Rapid Geomorphic Assessments: RGA s
 Establishing Current Reference Conditions Rates and concentrations of suspended-sediment transport vary over time and space due to factors such as precipitation characteristics and discharge, geology,
GLG362/GLG598 Geomorphology K. Whipple October, 2009 I. Characteristics of Alluvial Channels
 I. Characteristics of Alluvial Channels Self-formed morphology set by entrainment, transport, and deposition They move unconsolidated sedimentary materials present in the valley fill flood plain/bank flow
GEOL 1121 Earth Processes and Environments
 GEOL 1121 Earth Processes and Environments Wondwosen Seyoum Department of Geology University of Georgia e-mail: seyoum@uga.edu G/G Bldg., Rm. No. 122 Seyoum, 2015 Chapter 6 Streams and Flooding Seyoum,
Chapter 3 Erosion in the Las Vegas Wash
 Chapter 3 Erosion in the Las Vegas Wash Introduction As described in Chapter 1, the Las Vegas Wash (Wash) has experienced considerable change as a result of development of the Las Vegas Valley (Valley).
Influence of the Major Drainages to the Mississippi River and Implications for System Level Management
 Influence of the Major Drainages to the Mississippi River and Implications for System Level Management Brian M. Vosburg Geologist Louisiana Coastal Protection and Restoration Authority brian.vosburg@la.gov
Distinct landscape features with important biologic, hydrologic, geomorphic, and biogeochemical functions.
 1 Distinct landscape features with important biologic, hydrologic, geomorphic, and biogeochemical functions. Have distinguishing characteristics that include low slopes, well drained soils, intermittent
Soil Formation. Lesson Plan: NRES B2-4
 Soil Formation Lesson Plan: NRES B2-4 1 Anticipated Problems 1. What are five different factors that affect soil formation? 2. What are some different types of parent material that affect soils? 3. What
PHYSICAL GEOGRAPHY. By Brett Lucas
 PHYSICAL GEOGRAPHY By Brett Lucas FLUVIAL PROCESSES Fluvial Processes The Impact of Fluvial Processes on the Landscape Streams and Stream Systems Stream Channels Structural Relationships The Shaping and
Solutions to Flooding on Pescadero Creek Road
 Hydrology Hydraulics Geomorphology Design Field Services Photo courtesy Half Moon Bay Review Solutions to Flooding on Pescadero Creek Road Prepared for: San Mateo County Resource Conservation District
Avoiding Geohazards in the Mid-Atlantic Highlands by Using Natural Stream Principles
 Avoiding Geohazards in the Mid-Atlantic Highlands by Using Natural Stream Principles J. Steven Kite, WVU Neal Carte, WVDOT Will Harman, Michael Baker Corp. Donald D. Gray, WVU Photo: W. Gillespie North
May 7, Roger Leventhal, P.E. Marin County Public Works Laurel Collins Watershed Sciences
 May 7, 2013 Roger Leventhal, P.E. Marin County Public Works Laurel Collins Watershed Sciences Background Funded in 2009 under EPA 2100 Grant for $30k and managed by SFEP Project Goals: Update original
Waterbury Dam Disturbance Mike Fitzgerald Devin Rowland
 Waterbury Dam Disturbance Mike Fitzgerald Devin Rowland Abstract The Waterbury Dam was completed in October 1938 as a method of flood control in the Winooski Valley. The construction began in April1935
DETAILED DESCRIPTION OF STREAM CONDITIONS AND HABITAT TYPES IN REACH 4, REACH 5 AND REACH 6.
 DETAILED DESCRIPTION OF STREAM CONDITIONS AND HABITAT TYPES IN REACH 4, REACH 5 AND REACH 6. The Eklutna River was divided into study reaches (figure 1) prior to this site visit. Prominent geologic or
Great Lakes Online Watershed Interface W. Elliot, Research Engineer USDA Forest Service Rocky Mountain Research Station, Moscow, ID March, 2016
 Great Lakes Online Watershed Interface W. Elliot, Research Engineer USDA Forest Service Rocky Mountain Research Station, Moscow, ID March, 2016 Guidelines for using the Web WEPP Watershed Tool to Support
Opportunities to Improve Ecological Functions of Floodplains and Reduce Flood Risk along Major Rivers in the Puget Sound Basin
 Opportunities to Improve Ecological Functions of Floodplains and Reduce Flood Risk along Major Rivers in the Puget Sound Basin Christopher Konrad, US Geological Survey Tim Beechie, NOAA Fisheries Managing
Diego Burgos. Geology 394. Advisors: Dr. Prestegaard. Phillip Goodling
 Sediment Transport into an Urban Tributary Junction Diego Burgos Geology 394 Advisors: Dr. Prestegaard Phillip Goodling 1 Abstract Tributary junctions are an important component of stream morphology and
GRAPEVINE LAKE MODELING & WATERSHED CHARACTERISTICS
 GRAPEVINE LAKE MODELING & WATERSHED CHARACTERISTICS Photo Credit: Lake Grapevine Boat Ramps Nash Mock GIS in Water Resources Fall 2016 Table of Contents Figures and Tables... 2 Introduction... 3 Objectives...
Date of Report: EPA agreement number: Center Name and Institution of Ctr. Director: Identifier used by Center for Project: Title of Project:
 Date of Report: March 31, 2003 EPA agreement number: R829515C003 Center Name and Institution of Ctr. Director: Rocky Mountain Regional Hazardous Substance Research Center, Colorado State University, Fort
Eagle Creek Post Fire Erosion Hazard Analysis Using the WEPP Model. John Rogers & Lauren McKinney
 Eagle Creek Post Fire Erosion Hazard Analysis Using the WEPP Model John Rogers & Lauren McKinney Columbia River Gorge at Risk: Using LiDAR and GIS-based predictive modeling for regional-scale erosion susceptibility
Riparian Assessment. Steps in the right direction... Drainage Basin/Watershed: Start by Thinking Big. Riparian Assessment vs.
 Riparian Assessment vs. Monitoring Riparian Assessment What is a healthy stream? Determine stream/riparian health Determine change or trend, especially in response to mgmt Classification = designation
Step 5: Channel Bed and Planform Changes
 Step 5: Channel Bed and Planform Changes When disturbed, streams go through a series of adjustments to regain equilibrium with the flow and sediment supply of their watersheds. These adjustments often
Roger Andy Gaines, Research Civil Engineer, PhD, P.E.
 Roger Andy Gaines, Research Civil Engineer, PhD, P.E. Research Civil Engineer/Regional Technical Specialist Memphis District August 24, 2010 Objectives Where we have been (recap of situation and what s
Lab 7: Sedimentary Structures
 Name: Lab 7: Sedimentary Structures Sedimentary rocks account for a negligibly small fraction of Earth s mass, yet they are commonly encountered because the processes that form them are ubiquitous in the
Appendix III-A Descriptions of Channel Habitat Types
 Appendix III-A Descriptions of Channel Habitat Types Table of Contents Channel Habitat Typing Background... 3 Small Estuarine Channel (ES)... 7 Large Estuarine Channel (EL)... 9 Low Gradient Large Floodplain
Sediment yield estimation from a hydrographic survey: A case study for the Kremasta reservoir, Western Greece
 Sediment yield estimation from a hydrographic survey: A case study for the Kremasta reservoir, Western Greece 5 th International Conference Water Resources Management in the Era of Transition,, Athens,
STUDY GUIDE FOR CONTENT MASTERY. Surface Water Movement
 Surface Water SECTION 9.1 Surface Water Movement In your textbook, read about surface water and the way in which it moves sediment. Complete each statement. 1. An excessive amount of water flowing downslope
SUPPLEMENTAL MATERIAL
 SUPPLEMENTAL MATERIAL DESCRIPTIONS OF OTHER STRATIGRAPHIC SECTIONS Cherry Creek In its middle reaches, Cherry Creek meanders between three paired terraces within a narrow bedrock valley. The highest is
Watershed Application of WEPP and Geospatial Interfaces. Dennis C. Flanagan
 Watershed Application of WEPP and Geospatial Interfaces Dennis C. Flanagan Research Agricultural Engineer USDA-Agricultural Research Service Adjunct Professor Purdue Univ., Dept. of Agric. & Biol. Eng.
Name: Which rock layers appear to be most resistant to weathering? A) A, C, and E B) B and D
 A, C, and E B) B and D") Name: 1) The formation of soil is primarily the result of A) stream deposition and runoff B) precipitation and wind erosion C) stream erosion and mass movement D) weathering and biological activity 2)
Name: 1) The formation of soil is primarily the result of A) stream deposition and runoff B) precipitation and wind erosion C) stream erosion and mass movement D) weathering and biological activity 2)
Floodplain modeling. Ovidius University of Constanta (P4) Romania & Technological Educational Institute of Serres, Greece
 Romania & Technological Educational Institute of Serres, Greece") Floodplain modeling Ovidius University of Constanta (P4) Romania & Technological Educational Institute of Serres, Greece Scientific Staff: Dr Carmen Maftei, Professor, Civil Engineering Dept. Dr Konstantinos
Floodplain modeling Ovidius University of Constanta (P4) Romania & Technological Educational Institute of Serres, Greece Scientific Staff: Dr Carmen Maftei, Professor, Civil Engineering Dept. Dr Konstantinos
Laboratory Exercise #3 The Hydrologic Cycle and Running Water Processes
 Laboratory Exercise #3 The Hydrologic Cycle and Running Water Processes page - 1 Section A - The Hydrologic Cycle Figure 1 illustrates the hydrologic cycle which quantifies how water is cycled throughout
Summary of Hydraulic and Sediment-transport. Analysis of Residual Sediment: Alternatives for the San Clemente Dam Removal/Retrofit Project,
 Appendix N SUMMARY OF HYDRAULIC AND SEDIMENT-TRANSPORT ANALYSIS OF RESIDUAL SEDIMENT: ALTERNATIVES FOR THE SAN CLEMENTE DAM REMOVAL/RETROFIT PROJECT, CALIFORNIA the San Clemente Dam Removal/Retrofit Project,
Sediment and Sedimentary rock
 Sediment and Sedimentary rock Sediment: An accumulation of loose mineral grains, such as boulders, pebbles, sand, silt or mud, which are not cemented together. Mechanical and chemical weathering produces
Business. Meteorologic monitoring. Field trip? Reader. Other?
 Business Meteorologic monitoring Field trip? Reader Other? Classification Streams Characterization Discharge measurements Why classify stream channels? Why Classify Stream Channels? Provides a common language
Appendix K.2: Sediment Management Excerpt from South Orange County Hydromodification Management Plan
 Appendix K.2: Sediment Management Excerpt from South Orange County Hydromodification Management Plan 4 Sediment Supply Management Requirements Permit Order R9-2013-0001 as amended by Order No. R9-2015-0001Section
Assessment of Concave and Linear Hillslopes for Post-Mining Landscapes 1
 Assessment of Concave and Hillslopes for Post-Mining Landscapes 1 Sumith Priyashantha 2, Brian Ayres 3, Mike O Kane 4, and Mike Fawcett 5 2 O Kane Consultants Inc., 2312 Arlington Avenue, Saskatoon, SK,
Track design and management
 1 Track design and management Peter Fogarty, Certified Professional Soil Scientist NSW Soil Knowledge Network Cooma, June 18, 2018 Acknowledgements Antia Brademann, Cooma Waterwatch, Organiser Jo Powells,
1 INTRODUCTION AND MAJOR FINDINGS... 1
 Memorandum To: Lindsey Clark, Stillwater Valley Watershed Council Coordinator From: Chad Raisland, Pioneer Technical Services, Inc. and Karin Boyd, Applied Geomorphology, Inc. CC: Tanya Lester, Stillwater
Landslide Computer Modeling Potential
 Landslide Computer Modeling Potential Michael D. Dixon, P.E. Civil Engineer Payette National Forest The Payette National Forest selected the Stability Index Mapping (SINMAP) model for use in identifying
Topic 6: Weathering, Erosion and Erosional-Deposition Systems (workbook p ) Workbook Chapter 4, 5 WEATHERING
 Workbook Chapter 4, 5 WEATHERING") Topic 6: Weathering, Erosion and Erosional-Deposition Systems (workbook p. 95-125) Workbook Chapter 4, 5 THE BIG PICTURE: Weathering, erosion and deposition are processes that cause changes to rock material
Topic 6: Weathering, Erosion and Erosional-Deposition Systems (workbook p. 95-125) Workbook Chapter 4, 5 THE BIG PICTURE: Weathering, erosion and deposition are processes that cause changes to rock material
7.3 Sediment Delivery Analysis
 7.3 Sediment Delivery Analysis In order to evaluate potential changes in sedimentation patterns that could occur due to impacts from the FCP and LPP alignments, sediment assessment models were constructed
How Do Human Impacts and Geomorphological Responses Vary with Spatial Scale in the Streams and Rivers of the Illinois Basin?
 How Do Human Impacts and Geomorphological Responses Vary with Spatial Scale in the Streams and Rivers of the Illinois Basin? Bruce Rhoads Department of Geography University of Illinois at Urbana-Champaign
Lower South Fork McKenzie River Floodplain Enhancement Project
 Lower South Fork McKenzie River Floodplain Enhancement Project McKenzie River Ranger District Willamette National Forest Project Location The project is located in the South Fork McKenzie River Watershed,
Geomorphic Importance of Winter Peak Flows and Annual Snowmelt Hydrographs in a Sierra Nevada Boulder-Bedrock River
 Geomorphic Importance of Winter Peak Flows and Annual Snowmelt Hydrographs in a Sierra Nevada Boulder-Bedrock River Scott McBain and Bill Trush McBain & Trush, Inc. Clavey River and Cherry Creek vicinity
Which map shows the stream drainage pattern that most likely formed on the surface of this volcano? A) B)
 B)") 1. When snow cover on the land melts, the water will most likely become surface runoff if the land surface is A) frozen B) porous C) grass covered D) unconsolidated gravel Base your answers to questions
1. When snow cover on the land melts, the water will most likely become surface runoff if the land surface is A) frozen B) porous C) grass covered D) unconsolidated gravel Base your answers to questions
Development of a GIS Interface for WEPP Model Application to Great Lakes Forested Watersheds
 Development of a GIS Interface for WEPP Model Application to Great Lakes Forested Watersheds J.R. Frankenberger 1, S. Dun 2, D.C. Flanagan 1, J.Q. Wu 2, W.J. Elliot 3 1 USDA-ARS, West Lafayette, IN 2 Washington
SCOPE OF PRESENTATION STREAM DYNAMICS, CHANNEL RESTORATION PLANS, & SEDIMENT TRANSPORT ANALYSES IN RELATION TO RESTORATION PLANS
 DESIGN METHODS B: SEDIMENT TRANSPORT PROCESSES FOR STREAM RESTORATION DESIGN PETER KLINGEMAN OREGON STATE UNIVERSITY CIVIL ENGINEERING DEPT., CORVALLIS 2 ND ANNUAL NORTHWEST STREAM RESTORATION DESIGN SYMPOSIUM
Scientific research and tools to support management and protection of water supplies from the effects of wildfires
 Scientific research and tools to support management and protection of water supplies from the effects of wildfires Deborah A., Martin, U.S. Geological Survey Managing for Uncertainty and Climatic Variability:
UPPER TUOLUMNE RIVER ECOSYSTEM PROJECT Preliminary Sediment Source and Sediment Transport Capacity Evaluation: O Shaughnessy Dam to Poopenaut Valley
 UPPER TUOLUMNE RIVER ECOSYSTEM PROJECT Preliminary Sediment Source and Sediment Transport Capacity Evaluation: O Shaughnessy Dam to Poopenaut Valley Technical Memorandum McBain & Trush, Inc. and RMC Environmental
The subject paper is being submitted for approval for publication in the annual volume entitled Geological Survey Research.
 Water Resources Division 345 Middlefield Road Menlo Park, California January 12, 1965 Memorandum To: Mr. Frank E. Clark, Chief, General Hydrology Branch Thru: Area Hydrologist PCA From: Valmore C. LaMarche
NetMap''' Watershed'Database'and'Analysis'System'
 NetMap' Watershed'Database'and'Analysis'System' Earth'Systems'Ins8tute' Sea:le/Mt.'Shasta/Fort'Collins' NetMap: A collaborative enterprise since 2007 -US National Forests (WA, OR, NCA, AK, ID, MT) -US
Do you think sediment transport is a concern?
 STREAM RESTORATION FRAMEWORK AND SEDIMENT TRANSPORT BASICS Pete Klingeman 1 What is Your Restoration Project Like? k? Do you think sediment transport is a concern? East Fork Lewis River, WA Tidal creek,
High-Gradient Streams
 Chapter 4 Surface Processes Section 4 High-Gradient Streams What Do You See? Learning Outcomes In this section, you will Use models and real-time streamflow data to understand the characteristics of highgradient
Geo 302D: Age of Dinosaurs. LAB 2: Sedimentary rocks and processes
 Geo 302D: Age of Dinosaurs LAB 2: Sedimentary rocks and processes Last week we covered the basic types of rocks and the rock cycle. This lab concentrates on sedimentary rocks. Sedimentary rocks have special