EPMA IMAGES. Figure 9. Energy-dispersive spectra of spot mineral analyses in sample 89GGR-33A for locations 1-5 in Figure 8.
|
|
|
- Walter Lane
- 6 years ago
- Views:
Transcription
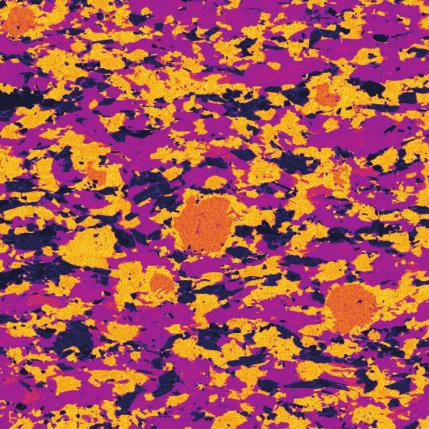
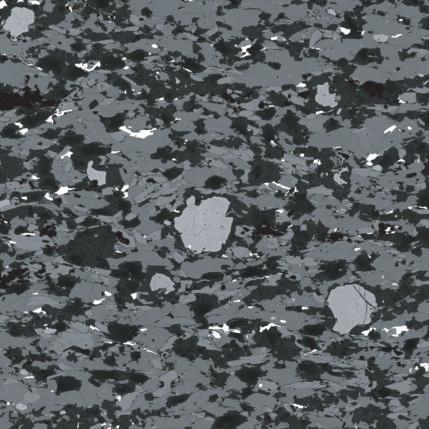
1 EPMA IMAGES The attached images and mineral data can be used to supplement an instrument-based lab, or serve as the basis for lab that can be completed without an instrument. Please provide credit for the images as given. Figure 1. Principal beam-sample interactions. (a) Electron phenomena resulting from an impinging beam of electrons on a flat sample. (b) Electron-sample interactions within the interaction volume, whose size depends on beam energy and sample characteristics (primarily average atomic number, or atomic density). Additional diagrams to illustrate the schematics of a microprobe or SEM, ionization phenomena, electron shell structure, etc., can be found in Goldstein et al. (1992). Figure 2. Secondary electron (SE) images. (a) Fossil diatoms. (b) Galena (PbS) crystals. Images courtesy Ellery Frahm, University of Minnesota Microprobe Lab. Figure 3. Back-scattered electron (BSE) image of sample of pelitic schist from Antarctica. Field of view is approximately 5 mm. In general, brighter minerals have higher mean Z (where Z is atomic number). Figure 4. X-ray composition maps collected by rastering the electron beam over an area of devitrified volcanic glass. BSE image (upper left) shows overall compositional variation as differences in mean Z. Remaining images show relative abundances of specific elements. Brighter areas reflect higher concentration. Images courtesy Ellery Frahm, University of Minnesota Microprobe Lab. Figure 5. X-ray composition maps of plagioclase phenocrysts in volcanic glass, showing oscillatory growth zonation. Images courtesy Ellery Frahm, University of Minnesota Microprobe Lab. Figure 6. X-ray composition maps of phenocrysts in volcanic glass, intergrown with magnetite grains. Images courtesy Ellery Frahm, University of Minnesota Microprobe Lab. Figure 7. Thin section photomicrographs of sample 89GGR-33A, a pelitic schist from the Ross orogen, Transantarctic Mountains, Antarctica. Field of view is approximately 8 mm. Figure 8. Back-scattered electron image map of a section of sample 89GGR-33A. Numbered circles correspond to spot locations where EDS spectra were collected. Figure 9. Energy-dispersive spectra of spot mineral analyses in sample 89GGR-33A for locations 1-5 in Figure 8.
2 Figure 10. Energy-dispersive spectra of spot mineral analyses in sample 89GGR-33A for locations 6-10 in Figure 8. Figure 11. Back-scattered and element composition maps for Area B of sample 89GGR- 33A. Figure 12. Element composition maps for Area C of sample 89GGR-33A. Figure 13. Thin section photomicrographs of sample 89GGR-33B, an amphibolite from the Ross orogen, Transantarctic Mountains, Antarctica. Field of view is approximately 5 mm. Figure 14. Back-scattered and element composition maps for a section of sample 89GGR-33B shown in Figure 13. Figure 15. Energy-dispersive spectra of spot mineral analyses in sample 89GGR-33B for locations 1-4 in Figure 14.
3 ELECTRON PROBE ANALYSES Mineral #1 SiO TiO Al2O MgO 3.39 CaO 1.22 MnO 0.41 Fe as FeO Na2O 0.03 K2O 0.01 Mineral #5 SiO TiO Al2O MgO 5.95 CaO 0.02 MnO 0.01 Fe as FeO Na2O 0.13 K2O 9.09
4 a incident electron beam back-scattered e's characteristic X-rays secondary e's Bremsstrahlung X-rays Auger e's visible light (cathodoluminescence) heat sample diffracted e's transmitted e's b sample Auger e's secondary e's characteristic X-rays electron interaction volume back-scattered e's Bremsstrahlung X-rays secondary fluorescence Figure 1. Principal beam-sample interactions. (a) Electron phenomena resulting from an impinging beam of electrons on a flat sample. (b) Electron-sample interactions within the interaction volume, whose size depends on beam energy and sample characteristics
 b University of Minnesota microprobe lab (Analyst:")
 Galena (PbS) crystals.")
5 SECONDARY ELECTRON (SE) IMAGES a University of Minnesota microprobe lab (Analyst: Ellery Frahm) b University of Minnesota microprobe lab (Analyst: Ellery Frahm) Figure 2. Secondary electron (SE) images. (a) Fossil diatoms. (b) Galena (PbS) crystals. Images courtesy Ellery Frahm, University of Minnesota Microprobe Lab.
6 BACK-SCATTERED ELECTRON (BSE) IMAGE Mg Figure 3. Back-scattered electron (BSE) image of sample of pelitic schist from Antarctica. Field of view is approximately 5 mm. In general, brighter minerals have higher mean Z (where Z is atomic number).
 shows overall compositional variation as differences in mean Z.")
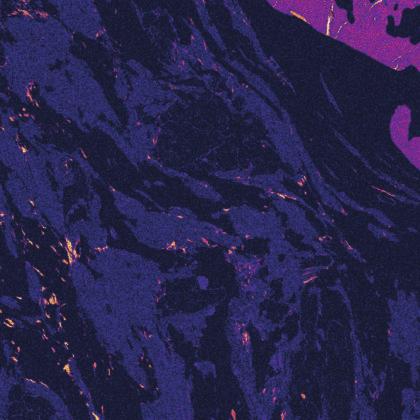
7 X-ray COMPOSITION MAPS BSE Al Ca Fe Mg Si University of Minnesota microprobe lab (Analyst: Ellery Frahm) Figure 4. X-ray composition maps collected by rastering the electron beam over an area of devitrified volcanic glass. BSE image (upper left) shows overall compositional variation as differences in mean Z. Remaining images show relative abundances of specific elements. Brighter areas reflect higher concentration.
 Figure 5.")

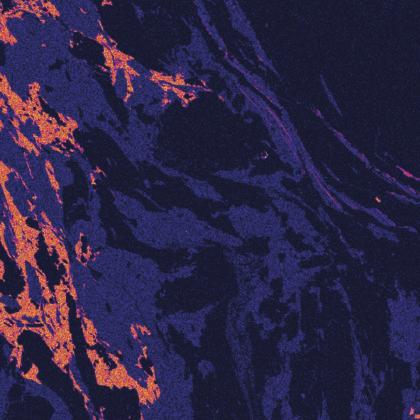
8 X-ray COMPOSITION MAPS University of Minnesota microprobe lab (Analyst: Ellery Frahm) Figure 5. X-ray composition maps of plagioclase phenocrysts in volcanic glass, showing oscillatory growth zonation.
")

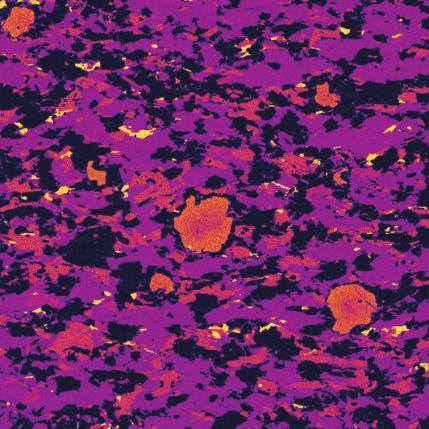
9 X-ray COMPOSITION MAPS Al Si Mg Fe University of Minnesota microprobe lab (Analyst: Ellery Frahm) Figure 6. X-ray composition maps of phenocrysts in volcanic glass, intergrown with magnetite grains.


10 89GGR-33A Plane-polarized light Crossed-polarized light Figure 7. Thin section photomicrographs of sample 89GGR-33A, a pelitic schist from the Ross orogen, Transantarctic Mountains, Antarctica. Field of view is approximately 8 mm.


11 89GGR-33A: BSE map A B C 4 1 mm D Figure 8. Back-scattered electron image map of a section of sample 89GGR-33A. Numbered circles correspond to spot locations where EDS spectra were collected.

12 89GGR-33A 1 2 Counts Energy (kev) Figure 9. Energy-dispersive spectra of spot mineral analyses in sample 89GGR- 33A for locations 1-5 in Figure 8.

13 89GGR-33A 6 7 Counts Energy (kev) Figure 10. Energy-dispersive spectra of spot mineral analyses in sample 89GGR-33A for locations 6-10 in Figure 8.
")

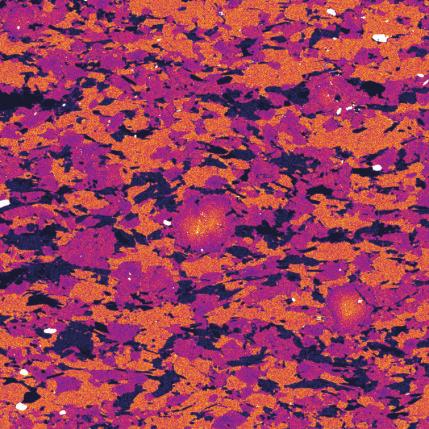
14 89GGR-33A (Area B) BSE Si Al Ca Fe Ti Figure 11. Back-scattered and element composition maps for Area B of sample 89GGR-33A.
")


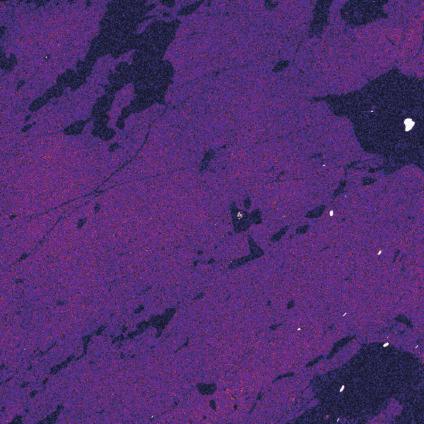
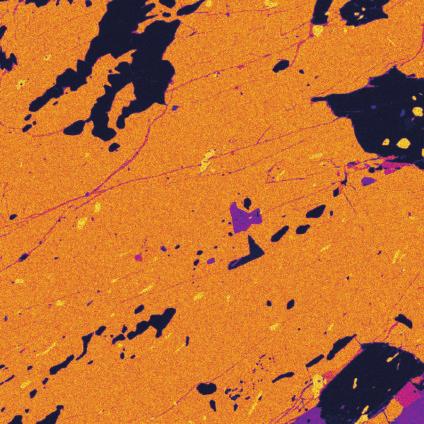
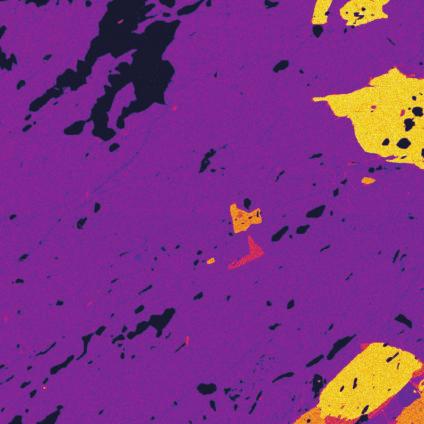
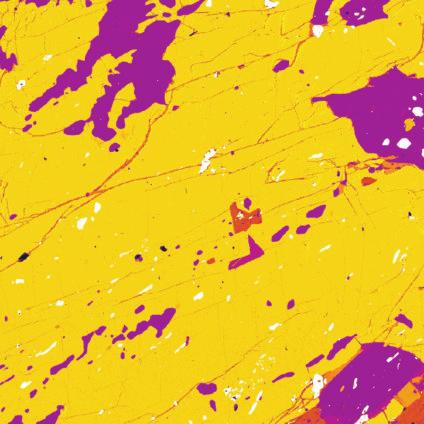
15 89GGR-33A (Area C) Si Al Mg K Ca Na Figure 12. Element composition maps for Area C of sample 89GGR-33A.


16 89GGR-33B 6 Plane-polarized light Crossed-polarized light Figure 13. Thin section photomicrographs of sample 89GGR-33B, an amphibolite from the Ross orogen, Transantarctic Mountains, Antarctica. Field of view is approximately 5 mm.


17 89GGR-33B BSE Si Mg Fe Al Ca Figure 14. Back-scattered and element composition maps for a section of sample 89GGR33B shown in Figure 13.

18 89GGR-33B 1 2 Counts 3 4 Energy (kev) Figure 15. Energy-dispersive spectra of spot mineral analyses in sample 89GGR-33B for locations 1-4 in Figure 14.
Metcalf and Buck. GSA Data Repository
 GSA Data Repository 2015035 Metcalf and Buck Figure DR1. Secondary ionization mass-spectrometry U-Pb zircon geochronology plots for data collected on two samples of Wilson Ridge plutonic rocks. Data presented
Characterization of Montana Grow Product David Mogk January 16, 2014
 Characterization of Montana Grow Product David Mogk January 16, 2014 Samples of the raw material that is used in the production of Montana Grow products were characterized using X- ray Powder Diffraction
Trinitite the Atomic Rock
 Trinitite the Atomic Rock Nelson Eby, EEAS, University of Massachusetts, Lowell, MA Norman Charnley, Earth Sciences, University of Oxford, Oxford, UK John Smoliga, Roxbury, CT Special thanks to Robert
Supporting Information
 Supporting Information Bindi et al. 10.1073/pnas.1111115109 Fig. S1. Electron microprobe X-ray elemental maps for the grain reported in Fig. 1B. Experimental details are given in Experimental Methods.
Electron Microprobe Analysis 1 Nilanjan Chatterjee, Ph.D. Principal Research Scientist
 12.141 Electron Microprobe Analysis 1 Nilanjan Chatterjee, Ph.D. Principal Research Scientist Massachusetts Institute of Technology Electron Microprobe Facility Department of Earth, Atmospheric and Planetary
Electron Microprobe Analysis 1 Nilanjan Chatterjee, Ph.D. Principal Research Scientist
 12.141 Electron Microprobe Analysis 1 Nilanjan Chatterjee, Ph.D. Principal Research Scientist Massachusetts Institute of Technology Electron Microprobe Facility Department of Earth, Atmospheric and Planetary
Electron probe microanalysis - Electron microprobe analysis EPMA (EMPA) What s EPMA all about? What can you learn?
 What s EPMA all about? What can you learn?") Electron probe microanalysis - Electron microprobe analysis EPMA (EMPA) What s EPMA all about? What can you learn? EPMA - what is it? Precise and accurate quantitative chemical analyses of micron-size
Electron probe microanalysis - Electron microprobe analysis EPMA (EMPA) What s EPMA all about? What can you learn? EPMA - what is it? Precise and accurate quantitative chemical analyses of micron-size
Massachusetts Institute of Technology. Dr. Nilanjan Chatterjee
 Massachusetts Institute of Technology Dr. Nilanjan Chatterjee Electron Probe Micro-Analysis (EPMA) Imaging and micrometer-scale chemical compositional analysis of solids Signals produced in The Electron
Electron Microprobe Analysis and Scanning Electron Microscopy
 Electron Microprobe Analysis and Scanning Electron Microscopy Electron microprobe analysis (EMPA) Analytical technique in which a beam of electrons is focused on a sample surface, producing X-rays from
Treatment of Data. Methods of determining analytical error -Counting statistics -Reproducibility of reference materials -Homogeneity of sample
 Treatment of Data Methods of determining analytical error -Counting statistics -Reproducibility of reference materials -Homogeneity of sample Detection Limits Assessment of analytical quality -Analytical
GSA Data Repository
 GSA Data Repository 2019057 1 METHODS Grain Boundary Imaging and Orientation Analysis Backscatter electron (BSE) maps of thin sections were acquired using the FEI Verios XHR scanning electron microscope
EDS User School. Principles of Electron Beam Microanalysis
 EDS User School Principles of Electron Beam Microanalysis Outline 1.) Beam-specimen interactions 2.) EDS spectra: Origin of Bremsstrahlung and characteristic peaks 3.) Moseley s law 4.) Characteristic
Breeding et al., Data Repository Material Figure DR1. Athens. Study Area
 Breeding, Ague, and Brocker 1 Figure DR1 21 o 24 Greece o A 38 o Athens Tinos 37 o Syros Attic-Cycladic Blueschist Belt Syros Kampos B Study Area Ermoupoli N Vari Unit Cycladic HP-LT Unit Marble horizons
APPENDIX TABLES. Table A2. XRF analytical results for samples from drill hole AP5 (Areachap)
") APPENDIX TABLES Table A2. XRF analytical results for samples from drill hole AP5 (Areachap) Sample No. AP5/19 AP5/20 AP5/21 AP5/22 AP5/23 AP5/24 AP5/25AP5/26AP5/27AP5/28AP5/29AP5/30AP5/31AP5/32 AP5/33
APPENDIX TABLES Table A2. XRF analytical results for samples from drill hole AP5 (Areachap) Sample No. AP5/19 AP5/20 AP5/21 AP5/22 AP5/23 AP5/24 AP5/25AP5/26AP5/27AP5/28AP5/29AP5/30AP5/31AP5/32 AP5/33
XUV 773: X-Ray Fluorescence Analysis of Gemstones
 Fischer Application report vr118 HELM UT FISCHER GMBH + CO. KG Institut für Elektronik und Messtechnik Industriestrasse 21-7169 Sindelfingen, Germany Tel.: (+49) 731 33- - Fax: (+49) 731 33-79 E-Mail:
WORKING WITH ELECTRON MICROPROBE DATA FROM A HIGH PRESSURE EXPERIMENT CALCULATING MINERAL FORMULAS, UNIT CELL CONTENT, AND GEOTHERMOMETRY
 WORKING WITH ELECTRON MICROPROBE DATA FROM A HIGH PRESSURE EXPERIMENT CALCULATING MINERAL FORMULAS, UNIT CELL CONTENT, AND GEOTHERMOMETRY Brandon E. Schwab Department of Geology Humboldt State University
MT Electron microscopy Scanning electron microscopy and electron probe microanalysis
 MT-0.6026 Electron microscopy Scanning electron microscopy and electron probe microanalysis Eero Haimi Research Manager Outline 1. Introduction Basics of scanning electron microscopy (SEM) and electron
APPENDICES. Appendix 1
 Corthouts, T.L., Lageson, D.R., and Shaw, C.A., 2016, Polyphase deformation, dynamic metamorphism and metasomatism of Mount Everest s summit limestone, east central Himalaya, Nepal/Tibet: Lithosphere,
Supplementary Materials for
 advances.sciencemag.org/cgi/content/full/2/3/e1501725/dc1 Supplementary Materials for Discovery of natural MgSiO3 tetragonal garnet in a shocked chondritic meteorite The PDF file includes: Naotaka Tomioka,
Chapter IV MINERAL CHEMISTRY
 Chapter IV MINERAL CHEMISTRY Chapter-IV MINERAL CHEMISTRY 4.1 INTRODUCTION In this chapter, chemical analyses of different minerals present in various rocks of Mashhad granitoid plutons have been presented.
LAB REPORT ON XRF OF POTTERY SAMPLES By BIJOY KRISHNA HALDER Mohammad Arif Ishtiaque Shuvo Jie Hong
 LAB REPORT ON XRF OF POTTERY SAMPLES By BIJOY KRISHNA HALDER Mohammad Arif Ishtiaque Shuvo Jie Hong Introduction: X-ray fluorescence (XRF) spectrometer is an x-ray instrument used for routine, relatively
h p λ = mν Back to de Broglie and the electron as a wave you will learn more about this Equation in CHEM* 2060
 Back to de Broglie and the electron as a wave λ = mν h = h p you will learn more about this Equation in CHEM* 2060 We will soon see that the energies (speed for now if you like) of the electrons in the
Applications in Geosciences EPMA
 Applications in Geosciences EPMA SX: Applications in Geosciences The frontier of geological applications for EPMA lies in precise and accurate trace element measurements. Recent years have seen the development
A4 CAI COMPOSITION: DIVALENT ELEMENT PARTITIONING AND CATHODOLUMINESCENCE. A4.1 Anorthite and Melt compositions for Synthetic CAI Composition 224SAM
 147 A4 CAI COMPOSITION: DIVALENT ELEMENT PARTITIONING AND CATHODOLUMINESCENCE A4.1 Anorthite and Melt compositions for Synthetic CAI Composition 224SAM Anorthite-melt partitioning of divalent elements
XM1/331 XM1/331 BLFX-3 XM1/331
 a b AkC AkC strontian fluoro-apatite clinopyroxene phlogopite K-richterite XM1/331 clinopyroxene XM1/331 Fe-Ti ox c d clinopyroxene kric AkC ilmenite Sr-barite AkC XM1/331 BLFX-3 Supplementary Figure 1.
Understanding X-rays: The electromagnetic spectrum
 Understanding X-rays: The electromagnetic spectrum 1 ULa 13.61 kev 0.09 nm BeKa 0.11 kev 11.27 nm E = hn = h c l where, E : energy, h : Planck's constant, n : frequency c : speed of light in vacuum, l
MT Electron microscopy Scanning electron microscopy and electron probe microanalysis
 MT-0.6026 Electron microscopy Scanning electron microscopy and electron probe microanalysis Eero Haimi Research Manager Outline 1. Introduction Basics of scanning electron microscopy (SEM) and electron
Chromite and tourmaline chemical composition as a guide to mineral exploration
 Chromite and tourmaline chemical composition as a guide to mineral exploration Gabriel Voicu Université du Québec à Montréal, Canada and Cambior Management Services Content of presentation Part 1 Chromite
TECHNICAL PROCEDURE. FEB 16 am TP-8.7 NYE COUNTY NUCLEAR WASTE REPOSITORY PROJECT OFFICE SEM, TEM, ELECTRON MICROPROBE PROCEDURE. Revision: 0 TITLE:
 NYE COUN1Y NYE COUNTY NUCLEAR WASTE REPOSITORY PROJECT OFFICE TECHNICAL PROCEDURE TITLE: SEM, TEM, ELECTRON MICROPROBE PROCEDURE PROCEDURE No.: SUPERSEDES: Revision: 0 Date: 11-01-00 Pa e: lof 5 TP-8.7
Geos 306, Mineralogy Final Exam, Dec 12, pts
 Name: Geos 306, Mineralogy Final Exam, Dec 12, 2014 200 pts 1. (9 pts) What are the 4 most abundant elements found in the Earth and what are their atomic abundances? Create a reasonable hypothetical charge-balanced
X-ray Energy Spectroscopy (XES).
.") X-ray Energy Spectroscopy (XES). X-ray fluorescence as an analytical tool for element analysis is based on 3 fundamental parameters: A. Specificity: In determining an x-ray emission energy E certainty
X-ray Energy Spectroscopy (XES). X-ray fluorescence as an analytical tool for element analysis is based on 3 fundamental parameters: A. Specificity: In determining an x-ray emission energy E certainty
Observations Regarding Automated SEM and SIMS Analysis of Minerals. Kristofor Ingeneri. April 22, 2009
 Observations Regarding Automated SEM and SIMS Analysis of Minerals Kristofor Ingeneri April 22, 2009 Forensic Geoscience A field of inquiry that utilizes techniques developed in the geosciences (geology,
Electron Probe Microanalysis (EPMA)
") Electron Probe Microanalysis (EPMA) By John J. Donovan (portions from J. I. Goldstein, D. E. Newbury, P. Echlin, D. C. Joy, C. Fiori, E. Lifshin, "Scanning Electron Microscopy and X-Ray Microanalysis",
Electron Probe Microanalysis (EPMA) By John J. Donovan (portions from J. I. Goldstein, D. E. Newbury, P. Echlin, D. C. Joy, C. Fiori, E. Lifshin, "Scanning Electron Microscopy and X-Ray Microanalysis",
Chemical Analysis of Anorthosites near Silver Bay, MN. Andrea Oswald Petrology 422, NDSU Spring 2016
 Chemical Analysis of Anorthosites near Silver Bay, MN Andrea Oswald Petrology 422, NDSU Spring 2016 Outline Background Location Previous work Hypothesis Methods Results Discussion Conclusion Anorthosite
EDS Mapping. Ian Harvey Fall Practical Electron Microscopy
 EDS Mapping Ian Harvey Fall 2008 1 From: Energy Dispersive X-ray Microanalysis, An Introduction Kevex Corp. 1988 Characteristic X-ray generation p.2 1 http://www.small-world.net/efs.htm X-ray generation
Understanding X-rays: The electromagnetic spectrum
 Understanding X-rays: The electromagnetic spectrum 1 ULa 13.61 kev 0.09 nm BeKa 0.11 kev 11.27 nm E = hn = h c l where, E : energy, h : Planck's constant, n : frequency c : speed of light in vacuum, l
ANALYSIS OF GEOLOGIC MATERIALS USING RIETVELD QUANTIATIVE X-RAY DIFFRACTION
 Copyright JCPDS - International Centre for Diffraction Data 2003, Advances in X-ray Analysis, Volume 46. 204 ANALYSIS OF GEOLOGIC MATERIALS USING RIETVELD QUANTIATIVE X-RAY DIFFRACTION Robin M. Gonzalez,
Spot Name U-Pb ages (Ma) Plagioclase ages (Ma) Biotite age (Ma) Whole rock age (Ma)
 Plagioclase ages (Ma) Biotite age (Ma) Whole rock age (Ma)") Table 1. Average U-Pb ages from this study in comparison with previous ages from Sherrod and Tosdal (1991, and references therein). Previous study ages are reported as ranges including uncertainty (i.e.
Table 1. Average U-Pb ages from this study in comparison with previous ages from Sherrod and Tosdal (1991, and references therein). Previous study ages are reported as ranges including uncertainty (i.e.
Dept., Univ. of ela as are, 'i?ewark, DE Approximately 130 low specific gravity ((2.601, high silica
 HIGH (760%) SiO LUNAR GLASS%. ir.f. Glass, Geoloey Dept., Univ. of ela as are, 'i?ewark, DE. 1971 1 Approximately 130 low specific gravity ((2.601, high silica p602) glass particles recovered from a 4.88
Supplementary information
 Supplementary information Sample details Samples used were from the Natural History Museum, London, UK: collections BM1968 P37 and BM1957 1056, and are listed in Supplementary Table1 and Table 2. Supplementary
Supplementary Information
 Supplementary Information Supplementary Tables Major element compositions of host and daughter crystals: Table 1 reports composition for host-olivine. No daughter olivine has been found. The number for
Supplemental Materials. Sorption of Tetracycline to Varying-Sized Montmorillonite Fractions
 Supplemental Materials Sorption of Tetracycline to Varying-Sized Montmorillonite Fractions 6 7 8 9 10 11 1 Huaizhou Xu, 1, Xiaolei Qu, 1 Hui Li, Cheng Gu 1, and Dongqiang Zhu 1* 1 State Key Laboratory
SEM. Chemical Analysis in the. Elastic and Inelastic scattering. Chemical analysis in the SEM. Chemical analysis in the SEM
 THE UNIVERSITY Chemical Analysis in the SEM Ian Jones Centre for Electron Microscopy OF BIRMINGHAM Elastic and Inelastic scattering Electron interacts with one of the orbital electrons Secondary electrons,
Th) ) dating of micro-baddeleyite
 ) dating of micro-baddeleyite") U-Pb (and U-ThU Th) ) dating of micro-baddeleyite 30 μm Axel K. Schmitt UCLA SIMS, NSF National Ion Microprobe Facility Collaborators: T. Mark Harrison (UCLA) Kevin Chamberlain (University of Wyoming)
U-Pb (and U-ThU Th) ) dating of micro-baddeleyite 30 μm Axel K. Schmitt UCLA SIMS, NSF National Ion Microprobe Facility Collaborators: T. Mark Harrison (UCLA) Kevin Chamberlain (University of Wyoming)
GSA DATA REPOSITORY
 GSA DATA REPOSITORY 2013019 Supplemental information for The Solidus of Alkaline Carbonatite in the Deep Mantle Konstantin D. Litasov, Anton Shatskiy, Eiji Ohtani, and Gregory M. Yaxley EXPERIMENTAL METHODS
X Rays & Crystals. Characterizing Mineral Chemistry & Structure. J.D. Price
 X Rays & Crystals Characterizing Mineral Chemistry & Structure J.D. Price Light - electromagnetic spectrum Wave behavior vs. particle behavior If atoms are on the 10-10 m scale, we need to use sufficiently
Latest advances in identifying mineral composition variation by the M4 TORNADO AMICS
 Latest advances in identifying mineral composition variation by the M4 TORNADO AMICS Bruker Nano Analytics, Berlin, Germany Webinar, June 15, 2017 Innovation with Integrity Presenters Samuel Scheller Sr.
TABLE DR1. COMBINED EMPA AND LA-ICP-MS DATA FOR WATERSHED 2 AND 34 MINERALS USED IN THE MASS BALANCE CALCULATIONS
 TABLE DR1. COMBINED EMPA AND LA-ICP-MS DATA FOR WATERSHED 2 AND 34 MINERALS USED IN THE MASS BALANCE CALCULATIONS Allanite Plagioclase C17-3 C17-3 C17-3 C17-3 Mean C17-3 C17-3 C17-3 C17-3 Mean E1C E1R
X-Ray Fluorescence and Natural History
 X-Ray Fluorescence and Natural History How XRF Helps XRF can be used both quantitatively (homogenous samples) and quantitatively (heterogenous samples).! Trace elements in a fossil can help identify source,
EAS 4550: Geochemistry Problem Set 4 Solutions Due Sept. 27, 2017
 1. Interaction parameters for the enstatite diopside solid solution have been determined as follows: WH-En = 34.0 kj/mol, WH-Di = 24.74 kj/mol (assume WV and WS are 0). (a) Use the asymmetric solution
Preliminary Progress Report. Mineralogy and Geochemistry of Well Cuttings. Prepared for: Gastem USA. Colgate University Department of Geology
 Preliminary Progress Report Mineralogy and Geochemistry of Well Cuttings Prepared for: Gastem USA By: Jaclyn Baughman Alison MacNamee Bruce Selleck Colgate University Department of Geology July 30, 2010
T6 soil base cation weathering rates
 T6 soil base cation weathering rates julian aherne :: trent university FORFLUX :: biogeochemistry of irish forests [RSF 07510] Advisory Group Meeting [5 6 December 2011] objective (a) to determine the
Electron Microscopy I
 Characterization of Catalysts and Surfaces Characterization Techniques in Heterogeneous Catalysis Electron Microscopy I Introduction Properties of electrons Electron-matter interactions and their applications
2.3 Particle Induced X-Ray Emission PIXE
 2.3 Particle Induced X-Ray Emission PIXE The previous section concentrated on X-ray fluorescence. This section discusses a different X-ray production technique that can lead to the development of 2-D/3-D
Chapter 9. Electron mean free path Microscopy principles of SEM, TEM, LEEM
 Chapter 9 Electron mean free path Microscopy principles of SEM, TEM, LEEM 9.1 Electron Mean Free Path 9. Scanning Electron Microscopy (SEM) -SEM design; Secondary electron imaging; Backscattered electron
Modern Optical Spectroscopy
 Modern Optical Spectroscopy X-Ray Microanalysis Shu-Ping Lin, Ph.D. Institute of Biomedical Engineering E-mail: splin@dragon.nchu.edu.tw Website: http://web.nchu.edu.tw/pweb/users/splin/ Backscattered
Supporting Online Material for
 www.sciencemag.org/cgi/content/full/1142021/dc1 Supporting Online Material for Remnants of the Early Solar System Water Enriched in Heavy Oxygen Isotopes Naoya Sakamoto, Yusuke Seto, Shoichi Itoh, Kiyoshi
ABC s of Electrochemistry series Materials Characterization techniques: SEM and EDS Ana María Valenzuela-Muñiz November 3, 2011
 ABC s of Electrochemistry series Materials Characterization techniques: SEM and EDS Ana María Valenzuela-Muñiz November 3, 2011 CEER, Department of Chemical and Biomolecular Engineering Outline Introduction
CBE Science of Engineering Materials. Scanning Electron Microscopy (SEM)
") CBE 30361 Science of Engineering Materials Scanning Electron Microscopy (SEM) Scale of Structure Organization Units: micrometer = 10-6 m = 1µm nanometer= 10-9 m = 1nm Angstrom = 10-10 m = 1Å A hair is
CBE 30361 Science of Engineering Materials Scanning Electron Microscopy (SEM) Scale of Structure Organization Units: micrometer = 10-6 m = 1µm nanometer= 10-9 m = 1nm Angstrom = 10-10 m = 1Å A hair is
Advancements in Microanalysis with. Bruker Nano Analytics, Berlin, Germany Webinar, April 18 th 2018
 Advancements in Microanalysis with micro-xrf on SEM Bruker Nano Analytics, Berlin, Germany Webinar, April 18 th 2018 19.04.2018 Presenters Stephan Boehm Product Manager Micro-XRF/SEM Bruker Nano Analytics,
Figure 2. Location map of Himalayan Mountains and the Tibetan Plateau (from Searle et al., 1997).
.") Nazca Plate Figure 1. Location map of Central Andes arc. This map also shows the extent of the high Altiplano-Puna plateau (from Allmendinger et al., 1997). 33 Figure 2. Location map of Himalayan Mountains
Nazca Plate Figure 1. Location map of Central Andes arc. This map also shows the extent of the high Altiplano-Puna plateau (from Allmendinger et al., 1997). 33 Figure 2. Location map of Himalayan Mountains
Generation of X-Rays in the SEM specimen
 Generation of X-Rays in the SEM specimen The electron beam generates X-ray photons in the beam-specimen interaction volume beneath the specimen surface. Some X-ray photons emerging from the specimen have
Low Vacuum Scanning Electron Microscopy and Microanalysis
 Low Vacuum Scanning Electron Microscopy and Microanalysis Principles and Practice of Variable Pressure/Environmental Scanning Electron Microscopy (VP-ESEM), Debbie J Stokes, John Wiley&Sons 2008 Several
What is going on here?
 Major Digression! Atoms? Elements? Compounds? Minerals? Rocks? What is going on here? Source:SERC @ Carleton College http://www.brocku.ca/earthsciences/people/gfinn/petrology/periodic.gif http://www.meta-synthesis.com/webbook/35_pt/pt_database.php?pt_id=335
DIFFERENCES IN MORPHOLOGICAL PROPERTIES BETWEEN THE OLIVINE GROUP MINERALS FORMED IN NATURAL AND INDUSTRIAL PROCESSES
 Journal of Mining and Metallurgy, 43 B (2007) 99-105 DIFFERENCES IN MORPHOLOGICAL PROPERTIES BETWEEN THE OLIVINE GROUP MINERALS FORMED IN NATURAL AND INDUSTRIAL PROCESSES S. Devi} # and L. Mar~eta IMS
Analytical Methods for Materials
 Analytical Methods for Materials Lesson 21 Electron Microscopy and X-ray Spectroscopy Suggested Reading Leng, Chapter 3, pp. 83-126; Chapter 4, pp. 127-160; Chapter 6, pp. 191-219 P.J. Goodhew, J. Humphreys
HOW TO APPROACH SCANNING ELECTRON MICROSCOPY AND ENERGY DISPERSIVE SPECTROSCOPY ANALYSIS. SCSAM Short Course Amir Avishai
 HOW TO APPROACH SCANNING ELECTRON MICROSCOPY AND ENERGY DISPERSIVE SPECTROSCOPY ANALYSIS SCSAM Short Course Amir Avishai RESEARCH QUESTIONS Sea Shell Cast Iron EDS+SE Fe Cr C Objective Ability to ask the
Geant4 Monte Carlo code application in photon interaction parameter of composite materials and comparison with XCOM and experimental data
 Indian Journal of Pure & Applied Physics Vol. 54, Februray 2016, pp. 137-143 Geant4 Monte Carlo code application in photon interaction parameter of composite materials and comparison with XCOM and experimental
Paper 1: THE ROLE OF FLUORINE IN THE FORMATION OF COLOR ZONING IN RUBIES FROM MONG HSU, MYANMAR (BURMA)
") Paper 1: THE ROLE OF FLUORINE IN THE FORMATION OF COLOR ZONING IN RUBIES FROM MONG HSU, MYANMAR (BURMA) Dr A. Peretti 1,DrJ.Mullis 2 and F. Mouawad 3 1. P. O. Box 4028, 6002 Lucerne, Switzerland 2. Sissach,
Paper 1: THE ROLE OF FLUORINE IN THE FORMATION OF COLOR ZONING IN RUBIES FROM MONG HSU, MYANMAR (BURMA) Dr A. Peretti 1,DrJ.Mullis 2 and F. Mouawad 3 1. P. O. Box 4028, 6002 Lucerne, Switzerland 2. Sissach,
Nano-Microscopy. Lecture 2. Scanning and Transmission Electron Microscopies: Principles. Pavel Zinin HIGP, University of Hawaii, Honolulu, USA
 GG 711: Advanced Techniques in Geophysics and Materials Science Nano-Microscopy. Lecture 2 Scanning and Transmission Electron Microscopies: Principles Pavel Zinin HIGP, University of Hawaii, Honolulu,
Silicate Atmospheres, Clouds, and Fractional Vaporization of Hot Earth-like Exoplanets
 Silicate Atmospheres, Clouds, and Fractional Vaporization of Hot Earth-like Exoplanets Laura Schaefer and Bruce Fegley, Jr. Planetary Chemistry Laboratory Department of Earth and Planetary Sciences Washington
3.2 Ga detrital uraninite in the Witwatersrand Basin, South. Africa: Evidence of a reducing Archean atmosphere
 GSA Data Repository 2018085 https://doi.org/10.1130/g39957.1 1 2 3 4 3.2 Ga detrital uraninite in the Witwatersrand Basin, South Africa: Evidence of a reducing Archean atmosphere Ian Burron 1, Giuliana
6. Analytical Electron Microscopy
 Physical Principles of Electron Microscopy 6. Analytical Electron Microscopy Ray Egerton University of Alberta and National Institute of Nanotechnology Edmonton, Canada www.tem-eels.ca regerton@ualberta.ca
Minerals Please do not write on this test packet.
 Please do not write on this test packet. 1. The diagram below shows the index minerals of Mohs hardness scale compared with the hardness of some common objects. 2. Base your answer to the following question
An Analysis of Apatite Chemistry in Garnet Porphyroblasts and in the Matrix of Metamorphic Rocks
 An Analysis of Apatite Chemistry in Garnet Porphyroblasts and in the Matrix of Metamorphic Rocks Geology 394 Thesis April 28, 2006 David B. Limburg Advisor: Dr. Philip Piccoli Abstract Apatite is an accessory
Methods of surface analysis
 Methods of surface analysis Nanomaterials characterisation I RNDr. Věra Vodičková, PhD. Surface of solid matter: last monoatomic layer + absorbed monolayer physical properties are effected (crystal lattice
Electron-Matter Interactions
 Electron-Matter Interactions examples of typical EM studies properties of electrons elastic electron-matter interactions scattering processes; coherent and incoherent image formation; chemical contrast;
Introduction to EDX. Energy Dispersive X-ray Microanalysis (EDS, Energy dispersive Spectroscopy) Basics of EDX
 Basics of EDX") Introduction to EDX Energy Dispersive X-ray Microanalysis (EDS, Energy dispersive Spectroscopy) EDX Marco Cantoni 1 Basics of EDX a) Generation of X-rays b) Detection Si(Li) Detector, SDD Detector, EDS
Introduction to EDX Energy Dispersive X-ray Microanalysis (EDS, Energy dispersive Spectroscopy) EDX Marco Cantoni 1 Basics of EDX a) Generation of X-rays b) Detection Si(Li) Detector, SDD Detector, EDS
Auger Electron Spectroscopy
 Auger Electron Spectroscopy Auger Electron Spectroscopy is an analytical technique that provides compositional information on the top few monolayers of material. Detect all elements above He Detection
In this practical we study the AKF and the Thompson AFM diagrams for pelites.
 LIVERPOOL UNIVERSITY EARTH SCIENCE ENVS212 page 1 of 10 ENVS212 Practical 6: Triangular compatibility diagrams for pelites In this practical we study the AKF and the Thompson AFM diagrams for pelites.
DOCUMENT HISTORY. Initials Section/s Modified Brief Description of Modifications
 Page 2 of 13 DOCUMENT HISTORY Date Modified Initials Section/s Modified Brief Description of Modifications Page 3 of 13 Table of Contents 1. Purpose and Applicability... 4 2. Definitions... 4 3. Procedures...
APPENDIX 9. DESCRIPTIONS OF SELECTED SAMPLES FROM GHN. DESCRIPTION OF SAMPLE GHN-JRM-0001 LOCATION
 APPENDIX 9. DESCRIPTIONS OF SELECTED SAMPLES FROM GHN. DESCRIPTION OF SAMPLE GHN-JRM-0001 LOCATION Sample GHN-JRM-0001 was collected from Unit J, trench LFG-009, bench 22 (UTM 4062136.8, 453642.2E, elevation
X-ray Absorption Spectroscopy
 X-ray Absorption Spectroscopy Matthew Newville Center for Advanced Radiation Sources University of Chicago 12-Sept-2014 SES VI SES VI 12-Sept-2014 SES VI What Is XAFS? X-ray Absorption Fine-Structure (XAFS)
Rocks and the Rock Cycle notes from the textbook, integrated with original contributions
 Rocks and the Rock Cycle notes from the textbook, integrated with original contributions Alessandro Grippo, Ph.D. Gneiss (a metamorphic rock) from Catalina Island, California Alessandro Grippo review Rocks
IV. Surface analysis for chemical state, chemical composition
 IV. Surface analysis for chemical state, chemical composition Probe beam Detect XPS Photon (X-ray) Photoelectron(core level electron) UPS Photon (UV) Photoelectron(valence level electron) AES electron
The Composition of the Continental Crust
 The Composition of the Continental Crust Roberta L. Rudnick Geochemistry Laboratory Department of Geology University of Maryland Apollo 17 view of Earth Rationale: Why is studying crust composition important?
MSE 321 Structural Characterization
 Auger Spectroscopy Auger Electron Spectroscopy (AES) Scanning Auger Microscopy (SAM) Incident Electron Ejected Electron Auger Electron Initial State Intermediate State Final State Physical Electronics
GSA DATA REPOSITORY
 GSA DATA REPOSITORY 2012161 Allan et al. SUPPLEMENTARY INFORMATION Summary of Magma Types Table DR1 summarizes some of the key petrologic, geochemical and physical characteristics of the three magma types
Bulyanhulu: Anomalous gold mineralisation in the Archaean of Tanzania. Claire Chamberlain, Jamie Wilkinson, Richard Herrington, Ettienne du Plessis
 Bulyanhulu: Anomalous gold mineralisation in the Archaean of Tanzania Claire Chamberlain, Jamie Wilkinson, Richard Herrington, Ettienne du Plessis Atypical Archaean gold deposits Groves et al., 2003 Regional
Structure analysis: Electron diffraction LEED TEM RHEED
 Structure analysis: Electron diffraction LEED: Low Energy Electron Diffraction SPA-LEED: Spot Profile Analysis Low Energy Electron diffraction RHEED: Reflection High Energy Electron Diffraction TEM: Transmission
Contrasted strengths and weakness of EDS, WDS and AES for determining the composition of samples
 Contrasted strengths and weakness of EDS, WDS and AES for determining the composition of samples Ana-Marija Nedić Course 590B 12/07/2018 Iowa State University Contrasted strengths and weakness of EDS,
Auger Electron Spectroscopy Overview
 Auger Electron Spectroscopy Overview Also known as: AES, Auger, SAM 1 Auger Electron Spectroscopy E KLL = E K - E L - E L AES Spectra of Cu EdN(E)/dE Auger Electron E N(E) x 5 E KLL Cu MNN Cu LMM E f E
MS482 Materials Characterization ( 재료분석 ) Lecture Note 4: XRF
 Lecture Note 4: XRF") 2016 Fall Semester MS482 Materials Characterization ( 재료분석 ) Lecture Note 4: XRF Byungha Shin Dept. of MSE, KAIST 1 Course Information Syllabus 1. Overview of various characterization techniques (1 lecture)
2016 Fall Semester MS482 Materials Characterization ( 재료분석 ) Lecture Note 4: XRF Byungha Shin Dept. of MSE, KAIST 1 Course Information Syllabus 1. Overview of various characterization techniques (1 lecture)
MgO was dried at 1100 C overnight, then stoichiometrically combined with 95% enriched 57 Fe 2 O 3
 82 Appendix A A.1 Synthesis and Characterization A.1.1 (Mg 0.16 Fe 0.84 )O MgO was dried at 1100 C overnight, then stoichiometrically combined with 95% enriched 57 Fe 2 O 3 (Advanced Materials Techonologies
Recent advances in the analysis of volatiles and fluid-mobile elements in melt inclusions by Secondary Ion Mass Spectrometry (SIMS)
") Edinburgh Research Explorer Recent advances in the analysis of volatiles and fluid-mobile elements in melt inclusions by Secondary Ion Mass Spectrometry (SIMS) Citation for published version: De Hoog,
Edinburgh Research Explorer Recent advances in the analysis of volatiles and fluid-mobile elements in melt inclusions by Secondary Ion Mass Spectrometry (SIMS) Citation for published version: De Hoog,
Auger Electron Spectroscopy (AES)
") 1. Introduction Auger Electron Spectroscopy (AES) Silvia Natividad, Gabriel Gonzalez and Arena Holguin Auger Electron Spectroscopy (Auger spectroscopy or AES) was developed in the late 1960's, deriving
1. Introduction Auger Electron Spectroscopy (AES) Silvia Natividad, Gabriel Gonzalez and Arena Holguin Auger Electron Spectroscopy (Auger spectroscopy or AES) was developed in the late 1960's, deriving
Scanning electron microscopy
 Scanning electron microscopy Fei Quanta Tabletop Hitachi Example: Tin soldier Pb M Sn L Secondary electrons Backscatter electrons EDS analysis Average composition Learning goals: Understanding the principle
Supplementary Information for: Giant Kiruna-type deposits form by. efficient flotation of magmatic magnetite suspensions
 GSA DATA REPOSITORY 2015206 1 2 Supplementary Information for: Giant Kiruna-type deposits form by efficient flotation of magmatic magnetite suspensions 3 4 Jaayke L. Knipping, Laura D. Bilenker, Adam C.
Summary of test results for Daya Bay rock samples. by Patrick Dobson Celia Tiemi Onishi Seiji Nakagawa
 Summary of test results for Daya Bay rock samples by Patrick Dobson Celia Tiemi Onishi Seiji Nakagawa October 2004 Summary A series of analytical tests were conducted on a suite of granitic rock samples
Imaging Methods: Scanning Force Microscopy (SFM / AFM)
") Imaging Methods: Scanning Force Microscopy (SFM / AFM) The atomic force microscope (AFM) probes the surface of a sample with a sharp tip, a couple of microns long and often less than 100 Å in diameter.
Imaging Methods: Scanning Force Microscopy (SFM / AFM) The atomic force microscope (AFM) probes the surface of a sample with a sharp tip, a couple of microns long and often less than 100 Å in diameter.