This is the author s version of a work that was submitted/accepted for publication in the following source:
|
|
|
- Alaina May
- 6 years ago
- Views:
Transcription
 ubmarine deposition of volcaniclastic material from the 1995-25 eruptions of oufriere Hills volcano, Montserrat. Journal of the Geological ociety, 166(1), pp. 171-182.")
1 This is the author s version of a work that was submitted/accepted for publication in the following source: Le Friant, A., Deplus, C., Boudon, G., parks, R..J., Trofimovs, J., & Talling, P. (29) ubmarine deposition of volcaniclastic material from the eruptions of oufriere Hills volcano, Montserrat. Journal of the Geological ociety, 166(1), pp This file was downloaded from: c Copyright 29 The Geological ociety of London otice: Changes introduced as a result of publishing processes such as copy-editing and formatting may not be reflected in this document. For a definitive version of this work, please refer to the published source:
2 1 2 ubmarine deposition of volcaniclastic material from the eruptions of oufrière Hill Volcano, Montserrat, West Indies A. LE FRIAT 1, C. DEPLU 1, G. BOUDO 1, R.. J. PARK 2, J. TROFIMOV 3, P. TALLIG 2 1. Institut de Physique du Globe de Paris & CR, Case 89, 4 Place Jussieu, F Paris Cedex 5, France ( lefriant@ipgp.jussieu.fr) 2. Department of Earth ciences, Wills Memorial Building, University of Bristol, Queen s Road, Bristol B8 1RJ, UK 3. ational Oceanography Centre, Waterfront Campus, European Way, outhampton, O14 3ZH, UK Corresponding author: Anne Le Friant umber of words of text: 5891 umber of references: 26 umber of tables: 1 umber of figures:
3 Abstract oufrière Hills Volcano, Montserrat (Lesser Antilles), has been erupting since During the current eruption, a large part of the material produced by the volcano has been deposited into the sea, modifying the morphology of the submarine flanks of the volcano. We present a unique set of swath bathymetric data collected offshore from Montserrat in 1999, 22 and 25. From 1999 to 22, pyroclastic flows associated with numerous dome collapses entered the sea to produce 1 Mm 3 deposit. From 22 to 25, the 29 Mm 3 submarine deposit is mainly from the July 23 collapse. These data allow us to estimate that, by May 25, at least 482 Mm 3 of material had been deposited on the sea floor since We compare on-land characteristics and volumes of dome collapse events, with the submarine deposits and we propose a new analysis of their emplacement on the submarine flanks of the volcano. The mechanism deposition shows a slope dependence with the maximum thickness of deposit before the break in the slope, probably due to the type of the dense granular flow. We conclude that from 1995 to 25 more than 75 % of the erupted volume entered the sea. 2
4 Introduction oufrière Hills volcano in Montserrat (Lesser Antilles arc, Fig. 1a), has been erupting since By April 28, at least 7 Mm 3 of magma had been extruded (MVO internal reports ( The eruption has been characterized by lava dome extrusion, dome-collapse pyroclastic flows and explosive activity. The current eruption has considerably modified some morphological features of the island (e.g. Cole et al., 22; Voight et al., 22; Herd et al., 25). For example, in May 23, the lava dome temporarily became the highest point of Montserrat, reaching nearly 11 m above sea level (Herd et al., 25). Major valleys cutting the volcano s flanks have on occasion been completely infilled by pyroclastic flow deposits and lahars. Mosquito Ghaut which was a major valley on the northern flank and conduit for pyroclastic flows in 1997 (Cole et al., 22) was completely infilled by the deposits from these flows (Fig. 1b). The Tar River Valley has been partly infilled by pyroclastic flow deposits since July 23 when a large collapse of the lava dome eroded the bulk of the recent deposits ( ) and parts of underlying older deposits. During the eruption, new coastal fans have been built increasing the size of the island to the east (Tar River) and W (White River) (Fig. 1b, Fig. 2 and Fig. 3), (Cole et al., 22). ince 1997, rain-induced erosion of unconsolidated deposits on the upper flanks has resulted in laharic deposits on the lower volcano flanks, notably around Plymouth and in the Belham River valley, as well as in shallow marine areas off Plymouth and the White River (Fig. 1). During the current eruption a large part of the material produced has been deposited into the sea modifying the morphology of the submarine flanks of the volcano (Deplus et al., 22; Hart et al., 24, Le Friant et al., 24, Trofimovs et al., 26, 28). Hart et al. (24) present an analysis of the discharge of pyroclastic flows into the sea during the phase of the eruption, using the pre-eruption bathymetry and some data collected off Tar River and White River in Trofimovs et al. (26; 28) present marine data regarding deposits from 22 to 25, mainly related to the July 23 collapse. 3
5 In this paper we quantify the fraction of the eruption products that ended up offshore from 1999 to 25. We first present a synthesis of lava dome collapses. econd, we analyse a unique set of high resolution bathymetric data collected offshore Montserrat in 1999 (Aguadomar, R/V L Atalante, e.g. Deplus et al., 21), in 22 (Caraval, R/V L Atalante, e.g.: Le Friant et al., 24) and in 25 (JR 123, RR James Clark Ross, e.g.: Trofimovs et al., 26). Data collection and processing was achieved using the same procedure in order to minimize error. These data allow us to estimate the volume of the material that entered the sea, and to propose a new analysis of the syn eruptive emplacement mechanisms of volcanic products on the submarine volcanic flanks. We also compare on-land data and discuss the errors in the dataset Geological setting Montserrat is located in the northern part of the Lesser Antilles arc which results from the subduction of the orth American plate beneath the Caribbean plate (Fig. 1a). Arc volcanism initiated at 4 Ma (Bouysse et al., 199). The arc is divided in two island chains to the north of the arc. The outer (eastern) group is older, with thick carbonate platforms covering a volcanic basement. The inner (western) arc consists of volcanic rocks younger than 2 Ma and includes all the active volcanoes. The island of Montserrat has a distinctive shallow (<1 m) submarine shelf (Fig. 2) interpreted as having been formed through subaerial erosion with a depth controlled by glacioeustatic level (Le Friant et al., 24). The subaerial part of Montserrat consists of three volcanic massifs with ages and degrees of erosion decreasing from north to south (Harford et al., 22). The older centres, Centre Hills and ilver Hills, are deeply eroded extinct volcanic complexes. The active oufrière Hills volcano is located in the south part of the island (Fig. 1b, Fig. 2). 87 4
6 Dome collapse events from 1995 to 25 We focus on dome collapse events that occurred during different phases of the eruption from 1995 to 25 period (Table 1, Fig.4), using MVO internal reports ( and the following articles: Young et al., 1998, Bonadonna et al., 22, Cole et al., 22, parks et al., 22, Carn et al., 24, Hincks et al., 25, Herd et al., The first phase - July 1995 to March 1998: The first phase was mainly characterized by growth of a lava dome. everal collapses occurred from May 1996 to January 1997 (12 May 1996, 28 July 1996, 17 eptember 1996, 25 June 1997, 4 and 6 ovember 1997) during which a 2-25 Mm 3 total volume of pyroclastic material reached the sea (parks et al., 1998, Hart et al., 24). On 26 December (Boxing Day) 1997, a major volcanic landslide occurred towards the south, producing a debris avalanche with an approximate volume of 4-5 Mm 3 (Voight et al., 22). The event was followed by an energetic pyroclastic density current that transported most ejecta into the sea (parks et al., 22). Lava dome growth resumed in January and ceased around 1 March The second phase - March 1998 to ovember 1999: During the second phase, lava dome growth ceased. On 3 July 1998, ~ 2% of the residual lava dome collapsed down the Tar River Valley. Two important collapses occurred on 23 May 1999 and on 2 July 1999 where voluminous pyroclastic flows down the Tar River Valley excavated and enlarged the valley floor. Finally, large amounts of volcanic products were discharged into the sea, for example as the major mudflows caused by the hurricanes Floyd (eptember 1999), Jose (October 1999) and Lenny (ovember 1999). The first oceanographic cruise, Aguadomar, took place, in January 1999, prior to the significant collapses on the 23 May and 2 July, The third phase - ovember 1999 to August 23: The third phase began on 27 ovember 1999 with new lava dome growth. By 2 March 2, the new lava dome had grown to a volume of about 32 Mm 3. On 2 March 2, 5
7 a major dome collapse (3 Mm 3 ) generated large pyroclastic flows that travelled down the Tar River Valley and entered the sea (Carn et al., 24). Concurrently, a large lahar occurred in the Belham valley. Immediately after the collapse, a new lava dome started to grow in the same position. Two small dome collapse occurred on 6 May 2 and 25 February 21 which produced pyroclastic flows down Tuiit s Ghaut, White s Ghaut and White river respectively (Fig. 1). By late July, the lava dome had a volume of about 162 Mm 3. On 29 July 21, a second major dome collapse (45 Mm 3 ) occurred with pyroclastic flows observed to flow down the Tar River Valley into the sea. After the collapse, the lava dome immediately began to grow again. mall collapses occurred on 14, 16 October 21, 28 December 21, 29 eptember 22 (2-3 Mm 3 ), 2 October 22 (4 Mm 3 to the east), and the largest occurred on 8 December 22 (4-5 Mm 3 to the south). On July 23, the largest dome collapse of the eruption occurred (21 Mm 3 ) with the major part of material (19 Mm 3 ) entering the sea down Tar River Valley (Herd et al., 25; Voight et al., 26). Herd et al. (25) proposed 4 stages for the collapse. tages 1 and 2 (duration: 18 h) involved a combined volume of 3 Mm 3 of volcaniclastic debris. tage 3 (duration: 2h 4 min) consisted of semi-continuous pyroclastic flow activity which removed 17 Mm 3 of material from the lava dome. At peak collapse conditions (duration: 2 min), lava was removed at 6-1 Mm 3 min -1. tage 4 (duration: several hours), the activity declined removing about 1 Mm 3. On land observations show that the July 23 collapse eroded the previously emplaced (1996 to 23) deposits that partly infilled the Tar River Valley, (Fig. 3), (Boudon et al., 27), as well as some parts of the coastal fan. ew lava dome growth started on July 23 and then volcanic activity declined in early August. The second oceanographic cruise, Caraval, took place during the third phase, at the beginning of March 22, prior to the largest collapse of July The fourth phase from August 23 to April 25 6
8 On 3 March 24, a dome collapse occurred with pyroclastic flows downing Tar River Valley and reaching the sea. From April 25, an increase in the volcanic activity was observed. The third oceanographic cruise, JR123, took place after the end of this phase in May 25. A new phase of lava dome growth began, and continues at the time of writing (June 28). It included a major collapse in May 26 which here is not described. Fig. 4 summarises collapses events from 1995 to 25 and shows that numerous and small events occurred during the first two phases contrasting with the less frequent and yet larger collapses that characterize phase 3. By May 25, approximately 5 Mm 3 of magma had been extruded since 1995, of which more than 3 Mm 3 of material was estimated to have been directly discharged into the sea wath bathymetry data Data collection Marine geophysical data sets were collected around Montserrat during three different cruises, in January 1999, March 22 and May 25. The Aguadomar cruise (December January 1999, aboard the French R/V L Atalante) surveyed the two flanks of the Lesser Antilles arc from Montserrat in the north to t Lucia in the south (Deplus et al., 21). The Caraval cruise (March 22, R/V L Atalante) completed the Aguadomar survey from Montserrat to t-vincent. During both cruises, we collected imrad EM12D swath bathymetry and backscatter data, as well as magnetic, gravity, 3.5 khz echosounder and six-channel seismic reflection profiles. On the Caraval cruise, we also collected seismic profiles with higher resolution and marine sediment piston cores (Deplus et al., 22; Le Friant et al., 24; 28). avigation was achieved using tarfix differential GP during the Aguadomar cruise and GP with no degradation during the Caraval cruise: both allow ship positioning accuracy of a few meters. For depths shallower than 1 m, the imrad EM12D multibeam 7
9 echosounding system allows an across- and along-track resolution of better than 5 m for the swath bathymetry. The JR123 cruise (May 25, aboard the British RR James Clark Ross) imaged and sampled mainly the eastern submarine flanks of Montserrat (Trofimovs et al., 26; 28). eafloor sampling was accomplished using a Vibrocore system developed by the British Geological urvey. The swath bathymetry was gathered using a imrad EM12 multibeam echosounder. Travelling at 8 knots in water depths of 1 m, using a beam angle of 6, equidistant mode gave an across- and along-track resolution better than 25 m. Predicted depth accuracy for both multibeam echosounding systems is about.1 to.3 % of depth (i.e. between 1 to 3 m in water depth of 1 m), depending mainly on the beam angle. Fig. 5 shows the swath bathymetric data collected offshore from Montserrat during Aguadomar cruise. The same area has been covered during the next two cruises (Caraval and JR123). In all cases, the swath bathymetry was processed using the Caraïbes software developed by IFREMER. Three digital terrain models have been constructed using the same mesh grid parameters. The cell size is 5 m according to the depth of the seafloor surrounding the island (< 1 m) and the lowest horizontal resolution of the multibeam echosounder systems. Depth differences and error analysis Comparisons of the 1999, 22 and 25 bathymetry were performed by measuring the difference between the gridded data sets. ignificant depth changes, up to 5-7 m, occurred offshore from the Tar River Valley. The depth difference values between the different stages contain errors that can be related to positioning accuracy, multibeam echosounder and motion sensor precision, velocity model, tidal variations and sea state during the cruises. We used the same multibeam echosounder (imrad EM 12 Dual) for the both first cruises (Aguadomar, Caraval) and imrad EM 12 for the last cruise (JR 123). One of the most important errors is related to uncertainties 8
10 in the beams positioning at large beam angles. During the cruises we attempted to cover the same area and to follow the same tracks for the profiles located close to the coast to obtain accurate depth changes. To quantify the accuracy of the depth differences, we analysed the values adjacent to the main deposits. The depth difference distributions outside the deposits are shown as histograms on Fig. 6. The two histograms display positive and negative values, roughly centered about zero. For the first histogram ( depth changes) the mean value is slightly negative, about -1.5 m and the standard deviation is about 4 m. For the second histogram (25-22 depth changes), the mean value is about m and the standard deviation about 3.1 m. In both cases, the mean value is close to zero and the standard deviation is in good agreement with the predicted depth accuracy of the multibeam echosounding systems. Therefore, the areas off the Tar River Valley, where the depth changes are larger than 5 m, are considered as new deposits Results : Results are presented as three bathymetric difference maps showing comparisons between the 1999, 22 and 25 bathymetry (Figs. 7 a,b,c). The key point is that difference maps have revealed significant submarine deposits off shore from the Tar River Valley with thickness up to 46 and 68 m between the 1999 and 22, and the 22 and 25 surveys, respectively. On the other hand, no submarine deposit was observed off White River Valley during these periods. The deposit has been described previously by Trofimovs et al. (26, 28). Using analysis of sedimentary core, they proposed that the coarsest components of the deposit were deposited proximally from dense granular flows, while the finer fraction of the flow was elutriated into the overlying water column and evolved into a turbidity current. The turbidity current flowed at least 4 km from the shore forming a thin 84 to 7 cm deposit. Here, we analyse the deposits observed by repeated swath bathymetry, which correspond to the coarsest most proximal component. 9
11 Morphology of the 1999 bathymetry During the eruption, the entrance of pyroclastic flows into the sea created coastal fans at the mouths of the Tar River and White River valleys extending the shelf break and creating more than 1 km 2 of new land on Montserrat, (Fig. 3; Cole et al., 22; Le Friant et al., 24). Hart et al. (24) made a comparison between the pre-eruptive bathymetry and the July 1998 bathymetry. They estimated that about 7 Mm 3 and 22 Mm 3 of material were deposited outside the Tar River and White River deltas respectively from the beginning of the eruption until July Hart et al. (24) describe the Tar River submarine deposit as two lobes separated by a small channel in the proximal region (Fig. 5). The deposit is located in a submarine embayment, C1, located inside a larger one, C2 (Fig. 5a, see also Le Friant et al., 24) that cuts the flanks of oufrière Hills and outh oufrière Hills between the coastline and the -8 m isobath. The C1 embayment is about 1 km wide striking roughly West-East and its northern rim is 1-6 m high. Areas of deposition from 1999 to 22 The difference map that compares the bathymetries between the 22 and 1999 surveys reveals a significant deposit offshore of the Tar River Valley (Fig. 7a). The deposit extends to 5 km from the coastline as a single morphological ridge. It has a W-E orientation proximally and a W-E orientation distally. The maximum deposit thickness reaches 46 m +/- 4 m in the central part of the proximal area. The region where the deposit thickness exceeds 1 m has a length of about 4.5 km, a mean width around 1 km, and an area around 4.5 km 2. An approximately 5 m thick deposit appears to have spread towards the north part of the lobe, covering an area less than 2 km 2. We have performed lateral transects through the deposit (Figs. 7c, 8). In general, the lateral extent of the deposit is clearly limited by the northern and southern rims of the C1 embayment, with the bulk of the material accumulated in the south of the embayment. 1
12 Two depressions, D 1 and D 2, are present on each side of the C1 embayment (Fig. 8, Line 3 onwards). From Lines 1 to 3, the deposit is largely confined by the topography and infills the southern D 2 depression and part of the D 1 depression to the north, accentuating the topographic low in this area. Line 1 shows negative values (locally down to -2, -25 m) on the northern rim of the C1 embayment. These data could be associated with erosion during emplacement of the flow, or to computational difference errors on steep slopes. Lines 4 to 6 show that the deposit generated positive relief, creating two new depressions on either side of the newly deposited material: D 1 and D 2. From Lines 8 to 12, the D 2 depression of the channel is completely infilled by the deposit whereas the D 1 depression persists. In the more distal parts, (Lines 13 to 17), the bulk of the deposit is located in a large, flat depression as an extension of the D1 depression. Line 15 shows that the deposit smooths the topography by infilling the depressions, and forming a relatively flat surface. In the more distal part (Line 18), the deposit forms an area of positive relief where there previously was a depression. A longitudinal cross section of 1999 and 22 bathymetry is shown on Fig. 9a, and displays the thickness of material deposited between 1999 and 22, along line A. The profile is taken from the central, thickest part of the deposit. According to the spacing of the bathymetry isolines (Fig. 7a), we define three breaks in slope on the floor of the C1 embayment at depths of about 6, 76 and 85 m. Their locations are shown on the longitudinal profile displaying the variations in deposit thickness along line A (Fig. 9). We note that local thickness maxima are located just before the breaks along the depositional slope. The thickness of the deposit is greater than 3 m down to the second break in the slope (76 m depth). Beyond this, the slope is less than 5 (Fig. 1a) and the thickness of the deposit rapidly decreases to close to zero 2 km further on. The profile suggests that the flow slowed then stopped when the slope became less than Areas of deposition from 22 to 25 11
13 The submarine deposit consists of two main morphological lobes and extends approximately 7 km from the coastline (Fig. 7b). The maximum deposit thickness reaches 68 m +/- 3m in the central part of the northern lobe. Considering the deposits with a thickness of more than 5 m, the lobes (north and south) exhibit lengths of about 4 km. The northern lobe has a mean width of around.7-.8 km. The southern lobe exhibits an irregular margin with variation in flow axis direction, which makes it difficult to determine accurately the width of the lobe. The extent of the deposits is proximally constrained by the C1 embayment (Fig. 5). Cross sections perpendicular to the main flow direction (Fig. 8) were measured at the same location as the profiles (Fig. 7c). Along Lines 1 to 3, the deposit is predominantly located within the northern part of the C1 embayment, where it infills the D 1 depression created by the pre-22 deposits and forms a significant positive relief. Only a small proportion of the deposits is located in the south, where it overtops the southern rim of the C1 embayment. On Lines 4 to 6, to the north, the D 1 depression is completely infilled by the new deposit, although to the south the deposit mantles the topography without filling in the depression D 2. Lines 7 to 11 show that the deposit has completely filled in all of the C1 embayment, flattening the topography with the maximum thickness observed in the area of the previous depression D 1. From line 12, the deposit shows a positive relief profile with fairly abrupt lateral margins. This mound exhibits a maximum thickness between lines 18 to 2 (> 5 m elevation) and the feature is still present at line 22. Longitudinal cross sections through the 22 to 25 deposits (Fig. 9b and Fig. 9c) show the deposit thickness along lines B and C (location on Fig. 7b). The profiles are located over the areas of maximum thickness for the two lobes. For the northern lobe, the thickness profile has a shape similar to the one from the deposits. Deposits are greater than 4 m thick down to the second break in the depositional slope (76 m depth, where the slope decreases to 5 ) then decreases to be close to zero 2 km further on. The thickness maxima are also located before the second break in the slope. For the southern lobe, it is quite different. 12
14 The major part of the deposit is located at a greater distance from the coastline, downstream from the second break in the slope where the slope is less than 5 (see also Fig. 1b). ote, however, that the thickness maxima are also located just before a third local break in the slope Discussion : - Estimated submarine deposit volume Analysis of our repeated swath bathymetry surveys has allowed us to estimate the volume of the submarine deposits offshore from the Tar River Valley. As previously mentioned, we consider the new deposits to be the areas where depth changes are larger than 5 m. uch assumption therefore yields a minimum estimation for the submarine deposit volumes. For the period between January 1999 and March 22, we estimate a minimum added volume of 13 Mm 3 was deposited in the sea. From cores analysis, Trofimovs et al. (28) observed that the deposit rapidly thins to less than 1 m just beyond the distal part of the proximal fan identified by swath bathymetry. Trofimovs et al. (26) estimate that the volume of the fine grained distal component of the submarine pyroclastic deposits produced from May 1996 to March 22 was minimal. Taking this into account and using the errors from our difference calculations, we can deduce that 1 Mm 3 is a reasonable estimate for the deposits that accumulated on the eastern submarine flank of the oufrière Hills Volcano from 1999 to 22. ote also that our difference maps starts at 3 m below sea-level and do not take into account additional deposits that could be located in shallower water, close to the coastal fan. For the period between March 22 and May 25, we estimate a minimum added volume of 21 Mm 3. The volumes of the northern and the southern lobes are estimated to be 15 Mm 3 and 96 Mm 3 respectively. Trofimovs et al. (28) estimate the volume of the finegrained turbidite facies (which extends ~4 km from the shore) as around 9 Mm 3 and consider that it comes solely from the large dome collapse that occurred on 12 July 23. Using our estimate of 2 Mm 3 for the main part of the deposit and the estimation of 9 Mm 3 from 13
15 Trofimovs et al. (28) for the fine part, we estimated 29 Mm 3 for the total volume of the submarine deposits On-land correlations On the basis of the synthesis of dome collapses that occurred during all of the eruption (Table 1, and third section), we estimated the minimum volume of material that entered the sea. Accuracy for the subaerial collapse volumes is not available and is difficult to establish. In addition, some collapse volumes are unknown. To compare on-land collapse volumes and marine deposit volumes, we have to take into account the difference in density between the lava dome rock (23 to 24 kg m -3 ) and the products deposited on sea floor (18 kg m -3, measured when dried, (Trofimovs et al., 28)) The volume of products that entered the sea from 1999 to 22 is estimated to be at least 75 Mm 3, from Table 1. Additional events generated pyroclastic flows that reached the sea, but their volumes estimates were not available. The volume deduced from marine data is about 1 Mm 3, equivalent to 78 Mm 3 using a typical bulk density of 23 kg m -3 for the lava dome and average submarine sediment density (18 kg m -3 ). Therefore there is a good agreement between the volume deduced from on-land data (75 Mm 3 ) and the volume deduced from marine geophysical data (78 Mm 3 ). The minimum total volume that entered the sea from March 22 to May 25 is estimated to be 19 Mm 3 from on-land data, attributed to the major dome collapse of the July 23. The total volume of the submarine deposit from March 22 to May 25 (combining the main proximal deposit and the fine grained distal part of the deposit) is estimated to be 29 Mm 3 (equivalent to 227 Mm 3 using the previously mentioned densities). The difference between the on-land volume and the marine volume could be explained by different factors: 1) ome small events, such as the 3 March 24 collapse which entered the 14
16 sea, have not been taken into account in the on-land estimation because their volumes were not available, 2) previously emplaced deposits on the sub-aerial part of the Tar River Valley have been eroded by the July 23 dome collapse pyroclastic flows and incorporated into the final deposits. A sub-aerial part of the coastal fan has also collapsed (see Fig. 3), and 3) non volcanic sediments have been eroded and incorporated into the submarine deposits as shown by the presence of biogenic clasts within the submarine deposit (Trofimovs et al., 26; 28). All three factors would increase the volume of the resulting submarine deposits. However, the amount of erosion and consequent addition to the deposit is unknown. There are also possible errors on the volume estimations both from land and sediment core data. For example, due to limited core coverage, errors are introduced into the estimation of the volume of the finegrained part of the deposit, which is too thin to be imaged accurately Emplacement of the deposits In the proximal part of the marine environment, the deposit emplacement was mainly controlled by the direction of the flow. As most of the pyroclastic material that entered the sea came from dome collapses, it is assumed that the main direction of the flow down the subaerial part of the volcano followed the line of maximum slope. For the submarine deposit, the on-land direction of the flows was EE (Fig.3, black arrow on Fig. 7a). When entering the sea, the flow was deflected southwards by the northern submarine rim of the C1 embayment (Fig. 7a). The deposit formed a new depression, designated D1 on Figure 8, which then played a key role in distributing subsequent deposition. In the distal part, the deposits spread out and filled in depressions smooth the topography. For the deposits, the successive flows seem to have been channelized within the proximal part of the D1 depression (down to Line 3), yielding a significant accumulation of deposits (Fig. 8). Further downslope, the deposits spread out and smoothed the topography (lines 8 to 11) before forming two lobes separated by a small pre-existing topographic ridge 15
17 within the C1 embayment. In the distal reaches, they accumulated to form the southern lobe beyond the last break in the slope, creating a marked positive morphology. The main difference between the deposits is related to the slopes where the emplacement occurred (Fig. 1). For the first deposit ( ), the main part of the deposition formed on slopes greater than 5 (Fig. 1a). For the second deposit (22-25), the southern lobe reached a flat area and a large part of the deposition formed on slopes less than 5, perhaps suggesting a greater momentum or flow energy (Fig. 1b). In both cases, variations of deposit thickness can be correlated with local breaks in slope (Fig. 7, Fig. 9) producing some small step-like morphologies. ome work has been done to show that deposition of submarine flow is thought to be dependant on slopes (e.g. Masson, 1994; Mulder et al., 21; Talling et al., 27). Mulder et al., 21 show that deposition from experimental turbidity currents became thicker (due to flow deceleration) just downstream of a slope break. However, in our case, the deposition shows another slope dependence with the maximum thickness of deposit before the break in the slope. This difference could be explained by the type of flow and the fact that the proximal submarine deposit from Montserrat is a dense granular flow (Trofimovs et al., 26) which can have different behaviour to the turbidity currents and cohesive debris flows described by Masson (1994), Mulder et al., (21), or Talling et al. (27) Trofimovs et al. (28) proposed that the northern lobe of the deposit consists of a single deposit and corresponds to the peak phase conditions of the July 23 collapse. The southern lobe, which comprised multiple flow deposits, was interpreted as representing an amalgamation of small volume deposits from the first two stages of the July 23 collapse. We suggest an alternative to this interpretation based on several reasons. First, Herd et al. (25) suggested that the two first phases of the July 23 collapse produced about 7 Mm 3 of material and the third one about 14 Mm 3. The volumes of the northern and southern submarine deposit lobes, 15 Mm 3 and 96 Mm 3 respectively, are not very different. 16
18 Thus, there is no clear association of one phase of the collapse to one submarine lobe. econd, we observed that deposits from 1999 to 22, which are related to multiple events, form a single axis deposit without multiple lobes. Therefore, the northern lobe of the deposit, which consists of a single axis deposit could also be formed by multiple events. Third, and most importantly, is that the flow associated with the southern lobe deposit had the larger run-out distance (more than 7 km from the coast) suggesting it had higher energy and thus more likely to be linked to the peak conditions discharge of the July 23 collapse. In addition, the emplacement of the main part of the southern lobe on slopes less than 5 (Fig. 1b) strongly supports the high energy of the flow. Indeed, for the northern lobe and the deposits, the main part of the deposit is located on slopes greater than 5 (see previous section and Figs. 1 a,b). Lastly, the July 23 event also eroded the Tar River Valley producing a channel deeper than the pre-1996 valley formed on land (Fig. 3, August 23). The new channel was open to the east and provided a West-East direction for the flows to move towards the sea and continues on to form the southern lobe (south path on Fig. 7b). We thus propose that the northern lobe of the deposits resulted from both: 1) a succession of pyroclastic flows that occurred between 22 and 23, and 2) the first stages and a small part of the peak conditions collapse of the July 23 event. In contrast, the southern lobe deposit thus resulted from the main part (~ 7 %) of the peak collapse conditions. Emplacement of the southern lobe can be explained by the previous infill of D1, which deflected the material southward and/or by a more southern path for the flow on-land due to the erosion of the Tar River Valley (outh path on Fig. 7b). The deposits have formed new topographic ridges within the C2 embayment and they will probably control the emplacement of forthcoming deposits ummary 17
19 The eruption of oufrière Hills illustrates the evolution of submarine pyroclastic deposits from a volcano located on a small subduction zone island. umerous pyroclastic flows entered the sea discharging a part of their material offshore, particularly during periods of intense activity characterised by rapid lava dome growth. On several occasions (2, 21, 23, 26), voluminous lava dome collapses discharged the majority of erupted material into the sea. During the July 23 collapse the entire lava dome was destroyed and most of the older pyroclastic products that filled the Tar River Valley were eroded and deposited into the sea. ubsequently, mudflows and fluvial erosion have also contributed to transporting a significant volume of the pyroclastic products into the sea, both during dome collapse and in the months to years of intervening quiescence. By May 25, ~ 5 Mm 3 of magma had been extruded since the beginning of the eruption (MVO internal reports, Trofimovs et al., 26). According to the analysis of marine surveys, the total volume of the submarine deposits in May 25 was about 482 Mm 3 ( ) equivalent to 377 Mm 3 using a typical bulk density of 23 kg m -3 for the lava dome and average submarine sediment density as 18 kg m -3. This value is in relatively good agreement, but larger than the 3 Mm 3 estimated from on-land observations (collapses or pyroclastic flows that have been observed to enter the sea and from which the volume has been calculated). The difference can be explained by the pyroclastic material that has been observed entering the sea without volume estimation and by subaerial erosion of previously-emplaced pyroclastic material. We thus propose that, by May 25, a minimum of 377 Mm 3 of the magmatic material produced had entered the sea, which corresponds to 75 % of the erupted volume. Considering that we have not estimated the thickness of submarine deposits at depths shallower than 3 m (in particular, the material building the coastal fans), the percentage of the total volume discharged to the sea could exceed 8 % showing that most of the erupted material has been deposited into the sea. The fact that the main part of the subaerial pyroclastic products generated by eruptions can end up in the sea has three major consequences: 1) a lot of small eruptions are probably not 18
20 taken into account in the reconstruction of the history of these types of volcanoes and their eruptive frequency is consequently underestimated; 2) the magma production rate for volcanoes in these tectonic environments is also underestimated and is not taken into account, which has implications in terms of risk evaluation, as noted by Boudon et al. (27); and 3) morphological analysis of submarine deposits has strong implications for understanding the scale of tsunami that may result from pyroclastic flows entering the ocean Acknowledgments We thank the captains, officers and crew of both the Ifremer s R.V. L Atalante and the R.V. James Clark Ross. We thank the Aguadomar, Caraval and JR123 scientific teams for their efficient work at sea. We acknowledge the support of MVO in this study for logistic aspects during the marine surveys around Montserrat. We also thank MVO people for their useful reports, available on the website, on the on-going eruption. This study was supported by the CR-IU programme and by a ERC Research Grant (ER/A//22/963). IPGP contribution xxxx References BOADOA, C., MAYBERRY, G. C., CALDER, E.., PARK, R.. J., CHOUX, C., JACKO, P., LEJEUE, A. M., LOUGHLI,. C., ORTO, G. E., ROE, W. I., RYA, G. & YOUG,. R. 22. Tephra fallout in the eruption of oufrière Hills Volcano, Montserrat. In: DRUITT, T.H. & KOKELAAR, B.P. (eds), The Eruption of oufrière Hills Volcano, Montserrat, from 1995 to Geological ociety, London, Memoirs, 21, BOUDO, G., LE FRIAT, A., KOMOROWKI, J.-C., DEPLU, C. EMET, M.P. 27. Volcano flank instability in the Lesser Antilles Arc: diversity of scale, processes, and temporal recurrence. J. Geophys. Res. 112, B825, doi:1.129/26jb
21 BOUYE, P., WETERCAMP, D. & ADREIEFF, P The Lesser Antilles Island Arc, in MOORE, J.C., MACLE, A. (eds) Proceedings of the Ocean Drilling Program, cientific Results, 11, CAR,.A., WATT, R.B., THOMPO, G., ORTO, G.E., 24. Anatomy of a lava dome collapse: the 2 March 2 event at oufrière Hills Volcano, Montserrat. Journal of Volcanology and Geothermal Research, 131, COLE, P.D., CALDER, E.., PARK, R..J., CLARKE, A.B., DRUITT, T.H., YOUG,.R., HERD, R.A., HARFORD, C.L., ORTO, G.E. 22. Deposits from dome-collapse and fountaincollapse pyroclastic flows at soufrière Hills Volcano, Montserrat. In: DRUITT, T.H., AD KOKELAAR, B.P. (eds) The eruption of oufriere Hills Volcano, Montserrat, from 1995 to 1999, Geological ociety, London, Memoirs, 21, DEPLU, C., LE FRIAT, A., BOUDO, G., KOMOROWKI, J.-C., VILLEMAT, B., HARFORD, C., EGOUFI, J., CHEMIEE, J.-L. 21. ubmarine evidence for large-scale debris avalanches in the Lesser Antilles Arc, Earth and Planetary ciences Letters, 192, 2, DEPLU C., LE FRIAT A., BOUDO G., KOMOROWKI J.-C., PARK., HARFORD C. 22. umerous Debris Avalanche Deposits off the southern part of Monserrat revealed by recent oceanographic cruises - Montagne Pelée meeting, Martinique island, Mai 22. HARFORD, C.L., PRIGLE, M.., PARK, R..J. & YOUG,.R. 22. The volcanic evolution of Montserrat using 4 Ar/ 39 Ar geochronology. In: DRUITT, T.H. & KOKELAAR, B.P. (eds), The Eruption of oufrière Hills Volcano, Montserrat, from 1995 to Geological ociety, London, Memoirs, 21, HART, K., CAREY,., IGURDO, H., PARK, R..J. & ROBERTO, R.E.A., 24. Discharge of pyroclastic flows into the sea during the eruptions of the oufrière Hills volcano, Montserrat. Bulletin of Volcanology, 66,
22 HERD, R.A., EDMOD, M., BA, V., 25. Catastrophic lava dome failure at oufrière Hills Volcano, Montserrat July 23. Journal of Volcanology and Geothermal Research, 148, p , doi:1.116/j.jvolgeores HICK, T., PARK, R.J., DUKLEY, P. & COLE, P. 25. Montserrat. In: LIDAY, J. M., ROBERTO, E.A., HEPHERD, J.B., ALI,. (eds), Volcanic Hazard Atlas of the Lesser Antilles, University of the West Indies, eismic Research Unit, Trinidad and IAVCEI, LE FRIAT, A., HARFORD, C.L., DEPLU, C., BOUDO, G., PARK, R..J., HERD, R.A. & KOMOROWKI, J.C. 24. Geomorphological evolution of Montserrat (West Indies): importance of flank collapse and erosional processes. Journal of the Geological ociety, London, 161, LE FRIAT, A., E.J. LOCK, M.B. HART, G. BOUDO, R..J. PARK, M.J. LEG, C.W. MART, J.C. KOMOROWKI, C. DEPLU, AD J.K. FIHER (28), Late Pleistoicene tephrochronology of marine sediments adjacent to Montserrat, Lesser Antilles volcanic arc. Journal of the Geological ociety of London, 165, MAO, D.G., 1994, Late Quaternary turbidity current pathways to the Madeira Abyssal Plain and some constraints on turbidity current mechanisms. Basin Res. 6, MATTHEW, A.J., BARCLAY, J., CAR,., THOMPO, G., ALEXADER, J., HERD, R., WILLIAM, C., 22. Rainfall induced volcanic activity on Montserrat. Geophysical Research Letters, 29 (13), doi: 1.129/22GL MATTIOLI, G.., VOIGHT, B., LIDE, A.T., ACK, I.., WATT, P., WIDIWIJAYATI, C., YOUG,.R., HIDAYAT, D., ELWORTH, D., MALI, P.E., HALEV, E., VA BOKIRK, E., JOHTO, W., PARK, R..J., EUBERG, J., BA, V., DUKLEY, P., HERD, R., YER, T., WILLIAM, P., WILLIAM, D., 27. Unique and remarkable dilatometer measurements of pyroclastic flow-generated tsunamis. Geology, 35 (1),
23 MULDER, T. & ALEXADER, J. 21. Abrupt change in slope causes variation in the deposit thickness of concentrated particle-driven density currents. Marine Geology, 175, ROBERTO, R.E.A., APIALL, W.P., HERD, R.A., ORTO, G.E., PARK, R..J., YOUG,.R. 2. The eruption of the oufriere Hills volcano, Montserrat, WI. Philosophical Transactions of the Royal ociety of London eries a Mathematical Physical and Engineering ciences, 358, MITH, W.H.F. & ADWELL, D.T Global sea floor topography from satellite altimetry and ship depth soundings. cience, 227, PARK, R..J., BARCLAY, J., CALDER, E.., HERD, R.A., KOMOROWKI, J.C., ORTO, G.E., RITCHIE, L., VOIGHT, B., WOOD, A.W. 22. Generation of a debris avalanche and violent pyroclastic density current : the Boxing Day eruption of 26 December 1997 at the oufriere Hills Volcano, Montserrat. In DRUITT, T.H., AD KOKELAAR, B.P.(eds) The eruption of oufriere Hills Volcano, Montserrat, from 1995 to 1999, London, Geological ociety Memoir, 21, TALLIG, P.J., WY, R.B., MAO, D.G., FREZ, M., CROI, B.T., CHIEBEL, R., AKHMETZHAOV, A.M., DALLMEIER-TIEE,., BEETTI,., WEAVER, P.P.E., GEORGIOPOULOU, A., ZÜHLDORFF, C., AMY, L.A. 27. Onset of submarine debris flow deposition far from original giant landslide, ature, 45, , doi:1.138/nature6313. TROFIMOV, J., AMY, L., BOUDO, G., DEPLU, C., DOYLE, E., FOURIER,., HART, M.B., KOMOROWKI, J.-C., LE FRIAT, A., LOCK, E. J., PUDEY, C., RYA, G., PARK, R..J. & TALLIG, P.J. 26. ubmarine pyroclastic deposits formed at the oufrière Hills volcano, Montserrat ( ): What happens when pyroclastic flows enter the ocean? Geology, 34, n 7, ; doi: 1.113/G
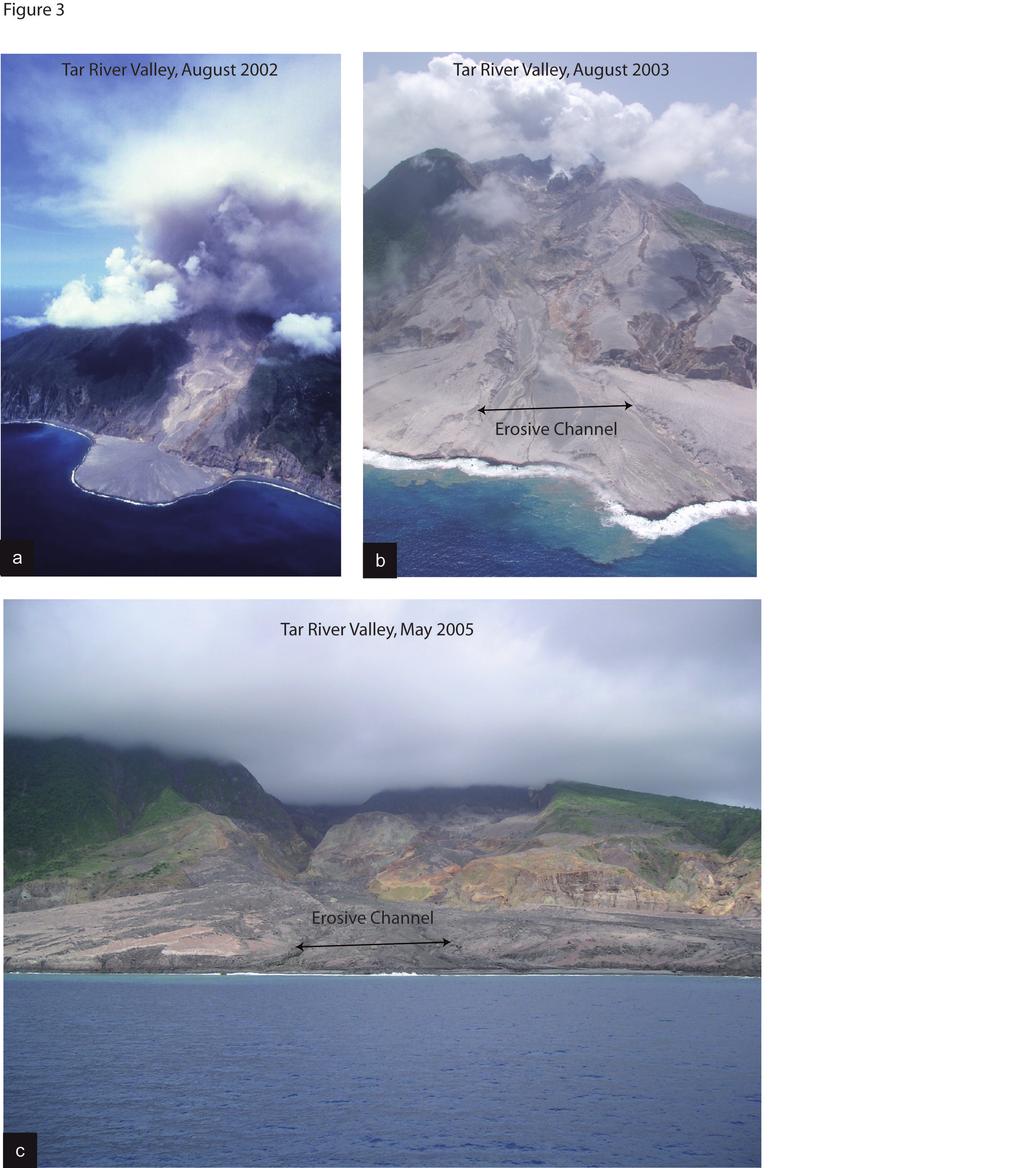
24 TROFIMOV J., PARK, R..J., TALLIG, P.J., 28. Anatomy of a submarine pyroclastic flow and associated turbidity current: July 23 dome collapse, oufrière Hills volcano, Montserrat, West Indies. edimentology, 55, VOIGHT, B., KOMOROWKI, J.C., ORTO, G.E., BELOUOV, A.B., BELOUOVA, BOUDO, G., FRACI, P.W., FRAZ, W., HEIRICH, P., PARK, R..J., YOUG,.R. 22. The 26 December (Boxing Day) 1997 sector collapse and debris avalanche at oufrère Hills Volcano, Montserrat. In DRUITT, T.H., AD KOKELAAR, B.P.(eds) The eruption of oufriere Hills Volcano, Montserrat, from 1995 to 1999, London, Geological ociety Memoir, 21, VOIGHT, B., LIDE, A.T., ACK, I.., MATTIOLI, G.., PARK, R..J., ELWORTH, D., HIDAYAT, D., MALI, P.E., HALEV, E., WIDIWIJAYATI, C., YOUG,.R., BA, V., CLARKE, A., DUKLEY, P., JOHTO, W., MCWHORTER,., EUBERG, J., WILLIAM, P., 26. Unprecedented pressure increase in deep magma reservoir triggered by lavadome collapse. Geophysical research Letters, 33, L3312, doi:1.129/25gl2487. YOUG,. R., PARK, R.. J., APIALL, W. P., LYCH, L. L., MILLER, A. D., ROBERTO, R. E. A. & HEPHERD, J. B Overview of the eruption of oufrière Hills volcano, Montserrat, 18 july 1995 to December Geophysical Research Letters, 25, Figures captions Fig. 1 : (a) Geodynamic setting of Montserrat (West Indies). Predicted bathymetry from mith & andwell (1997). Contour interval is 25 m, and 2 m isolines are in bold. Volcanic islands are black and sub-aerial coral reef platforms dark grey. The <1 m deep submarine shelves are light grey. Inset: the four major massifs of Montserrat showing the evolution of volcanism from north to south. (b) Topographic map of the south part of Montserrat from the 23
25 pre-eruption land 1 m DEM (Digital Elevation Model), air-photo derived (courtesy of Geoff Wadge); contour intervals is 25 m. Place names referred to in the text are marked and ages are from Harford et al. (22). Fig. 2: 3 D view of a 5 m resolution DEM centered on the island and showing the bathymetric context and the shallow submarine shelf around the island. The DEM has been constructed by combining the Aguadomar swath-bathymetry data (January 1999) with the pre-eruption land 1 m DEM. Coastline of Tar River and White River deltas were measured using differential GP by Montserrat Volcano Observatory (Autumn 1998). Fig. 3: Pictures of the Tar River Valley and fan, taken from the East and showing the different stages of erosion of the valley and the fan. a) August 22, photo from MVO, b) August 23 after the major July 23 collapse, c) May 25. Fig. 4: Plot of collapse event magnitudes versus time throughout the Montserrat eruption from 1995 to 25. Main phases of lava dome growth are indicated. At the top of the figure, Mm 3 = millions of cubic meters. Data mainly from MVO internal reports ( and the following articles: Young et al., 1998; Bonadonna et al, 22; Cole et al., 22; Matthews et al., 22; parks et al., 22; Carn et al., 24; Hinck et al., 25; Herd et al., 25. Fig. 5: Bathymetric map showing the swath bathymetry coverage of the Aguadomar survey, January 1999, the white lines indicate ship tracks, the extent of the deposits identified by Hart et al., 24 is annotated. A similar swath bathymetry coverage has been collected during the two other surveys (Caraval, March 22; JR123, May 25). Fig. 6: (a) Histogram of frequency of the depth difference outside the areas of deposition illustrating that depth differences accuracy is about +/- 4m. (b) Histogram of frequency of the depth difference outside the areas of deposition illustrating that depth differences accuracy is about +/- 3m. Fig. 7: (a) Detailed map of the deposit on the sea floor off from the Tar River Valley. Colors indicate the depth difference between the two surveys (Caraval, March 22 24
26 and Aguadomar, January 1999). Black contour lines show the January 1999 bathymetry with a 25 m contour interval. The depth profile of Line A is shown on Fig. 9. (b) Detailed map on the deposit on the sea bottom. Colors indicate the depth difference between the two surveys (JR123, May 25 and Caraval, March 22). Black contour lines show the March 22 bathymetry with a 25 m contour interval. The depth profiles of Lines B and C are shown on Fig. 9. (c) Detailed map of depth differences between May 25 and January 1999 showing the areas of pyroclastic material on the sea floor. Colors indicate the depth difference between the JR123, May 25 and Aguadomar, January 1999, surveys. The depth profiles of Lines 1 to 22 are shown in Fig. 8. Fig. 8: - bathymetric profiles crossing the submarine deposits with an orientation perpendicular to the main direction of flow. The locations of the profiles are shown on Fig. 7c. The solid line indicates the Aguadomar bathymetry (January 1999), the dashed line indicates the Caraval bathymetry (March, 22), and the dotted line indicates the JR123 bathymetry (May 25). These profiles show the superposition and the evolution of the deposits. The C1 embayment is annotated. The D 1 and D 2 indicate some depressions (or channels) in the 1999 bathymetry, the D 1 and D 2 indicate new depressions in the 22 bathymetry. Fig. 9: Longitudinal bathymetric and deposit thickness profiles along lines A, B and C. The locations of the profiles are shown on the Figs. 7 a,b and are taken along the central, thickest part of the deposits. The horizontal axis indicates a distance in km along the West-East direction. On the depth profiles, the solid line indicates the Aguadomar bathymetry (January 1999), the dashed line indicates the Caraval bathymetry (March, 22) and the dotted line indicates the JR123 bathymetry (May 25). On the thickness profiles, the solid line indicates the thickness of the different deposit. a) Line A: deposit; b) Line B: deposit along the northern lobe; and c) Line C: deposit along the southern lobe. The previously defined breaks in the slope are also reported. 25
27 Fig. 1: lopes of the sea floor computed using: a) the 5 m resolution digital terrain model deduced from the 1999 swath bathymetry (Aguadomar); b) the 5 m resolution digital terrain model deduced from the 22 swath bathymetry (Caraval). The extents and areas of maximum deposits thickness are shown using the 1 m and 4 m isolines Table 1. ummary of the collapses which occurred during the oufrière Hills eruption, from 1995 to 25, showing the events which reached the sea, and the estimated volumes. Volumes are in Mm 3 (millions of cubic meters). R means that the flow reached the sea but the volume is unknown. PF means Pyroclastic Flows. Data are mainly from MVO internal reports ( and the following articles: Young et al., 1998; Bonadonna et al, 22; Cole et al., 22; Matthews et al., 22; parks et al., 22; Carn et al., 24; Hinck et al., 25; Herd et al.,
28 Figure 1 B to ot ml es sg ha ut 1 Centre Hills 663 ±49 ka 826 ±12 ka Pelican Ghaut 3 High Cliffs 4 55 ±23 ka ATLATIC OCEA 3 1 t oufrière Hills outh (13 ka) oufrière Hills 1 km Gages Peak 'W -4 Plymouth Martinique Lava domeso'gar (ongoing eruption) Castle Peak 914 Chances Peak -2 Barbados r 4 ive outh oufrière Hills 1 White River Fan -2 Grenadines 1 km W 1 km 59 W 62 2 W 62 1 W 'W Landing Bay Grenada 63 W 2 R te hi W Perches Mt Roche's Bluff oufrière Hills Grenada Basin t. Vincent ney's Ghaut pring Ghaut -2 t. Lucia Tar River Fan Tar River Valley t Ghau aimie Mefr Galway's Mt 5 14 t au Gh 3 CARIBBEA EA t George's Hill 3 Richmond Hill (17 ka - present) m tto Bo e's t i Wh t Ghau Irish Dominica ha u Garibaldi Hill (95-55 ka) 7 Centre Hills Riv er ' -4 Guadeloupe 282 ±8 ka 1 Montserrat 2 m Tu itt' sg (26-12 ka) -2 lha Redonda ilver Hills Ghaut Mosquito Be Antigua 954 ±12 ka 7 t. Eustatius t. Kitts evis t. Martin t. Barthelemy Barbuda 871 ±1 ka 3 6 Outer Arc 16 45' 4 ubmarine helf (between and -1m) -4 coral reef platforms -6 Inner Arc 7 Anguilla 4 b volcanic islands -2 6 a hoe Rock

29 Figure 2 Center Hills oufrière Hills Volcano ilver Hills ubmarine shelf ea level Tar River fan White River fan 1 km
30
31 Aguadomar Cruise Caraval Cruise JR123 Cruise Figure 4 Collapsed Volume (Mm 3 ) 21 Large 15 Phase 1 Phase 2 Phase 3 Phase 4 Lava dome growth Lava dome growthphase July mall Unknown 21 eptember December July March 2 29 July

32 C2 C1 Figure ' ' 16 4' 16 38' Extent of deposits offshore from Tar River, from Hart et al., ' ' 297 5' ' ' ' m
33 Figure 6 Frequency Frequency umber of common points = Mean difference = 1.56 m tandart Deviation = 4.1 m a Differences in meters 1 9 umber of common points = 5916 b 8 Mean difference = 1.17 m 7 tandart Deviation = 3.13 m Differences in meters


34 Figure km 8 m ' m A ' slope break a 297 5' ' ' km 1 5 m deposit 1 25 m ' B orth path ' b outh path slope break 297 5' ' ' 5 m C m deposit 1 25 m ' ' c ' ' 4
This is the author s version of a work that was submitted/accepted for publication in the following source:
 This is the author s version of a work that was submitted/accepted for publication in the following source: Le Friant, A., Deplus, C., Boudon, G., Feuillet, N., Trofimovs, J., Komorowski, J.C., Sparks,
Ocean Basins, Bathymetry and Sea Levels
 Ocean Basins, Bathymetry and Sea Levels Chapter 4 Please read chapter 5: sediments for next class and start chapter 6 on seawater for Thursday Basic concepts in Chapter 4 Bathymetry the measurement of
Marine Science and Oceanography
 Marine Science and Oceanography Marine geology- study of the ocean floor Physical oceanography- study of waves, currents, and tides Marine biology study of nature and distribution of marine organisms Chemical
Chapter Overview. Bathymetry. Measuring Bathymetry. Measuring Bathymetry
 CHAPTER 3 Marine Provinces Chapter Overview The study of bathymetry determines ocean depths and ocean floor topography. Echo sounding and satellites are efficient bathymetric tools. Most ocean floor features
Map shows 3 main features of ocean floor
 Map shows 3 main features of ocean floor 2017 Pearson Education, Inc. Chapter 3 Marine Provinces 2017 Pearson Education, Inc. 1 Chapter 3 Overview The study of bathymetry determines ocean depths and ocean
Bathymetry Measures the vertical distance from the ocean surface to mountains, valleys, plains, and other sea floor features
 1 2 3 4 5 6 7 8 9 10 11 CHAPTER 3 Marine Provinces Chapter Overview The study of bathymetry determines ocean depths and ocean floor topography. Echo sounding and satellites are efficient bathymetric tools.
2) re-positioning of the SSS data, 3) individuation of geomorphological features and morphometrical parameters correlated to instability phenomena.
 re-positioning of the SSS data, 3) individuation of geomorphological features and morphometrical parameters correlated to instability phenomena.") HIGH-RESOLUTION SIDE SCAN SONAR AND MULTIBEAM DATA PROCESSING AND MERGING TO STUDY SUBMARINE INSTABILITY PHENOMENA ON VOLCANIC ISLANDS (PONTINE, CAMPANIAN AND AEOLIAN ARCHIPELAGOS) A. BOSMAN Extended abstract:
HIGH-RESOLUTION SIDE SCAN SONAR AND MULTIBEAM DATA PROCESSING AND MERGING TO STUDY SUBMARINE INSTABILITY PHENOMENA ON VOLCANIC ISLANDS (PONTINE, CAMPANIAN AND AEOLIAN ARCHIPELAGOS) A. BOSMAN Extended abstract:
MARINE GEOLOGY & GEOGRAPHY
 MARINE GEOLOGY & GEOGRAPHY Bathymetry BATHYMETRY BATHYMETRY THE UNDERWATER EQUIVALENT TO TOPOGRAPHY THE STUDY OF WATER DEPTH A BATHYMETRIC MAP SHOWS FLOOR RELIEF OR TERRAIN AS CONTOUR LINES Bathymetry
Oceanography, An Invitation to Marine Science 9e Tom Garrison. Ocean Basins Cengage Learning. All Rights Reserved.
 Oceanography, An Invitation to Marine Science 9e Tom Garrison 4 Ocean Basins Key Concepts Tectonic forces shape the seabed The ocean floor is divided into continental margins and deep ocean basins The
Unit 6: The Sea Floor
 Unit 6: The Sea Floor Turn to Page 62 in Introduction to the World s Oceans Study the bathymetric chart What features do you see? How do the Atlantic and Pacific Oceans differ? What do you think accounts
Earth / Environmental Science. Ch. 14 THE OCEAN FLOOR
 Earth / Environmental Science Ch. 14 THE OCEAN FLOOR The Blue Planet Nearly 70% of the Earth s surface is covered by the global ocean It was not until the 1800s that the ocean became an important focus
Lecture Marine Provinces
 Lecture Marine Provinces Measuring bathymetry Ocean depths and topography of ocean floor Sounding Rope/wire with heavy weight Known as lead lining Echo sounding Reflection of sound signals 1925 German
Geography of the world s oceans and major current systems. Lecture 2
 Geography of the world s oceans and major current systems Lecture 2 WHY is the GEOMORPHOLOGY OF THE OCEAN FLOOR important? (in the context of Oceanography) WHY is the GEOMORPHOLOGY OF THE OCEAN FLOOR important?
Seafloor Morphology. Techniques of Investigation. Bathymetry and Sediment Studies
 Seafloor Morphology I f we select a grid for the surface of the earth (i.e. 5 km 2 ) and assign it an average elevation in relation to sea level, we can construct a graph of elevation versus area of the
MARINE GEOLOGY & GEOGRAPHY
 MARINE GEOLOGY MARINE GEOLOGY & GEOGRAPHY Marine Geology 4 LAYERS OF THE EARTH CRUST THICKNESS: VARIES BETWEEN OCEAN & CONTINENTS 5-40 KM STATE: SOLID ELEMENTS: SILICON, ALUMINUM, CALCIUM, SODIUM, POTASSIUM
24. Ocean Basins p
 24. Ocean Basins p. 350-372 Background The majority of the planet is covered by ocean- about %. So the majority of the Earth s crust is. This crust is hidden from view beneath the water so it is not as
Earth s Continents and Seafloors. GEOL100 Physical Geology Ray Rector - Instructor
 Earth s Continents and Seafloors GEOL100 Physical Geology Ray Rector - Instructor OCEAN BASINS and CONTINENTAL PLATFORMS Key Concepts I. Earth s rocky surface covered by of two types of crust Dense, thin,
Search and Discovery Article #40536 (2010) Posted June 21, 2010
 Posted June 21, 2010") Modern Examples of Mass Transport Complexes, Debrite and Turbidite Associations: Geometry, Stratigraphic Relationships and Implications for Hydrocarbon Trap Development* Fabiano Gamberi 1, Marzia Rovere
Modern Examples of Mass Transport Complexes, Debrite and Turbidite Associations: Geometry, Stratigraphic Relationships and Implications for Hydrocarbon Trap Development* Fabiano Gamberi 1, Marzia Rovere
UNIT 3 GEOLOGY VOCABULARY FLASHCARDS THESE KEY VOCABULARY WORDS AND PHRASES APPEAR ON THE UNIT 3 CBA
 UNIT 3 GEOLOGY VOCABULARY FLASHCARDS THESE KEY VOCABULARY WORDS AND PHRASES APPEAR ON THE UNIT 3 CBA A map that shows Earth s Topographic Map surface topography, which is Earth s shape and features Contour
SUMMARY OF ACTIVITIES CARRIED OUT OFFSHORE SCIARA DEL FUOCO IN THE FRAMEWORK OF THE GNV PROJECT #15
 SUMMARY OF ACTIVITIES CARRIED OUT OFFSHORE SCIARA DEL FUOCO IN THE FRAMEWORK OF THE GNV PROJECT #15 Immediately after the tsunami event which occurred on December 30, researchers involved in the GNV Project
ARE YOU READY TO THINK? Look at the first slide THINK PAIR SHARE!
 ARE YOU READY TO THINK? Look at the first slide THINK PAIR SHARE! WHAT PROMINENT FEATURE CAN YOU IDENTIFY IN THIS PICTURE? What do you think the different colors represent? Who might find such a picture
The Ocean Floor Earth Science, 13e Chapter 13
 The Ocean Floor Earth Science, 13e Chapter 13 Stanley C. Hatfield Southwestern Illinois College The vast world ocean Earth is often referred to as the blue planet Seventy-one percent of Earth s surface
The Sea Floor. Chapter 2
 The Sea Floor Chapter 2 Geography of the Ocean Basins World ocean is the predominant feature on the Earth in total area Northern Hemisphere = 61% of the total area is ocean. Southern Hemisphere = about
Foundations of Earth Science, 6e Lutgens, Tarbuck, & Tasa
 Foundations of Earth Science, 6e Lutgens, Tarbuck, & Tasa Oceans: The Last Frontier Foundations, 6e - Chapter 9 Stan Hatfield Southwestern Illinois College The vast world ocean Earth is often referred
The Ocean Floor Chapter 14. Essentials of Geology, 8e. Stan Hatfield and Ken Pinzke Southwestern Illinois College
 The Ocean Floor Chapter 14 Essentials of Geology, 8e Stan Hatfield and Ken Pinzke Southwestern Illinois College The vast world ocean Earth is often referred to as the water planet 71% of Earth s surface
Geologic Evolution of Latin America. Plate Tectonics: General Concepts & Applications to Latin America
 Geologic Evolution of Latin America Plate Tectonics: General Concepts & Applications to Latin America Structure of Earth: 3 major divisions of Core, Mantle, and Crust Upper mantle differs in the way that
The Marine Environment
 The Marine Environment SECTION 16.1 Shoreline Features In your textbook, read about erosional landforms, beaches, estuaries, longshore currents, and rip currents. For each statement below, write or. 1.
The Cascading Hazards from Cascadia s Earthquakes
 Tsunamis The Cascading Hazards from Cascadia s Earthquakes Earthquakes (Nisqually earthquake, Seattle, WA) Volcanoes (Mt St Helens eruption, WA) Joan Gomberg gomberg@usgs.gov Landslides (Oso landslide,
Lecture Outlines PowerPoint. Chapter 13 Earth Science 11e Tarbuck/Lutgens
 Lecture Outlines PowerPoint Chapter 13 Earth Science 11e Tarbuck/Lutgens 2006 Pearson Prentice Hall This work is protected by United States copyright laws and is provided solely for the use of instructors
Debris Avalanches. Debris avalanche deposits on a volcano in Chile. All of the area in the foreground is buried by a thick debris avalanche.
 Debris Avalanches Volcanoes are not very stable structures. From time to time, they collapse producing large rock and ash avalanches that travel at high speeds down valleys. Collapse maybe caused by an
Seismic Expressions of Submarine Channel - Levee Systems and Their Architectural Elements
 Seismic Expressions of Submarine Channel - Levee Systems and Their Architectural Elements Summary D.V. Ramana, Santanu De* and Kalyanbrata Datta KDMIPE, ONGC, Dehradun E-mail- devvenram@rediffmail.com
Geophysics the use of geology, laboratory & field experiments, mathematics, and instruments to study: Earthquakes and Volcanoes seismometers,
 Geophysics the use of geology, laboratory & field experiments, mathematics, and instruments to study: Earthquakes and Volcanoes seismometers, tiltmeters, EDM, remote sensing, Energy: oil, gas, hydrothermal
Chapter 02 The Sea Floor
 Chapter 02 The Sea Floor Multiple Choice Questions 1. One of the following is not one of the world's major ocean basins: A. Atlantic Ocean B. Arctic Ocean C. Indian Ocean D. Antarctic Ocean E. Pacific
The surface of the ocean floor is as varied as the land. The five major oceans, from largest to smallest, are
 11.1 Ocean Basins The surface of the ocean floor is as varied as the land. The five major oceans, from largest to smallest, are w the Pacific w the Atlantic w the Indian w the Southern w the Arctic The
SITE SURVEY FOR SITE 410, AN EXAMPLE OF THE USE OF LONG-RANGE SIDE-SCAN SONAR (GLORIA)
") 10. SITE SURVEY FOR SITE 410, AN EXAMPLE OF THE USE OF LONG-RANGE SIDE-SCAN SONAR (GLORIA) R. C. Searle and A. S. Laughton, Institute of Oceanographic Sciences, Wormley, GU8 5UB, UK and B. D. Loncarevic,
10. SITE SURVEY FOR SITE 410, AN EXAMPLE OF THE USE OF LONG-RANGE SIDE-SCAN SONAR (GLORIA) R. C. Searle and A. S. Laughton, Institute of Oceanographic Sciences, Wormley, GU8 5UB, UK and B. D. Loncarevic,
Summary of geothermal setting in Geo-Caraïbes target islands
 Summary of geothermal setting in Geo-Caraïbes target islands Dr Simon R Young Consultant to OAS Presentation made at the Guadeloupe workshop, 27 April 2004 St Lucia - overview Only one broad target area
Examining the Terrestrial Planets (Chapter 20)
") GEOLOGY 306 Laboratory Instructor: TERRY J. BOROUGHS NAME: Examining the Terrestrial Planets (Chapter 20) For this assignment you will require: a calculator, colored pencils, a metric ruler, and your geology
GEOLOGY 306 Laboratory Instructor: TERRY J. BOROUGHS NAME: Examining the Terrestrial Planets (Chapter 20) For this assignment you will require: a calculator, colored pencils, a metric ruler, and your geology
Assessment Schedule 2015 Earth and Space Science: Demonstrate understanding of the causes of extreme Earth events in New Zealand (91191)
") NCEA Level 2 Earth and Space Science (91191) 2015 page 1 of 6 Assessment Schedule 2015 Earth and Space Science: Demonstrate understanding of the causes of extreme Earth events in New Zealand (91191) Evidence
NCEA Level 2 Earth and Space Science (91191) 2015 page 1 of 6 Assessment Schedule 2015 Earth and Space Science: Demonstrate understanding of the causes of extreme Earth events in New Zealand (91191) Evidence
Why was this eruption important?
 Mount St. Helens Mount St. Helens has a long geological history (>3,000 yrs) of explosive eruptions. The 1980 Events: Initial relatively mild steam and ash (Vulcanian) eruptions. Sustained plinian eruption
Large-scale flank collapse events during the activity of Montagne Pelée, Martinique, Lesser Antilles
 JOURNAL OF GEOPHYSICAL RESEARCH, VOL. 108, NO. B1, 2055, doi:10.1029/2001jb001624, 2003 Large-scale flank collapse events during the activity of Montagne Pelée, Martinique, Lesser Antilles Anne Le Friant
The route towards a new GEBCO grid
 The route towards a new GEBCO grid Pauline Weatherall, GEBCO Digital Atlas Manager British Oceanographic Data Centre (BODC) GEBCO TSCOM/SCRUM meeting, Monaco, October 2012 The route towards a new GEBCO
OCN 201 Physiography of the Seafloor
 OCN 201 Physiography of the Seafloor 1 Ocean Depth versus Continental Height Why do we have dry land? Solid surface of Earth is dominated by two levels: Land with a mean elevation of +840 m (29% of Earth
Dynamic Earth A B1. Which type of plate boundary is located at the Jordan Fault? (1) divergent (3) convergent (2) subduction (4) transform
 divergent (3) convergent (2) subduction (4) transform") Dynamic Earth A B1 1. The edges of most lithospheric plates are characterized by (1) reversed magnetic orientation (2) unusually rapid radioactive decay (3) frequent volcanic activity (4) low P-wave and
Dynamic Earth A B1 1. The edges of most lithospheric plates are characterized by (1) reversed magnetic orientation (2) unusually rapid radioactive decay (3) frequent volcanic activity (4) low P-wave and
Changes in bottom morphology of Long Island Sound near Mount Misery Shoal as observed through Repeated Multibeam Surveys
 Changes in bottom morphology of Long Island Sound near Mount Misery Shoal as observed through Repeated Multibeam Surveys Laurie A. Zaleski Laurie.Zaleski@msrc.sunysb.edu Roger D. Flood rflood@notes.cc.sunysb.edu
Notes and Summary pages:
 Topographic Mapping 8.9C Interpret topographical maps and satellite views to identify land and erosional features and predict how these shapes may be reshaped by weathering ATL Skills: Communication taking
Section 2.1 Ocean Basins. - Has helped determine where ocean basins are located. - Tectonic plates move changing the position of the continents.
 Science 8 Unit 1: Water Systems on Earth Chapter 2: Oceans Control the Water Cycle Section 2.1 Ocean Basins Oceans are important because: 1. Primary water source for the water cycle 2. Control weather
Changes in Geomorphology and Backscatter Patterns in Mount Misery Shoal, Long Island Sound as Revealed through Multiple Multibeam Surveys
 Changes in Geomorphology and Backscatter Patterns in Mount Misery Shoal, Long Island Sound as Revealed through Multiple Multibeam Surveys Laurie A. Zaleski Laurie.Zaleski@msrc.sunysb.edu, Roger D. Flood
A) B) C) D) 4. Which diagram below best represents the pattern of magnetic orientation in the seafloor on the west (left) side of the ocean ridge?
 B) C) D) 4. Which diagram below best represents the pattern of magnetic orientation in the seafloor on the west (left) side of the ocean ridge?") 1. Crustal formation, which may cause the widening of an ocean, is most likely occurring at the boundary between the A) African Plate and the Eurasian Plate B) Pacific Plate and the Philippine Plate C)
1. Crustal formation, which may cause the widening of an ocean, is most likely occurring at the boundary between the A) African Plate and the Eurasian Plate B) Pacific Plate and the Philippine Plate C)
A Synopsis of the Krakatau 1883 Eruption: The Story Told by The Deposits
 A Synopsis of the Krakatau 1883 Eruption: The Story Told by The Deposits By Dr. Charles W. Mandeville American Museum of Natural History Dr. Steve Carey Dr. Haraldur Sigurdsson, both at Univ. Rhode Island,
Chapter 9 Lecture Outline. Oceans: The Last Frontier
 Chapter 9 Lecture Outline Oceans: The Last Frontier The Vast World Ocean Earth is referred to as the blue planet 71% of Earth s surface is oceans and marginal seas Continents and islands comprise the remaining
Chapter Two. Figure 02_02. Geography of the Ocean Basins. The Sea Floor
 Chapter Two The Sea Floor Geography of the Ocean Basins Figure 02_02 The world ocean is the predominant feature on the Earth in total area. In the Northern Hemisphere, 61% of the total area is ocean. In
GENERAL GEOLOGY Fall Chapter 18: The Sea Floor. Partial Examination IV Study Guide Dr. Glen S. Mattioli
 GENERAL GEOLOGY 1113-005 Fall 2008 Partial Examination IV Study Guide Dr. Glen S. Mattioli Note that these are NOT questions, but rather are a list of topics that we have covered either in class or are
Mt St Helens was know to have entered into active periods that lasted from years once every years over the last 500 years, (Figure 5).
.") Lecture #8 notes; Geology 3950, Spring 2006; CR Stern May 1980 eruption of Mt St Helens volcano (text pages 183-192 in the 4 th edition and 206-222 in the 5 th edition) Mt St Helens in southwest Washington
Lecture #8 notes; Geology 3950, Spring 2006; CR Stern May 1980 eruption of Mt St Helens volcano (text pages 183-192 in the 4 th edition and 206-222 in the 5 th edition) Mt St Helens in southwest Washington
OCN 201 Physiography of the Seafloor
 OCN 201 Physiography of the Seafloor Hypsometric Curve for Earth s solid surface Note histogram Hypsometric curve of Earth shows two modes. Hypsometric curve of Venus shows only one! Why? Ocean Depth vs.
60% water. Big Bang: 14,000 millions years ago The Earth originated about 4,500 millions years ago its orbit allows water to exist in a liquid state!
 Ch2. The Sea Floor #1 Why geology of the oceans? Marine habitats are directly shaped by geological processes The form of the coastlines The depth of the water Type of bottom (muddy, sandy, rocky) #2 Geological
Chapter 2 Plate Tectonics and the Ocean Floor
 Chapter 2 Plate Tectonics and the Ocean Floor Matching. Match the term or person with the appropriate phrase. You may use each answer once, more than once or not at all. 1. hydrothermal vents A. convergent
MULTIPLE CHOICE. Choose the one alternative that best completes the statement or answers the question.
 Geology 300, Physical Geology Spring 2019 Quiz Chapter 18, Seafloor Name MULTIPLE CHOICE. Choose the one alternative that best completes the statement or answers the question. 1) Abyssal fans are made
Divergent Boundaries: Origin and Evolution of the Ocean Floor
 1 2 3 4 5 6 7 8 9 10 11 12 Divergent Boundaries: Origin and Evolution of the Ocean Floor Earth, 12 th Edition, Chapter 13 Chapter 13 Divergent Boundaries From 1872 to 1876, the HMS Challenger expedition
FOOT OF THE CONTINENTAL SLOPE IN ARTICLE 76
 FOOT OF THE CONTINENTAL SLOPE IN ARTICLE 76 Vaughan Stagpoole, Institute of Geological & Nuclear Sciences, Lower Hutt, New Zealand, v.stagpoole@gns.cri.nz Ray Wood, Institute of Geological & Nuclear Sciences,
Submarine canyons and channels of the Tyrrhenian Sea: from geological observations to oceanographic, biological and hazards studies
 SUBMARNE CANYON DYNAMCS - Sorrento, taly, 15-18 April 2015 Submarine canyons and channels of the Tyrrhenian Sea: from geological observations to oceanographic, biological and hazards studies Fabiano Gamberi
Name Date Class. Directions: Use the diagram below to answer question Florida Progress Monitoring and Benchmark Assessments
 b e n c h m a r k t e s t : e a r t h a n d s p a c e s c i e n c e Multiple Choice 1. Geologists obtain indirect evidence about Earth s interior by A measuring pressure differences at Earth s surface.
Orting Community College Proposal
 Orting Community College Proposal Cedric, Celina, Francine, Sarah, Samuel GEO CORP Located in Washington, 42 miles south of Seattle. Situated between two rivers on fertile plains. Built on lahar deposits.
Meandering Miocene Deep Sea Channel Systems Offshore Congo, West Africa
 Meandering Miocene Deep Sea Channel Systems Offshore Congo, West Africa S. Baer* (PGS), J. E. Comstock (PGS), K. Vrålstad (PGS), R. Borsato (PGS), M. Martin (PGS), J.P. Saba (SNPC), B. Débi-Obambé (SNPC)
MAR110 Lecture #3 Ocean Bathymetry / Plate Tectonics
 1 MAR110 Lecture #3 Ocean Bathymetry / Plate Tectonics Ocean Basin Geographic Zones The geographic zones of the North Atlantic are identified in the bird s eye view of the sea floor above. Below is shown
Full file at
 Essentials of Oceanography, 10e (Trujillo/Keller) Chapter 2 Plate Tectonics and the Ocean Floor Match the term with the appropriate phrase. You may use each answer once, more than once or not at all. A)
A physical feature of the Earth s surface
 Earth s Landforms A physical feature of the Earth s surface A physical feature of the Earth s surface LANDFORM Highest of Earth s physical features Highest of Earth s physical features MOUNTAIN Low area
Study Guide: Unit 3. Density and Pressure: You should be able to answer the types of questions given in the end of module questions.
 IDS 102 Study Guide: Unit 3 The purpose of this study guide is to help you prepare for the third exam by focusing your studying and providing example essay questions. In the Focus On section you will find
Questions and Topics
 Plate Tectonics and Continental Drift Questions and Topics 1. What are the theories of Plate Tectonics and Continental Drift? 2. What is the evidence that Continents move? 3. What are the forces that
Unit 1: Water Systems on Earth Chapter 2
 Unit 1: Water Systems on Earth Chapter 2 Create a mind map with the driving question, Why are Oceans Important? Remember: Why are oceans so important? Why are oceans so important? Primary water source
Exploring Geography. Chapter 1
 Exploring Geography Chapter 1 The Study of Geography Geography is the study of where people, places, and things are located and how they relate to each other. Greek meaning writing about or describing
Morphology of Canal Isabela in the Galapagos Islands
 Morphology of Canal Isabela in the Galapagos Islands Allison Cougan University of Washington School of Oceanography Box 357940 Seattle, WA 98195 allcoug@u.washington.edu 206.427.9084 November 23, 2005
IODP Proposal Cover Sheet
 IODP Proposal Cover Sheet New Revised Addendum Please fill out information in all gray boxes Above For Official Use Only Please check if this is Mission proposal Title: Drilling volcanic landslides deposits
Earth, the Lively* Planet. * not counting the life on the planet!
 Earth, the Lively* Planet * not counting the life on the planet! What We Will Learn Today What are planet Earth s features? What processes shape planetary surfaces? How does Earth s surface move? How did
Origin and Evolution of the Ocean Floor
 Chapter 13 Lecture Earth: An Introduction to Physical Geology Twelfth Edition Origin and Evolution of the Ocean Floor Tarbuck and Lutgens Chapter 13 Divergent Boundaries An Emerging Picture of the Ocean
Social Studies 9 UNIT 2 GEOGRAPHIC INFLUENCES ON IDENTITY: PLACE AND PEOPLE
 Social Studies 9 UNIT 2 GEOGRAPHIC INFLUENCES ON IDENTITY: PLACE AND PEOPLE The Structure of the Earth To understand the forces that create Canada's physical landscape we must understand the structure
Potential Flank-Collapse of Soufrie` re Volcano, Guadeloupe, Lesser Antilles? Numerical Simulation and Hazards
 Natural Hazards (2006) 39: 381 393 Ó Springer 2006 DOI 10.1007/s11069-005-6128-8 Potential Flank-Collapse of Soufrie` re Volcano, Guadeloupe, Lesser Antilles? Numerical Simulation and Hazards ANNE LE FRIANT
From Punchbowl to Panum: Long Valley Volcanism and the Mono-Inyo Crater Chain
 From Punchbowl to Panum: Leslie Schaffer E105 2002 Final Paper Long Valley Volcanism and the Mono-Inyo Crater Chain Figure 1. After a sequence of earthquakes during the late 1970 s to the early 1980 s
TAKE HOME EXAM 8R - Geology
 Name Period Date TAKE HOME EXAM 8R - Geology PART 1 - Multiple Choice 1. A volcanic cone made up of alternating layers of lava and rock particles is a cone. a. cinder b. lava c. shield d. composite 2.
The Marine Environment
 The Marine Environment SECTION 16.1 Shoreline Features In your textbook, read about erosional landforms, beaches, estuaries, longshore currents, and rip currents. For each statement below, write true or
Continental Margin Geology of Korea : Review and constraints on the opening of the East Sea (Japan Sea)
") Continental Margin Geology of Korea : Review and constraints on the opening of the East Sea (Japan Sea) Han-Joon Kim Marine Satellite & Observation Tech. Korea Ocean Research and Development Institute
Continental Margin Geology of Korea : Review and constraints on the opening of the East Sea (Japan Sea) Han-Joon Kim Marine Satellite & Observation Tech. Korea Ocean Research and Development Institute
Before Plate Tectonics: Theory of Continental Drift
 Before Plate Tectonics: Theory of Continental Drift Predecessor to modern plate tectonics Shape and fit of the continents was the initial evidence Snider-Pelligrini (1858) Taylor (1908) Wegner (1915) Fig.
water erosion lithosphere Describe the process of erosion and deposition. chemical weathering Dissolving limestone is an example of.
 At one time, there was one large island off the coast of Mississippi and now it is two separate islands. What caused the island to be split into two? water erosion The crust and the top part of the upper
! Profile of Mauna Loa in Hawaii. Mauna Loa is one of five huge shield volcanoes that make up the island of Hawaii.
 - Shield Volcanoes - Low, rounded profiles; slope angles 2-10 ; composed of numerous flows of mafic composition and little explosive activity - Largest of all volcanoes! Shield volcanoes consist of numerous
Plates & Boundaries The earth's continents are constantly moving due to the motions of the tectonic plates.
 Plates & Boundaries The earth's continents are constantly moving due to the motions of the tectonic plates. As you can see, some of the plates contain continents and others are mostly under the ocean.
Mass Wasting: The Work of Gravity
 Chapter 15 Lecture Earth: An Introduction to Physical Geology Twelfth Edition Mass Wasting: The Work of Gravity Tarbuck and Lutgens Chapter 15 Mass Wasting The Importance of Mass Wasting Slopes are the
Plate Tectonics. Development of a Theory. Mapping the Ocean Floor
 Plate Tectonics Development of a Theory Mapping the Ocean Floor Scientists began exploring the seafloor in greater detail during the late 1940s. They used a device called an echo sounder to measure the
Earth in 2-D, 3-D & 4-D
 Earth in 2-D, 3-D & 4-D We will consider the scientific tools and techniques used to map surface features, reconstruct the layered structure of Earth, and interpret Earth history, including the origin
Photogeologic Mapping of Mars
 Exercise Two and Fifteen are suggested as introductory exercises. 2.0 hours Exercise Seventeen Photogeologic Mapping of Mars Instructor Notes Suggested Correlation of Topics Deductive reasoning, geologic
Oceanography. Oceanography is the study of the deep sea and shallow coastal oceans.
 Oceanography Oceanography is the study of the deep sea and shallow coastal oceans. Studying the Ocean Floor To determine the shape and composition of the ocean floor, scientists use techniques such as
Earth Science Lesson Plan Quarter 2, Week 10, Day 1
 Earth Science Lesson Plan Quarter 2, Week 10, Day 1 Outcomes for Today Standard Focus: PREPARE 1. Background knowledge necessary for today s reading. Beaches are created by the actions of waves, tides,
MVO Activity Reports 2009
 MVO Activity Reports 2009 Ash from the 3 January 2009 explosions Open File Report OFR 13-04 8 March 2013 Montserrat Volcano Observatory - P.O. Box 318 - Flemmings Montserrat Tel : +1 (664) 491-5647 Fax:
Earth s Seafloors. Ocean Basins and Continental Margins. Introductory Oceanography Ray Rector - Instructor
 Earth s Seafloors Ocean Basins and Continental Margins Introductory Oceanography Ray Rector - Instructor OCEAN BASINS and CONTINENTAL PLATFORMS Key Concepts I. Earth s rocky surface covered by of two types
Can t t wait to take Exam 4!
 Can t t wait to take Exam 4! Really can t wait to study for the final exam! 1 2 Housekeeping Exam 4: study glossaries, chapter questions TA lab closed after Tues. How to study for exam 4 Make lists for
A bowl shaped depression formed by the collapse of a volcano is called a. Magma that has left the vent of a volcano is known as. Lava.
 Magma that has left the vent of a volcano is known as Lava A bowl shaped depression formed by the collapse of a volcano is called a Caldera This can form in a caldera when magma starts to come back up
Grade 8 Science. Unit 1: Water Systems on Earth Chapter 2
 Grade 8 Science Unit 1: Water Systems on Earth Chapter 2 Oceans are important... 1. Primary water source for the water cycle 2. Control weather 3. Support diverse life 4. Provides humans with food, minerals,
Unit 7.2 W.E.D. & Topography Test
 Name: Score: Unit 7.2 W.E.D. & Topography Test 1. 2. 3. 4. 5. 6. 7. 8. 9. 10. 11. 12. 13. 14. 15. 16. 17. 18. 19. 20. 21. 22. 23. 24. 25. 1. The formation of mountains is due mainly to while the destruction
Neotectonic Implications between Kaotai and Peinanshan
 Neotectonic Implications between Kaotai and Peinanshan Abstract Longitudinal Valley was the suture zone between the Philippine Sea plate and the Eurasia plate. Peinanshan was the southest segment of the
EDIMENTARY BASINS. What is a Sedimentary Basin? by Prof. Dr. Abbas Mansour
 EDIMENTARY BASINS What is a Sedimentary Basin? by Prof. Dr. Abbas Mansour WHAT IS A SEDIMENTARY BASIN? A low area on the Earth s surface relative to surroundings e.g. deep ocean basin (5-10 km deep) e.g.
Directed Reading. Section: The Water Planet. surface is called the a. Earth s ocean. b. Pacific Ocean. c. salt-water ocean. d. global ocean.
 Skills Worksheet Directed Reading Section: The Water Planet 1. The body of salt water covering nearly three-quarters of the Earth s surface is called the a. Earth s ocean. b. Pacific Ocean. c. salt-water
Sylvain Charbonnier. PASI Workshop About 60% of Indonesians live around 16 active volcanoes on the island of Java
 Numerical modelling of pyroclastic flows: a case study from the recent activity of Merapi Volcano, Central Java, Indonesia Sylvain Charbonnier PASI Workshop 2011 Case study: Merapi Volcano! About 60% of