TECHNICAL MEMO: FAR-FIELD SURVEYS OF SUSPENDED SEDIMENT PLUMES ASSOCIATED WITH CUTTERHEAD DREDGING IN JONES INLET, LONG ISLAND, NEW YORK
|
|
|
- Stanley Leonard
- 5 years ago
- Views:
Transcription

1 TECHNICAL MEMO: FAR-FIELD SURVEYS OF SUSPENDED SEDIMENT PLUMES ASSOCIATED WITH CUTTERHEAD DREDGING IN JONES INLET, LONG ISLAND, NEW YORK Federal Navigation Project FINAL Prepared for U.S. Army Corps of Engineers - New York District August 2014
2 Table of Contents 1.0 Introduction Study Area Dredge Operational Setup Methods Hydrodynamic Surveys Mobile ADCP Suspended Sediment Surveys Mobile ADCP Survey Design Mobile ADCP Data Presentation Design of Fixed Station Turbidity Surveys Water Sample Collection ADCP Calibration Sediment Sample Collection Results Hydrodynamic Survey Ambient Conditions Mobile ADCP Surveys January Ebb Tide January 2014 Flood Tide February Flood Tide OBS Turbidity Surveys January Flood Tide February Flood Tide Laboratory Analysis of Water Samples Sediment Sample Discussion Literature Cited i
3 List of Tables Table 1: Laboratory Results of Water Samples, Jones Inlet Far Field Survey (27 Table 2: Table 3: Table 4: Table 5: January 11 February 2014) 27 January 2014 Far Field Ebb Tide Survey Transect Summary Table 27 January 2014 Far Field Flood Tide Survey Transect Summary Table 11 February 2014 Far Field Flood Tide Survey Transect Summary Table Sediment Collection and Analysis Summary Table, Jones Inlet Far Field Survey (27 January 2014) List of Figures Figure 1: Jones Inlet Far Field Study Area Figure 2: Depth Averaged Velocities, 16 January Ebb Tide Hydrodynamic Survey Figure 3a-e: Vertical Profiles of ADCP Average Backscatter, 27 January 2014 Ebb Tide Far Field TSS Survey Figure 4a-c: ADCP Average Backscatter by Depth Interval, 27 January 2014 Ebb Tide Far Field TSS Survey Figure 5: Depth Averaged Velocities, 27 January Ebb Tide Far Field TSS Survey Figure 6a-i: Vertical Profiles of ADCP Average Backscatter, 27 January 2014 Flood Tide Far Field TSS Survey Figure 7a-c: ADCP Average Backscatter by Depth Interval, 27 January 2014 Flood Tide Far Field TSS Survey Figure 8: Depth Averaged Velocities, 27 January Flood Tide Far Field TSS Survey Figure 9a-i: Vertical Profiles of ADCP Average Backscatter, 11 February 2014 Flood Tide Far Field TSS Survey Figure 10a-c: ADCP Average Backscatter by Depth Interval, 11 February 2014 Flood Tide Far Field TSS Survey ii
4 Figure 11: Depth Averaged Velocities, 11 February 2014 Flood Tide Far Field TSS Survey Figure 12a-b: OBS Turbidity and Depth Measurements, 27 January 2014 Flood Tide Far Field Survey a) Up-current of Dredge b) Down-current of Dredge Figure 13a-b: OBS Turbidity and Depth Measurements, 11 February 2014 Flood Tide Far Field Survey a) Up-current of Dredge b) Down-current of Dredge Figure 14: Water Sample TSS Values and Associated Dredge Positions, 27 January 2014 Flood Tide Far Field Survey Figure 15: Water Sample TSS Values and Associated Dredge Positions, 11 February 2014 Flood Tide Far Field Survey Appendix A: Predicted Currents for Jones Inlet Survey Dates iii
5 List of Acronyms ADCP Acoustic Doppler Current Profiler ASTM American Society for Testing and Materials BMP Best Management Practices GPS Global Positioning System HDP Harbor Deepening Project NTU Nephelometric Turbidity Units OBS Optical Backscatter Sensor TSS Total Suspended Solids USACE-NYD Unites States Army Corps of Engineers New York District WQ Water Quality iv
6 1.0 INTRODUCTION The resuspension of bottom sediments within aquatic habitats may be induced by a variety of events both natural and anthropogenic. Naturally occurring storms or tidal flows, for example, influence suspended sediment concentrations within the water column, although the timing, duration and intensity of the resuspension may differ from that caused by human activities (Wilber & Clarke 2001). Characterization of the temporal duration, spatial extent and concentration structure of suspended sediment plumes generated by dredging activities, therefore, is critical to enhance the understanding of sediment transport processes and assessment of potential environmental impacts (Puckette 1998). Previous characterizations of dredging-induced plumes in New York/New Jersey Harbor largely focused on mechanical bucket dredging operations associated with deepening and maintenance of deep-draft vessel navigation channels. During coordination efforts with both state and Federal regulatory agencies a significant knowledge gap relevant to other common dredging practices in the area was identified as hydraulic cutterhead pipeline operations in shallow-draft channels. These operations frequently occur in coastal inlets, which are critical links for fishery resources in movements between open coastal waters and embayments. As part of the United States Army Corps of Engineers New York District s (USACE-NYD) Harbor-wide Water Quality/Total Suspended Solids (WQ/TSS) Monitoring Program, a series of far-field WQ/TSS surveys was conducted between 16 January and 11 February 2014 in Jones Inlet on the south shore of Long Island, New York. Monitoring occurred during maintenance dredging operations involving shoreline placement authorized as a Federal Navigation Project. The objective of these far-field surveys was to assess the spatial extent and temporal dynamics of suspended sediment plumes associated with cutterhead dredging of predominantly medium grain-size sandy sediments from shoals that had accumulated within the navigation channel. The methodologies employed for this survey were similar to those used previously to survey multiple dredging projects in the New York/New Jersey Harbor, including cutterhead dredging operations in the Kill Van Kull (USACE 2012 and USACE 2013b) and bucket dredging of fine-grained sediments in the Arthur Kill (USACE 2007, USACE 2013c, USACE 2014), Newark Bay (USACE 2008 and USACE 2009), Port Elizabeth Channel (USACE 2010), the Upper Bay (USACE 2011), and South Elizabeth Channel (USACE 2013a). However, because the nature of the sediments being dredged and the 1
7 geomorphology of the Jones Inlet contract area were substantially different than those represented by the prior far-field surveys, field and data analysis methodologies were modified as described below. Previous surveys consisted of a combination of mobile Acoustic Doppler Current Profiler (ADCP) transects and instrument arrays deployed at anchored fixed stations. In this survey, mobile surveys were conducted using an ADCP mounted on a 25-foot Boston Whaler research vessel. The mobile survey design consisted of parallel transects running perpendicular to the longitudinal axis of the suspended sediment plume. Transects were conducted adjacent to and down-current of the active dredging operation and were run such that the entire spatial extent of the plume s acoustic signature (i.e. the detectable signature above ambient backscatter) was recorded. Additionally, water samples were collected to directly measure total suspended solids (TSS in mg/l via gravimetric analysis) and optical turbidity across the broadest possible concentration range representative of both within-plume and ambient conditions. Under the typical survey design, the results of the gravimetric analysis of water samples are used to calibrate the ADCP-derived acoustic backscatter values for conversion to estimates of total suspended solids concentration. However, because of the coarse grained nature of the sediments encountered in this survey area, the compact size of the plume prevented collection of water samples that would allow an accurate conversion of ADCP backscatter to TSS concentration. Instead, raw acoustic backscatter values (db) were used to assess the extent, intensity and dynamics of the dredge plume. Results from gravimetric TSS analysis of collected water samples were used to provide secondary data on the extent and intensity of the plume. Further details on the ADCP calibration are presented in Section 2.5. Due to severe winter weather conditions in the contract area, the typical fixed station turbidity surveys using an anchored array of optical backscatter sensors (OBS) could not be conducted safely, as in previous monitoring events. Instead, OBS turbidity profiles of ambient and in-plume conditions were derived from data recorded during water sample collection. 1.1 Study Area Far-field WQ/TSS surveys were conducted between 16 January and 11 February 2014 in the Jones Inlet Contract Area. Figure 1 shows the area covered during the WQ/TSS 2
8 surveys, and the approximate positions of the cutterhead dredge in the Jones Inlet channel during each survey. Water depth in the area surveyed ranged between approximately two and ten meters. 1.2 Dredge Operational Setup The dredge contractor for this study was Weeks Marine, operating the cutterhead dredge CR McCaskill, configured with 17,400 total horse-power and a 34-inch intake suction diameter cutter. Sediment was pumped through a combined floating/submerged 30-inch pipeline to a beach discharge located west of the inlet. An important consideration in examining the plumes created by the cutterhead dredge operating in Jones Inlet is the effect of severe winter weather on how the dredging was conducted. Cutterhead dredges are not true seagoing vessels and are subject to limitations on safe dredging conditions imposed by wave height and wind speed. Given the orientation of the inlet, wave heights exceeding six feet and prevailing winds averaging 20 to 25 mph and gusting above 35 mph from the southwest through southeast quadrants led to temporary shutdowns. For example, during the week of January the dredge operated for no more than hours on any given day, and for as little as 1.75 hours on two separate days. On several occasions the dredge sought safe harbor in protected waters inside the inlet. Although cutterhead dredging operations may be perceived to be continuous, in reality most are highly punctuated, stop-start processes. In addition to weather constraints, cutterhead dredges frequently experience temporary shutdowns to clear pumps, particularly when encountering debris. At Jones Inlet, multiple shutdowns occurred when the dredge entrained tires, rocks and other debris. Thus the plumes are influenced in terms of their spatial extent and temporal duration by operational factors as well as the characteristics of the sediment being dredged and tidal hydrodynamics. The dredging project at Jones Inlet entailed the removal of a total of 665,470 cubic yards of sandy sediment from multiple shoals that had accumulated within the Federal navigation channel. Based on daily logs submitted by Weeks Marine, which included information on hours of operation and position of the cutterhead dredge on any given day, the CR McCaskill mobilized at Jones Inlet on 9 January 2014 and demobilized on 13 February During the intervening days the dredge actively pumped for a total of approximately 391 hours. Therefore an average production rate over the course of the project was approximately 1,702 cubic yards per hour. On several days when sea 3
9 conditions were favorable, production estimates based on slurry density instrumentation aboard the dredge ranged as high as 2,166 cubic yards per hour. 2.0 METHODS 2.1 Hydrodynamic Surveys Hydrodynamic conditions within the Jones Inlet channel were characterized during both ebb and flood tides using a vessel-mounted Teledyne RD Instruments 1200-kHz Workhorse Monitor Series ADCP. Because current flows during both flood and ebb tides were primarily parallel to the longitudinal axis of the navigation channel, mobile transects to characterize the plume generally were established perpendicular to that axis, with exceptions noted. Raw data from the hydrodynamic surveys were processed and examined for evidence of stratified flows, tidal eddies, and other patterns that could influence plume dispersion. For each survey, the observed hydrodynamic conditions were cross-referenced against predicted currents generated from NobleTec Tides & Currents software for Jones Inlet. The predicted currents data are presented for each survey date in Appendix A and show the water speed (in m/s; blue bars) and direction (negative values for ebb, positive for flood) and are useful in placing a particular survey within the context of the daily tide cycle. 2.2 Mobile ADCP Suspended Sediment Surveys Suspended sediment plumes were also characterized using the Workhorse model ADCP. In the field, RD Instruments WinRiver software was used to display plume acoustic signatures in real time and to record data. The ADCP operates by emitting acoustic pulses into the water column at set time intervals. Each group of pulses, referred to as an "ensemble, is vertically stratified into discrete, fixed-depth increments, or "bins." The number of bins and size of each bin is a configurable operation parameter of the instrument. In this study, 50 bins of 0.5-meter depth were used, for a maximum vertical profile range of 25 meters. After the instrument emits a pulse, the ADCP then "listens" for the return of any sound (i.e. backscatter) that has been reflected from particles in the 4
10 water column (in this case, a "particle" is any acoustic reflector, including sediment, plankton, fish, air bubbles, or many types of floating debris). Once the instrument receives the reflected signals, the WinRiver software can calculate the three-dimensional movement of particles in the water column and thus determine water velocity in each bin. When water samples are collected concurrently, suspended sediment concentration can normally be determined using additional software and analyses (see Section ADCP Calibration below). Similarly, navigation data (i.e. GPS positions) collected throughout the monitoring period by the dredge contractor were integrated during post-processing of the ADCP data to determine the distance of each transect segment from the dredge. To characterize plumes over a range of tidal conditions, ADCP backscatter data were collected during various stages of ebb and flood tides during the survey periods. It is important to note that the ADCP cannot simultaneously receive and emit an acoustic pulse. Thus, when emitting a pulse, the ADCP cannot obtain data from immediately in front of its transducers (in addition to the water above the immersion depth of the instrument itself). This blanking distance is a user-defined parameter with limitations imposed by the operating frequency of the ADCP. For the 1200-kHz ADCP used in this survey, the blanking distance is approximately 0.5 meters (i.e. one bin depth). In addition, acoustic echoes reflected from the seabed may interfere with the ADCP signal. The ADCP emits most of its acoustic energy in a very narrowly confined beam; however, a small amount of energy is emitted at angles far greater than that of the main lobe. These side lobes, despite their low power, can contaminate the echo from the main lobe, typically in the area directly above the seabed. The net effect of this side lobe interference is to show artificially high backscatter from the near-seabed areas. This effect is exacerbated in vessel-mounted surveys when the seabed elevation changes rapidly (e.g., during the transition from the shallows to the channel areas or vice-versa). In general, the side lobe distance above the seafloor is equal to approximately 6% of the water depth at that point. Consequently, backscatter data from the depth bin representing the seabed/water interface are not useful for estimation of TSS concentration Mobile ADCP Survey Design Prior to initiating the mobile plume surveys, circular transects using the ADCP were conducted around the actively operating dredge to help provide a post-processing 5
11 reference point for the dredge s location and to obtain a preliminary assessment of the location and acoustic signal of the plume. Subsequent ADCP transects were then conducted across the plume, generally oriented in a direction perpendicular to the channel and extending down-current until the plume s acoustic signatures could no longer be detected against background conditions. Background conditions on the days of the surveys were determined by conducting ambient transects up-current of the plume and outside the active dredging area. Individual transect length was generally determined by bathymetry at the site, but always with the objective of extending beyond the detectable boundaries of the plume. The number, and consequently the spacing, of cross-plume transects were maximized within each designated tidal phase in order to provide complete spatial coverage of the detectable plumes and optimal resolution of internal plume structure. Thus each set of transects produces a composite three-dimensional depiction of plume structure under prevailing tidal current conditions Mobile ADCP Data Presentation Results for the mobile ADCP plume transects are presented graphically in two ways: Vertical Profile Plots Vertical cross-section profiles representing individual transects are examined in detail for backscatter gradient structure of the plume at known, increasing distances from the source. Plan-View Plots Backscatter values are presented as composite horizontal slices through the plume signature at surface (0-2 meters), middle (2-4 meters), and bottom (4-6 meters) depth intervals. Because the TSS results from the water samples could not be used to convert ADCP backscatter to TSS in this study, an ambient backscatter cutoff value was chosen for the ADCP transects that most appropriately and clearly delineated the dredge plume from the background condition by removing any natural backscatter noise. For this study, the value of 96 db, representative a conservatively low acoustic backscatter level typical of coastal inshore environments, was used as the critical cutoff between ambient and plume conditions for all surveys. Thus, backscatter signatures above 96 db in intensity are herein considered above background and attributable to the dredge plume unless otherwise noted (e.g., clearly attributable to air entrainment, vessel prop wash, or from other sources of re-suspension such as tug and ship-induced plumes, or from ADCP sidelobe interference). 6
12 2.3 Design of Fixed Station Turbidity Surveys In addition to the mobile ADCP surveys, turbidity measurements were recorded at fixed locations and at various water depths using Campbell Scientific, Inc. s OBS-3A optical turbidity sensors (OBS). Typically, these sensors would be tethered to a taut line and anchored at predetermined depths using a fixed anchor and buoy array. These arrays would be left in position for the duration of a tidal cycle while the research vessel conducted additional survey operations in the area. However, current and weather conditions and the dredge s operational setup and schedule prohibited the safe deployment of the anchored arrays. Instead, OBS turbidity profiles were obtained from data recorded during water sample collection. Optical backscatter sensors project a beam of near-infrared light into the water, and measure the amount of light reflected back from suspended particles. The OBS units used in this survey were pre-calibrated by the manufacturer and programmed to measure turbidities in the 0-1,000 Nephelometric Turbidity Unit (NTU) range. The OBS units deployed during the fixed station survey were configured to output depth (meters), turbidity (NTU), temperature ( C), salinity (ppt), conductivity (µs/cm) and battery level (V). Readings were output once per second and saved directly to an onboard laptop computer. 2.4 Water Sample Collection During the far-field surveys, water samples were collected to measure TSS concentrations (mg/l) and turbidity (NTU) throughout the water column. The water samples were collected from the research vessel using a custom made pump sampler which consisted of a Rule model 2000 submersible impeller pump with ¾-inch polyester braid reinforced PVC tubing, to which a Campbell Scientific, Inc. OBS-3A optical backscatter sensor (OBS) was mounted. The OBS unit was configured to measure and record depth, temperature, salinity, and turbidity values at one second intervals. The OBS unit was connected via RS-232 serial link to an onboard computer which logged these data using HDR s proprietary Water Sample Collection Control software. This software is designed to time-stamp collections of TSS/Turbidity water samples with one second accuracy, and to easily cross-reference these samples with simultaneously logged OBS and ADCP data. In the in the standard survey design, the cross-referencing of data is used 7
13 in establishing the ADCP backscatter correlation to TSS concentrations during postprocessing. Water samples collected in the field were processed in the laboratory by Test America Laboratories, Inc. for optical turbidity (Method SM 2130-B) and for the gravimetric analysis of TSS concentration (Method SM 2540-D). These laboratory results are presented in Table 1, and presented graphically in Figures 14 and ADCP Calibration Sediments dredged during this survey were composed nearly entirely of sand. Because these sediments fall out of suspension more quickly than finer sediments, volumes of any plume containing high concentrations are extremely compact. Because of this, it was not possible to collect a sufficient number of water samples which adequately represented the full range of plume and ambient concentrations, and as a result a reliable conversion of acoustic backscatter data to estimated TSS concentrations using the Sediview method (Land and Bray 2000) could not be conducted for this survey. Instead, raw acoustic backscatter data were used in the analysis of dredge plume intensity and extent. 2.6 Sediment Sample Collection To determine the sediment characteristics of the survey area, a sample was collected from the sediment bed in the vicinity of the dredge using a ponar grab, on 27 January The sample was analyzed by Test America Laboratories, Inc. for sediment grain size distribution (ASTM D-422 Method), density (ASTM D-2937 Method) and Atterberg Limits (ASTM D-4318 Method). These laboratory results are presented in Table 5. 8
14 3.0 RESULTS 3.1 Hydrodynamic Survey To characterize hydrodynamic conditions within Jones Inlet, a hydrodynamic survey covering all areas surveyed in mobile ADCP plume surveys was conducted during an ebb tide on 16 January Transects were conducted approximately perpendicular to the long axis of the Jones Inlet channel. Additionally, hydrodynamic conditions during each mobile ADCP survey were also recorded to aid in the interpretation of plume dynamics, and place the corresponding TSS data in a hydrodynamic context. These results are included as part of the discussion of each mobile ADCP survey in Section below. The results of the ebb tide hydrodynamic survey are presented in Figure 2. This survey was conducted from approximately 1045 to 1315 hours on 16 January In the figure, the Direction of Travel arrow indicates the direction in which the research vessel progressed through the survey area while conducting transects. The area surveyed covered the entire width of Jones Inlet Channel, and extended from just south of the red 14 buoy to approximately 450 meters past the marker at the end of the channel. During this survey, depth-average current velocities within the area ranged from near 0 to approximately 1.2 m/s, with the highest velocities recorded in the narrowest portions of the channel. Current direction within the survey area was generally southwest, paralleling the channel. 3.2 Ambient Conditions A total of 18 ambient water samples were collected at various depths on 27 January and 11 February 2014, and later analyzed in the laboratory for TSS and turbidity. Ambient turbidity values ranged from 2.7 to 6.8 NTU, and the corresponding TSS concentrations ranged between 11 to 37 mg/l (Table 1). 9
15 3.3 Mobile ADCP Surveys January Ebb Tide A mobile ADCP plume characterization survey was conducted on 27 January 2014 during a flood tide from approximately 1117 to 1129 hours. The survey consisted of five down-current transects, conducted parallel to the channel (Figures 3a-e). A summary of each of the graphically represented transects is presented in Table 2. To examine the spatial extent of the plume, a series of plan-view layouts are given in Figures 4a through 4c. During this survey, the cutterhead dredge was located just to the northeast of the green 9 buoy. A tug tending the discharge pipe from the cutterhead operations was located approximately 230 meters to the southwest of the dredge. Five down-current transects were conducted to the southeast of the dredge and tug, and parallel to the channel. This transect orientation was used to allow the survey vessel to approach the cutterhead dredge more closely than perpendicular transects would have allowed in light of the dredge and tug positions described above. Transects T01 and T02 (Figures 3a and 3b) show the influence of tug prop wash throughout the water column. A plume from the cutterhead dredge operations is visible in Transect T03 (Figures 3c), extending 260 meters down-current. At this distance, the plume was detected in a swath approximately 150 meters wide. Because of water depths and the positions of the tug and dredge, the plume was transected at an angle oblique to its long axis. The width of the plume as measured perpendicular to its long axis may have been less than 150 meters. The plume was present throughout the water column, though the highest concentrations were detected closest to the surface. By 320 meters downcurrent from the source, the plume had dissipated to a lower intensity, and narrowed. By 400 meters down-current (Transect T05, Figure 3e), the plume from the cutterhead dredge had dissipated to near background conditions. Figure 5 presents the hydrodynamic conditions recorded during the 27 January ebb tide mobile ADCP survey. The area surveyed extended from between the green 9 and red 2 buoys and to the southwest approximately 760 meters, and included the central portion of the channel (between the navigation buoys). During this survey, depthaveraged current velocities within the area ranged from near 0 m/s to approximately 0.8 m/s. Currents within the survey area generally flowed southwest, parallel to the channel. In the western portion of the survey area, currents flowed more southeast, towards the middle of the channel. 10
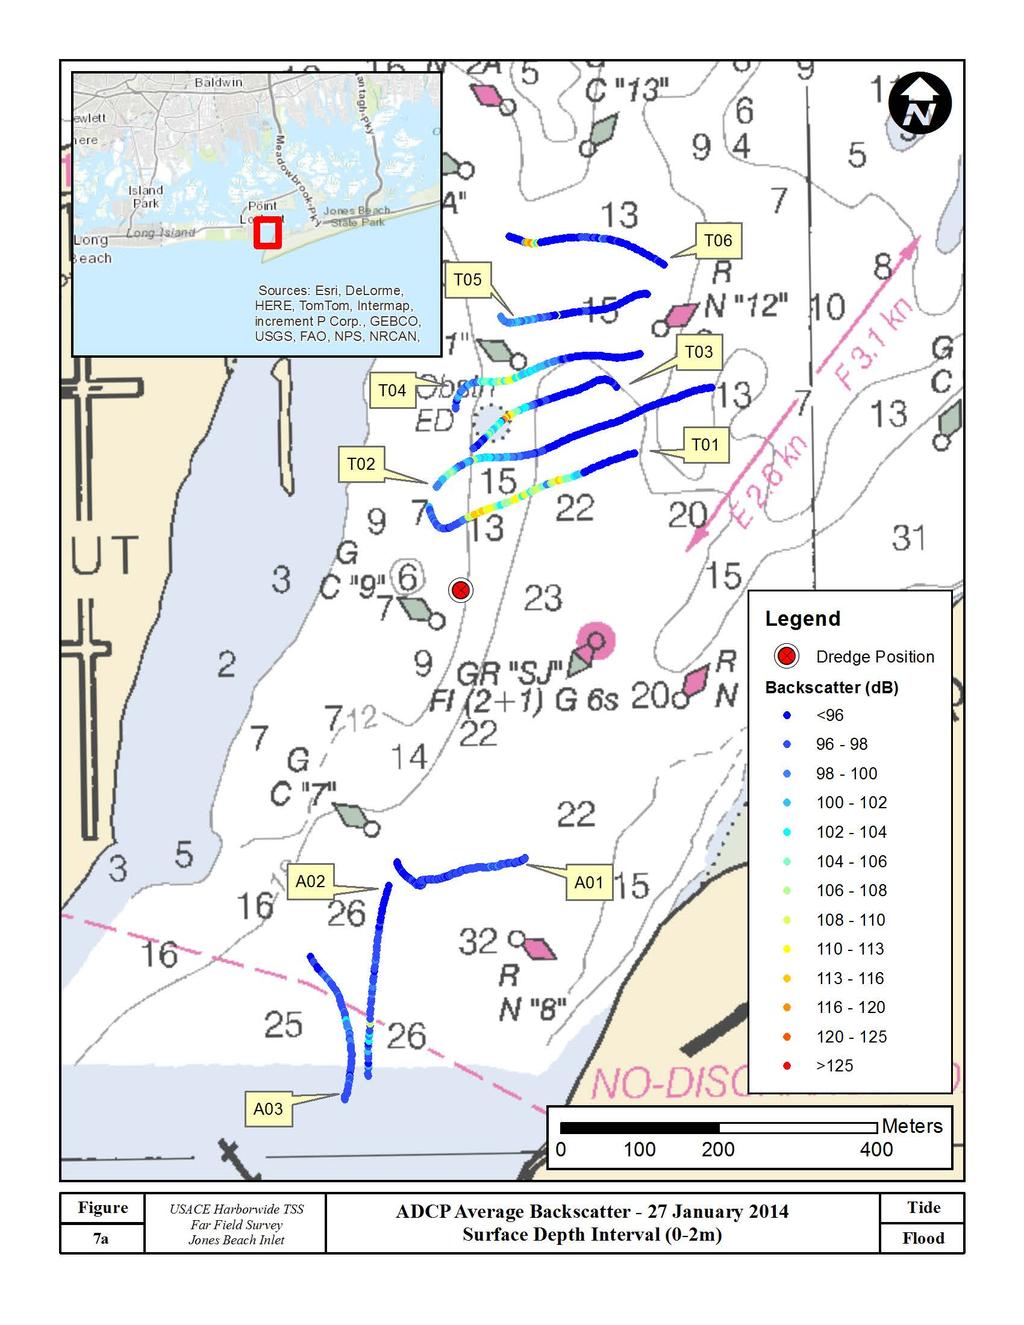
16 January 2014 Flood Tide A mobile ADCP plume characterization survey was conducted on 27 January during a flood tide from approximately 1211 to 1346 hours (Figures 6a-i). The survey consisted of three up-current transects (Figures 6a through 6c), and six down-current transects (Figures 6d through 6i). A summary of each of the graphically represented transects is presented in Table 3. To examine the spatial extent of the plume, a series of plan-view layouts is given in Figures 7a through 7c. During this survey, the cutterhead dredge was located just to the northeast of the green 9 buoy. Up-current transects were conducted to the south of the dredge, and down-current transects were conducted to the north. Up- and down-current transects were both oriented perpendicular to the channel. Up-current conditions presented in Transects A01 through A03 (Figures 6a through 6c) show background conditions (backscatter <96 db) throughout most of the water column, with a layer of slightly higher backscatter intensity present near the surface in all upcurrent transects. This signal may represent air bubbles due to surface chop rather than suspended sediment. Down-current Transects T01 through T06 (Figures 6d through 6i) show the spatial extent of the TSS plume associated with operations of the cutterhead dredge. As shown by ADCP-recorded backscatter, the plume reached its highest concentrations within 110 meters of the source (Transect T01). At this distance, the plume was approximately 150 meters wide. The plume was present throughout the water column, but the greatest backscatter levels were present in the top one-quarter to one-half of the water column. The dredge plume dissipated as distance from the dredge increased (Transects T02-T04), and was detectable at low backscatter intensities approximately 50 meters wide within 360 meters down-current of the dredge, although it still extended throughout the entire water column (T05). By 460 meters down-current (T06), conditions had returned to background. Vessel prop wash is visible in this transect, as noted on the figure. Figure 8 presents the hydrodynamic conditions recorded during the 27 January flood tide mobile ADCP survey. The area surveyed extended from the red 12 buoy to south of the green 7 buoy, and included only the central portion of the channel (between the navigation buoys). During this survey, depth-averaged current velocities within the area 11
17 ranged from near 0 m/s to approximately 0.8 m/s. Currents within the survey area generally flowed to the northeast, parallel to the channel. In the northern portion of the survey area, current direction turned towards the northwest, towards the channel north of Point Lookout February Flood Tide A mobile ADCP plume characterization survey was conducted on 11 February during a flood tide from approximately 1319 to 1511 hours (Figures 9a-9i). The survey consisted of three up-current transects (Figures 9a through 9c), and six down-current transects (Figures 9d through 9i). A summary of each of the graphically represented transects is presented in Table 4. To examine the spatial extent of the plume, a series of plan-view layouts are given in Figures 10a through 10c. During this survey, the cutterhead dredge was located approximately 75 meters northeast of the green 11 buoy. Up-current transects were conducted to the south of the dredge and down-current transects were conducted to the north, terminating near the green 1A buoy to the west where water depths dropped to below two meters and survey vessel access was limited for navigational safety reasons. Up- and down-current transects were oriented perpendicular to the channel. Up-current conditions presented in Transects A01 through A03 (Figures 9a through 9c) show background acoustic backscatter levels throughout the water column, with an intense vessel prop wash signal present near the surface, as noted on the figures. Down-current Transects T01 through T06 (Figures 9d through 9i) show the spatial extent of the plume associated with operations of the cutterhead dredge. Peak plume backscatter levels were observed within 70 meters down-current of the dredge (Transects T01-T02). The plume was detected at its widest (approximately 350 meters wide) within 20 meters down-current of the dredge (Transect T01). The dredge plume extended throughout the water column for its entire extent, but backscatter levels dissipated as distance from the source increased, remaining highest closer to the surface (Transects T03 T05). The plume was observed up to 180 meters down-current from the source, where it had a width of approximately 80 meters (Transect T06). Figure 11 presents the hydrodynamic conditions recorded during the 11 February flood tide mobile ADCP survey. The area surveyed was at the northern end of the Jones Inlet 12
18 channel, extending from the green 13 buoy approximately 550 meters south. During this survey, depth-averaged current velocities within the area ranged from near 0 m/s to approximately 0.7 m/s. Currents within the survey were somewhat variable, but overall flowed towards the northwest, especially in the northern portion of the area. 3.4 OBS Turbidity Surveys Two OBS turbidity surveys were conducted during two separate flood tides, on 27 January and 11 February The turbidity (NTU) and depth (meters) values recorded at one second intervals by the OBS unit during these deployments were plotted to show turbidity readings throughout the water column at up- and down-current locations January Flood Tide Turbidity data were recorded during the collection of water samples on 27 January 2014 during a flood tide. The collection array was deployed down-current from the cutterhead twice, and then deployed once up-current, for approximately ten minutes for each deployment. In Figure 12a turbidity values (NTU, solid lines), and OBS sensor depths (meters, dotted lines) were plotted for the up-current deployment, and in Figure 12b the data were plotted for both down-current deployments. Turbidity readings when the sensor was at a depth of less than 0.5 meters when being deployed and retrieved were excluded from the plots because of optical interference. Turbidities during the ambient, up-current OBS deployment remained relatively constant throughout the deployment, between approximately 9 and 12 NTU with the exception of several brief spikes of higher values (Figure 12a). These spikes occurred while the sensor was at near-bottom depths, and likely represented bottom impacts rather than ambient turbidity conditions. Turbidity readings from both down-current deployments show similar results, with overall turbidity values ranging between approximately 9 and 13 NTU, with several brief, unrepresentative spikes to higher values (Figure 12b). Note that the gap in the data between the approximately four and eight minute mark of the second down-current deployment resulted when the OBS unit was at the surface and being towed back into position by the boat. 13
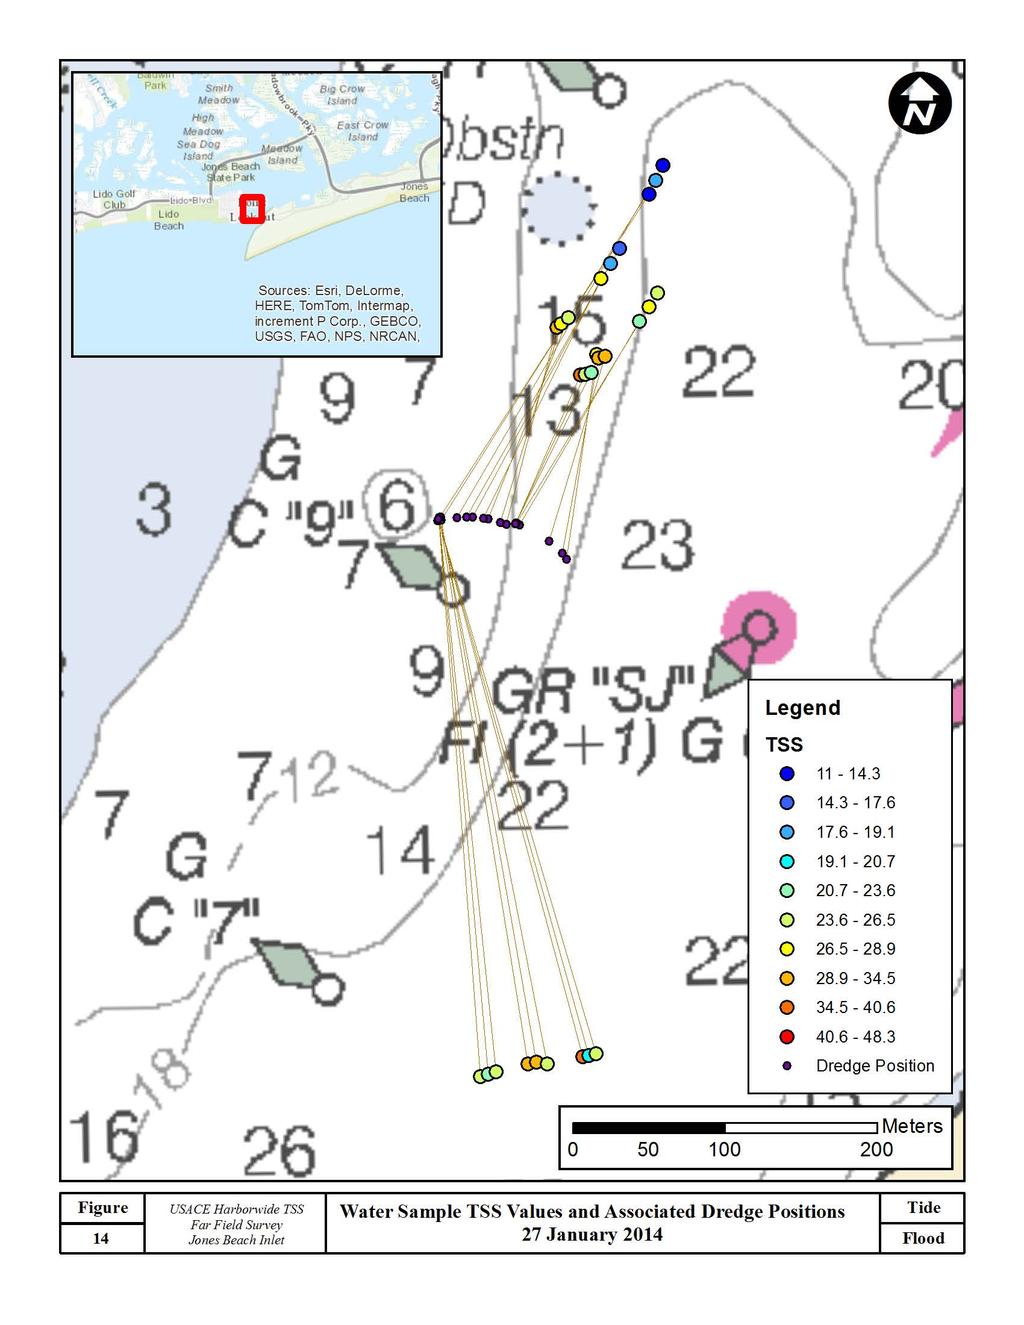
19 February Flood Tide Turbidities and OBS sensor depths recorded during the collection of water samples on 11 February 2014 flood tide are plotted in Figure 13a for the up-current deployment, and Figure 13b for two down-current deployments. Ambient turbidity readings remained between approximately 5 and 7 NTU throughout the up-current deployment, with only very brief (several seconds in duration) spikes to higher values during deployment and retrieval (Figure 13a). During both down-current deployments, turbidity readings also remained relatively constant, ranging between approximately 6 and 13 NTU, with very brief deployment artifact spikes (Figure 13b). 3.5 Laboratory Analysis of Water Samples A total of fifty-four water samples were collected in the project area during the Jones Inlet Far Field Study, in two sets of twenty-seven samples each on 27 January and 11 February 2014, both during flood tides. The laboratory results of turbidity and TSS concentration for these samples are presented in Table 1. TSS concentrations of the 54 water samples ranged from 11 to 48 mg/l and corresponding turbidity concentrations ranged from 3.0 to 7.0 NTU. As mentioned above, the lack of water samples representing a broad range of suspended sediment conditions precluded a calibration of raw ADCP backscatter data necessary to estimate TSS concentrations. In order to describe the dredge plume in terms of TSS concentrations, the gravimetric TSS result for an individual water sample was plotted at the sample location, in relation to the position of the cutterhead dredge at the time the sample was taken. Results of water samples collected on 27 January 2014 are presented in Figure 14, and those collected on 11 February are plotted in Figure 15. On 27 January, TSS concentrations were essentially equivalent at locations both up-current and approximately 120 to 270 meters down-current of the dredge position (Figure 14). However, for water samples taken on 11 February, all samples with TSS concentrations greater than approximately 20 mg/l were collected from approximately 40 to 110 meters down-current of the dredge. This pattern suggests a TSS plume with concentrations ranging from approximately 20 to 48 mg/l at these distances (Figure 15). 14
20 3.6 Sediment Sample A sediment sample was collected from the seabed in the dredging area of the Jones Inlet Far Field Study and analyzed for grain size distribution, density, and Atterberg Limits. Results of these analyses are presented in Table 5. The sediment sample collected during this survey was comprised almost entirely of sand (98.1%), along with 1% each of silt and clay. The sample contained no gravel. The in-place density of the sample was 1.44 g/cc. Atterberg Limits analysis, which determines the sediment sample s ability to absorb water and show properties of a plastic, found the in situ sediments to be non-plastic, typical of sands. The characteristics of this in situ sediment sample are very similar to those of cores taken at ten locations in the project area during a pre-dredging survey (Aqua Survey 2013). Sediments in these cores contained even smaller fine fractions, ranging from 0.0 to 0.3 percent silt and clay-sized particles. 15
21 4.0 DISCUSSION During the course of routine dredging operations, some sediment is re-suspended into the water column. Depending on the type of dredging equipment employed, the geotechnical properties of the sediment being dredged, the prevailing water currents, and other contributing factors, this suspended sediment forms a plume transported down-current from the source. Because suspended sediment plumes are dynamic rather than static phenomena and because they can vary in spatial extent over large areas in short periods of time, particularly when driven by tidal currents, characterizing plumes can present a difficult challenge. Data collected at arbitrarily determined points in time at fixed locations are inadequate to assess dredge plume structure. However, advanced acoustic technologies offer advantages in capturing data at appropriate spatial and temporal scales to allow more accurate interpretation of plume dynamics (Tubman & Corson 2000). Previous characterizations of dredging-induced plumes in New York/New Jersey Harbor largely focused on mechanical bucket dredging operations associated with deepening and maintenance of deep-draft vessel navigation channels. During coordination efforts with both state and Federal regulatory agencies a significant knowledge gap relevant to other common dredging practices in the area was identified as hydraulic cutterhead pipeline operations in shallow-draft channels. As part of USACE-NYD s Harbor-wide WQ/TSS Monitoring Program, a series of far-field WQ/TSS surveys was conducted between 16 January and 11 February 2014 in Jones Inlet on the south shore of Long Island, New York. The objective of these far-field surveys was to assess the spatial extent and temporal dynamics of suspended sediment plumes associated with cutterhead dredging of sediments within the navigation channel. Sediments in the contract area, as sampled in these surveys, were composed almost entirely of sand, with very small amounts of silt and clay. Coarse grain sediment particles or aggregates settle rapidly out of suspension, whereas fine grained sediments can remain in suspension for substantially longer durations depending on their state of disaggregation and the influence of cohesion between particles and flocculation in saline waters. Therefore, the results of the present study provide site-specific characterizations of plume dynamics that can be used to support better informed dredging project management decisions as they pertain to Jones Inlet or similar areas. 16
22 In this series of surveys, ADCP backscatter data indicated that ambient (background) suspended sediment concentrations in the survey area were generally low throughout the water column. In one survey (27 January flood tide), a naturally occurring layer of slightly higher suspended sediment concentrations was present near the surface, possibly representing air bubbles due to surface chop. Results of gravimetric TSS analysis of water samples indicated that ambient TSS concentrations ranged from 11 to 37 mg/l during the survey period. Suspended sediment plumes attributable to operations of the cutterhead dredge CR McCaskill were detected as ADCP backscatter. Using the intensity of acoustic backscatter as an index of TSS concentration, the areas of highest plume concentrations extended no more than 110 meters down-current from the source. In the zone immediately down-current from the dredge, the comparatively higher TSS concentrations extended throughout the water column, but were more intense and more widely dispersed in the upper portion of the water column. This observation is interesting in that sediment disturbance by a cutter occurs at the seabed/water interface and does not involve pulling upward and release of sediments in the manner of a mechanical bucket. However, this operation did involve a relatively large cutterhead (30-inch) working in relatively shallow water. Applying a relatively high rate of cutter rotations per minute to cut the coarse sand bed could have resulted in throwing sediment into the upper water column, resulting in the observed plume pattern. The dredge plume had a maximum width of approximately 350 meters at a distance of 20 meters down-current from the source. Width of the plume in the case of a cutterhead includes the lateral distance swept by the cutter as well as the influence of currents dispersing the plume. The plume narrowed as it progressed further from the source, to a width of approximately meters before becoming undetectable. The bottom-oriented component of the dredge plume was detected with an acoustic signature above ambient at a maximum distance of 360 meters down-current from the source. Turbidities recorded both up- and down-current of the dredging operation were very similar, indicating that the dredge plume was not prominent at beyond distances ranging from approximately 40 to 270 meters down-current. However, water samples collected 40 to 110 meters down-current during one of these sensor deployments (11 February 2014 during a flood tide), had somewhat higher TSS concentrations than corresponding up-current results, but not exceeding 48 mg/l. 17
23 The Jones Inlet contract area differs in several important aspects from those surveyed previously under USACE-NYD s Harbor-wide WQ/TSS Monitoring Program in particular those surveys of a cutterhead dredge operating in the deep water channel of the Kill Van Kull (USACE 2012 and USACE 2013b) in which measured plumes typically peaked at concentrations between mg/l and were generally confined to the lower third of the water column. Jones Inlet by comparison represents a somewhat typical coastal inlet in which a relatively shallow connection is made between oceanic waters and an estuarine embayment. The entrance channel sediments consist predominately of coarse sands, and is subject to moderate tidal current velocities (as opposed to locations in the NY/NJ Harbor with predominantly fine sediments and comparatively slower tidal current velocities). Results of the present study suggest that dredge plumes produced by hydraulic cutterhead dredges in coastal inlets similar to Jones Inlet will have very small spatial extents and be characterized by relatively low TSS concentrations. Multiple factors contribute to the observed plume dynamics including the existing hydrodynamic conditions at the time of the surveys which ranged between approximately 0 and 0.8 m/s during these surveys. Even in the presence of low to moderate tidal current velocities, however, resuspended sand particles descend rapidly back to the seabed. With the use of a hydraulic cutterhead dredge, the actual sediment disturbance occurs at the seabed and most of the disturbed sediment is removed as a sediment/water slurry into the suction intakes. This entrainment of sediment/water slurry does not pull sediment upward and release particles into the upper water column as does a mechanical bucket. As was observed at Jones Inlet, dredging by a relatively large capacity cutterhead dredge such as the CR McCaskill, is still subject to frequent interruptions caused by severe winter weather conditions. This factor also contributes to the relatively small volume of sediment comprising a plume at any given time. The very high sand fraction settles out of the plume very quickly, leaving a small mass of fine particles to be carried down-current as a diffuse plume. Production rates of the CR McCaskill averaged 1,702 cubic yards per hour and peaked at 2,166 cubic yards per hour. Estimates of sediment resuspension loss rates for hydraulic dredges range as high as 1.0 percent of the volume of sediment pumped (Hayes et al. 2000, Anchor Environmental 2003), which would conservatively yield a total of 6,655 cubic yards of sediment lost to the water column during the course of the Jones Inlet project. Of this, as much as 2.0 percent, or approximately cubic yards, would consist of fine sediment particles based on the grain-size distribution of the in situ sediment sample (Table 5). Assuming a uniform distribution of fines within the dredged 18
24 sediment, as much as 0.34 cubic yards of fine sediment would be resuspended per hour of active dredging, which equates to an approximate loss rate of 0.34 kg/sec. This is a very low loss rate as compared to those generated by mechanical dredges operating in predominantly fine sediments. Thus the observed spatial scales and plume structures observed in the Jones Inlet surveys described herein are entirely consistent with the known characteristics of hydraulic dredging practices in coarse sediments. The results of this study clearly demonstrate the distinct differences in plume dynamics of hydraulic cutterhead operations in shallow versus deep draft channels, and in coarse sand versus higher silt content sediments. In contrast to the latter case, plumes in Jones Inlet were smaller and comprised of low TSS concentrations. In summary, dredging as conducted at Jones Inlet does not represent a significant source of sediment resuspension that can transport appreciable quantities of either coarse or fine sediments beyond very short distances from the dredge. The relatively small, diffuse, compact plumes pose very little risk of dispersing fine sediments to habitats outside of existing navigation channel boundaries. 19
25 5.0 LITERATURE CITED Anchor Environmental Literature review of effects of resuspended sediments due to dredging operations. Contract report prepared by Anchor Environmental, Irvine, CA for the Los Angeles Contaminated Sediments Task Force, Los Angeles, CA. Aqua Surveys, Inc Technical report on the sampling and grain size analysis of sediment from Jones Inlet, Long Island, New York. Contract No. W912DS-12-D with the U.S. Army Corps of Engineers New York District. 11pp. plus appendices. Hayes, D. F., T. R. Crockett, T. J. Ward, and D. Averett Sediment resuspension during cutterhead dredging operations. Journal of Waterway, Port, Coastal, and Ocean Engineering 126(3): Land, J.M. and R.N. Bray Acoustic measurement of suspended solids for monitoring of dredging and dredged material disposal. Journal of Dredging Engineering 2 (3):1-17. Puckette, T.P Evaluation of dredged material plumes: Physical monitoring techniques. DOER Technical Notes Collection (TN-DOER-E5). U.S. Army Engineer Research and Development Center, Vicksburg, MS. Reine, K.J., D.G. Clarke and C. Dickerson Suspended sediment plumes associated with maintenance dredging in the Providence River, Rhode Island. Report prepared by the U.S. Army Engineer Research and Development Center for the U.S. Army Engineer New England District. Concord, MA, 34pp. Tubman, M.W. and W.D. Corson Acoustic monitoring of dredging-related suspended-sediment plumes. DOER Technical Notes Collection (ERDC TN- DOER-E7). U.S. Army Engineer Research and Development Center, Vicksburg, MS. United States Army Corps of Engineers (USACE) New York District (NYD) Suspended Sediment Plumes Associated with Navigation Dredging in the Arthur Kill Waterway, New Jersey. Appendix 3-1 of the Final Environmental 20
26 Assessment: Effects of the NY/NJ Harbor Deepening Project on the Remedial Investigation/Feasibility Study of the Newark Bay Study Area. June United States Army Corps of Engineers (USACE) New York District (NYD) Far-field Surveys of Suspended Sediment Plumes Associated with Harbor Deepening Dredging in Newark Bay. September United States Army Corps of Engineers (USACE) New York District (NYD) Far-field Surveys of Suspended Sediment Plumes Associated with Harbor Deepening Dredging in Newark Bay. S-NB-1 Contract Area. S-NB-1 Contract Area Survey #2. June United States Army Corps of Engineers (USACE) New York District (NYD) Far Field Surveys of Suspended Sediment Plumes Associated with Harbor Deepening Dredging in Newark Bay. S-E-1 Contract Area. S-NB-1 Contract Area (Port Elizabeth Channel Survey #1 & #2). February United States Army Corps of Engineers (USACE) New York District (NYD) Far Field Surveys of Suspended Sediment Plumes Associated with Harbor Deepening Dredging in Upper Bay. S-AN-2 Contract Area (Anchorage Channel). June United States Army Corps of Engineers (USACE) New York District (NYD) Far Field Surveys of Suspended Sediment Plumes Associated with Harbor Deepening Dredging in Upper Bay. S-KVK-1 Contract Area (Kill Van Kull). April United States Army Corps of Engineers (USACE) New York District (NYD). 2013a. Far Field Surveys of Suspended Sediment Plumes Associated with Harbor Deepening Dredging in Newark Bay. S-NB-2/S-AK-1 Contract Area (South Elizabeth Channel) Surveys #1 & #2. January United States Army Corps of Engineers (USACE) New York District (NYD). 2013b. Far Field Surveys of Suspended Sediment Plumes Associated with Harbor Deepening Dredging in Upper Bay. S-KVK-1 Contract Area (Kill Van Kull). January
27 United States Army Corps of Engineers (USACE) New York District (NYD). 2013c. Far Field Surveys of Suspended Sediment Plumes Associated with Harbor Deepening Dredging in Arthur Kill. S-AK-2 Contract Area. August Wilber, D.A. and D.G. Clarke Biological effects of suspended sediments: A review of suspended sediment impacts on fish and shellfish with relation to dredging activities in estuaries. North American Journal of Fisheries Management 21:
28 Table 1. Laboratory Results of Water Samples - Jones Inlet Far Field TSS Survey (27 January - 11 February 2013) Sample Sample Date Sample Time Location Sample Depth (m) Total Suspended Solids Turbidity (mg/l) (NTU) 1 1/27/ :06:03 Plume /27/ :06:18 Plume /27/ :06:33 Plume /27/ :07:33 Plume /27/ :07:51 Plume /27/ :08:08 Plume /27/ :09:08 Plume /27/ :09:24 Plume /27/ :09:40 Plume /27/ :22:11 Plume /27/ :22:26 Plume /27/ :22:40 Plume /27/ :23:28 Plume /27/ :23:43 Plume /27/ :23:57 Plume /27/ :28:35 Plume /27/ :28:51 Plume /27/ :29:08 Plume /27/ :53:03 Ambient /27/ :53:22 Ambient /27/ :53:41 Ambient /27/ :54:58 Ambient /27/ :55:17 Ambient /27/ :55:36 Ambient /27/ :57:13 Ambient /27/ :57:29 Ambient /27/ :57:46 Ambient /11/ :42:22 Plume /11/ :42:45 Plume /11/ :43:06 Plume /11/ :43:45 Plume /11/ :44:04 Plume /11/ :44:24 Plume /11/ :44:57 Plume N/A /11/ :45:17 Plume N/A /11/ :45:37 Plume N/A /11/ :57:18 Plume /11/ :57:41 Plume /11/ :58:01 Plume /11/ :58:37 Plume /11/ :59:01 Plume /11/ :59:29 Plume /11/ :00:20 Plume N/A /11/ :00:40 Plume N/A /11/ :01:00 Plume N/A
29 Table 1. Laboratory Results of Water Samples - Jones Inlet Far Field TSS Survey (27 January - 11 February 2013) Sample Sample Date Sample Time Location Sample Depth (m) Total Suspended Solids (mg/l) Turbidity (NTU) 46 2/11/ :17:25 Ambient /11/ :17:47 Ambient /11/ :18:10 Ambient /11/ :18:47 Ambient /11/ :19:07 Ambient /11/ :19:29 Ambient /11/ :20:20 Ambient /11/ :20:40 Ambient /11/ :21:03 Ambient N/A = Sample depth not available
30 Table January 2014 Far Field Ebb Tide Survey - Transect Summary Table Transect Figure Number Number Time Transect Length (m) Distance From Dredge (m) Plume Description Additional Field Remarks T01 3a 11:17: Parallel to pipe; tug wash influence Tug propwash clearly visible T02 3b 11:48: Semi circ around whole setup; possible plume T03 3c 11:54:58 Dredge plume throughout water column, strongest near surface Further, through plume at oblique angle T04 3d 11:59: Dredge plume begins to dissipate T05 3e 12:04: Return to near background conditions
31 Table January Far Field Flood Tide Survey - Transect Summary Table Transect Number Figure Number Time Transect Length (m) Distance From Dredge (m) Plume Description Additional Field Remarks A01 6a 13:48: Background conditions; backscatter at A02 6b 13:46: surface possibly due to air bubbles A03 6c 13:44: Facing South due to weather/seas T01 6d 12:15: Dredge plume detected at highest concentrations, throughout water column Closer to dredge T02 6e 12:11: Dredge plume dissipates with distance Start of Flood; plume on North T03 6f 12:17: Very shallow water just NW of transect from source, remains throughout water T04 6g 12:20: column T05 6h 12:23: Shallow shoal just to the W T06 6i 12:25: Return to background conditions Propwash
32 Table February 2014 Far Field Flood Tide Survey - Transect Summary Table Transect Number Figure Number Time Transect Length (m) Distance From Dredge (m) Plume Description Additional Field Remarks A01 9a 15:06: Heavy propwash against background A02 9b 15:08: conditions Propwash from other survey vessel A03 9c 15:11: T01 9d 13:19: Peak dredge plume signal, strongest T02 9e 13:55: near surface, throughout water column T03 9f 13:23: Plume dissipates with distance from Moving anchors at end T04 9g 13:51: source, remains throuhgout water T05 9h 13:47: column, strongest at surface T06 9i 13:58:
33 Table 5: Jones Inlet Far Field WQ/TSS Survey Sediment Collection and Analysis Summary Table Grain Size Distribution 1 Bulk Density 2 Atterberg Limits 3 Time Area Date Sampled Sampled Gravel Sand Silt Clay In Place Density (%) (%) (%) (%) g/cc Dredge Field 1/27/ : NP 1 ASTM D-422 Method 2 ASTM D-2937 Method 3 ASTM D-4318 Method NP = Non-plastic Liquid Limit Plastic Limit Plasticity Index

34

35
36 a) Transect T01 - Downcurrent 200m* Backscatter (db) b) Transect T02 - Downcurrent 230m* 0 Depth (m) c) Transect T03 - Downcurrent 260m* FIGURE 3a-c USACE Harborwide TSS Far Field Survey Jones Inlet Distance (m) Vertical Profiles of ADCP Average Backscatter (db) 27 January 2014 *Approximate distance from source TIDE Ebb
37 d) Transect T04 - Downcurrent 320m* Backscatter (db) e) Transect T05 - Downcurrent 400m* 0 Depth (m) *Approximate distance from source FIGURE 3d-e USACE Harborwide TSS Far Field Survey Jones Inlet Vertical Profiles of ADCP Average Backscatter (db) 27 January 2014 TIDE Ebb
38

39
40

41
42 a) Transect A01 - Upcurrent 360m* Backscatter (db) b) Transect A02 - Upcurrent 400m* 0 Depth (m) c) Transect A03 - Upcurrent 530m* FIGURE 6a-c USACE Harborwide TSS Far Field Survey Jones Inlet Distance (m) Vertical Profiles of ADCP Average Backscatter (db) 27 January 2014 *Approximate distance from source TIDE Flood
43 d) Transect T01 - Downcurrent 110m* Backscatter (db) e) Transect T02 - Downcurrent 180m* 0 Depth (m) f) Transect T03 - Downcurrent 240m* FIGURE 6d-f USACE Harborwide TSS Far Field Survey Jones Inlet Distance (m) Vertical Profiles of ADCP Average Backscatter (db) 27 January 2014 *Approximate distance from source TIDE Flood
44 g) Transect T04 - Downcurrent 290m* Backscatter (db) h) Transect T05 - Downcurrent 360m* 0 Depth (m) i) Transect T06 - Downcurrent 460m* FIGURE 6g-i USACE Harborwide TSS Far Field Survey Jones Inlet Distance (m) Vertical Profiles of ADCP Average Backscatter (db) 27 January 2014 *Approximate distance from source TIDE Flood
45
46
47

48
49 a) Transect A01 - Upcurrent 220m* Backscatter (db) b) Transect A02 - Upcurrent 230m* 0 Depth (m) c) Transect A03 - Upcurrent 260m* FIGURE 9a-c USACE Harborwide TSS Far Field Survey Jones Inlet Distance (m) Vertical Profiles of ADCP Average Backscatter (db) 11 February 2014 *Approximate distance from source TIDE Flood
50 d) Transect T01 - Downcurrent 20m* Backscatter (db) e) Transect T02 - Downcurrent 70m* 0 Depth (m) f) Transect T03 - Downcurrent 125m* FIGURE 9d-f USACE Harborwide TSS Far Field Survey Jones Inlet Distance (m) Vertical Profiles of ADCP Average Backscatter (db) 11 February 2014 *Approximate distance from source TIDE Flood
51 g) Transect T04 - Downcurrent 150m* Backscatter (db) h) Transect T05 - Downcurrent 150m* 0 Depth (m) i) Transect T06 - Downcurrent 180m* FIGURE 9g-i USACE Harborwide TSS Far Field Survey Jones Inlet Distance (m) Vertical Profiles of ADCP Average Backscatter (db) 11 February 2014 *Approximate distance from source TIDE Flood
52

53
54

55
56 a) Upcurrent from Dredge 1000 Upcurrent NTU Upcurrent Depth 6 5 Turbidity (NTU) Depth (m) 1 0:00 0:01 0:02 0:03 0:04 0:05 0:06 0:08 0:09 0:10 Elapsed Time (minutes) 0 b) Downcurrent from Dredge 1000 Downcurrent NTU Deployment 1 Downcurrent NTU Deployment 2 Downcurrent Depth Deployment 1 Downcurrent Depth Deployment Turbidity (NTU) Depth (m) :00 0:01 0:02 0:03 0:04 0:05 0:06 0:08 0:09 0:10 Elapsed Time (minutes) Figure 12 USACE Harborwide TSS Far Field Survey Jones Beach Inlet OBS Turbidities a) Upcurrent and b) Downcurrent of Dredge 27 January 2014 TSS Survey Tide Flood
57 a) Upcurrent from Dredge 1000 Upcurrent NTU Upcurrent Depth 6 5 Turbidity (NTU) Depth (m) 1 0:00 0:01 0:02 0:03 0:04 0:05 0:06 Elapsed Time (minutes) 0 b) Downcurrent from Dredge 1000 Downcurrent NTU Deployment 1 Downcurrent NTU Deployment 2 Downcurrent Depth Deployment 1 Downcurrent Depth Deployment Turbidity (NTU) Depth (m) :00 0:01 0:02 0:03 0:04 0:05 0:06 Elapsed Time (minutes) Figure 13 USACE Harborwide TSS Far Field Survey Jones Beach Inlet OBS Turbidities a) Upcurrent and b) Downcurrent of Dredge 11 February 2014 TSS Survey Tide Flood
58

59
TECHNICAL MEMO: FAR-FIELD SURVEYS OF SUSPENDED SEDIMENT PLUMES ASSOCIATED WITH HARBOR DEEPENING DREDGING IN ARTHUR KILL. S-AK-2 Contract Area
 TECHNICAL MEMO: FAR-FIELD SURVEYS OF SUSPENDED SEDIMENT PLUMES ASSOCIATED WITH HARBOR DEEPENING DREDGING IN ARTHUR KILL S-AK-2 Contract Area Prepared for U.S. Army Corps of Engineers - New York District
SUSPENDED SEDIMENT PLUMES ASSOCIATED WITH MECHANICAL DREDGING AT THE PORT OF OAKLAND, CALIFORNIA
 SUSPENDED SEDIMENT PLUMES ASSOCIATED WITH MECHANICAL DREDGING AT THE PORT OF OAKLAND, CALIFORNIA D. Clarke 1, A. Martin 2, C. Dickerson 3 and D. Moore 2 ABSTRACT Suspended sediment plumes associated with
Sediment Resuspension by Dredges: Defining the Issues
 Sediment Resuspension by Dredges: Defining the Issues Doug Clarke Environmental Laboratory U.S. Army Corps of Engineers Engineer Research and Development Center Dredge types Definition Related processes
SUSPENDED SEDIMENT PLUMES ASSOCIATED WITH KNOCKDOWN OPERATIONS AT THE PORT OF REDWOOD CITY, CALIFORNIA
 SUSPENDED SEDIMENT PLUMES ASSOCIATED WITH KNOCKDOWN OPERATIONS AT THE PORT OF REDWOOD CITY, CALIFORNIA D. Clarke 1, A. Martin 2, C. Dickerson 3, K. Reine 1, and D. Moore 2 ABSTRACT Re-suspension of sediments
Appendix G.18 Hatch Report Pacific NorthWest LNG Lelu Island LNG Potential Impacts of the Marine Structures on the Hydrodynamics and Sedimentation
 Appendix G.18 Hatch Report Pacific NorthWest LNG Lelu Island LNG Potential Impacts of the Marine Structures on the Hydrodynamics and Sedimentation Patterns Project Memo H345670 To: Capt. David Kyle From:
Mound Study Project Cape Fear, North Carolina Report Summary VIMS Reports: CHSD to CHSD EHI Project No
 Mound Study Project Cape Fear, North Carolina Report Summary VIMS Reports: CHSD-2003-02 to CHSD-2003-06 EHI Project No. 6000.21 February 2003 Final VIMS Report CHSD-2003-01 Prepared for Evans-Hamilton,
PTM: A Lagrangian Particle Tracking Model. Joseph Gailani
 PTM: A Lagrangian Particle Tracking Model Joseph Gailani Joe.Z.Gailani@usace.army.mil OUTLINE Motivation for sediment/constituent modeling system Objectives of modeling system Description of PTM PTM Example
Appendix G.19 Hatch Report Pacific NorthWest LNG Lelu Island LNG Maintenance Dredging at the Materials Offloading Facility
 Appendix G.19 Hatch Report Pacific NorthWest LNG Lelu Island LNG Maintenance Dredging at the Materials Offloading Facility Project Memo H345670 To: Capt. David Kyle From: O. Sayao/L. Absalonsen December
Appendix I. Dredged Volume Estimates. Draft Contractor Document: Subject to Continuing Agency Review
 Appendix I Dredged Volume Estimates Draft Contractor Document: Subject to Continuing Agency Review Interoffice Correspondence Date: April 6, 2007 To: L. Bossi (WHI) Copy: S. Thompson (WHI), B. Fidler (NNJ)
APPENDIX 4 ASSESSMENT OF SHIP-INDUCED SUSPENDED SEDIMENT PLUMES IN NEWARK BAY, NEW JERSEY
 APPENDIX 4 ASSESSMENT OF SHIP-INDUCED SUSPENDED SEDIMENT PLUMES IN NEWARK BAY, NEW JERSEY U.S. ARMY CORPS OF ENGINEERS NEW YORK DISTRICT TABLE OF CONTENTS 1 INTRODUCTION... 1 1.1 PURPOSE... 1 1.2 BACKGROUND...
Appendix O. Sediment Transport Modelling Technical Memorandum
 Appendix O Sediment Transport Modelling Technical Memorandum w w w. b a i r d. c o m Baird o c e a n s engineering l a k e s design r i v e r s science w a t e r s h e d s construction Final Report Don
SEDIMENT TRANSPORT IN RIVER MOUTH ESTUARY
 SEDIMENT TRANSPORT IN RIVER MOUTH ESTUARY Katsuhide YOKOYAMA, Dr.Eng. dredge Assistant Professor Department of Civil Engineering Tokyo Metropolitan University 1-1 Minami-Osawa Osawa, Hachioji,, Tokyo,
Redwood City Harbor, California, Navigation Improvement Feasibility Study. Appendix D. Geotechnical Engineering. DRAFT April 2015
 1 Redwood City Harbor, California, Navigation Improvement Feasibility Study Appendix D Geotechnical Engineering DRAFT April 2015 2 Contents 1 Purposes of Report... 3 2 Background... 3 3 References and
This file is part of the following reference: Access to this file is available from:
 This file is part of the following reference: Page, Geoff () Mass Transport Evaluation using consolidated VHF Radar and Acoustic Doppler Current Profiler data. Masters (Research) thesis, James Cook University.
Modeling of Dredging-Induced Sediment Resuspension: Remaining Questions and Progress Toward Answers
 Modeling of Dredging-Induced Sediment Resuspension: Remaining Questions and Progress Toward Answers Thomas Borrowman Douglas Clarke Tahirih Lackey US Army Corps of Engineers Research and Development Center,
B-1. Attachment B-1. Evaluation of AdH Model Simplifications in Conowingo Reservoir Sediment Transport Modeling
 Attachment B-1 Evaluation of AdH Model Simplifications in Conowingo Reservoir Sediment Transport Modeling 1 October 2012 Lower Susquehanna River Watershed Assessment Evaluation of AdH Model Simplifications
Changes in bottom morphology of Long Island Sound near Mount Misery Shoal as observed through Repeated Multibeam Surveys
 Changes in bottom morphology of Long Island Sound near Mount Misery Shoal as observed through Repeated Multibeam Surveys Laurie A. Zaleski Laurie.Zaleski@msrc.sunysb.edu Roger D. Flood rflood@notes.cc.sunysb.edu
Anderson-Ketron PSDDA Disposal Site Fate and Transport Modeling
 Pierce County Washington Anderson-Ketron PSDDA Disposal Site Fate and Transport Modeling Design Memorandum September 2014 Table of Contents 1 Introduction... 3 1.1 Purpose and Scope... 3 1.2 Project Description:
SAVANNAH HARBOR EXPANSION BANK EROSION STUDY UPDATE
 CESAS-EN-GS SAVANNAH HARBOR EXPANSION BANK EROSION STUDY UPDATE GEOTECHNICAL AND HTRW BRANCH SOILS SECTION CITY FRONT, BIGHT SECTION, FORT PULASKI & NORTH TYBEE ISLAND GEORGIA 23 June 2011 CESAW-TS-EG
HIGH RESOLUTION SEDIMENT DYNAMICS IN SALT-WEDGE ESTUARIES
 HIGH RESOLUTION SEDIMENT DYNAMICS IN SALT-WEDGE ESTUARIES Philip Orton, Dept. of Environmental Science and Engineering, Oregon Graduate Institute Douglas Wilson, Dept. of Environmental Science and Engineering,
Summary Results from Horizontal ADCP tests in the Indiana Harbor Canal and the White River
 Summary Results from Horizontal ADCP tests in the Indiana Harbor Canal and the White River This report summarizes results of tests of horizontally deployed ADCPs in the Indiana Harbor Canal and the White
Disposal Area Monitoring System DAMOS
 Disposal Plume Tracking and Assessment at the Rhode Island Sound Disposal Site Summer 2004 Disposal Area Monitoring System DAMOS Rhode Island Brenton Point Point Judith Contribution 167 October 2005 Block
Changes in Geomorphology and Backscatter Patterns in Mount Misery Shoal, Long Island Sound as Revealed through Multiple Multibeam Surveys
 Changes in Geomorphology and Backscatter Patterns in Mount Misery Shoal, Long Island Sound as Revealed through Multiple Multibeam Surveys Laurie A. Zaleski Laurie.Zaleski@msrc.sunysb.edu, Roger D. Flood
MORPHODYNAMIC PROCESSES IN ESTUARIES COMPARISON OF MARINE AND LIMNIC TIDAL FLATS
 MORPHODYNAMIC PROCESSES IN ESTUARIES COMPARISON OF MARINE AND LIMNIC TIDAL FLATS Thorsten Albers 1, Dagmar Much 2, Nino Ohle 2, Nicole von Lieberman 1, Eva Falke 1 Tidal flat areas in estuaries are affected
Predicting the Fate of Sediment Suspended Due to Dredging and Placement
 Predicting the Fate of Sediment Suspended Due to Dredging and Placement Tahirih Lackey and Thomas Borrowman US Army ERDC, Vicksburg, MS Tahirih.C.Lackey@erdc.usace.army.mil Thomas.D.Borrowman@erdc.usace.army.mil
Monitoring of Suspended Sediment Plume Formed During Oyster Shell Dredging in the James River, Virginia, August 2001
 Monitoring of Suspended Sediment Plume ormed uring Oyster Shell redging in the James River, Virginia, ugust 21 inal Report Prepared for the Virginia Marine Resources ommission by arl T. riedrichs and Grace
IN SITU SPECIFIC GRAVITY VS GRAIN SIZE: A BETTER METHOD TO ESTIMATE NEW WORK DREDGING PRODUCTION
 IN SITU SPECIFIC GRAVITY VS GRAIN SIZE: A BETTER METHOD TO ESTIMATE NEW WORK DREDGING PRODUCTION Nancy Case O Bourke, PE 1, Gregory L. Hartman, PE 2 and Paul Fuglevand, PE 3 ABSTRACT In-situ specific gravity
Performance of the Nortek Aquadopp Z-Cell Profiler on a NOAA Surface Buoy
 Performance of the Nortek Aquadopp Z-Cell Profiler on a NOAA Surface Buoy Eric Siegel NortekUSA Annapolis, USA Rodney Riley & Karen Grissom NOAA National Data Buoy Center Stennis Space Center, USA Abstract-Observations
June 2018 Sediments and Dredging at GBR Ports
 June 2018 Sediments and Dredging at GBR Ports Reef 2050 Long Term Sustainability Plan The Great Barrier Reef is over 2000 km long and covers an area of approximately 350,000 square kilometres. It is a
PRESENTATION TITLE. Regional Sediment Management Application of a Coastal Model at the St. Johns River Entrance BUILDING STRONG
 PRESENTATION TITLE Regional Sediment Management Application of a Coastal Model at the St. Johns River Entrance Steven Bratos Senior Coastal Engineer U.S. Army Corps of Engineers Jacksonville District February
Lower Susquehanna River Integrated Sediment & Nutrient Monitoring Program
 Lower Susquehanna River Integrated Sediment & Nutrient Monitoring Program Presented at the Chesapeake Bay Program Scientific and Technical Advisory Committee (STAC) Workshop January 13, 2016 Background
MONITORING SUSPENDED SEDIMENT PLUME FORMED DURING DREDGING USING ADCP, OBS, AND BOTTLE SAMPLES
 MONITORING SUSPENDED SEDIMENT PLUME FORMED DURING DREDGING USING ADCP, OBS, AND BOTTLE SAMPLES Grace M. Battisto 1 and Carl T. Friedrichs 2 Abstract: In this study three independent measures of suspended
MEMORANDUM. Scott Pickard, CELRB-TD-EH Michael Asquith, CELRB-PM-PM. From: Paul R. Schroeder, Ph.D., PE Earl Hayter, Ph.D. Date: 14 March 2016
 DEPARTMENT OF THE ARMY ENGINEER RESEARCH AND DEVELOPMENT CENTER, CORPS OF ENGINEERS ENVIRONMENTAL LABORATORY WATERWAYS EXPERIMENT STATION, 3909 HALLS FERRY ROAD VICKSBURG, MISSISSIPPI 39180-6199 29 November
Particle Tracking Model Data Analysis Tools Part 2: Capabilities in SMS
 ERDC TN-DOER-D16 Particle Tracking Model Data Analysis Tools Part 2: Capabilities in SMS by Zeki Demirbilek, Tahirih Lackey, and Alan K. Zundel PURPOSE: A number of new analysis methods and tools have
Laboratory Feasibility Study Concerning the Use of the SediMeter to Detect Fine-Scale ( 1 mm) Sedimentation Resulting from Dredging Operations
 Sedimentation Resulting from Dredging Operations") Laboratory Feasibility Study Concerning the Use of the SediMeter to Detect Fine-Scale ( 1 mm) Sedimentation Resulting from Dredging Operations by David W. Perkey and Heidi M. Wadman INTRODUCTION: The United
Laboratory Feasibility Study Concerning the Use of the SediMeter to Detect Fine-Scale ( 1 mm) Sedimentation Resulting from Dredging Operations by David W. Perkey and Heidi M. Wadman INTRODUCTION: The United
Annual transport rates at two locations on the fore-slope.
 Sediment Transport by Currents Fore-slope Sediment transport rates and sediment concentrations were computed from the hydrodynamic model runs as well as from direct measurements of current velocities at
Particle Tracking Model (PTM): II. Overview of Features and Capabilities
: II. Overview of Features and Capabilities") Particle Tracking Model (PTM): II. Overview of Features and Capabilities PURPOSE: This Dredging Operations and Engineering Research (DOER) Technical Note (TN) is the second in a series. It describes the
Particle Tracking Model (PTM): II. Overview of Features and Capabilities PURPOSE: This Dredging Operations and Engineering Research (DOER) Technical Note (TN) is the second in a series. It describes the
APPENDIX O. Sediment Modeling of Dredging off Lelu Island, Prince Rupert, BC Canada, and Disposal of Dredgate at Brown Passage
 APPENDIX O Sediment Modeling of Dredging off Lelu Island, Prince Rupert, BC Canada, and Disposal of Dredgate at Brown Passage Sediment Modeling of Dredging off Lelu Island, Prince Rupert, BC Canada, and
US ARMY CORPS OF ENGINEERS New England District BUILDING STRONG
 US ARMY CORPS OF ENGINEERS New England District STUDIES Sediment Sampling Biological Sampling (benthic community analysis) Hydroacoustic Surveys (side scan sonar, bathymetry) Remotely Operated Vehicle
ENGINEERING APPROACHES TO SHORELINE PLACEMENT FROM COAST TO COAST
 ENGINEERING APPROACHES TO SHORELINE PLACEMENT FROM COAST TO COAST 237 237 237 217 217 217 200 200 200 0 0 0 163 163 163 131 132 122 80 119 27 252 174.59 83 36 118 110 135 120 112 92 56 62 102 130 Comparing
Comparing suspended sediment concentrations derived from a model and collected in a tidally dominated area
 Comparing suspended sediment concentrations derived from a model and collected in a tidally dominated area Maryam Rahbani, Department of oceanic and atmospheric science University of Hormozgan, maryamrahbani@yahoo.com
Aquatic Transfer Facility (ATF) San Pablo Bay (SPB) Proposed Region of ATF. Proposed Seabed Pipeline
 San Pablo Bay (SPB) Proposed Region of ATF. Proposed Seabed Pipeline") Aquatic Transfer Facility (ATF) San Pablo Bay (SPB) Proposed Region of ATF Proposed Seabed Pipeline Technical Studies An Overview Scope: Provide background and new scientific information and analysis for
Aquatic Transfer Facility (ATF) San Pablo Bay (SPB) Proposed Region of ATF Proposed Seabed Pipeline Technical Studies An Overview Scope: Provide background and new scientific information and analysis for
Applying Electrical Resistivity Methods for Measuring Dredged Material Density in Hopper Bins
 DRP-3-07 November 1992 Dredging Technical Research Notes Applying Electrical Resistivity Methods for Measuring Dredged Material Density in Hopper Bins Purpose This technical note provides information on
Near-Field Sturgeon Monitoring for the New NY Bridge at Tappan Zee. Quarterly Report October 1 December 31, 2014
 Near-Field Sturgeon Monitoring for the New NY Bridge at Tappan Zee Quarterly Report October 1 December 31, 2014 Prepared by AKRF, Inc. 7250 Parkway Drive, Suite 210 Hanover, MD 21076 for New York State
Dynamics of the Ems Estuary
 Dynamics of the Ems Estuary Physics of coastal systems Jerker Menninga 0439738 Utrecht University Institute for Marine and Atmospheric research Utrecht Lecturer: Prof. dr. H.E. de Swart Abstract During
3. MARINE HABITAT RESTORATION
 Feasibility Study for Restoration of Titlow Lagoon Fish Passage South Puget Sound Salmon Enhancement Group 3. MARINE HABITAT RESTORATION Marine habitat restoration at Titlow Park could include restoration
A Comparison of Predicted Along-channel Eulerian Flows at Cross- Channel Transects from an EFDC-based Model to ADCP Data in South Puget Sound
 A Comparison of Predicted Along-channel Eulerian Flows at Cross- Channel Transects from an EFDC-based Model to ADCP Data in South Puget Sound Skip Albertson, J. A. Newton and N. Larson Washington State
ANALYSIS OF SEISMIC PROFILES AND SIDE-SCAN SONAR RECORDS FROM LOWER NEW YORK HARBOR, A PROGRESS REPORT. Roger D. Flood Vicki Lynn Ferrini
 45 ANALYSIS OF SISMIC PROFILS AND SID-SCAN SONAR RCORDS FROM LOWR NW YORK HARBOR, A PROGRSS RPORT Roger D. Flood Vicki Lynn Ferrini Marine Sciences Research Center State University of New York, Stony Brook,
Fine-scale Survey of Right and Humpback Whale Prey Abundance and Distribution
 DISTRIBUTION STATEMENT A: Approved for public release; distribution is unlimited. Fine-scale Survey of Right and Humpback Whale Prey Abundance and Distribution Joseph D. Warren School of Marine and Atmospheric
Red Sea - Dead Sea Water Conveyance Study Program Additional Studies
 Red Sea - Dead Sea Water Conveyance Study Program Additional Studies Red Sea Study Final Report Annex 1 Field and laboratory activities carried out during the study and their results July 213 TABLE OF
CASCO BAY ESTUARY PARTNERSHIP. R. Michael Doan FRIENDS OF CASCO BAY. May 2007
 Final Report 26 Dissolved Oxygen Monitoring Project Prepared for the CASCO BAY ESTUARY PARTNERSHIP By R. Michael Doan FRIENDS OF CASCO BAY May 27 Introduction Quahog Bay has experienced reduced water quality,
Material Workshop. Galveston District 2012 Beneficial Use of Dredged. Material Workshop. Custodians of the Coast
 Galveston District 2012 Beneficial Use of Dredged Material Workshop Galveston District 2012 Beneficial Use of Dredged Material Workshop US Army Corps of Engineers BUILDING STRONG Welcome Opening Remarks
A TIPPING-BUCKET SEDIMENT TRAP FOR CONTINUOUS MONITORING OF SEDIMENT DEPOSITION RATE
 A TIPPING-BUCKET SEDIMENT TRAP FOR CONTINUOUS MONITORING OF SEDIMENT DEPOSITION RATE YASUO NIHEI AND YUICHI IMASHIMIZU Department of Civil Eng., Tokyo University of Science, 2641 Yamazaki, Noda-shi 278-851,
ASSESSMENT OF DREDGING-INDUCED SEDIMENTATION ON WINTER FLOUNDER SPAWNING HABITAT
 ASSESSMENT OF DREDGING-INDUCED SEDIMENTATION ON WINTER FLOUNDER SPAWNING HABITAT Lackey, Tahirih C. 1, Kim, Sung-Chan 2, and Clarke, Douglas G. 3 ABSTRACT This study investigates the fate of sediment suspended
THE QUATERNARY GEOLOGY OF NEWARK BAY AND KILL VAN KULL CHANNEL, NEW YORK AND NEW JERSEY. and
 THE QUATERNARY GEOLOGY OF NEWARK BAY AND KILL VAN KULL CHANNEL, NEW YORK AND NEW JERSEY Stephanie Beda, W. Bruce Ward, William Murphy, Robert Fleming, Gary Fleming, Beckett Boyd Earthworks LLC 27 Glen
Modeling the Transport and Fate of Sediments Released from Dredging Projects in the Coastal Waters of British Columbia, Canada
 WEDA Dredging Summit & Expo 18 Modeling the Transport and Fate of Sediments Released from Dredging Projects in the Coastal Waters of British Columbia, Canada David B. Fissel, Yuehua (Andy) Lin and Todd
H.A.R.S. PRA #1 (Historic Area Remediation Site)
") H.A.R.S. PRA #1 (Historic Area Remediation Site) 2009 Multibeam Bathymetry TABLE OF CONTENTS Page LIST OF TABLES 2 LIST OF FIGURES 3 1.0 INTRODUCTION 4 2.0 OBJECTIVE 4 3.0 PROCEDURE 4 3.1 DATA ACQUISITION
H.A.R.S. PRA #1 (Historic Area Remediation Site) 2009 Multibeam Bathymetry TABLE OF CONTENTS Page LIST OF TABLES 2 LIST OF FIGURES 3 1.0 INTRODUCTION 4 2.0 OBJECTIVE 4 3.0 PROCEDURE 4 3.1 DATA ACQUISITION
RESULTS FROM THE TEXAS COASTAL SEDIMENT SOURCES: A GENERAL EVALUATION STUDY
 RESULTS FROM THE TEXAS COASTAL SEDIMENT SOURCES: A GENERAL EVALUATION STUDY JUAN MOYA KELSEY CALVEZ CRIS WEBER ANTHONY RISKO *KEVIN FRENZEL FREESE AND NICHOLS, INC. COASTAL AND WATERWAYS GROUP OBJECTIVES
Sediment Transport and Strata Formation in the Adriatic Sea
 Sediment Transport and Strata Formation in the Adriatic Sea Wayne R. Geyer James D. Irish Peter A. Traykovski Woods Hole Oceanographic Institution Woods Hole, MA 02543 Tel. (508) 289-2868, Fax: (508) 457-2194,
Flow estimations through spillways under submerged tidal conditions
 Computational Methods and Experimental Measurements XIII 137 Flow estimations through spillways under submerged tidal conditions P. D. Scarlatos 1, M. Ansar 2 & Z. Chen 2 1 Department of Civil Engineering
Observed bed elevation changes in the data may arise as a result of any of several causes:
 10 July 2014 TECHNICAL MEMORANDUM: INTRODUCTION NEWARK BAY STUDY AREA, NEW JERSEY BATHYMETRIC COMPARISON AND ANALYSIS Periodic single- and multi-beam sonar bathymetric surveys within Newark Bay (Bay) in
Coastal and Hydraulics Laboratory
 ERDC/CHL TR-09-6 Houston-Galveston Navigation Channels, Texas Project Navigation Channel Sedimentation Study, Phase 2 Plan Simulations Jennifer N. Tate and Cassandra G. Ross August 2009 Coastal and Hydraulics
Materials. Use materials meeting the following.
 208.01 Section 208. SOIL EROSION AND SEDIMENTATION CONTROL 208.01 Description. Install and maintain erosion and sedimentation controls to minimize soil erosion and to control sedimentation from affecting
Measurements of lateral flow from the Mississippi River at Mardi Gras Pass in the Bohemia Spillway using synoptic ADCP
 Measurements of lateral flow from the Mississippi River at Mardi Gras Pass in the Bohemia Spillway using synoptic ADCP A Technical Report Submitted to: The Lake Pontchartrain Basin Foundation Submitted
A part of BMT in Energy and Environment Western Basin Dredge Plume Monitoring and Model Validation
 A part of BMT in Energy and Environment Western Basin Dredge Plume Monitoring and Model Validation R.B18539.001.00.PlumeMonitoringValidation.doc September 2011 Western Basin Dredge Plume Monitoring and
ABSTRACT. Keywords: Brunswick, dredged material, nearshore placement, PTM, sediment transport INTRODUCTION
 APPLICATION OF THE PARTICLE TRACKING MODEL TO PREDICT FAR-FIELD FATE OF SEDIMENT SUSPENDED BY NEARSHORE DREDGING AND PLACEMENT, BRUNSWICK GA Joseph Z. Gailani 1, Tahirih C. Lackey 1, and S. Jarrell Smith
Joint Federal Agency Submerged Aquatic Vegetation Survey Guidance for the New England Region Updated August 11, 2016
 Joint Federal Agency Submerged Aquatic Vegetation Survey Guidance for the New England Region Updated August 11, 2016 FOREWORD This guidance is the result of on-going interagency collaboration between the
GSA DATA REPOSITORY
 GSA DATA REPOSITORY 2009206 Miner et al. Supplemental Material Bathymetric Survey Methods The bathymetric data for the area were gathered using a single-beam bathymetric survey rig mounted aboard a 21-foot
Current and Future Technology Applications for Coastal Zone Management. Bruce K. Carlisle, Acting Director Office of Coastal Zone Management
 Current and Future Technology Applications for Coastal Zone Management Bruce K. Carlisle, Acting Director Office of Coastal Zone Management The Massachusetts Coastal Zone Management Program Approved in
Decline of Lake Michigan-Huron Levels Caused by Erosion of the St. Clair River
 Decline of Lake Michigan-Huron Levels Caused by Erosion of the St. Clair River W.F. & Associates Coastal Engineers (in association with Frank Quinn) April 13, 2005 Outline Problem Definition Understanding
12.0 COASTAL PROCESSES
 12.0 COASTAL PROCESSES 12.1 Introduction This Chapter of the EIS considers the potential and likely significant effects of the proposed alterations to the permitted development. The purpose of this chapter
3.0 ROBERTS BANK TIDAL FLAT MORPHOLOGY
 Vancouver Port Authority Northwest Hydraulic Consultants Ltd. /Triton Consultants Ltd. Roberts Bank Container Expansion File: 33863 Coastal Geomorphology Study - 19 - November 2004 3.0 ROBERTS BANK TIDAL
Hydraulic Processes Analysis System (HyPAS)
") Hydraulic Processes Analysis System (HyPAS) by Thad C. Pratt and Daryl S. Cook PURPOSE: This Coastal Engineering Technical Note (CETN) describes a PC-Windows-based system for analyzing, visualizing, and
Hydraulic Processes Analysis System (HyPAS) by Thad C. Pratt and Daryl S. Cook PURPOSE: This Coastal Engineering Technical Note (CETN) describes a PC-Windows-based system for analyzing, visualizing, and
U.S. Army Corps of Engineers Detroit District. Sediment Trap Assessment Saginaw River, Michigan
 U.S. Army Corps of Engineers Detroit District December 2001 December 2001 This report has been prepared for USACE, Detroit District by: W.F. BAIRD & ASSOCIATES LTD. 2981 YARMOUTH GREENWAY MADISON, WISCONSIN
GEOTECHNICAL TESTING OF SEDIMENT
 ApPENDIX El. GEOTECHNICAL TESTING OF SEDIMENT (Modified from Exponent, 20Q1c) E.I Introduction This appendix presents information regarding geotechnical testing performed in 2000 on sediments in Onondaga
Donald K. Stauble and Bill Birkemeier Coastal and Hydraulics Laboratory US Army Corps of Engineers
 Donald K. Stauble and Bill Birkemeier Coastal and Hydraulics Laboratory US Army Corps of Engineers Define the Problem Navigation Shore Protection Environmental Political So what is the problem? Management
Developing a Seabed Resurvey Strategy: A GIS approach to modelling seabed changes and resurvey risk
 Developing a Seabed Resurvey Strategy: A GIS approach to modelling seabed changes and resurvey risk A. M. Bakare, J. G. Morley, R. R. Simons Department of Geomatic Engineering, University College London,
Monitoring Dredge Placement Operations through Fine-Scale Suspended Sediment Observations within a Shallow Coastal Embayment
 Monitoring Dredge Placement Operations through Fine-Scale Suspended Sediment Observations within a Shallow Coastal Embayment ABSTRACT R. Beecroft 1, A. Grinham 1, C. Heatherington 1, Craig Wilson 2 and
Evaluation of Potential for Sedimentation on Natural Oyster Bar 8-11 from Dike Construction at the Poplar Island Environmental Restoration Project
 Department of Natural Resources Resource Assessment Service MARYLAND GEOLOGICAL SURVEY Emery T. Cleaves, Director COASTAL AND ESTUARINE GEOLOGY FILE REPORT NO. 02-05 Evaluation of Potential for Sedimentation
Regional-scale understanding of the geologic character and sand resources of the Atlantic inner continental shelf, Maine to Virginia
 Regional-scale understanding of the geologic character and sand resources of the Atlantic inner continental shelf, Maine to Virginia Workshop on Dredging, Beach Nourishment and Bird Conservation Atlantic
The U.S. Army Corps of Engineers Philadelphia District
 The U.S. Army Corps of Engineers Philadelphia District The Atlantic Coast of New Jersey Regional Sediment Budget 1986-2003 Cape May Point to Manasquan Inlet Final Report March 2006 The Atlantic Coast of
Ice Measurements in Cook Inlet, Alaska with an Acoustic Doppler Profiler
 Ice Measurements in Cook Inlet, Alaska with an Acoustic Doppler Profiler Alexander V. Khokhlov, Nels J. Sultan, John W. Pickering PND Engineers, Inc. Anchorage, Alaska, USA avk@pndengineers.com John Wood
Sediment Dynamics from the Summit to the Sea
 Sediment Dynamics from the Summit to the Sea 435 (Proceedings of a symposium held in New Orleans, Louisiana, USA, 11 14 December 214) (IAHS Publ. 367, 214). Effects of salinity and particle concentration
Coastal Sediment Properties and Longshore Sediment Transport
 Coastal Sediment Properties and Longshore Sediment Transport Julie Rosati Julie.D.Rosati@erdc.usace.army.mil 601-634-3005 Coastal Planning Course Lesson #8 Tuesday 8:00-9:00 am CEM III-1, III-2 1. Coastal
Old Stone Sewer Main Street
 Bangor Landing Bangor, Maine Case Study-Sediment Sediment Investigation Maine Department of Environmental Protection City of Bangor, with RMT, Inc. Site Location and Local Site Features 1 Bangor Landing
ENGINEERING WITH NATURE: NEARSHORE BERM PLACEMENTS AT FORT MYERS BEACH AND PERDIDO KEY, FLORIDA, USA
 1 ENGINEERING WITH NATURE: NEARSHORE BERM PLACEMENTS AT FORT MYERS BEACH AND PERDIDO KEY, FLORIDA, USA KATHERINE E. BRUTSCHÉ 1, PING WANG 2, JULIE D. ROSATI 1, CHERYL E. POLLOCK 1 1. U.S. Army Engineer
Bishopville Prong Study
 Bathymetric and Sediment Assessment in the Bishopville Prong of St. Martin River Darlene V. Wells, Richard A. Ortt, Jr., and Stephen Van Ryswick Funded by MCBP 2011-2012 Implementation Grant Objectives
DRAFT ONONDAGA LAKE CAPPING AND DREDGE AREA AND DEPTH INITIAL DESIGN SUBMITTAL H.4 SEISMIC SLOPE STABILITY ANALYSES
 DRAFT ONONDAGA LAKE CAPPING AND DREDGE AREA AND DEPTH INITIAL DESIGN SUBMITTAL H.4 SEISMIC SLOPE STABILITY ANALYSES Parsons P:\Honeywell -SYR\444576 2008 Capping\09 Reports\9.3 December 2009_Capping and
USEPA National Watershed Protection Program NY/NJ Harbor Estuary Program USEPA Region 2 New York, New York. USEPA Contract EP-C
 USEPA National Watershed Protection Program NY/NJ Harbor Estuary Program USEPA Region 2, EVALUATION OF AMMONIA TOXICITY IN THE NY/NJ HARBOR WITHIN THE CONTEXT OF NITROGEN AND CARBON TMDL PLANNING FOR ATTAINMENT
Development, Testing and Application of the Multi-Block LTFATE Hydrodynamic and Sediment Transport Model
 Development, Testing and Application of the Multi-Block LTFATE Hydrodynamic and Sediment Transport Model Earl Hayter Environmental Lab October 25, 2012 LTFATE Multi-Block Hydrodynamic, Water Quality and
UC Berkeley Technical Completion Reports
 UC Berkeley Technical Completion Reports Title Hydrodynamics of shallow water habitats in the Sacramento-San Joaquin Delta Permalink https://escholarship.org/uc/item/3j77h7t6 Author Stacey, Mark T Publication
Regional Sediment Management
 Regional Sediment Management Linda S. Lillycrop Program Manager Coastal Engineer US Army Engineer Research and Development Center Coastal and Hydraulics Laboratory Q AVG Coastal Resilience: The Environmental,
Monitoring The Sand Extraction On The Belgian Continental Shelf
 Monitoring The Sand Extraction On The Belgian Continental Shelf Methodology, Results And Expectations K. Degrendele and M. Roche Within the framework of a sustainable exploitation of the mineral resources
SEABED MORPHOLOGY OFF SOUTHERN LONG ISLAND: STUDIES OF ARTIFICIAL REEFS AND IMPLICATIONS FOR WIND FARMS. Juliet Kinney & Roger D.
 SEABED MORPHOLOGY OFF SOUTHERN LONG ISLAND: STUDIES OF ARTIFICIAL REEFS AND IMPLICATIONS FOR WIND FARMS Juliet Kinney & Roger D. Flood Marine Sciences Research Center, Stony Brook University Stony Brook,
Estimated Sediment Volume: Bridge Street Dam Impoundment, Royal River, Yarmouth, Maine
 University of Southern Maine USM Digital Commons Publications Casco Bay Estuary Partnership (CBEP) 2015 Estimated Sediment Volume: Bridge Street Dam Impoundment, Royal River, Yarmouth, Maine Stantec Follow
Varying Bathymetric Data Collection Methods and their Impact on Impoundment Volume and Sediment Load Calculations I.A. Kiraly 1, T.
 Varying Bathymetric Data Collection Methods and their Impact on Impoundment Volume and Sediment Load Calculations I.A. Kiraly 1, T. Sullivan 2 1 Gomez and Sullivan Engineers, D.P.C., 41 Liberty Hill Road,
POST CABLE INSTALLATION THERMAL MONITORING PROGRAM LONG ISLAND REPLACEMENT CABLE PROJECT NORWALK, CT OSI JOB# 08ES069
 28 July 2009 Mark D. Driscoll, M.S. Senior Water Resources Scientist. 888 Worcester Street, Suite 2 Wellesley, MA 02482 SUBJECT: FINAL REPORT POST CABLE INSTALLATION THERMAL MONITORING PROGRAM LONG ISLAND
Variability in Geotechnical Properties of Sediments and Dredged Materials
 Variability in Geotechnical Properties of Sediments and Dredged Materials PURPOSE: This technical note provides an overview of selected uncertainties involved in estimating or characterizing pre-dredged
A lithological map created from multibeam backscatter data in challenging circumstances: the Lower Sea Scheldt estuary
 A lithological map created from multibeam backscatter data in challenging circumstances: the Lower Sea Scheldt estuary Mieke Mathys*, Marc Sas*, Frederik Roose** HYDRO12, Rotterdam, 15/11/2012 *International
Lower 8.3 Miles of the Lower Passaic River Operable Unit 2 Presentation to The Passaic River Community Advisory Group. September 14, 2017
 Lower 8.3 Miles of the Lower Passaic River Operable Unit 2 Presentation to The Passaic River Community Advisory Group September 14, 2017 Agenda Pre-Design Investigation (PDI) Status Geophysical, Bathymetric,