AMBIENT BIOMONITORING NETWORK Watershed Management Areas 1, 2, and 11
|
|
|
- Owen Ross
- 5 years ago
- Views:
Transcription
1 State of New Jersey Christine Todd Whitman, Governor AMBIENT BIOMONITORING NETWORK Watershed Management Areas 1, 2, and 11 Upper Delaware Region 1998 Benthic Macroinvertebrate Data New Jersey Department of Environmental Protection Robert C. Shinn, JR., Commissioner December 1999

2 NJ Department of Environmental Protection Environmental Planning & Science Bob Tudor, Assistant Commissioner Division of Watershed Management Lance Miller, Director Water Monitoring Management James E. Mumman, Administrator Bureau of Freshwater & Biological Monitoring Alfred L. Korndoerfer, Jr., Chief December 1999 AMBIENT BIOMONITORING NETWORK Watershed Management Areas 1, 2, and 11 Upper Delaware Region 1998 Benthic Macroinvertebrate Data Water Monitoring Report Prepared By: Bureau of Freshwater and Biological Monitoring John Kurtz, Project Manager Victor Poretti Thomas Miller Dean Bryson Map Preparation: John Sell Edited By: Alfred L. Korndoerfer, Jr. Paul Olsen
3 Ambient Biomonitoring Network Watershed Management Areas 1, 2, and 11 Upper Delaware Region 1998 Benthic Macroinvertebrate Data INTRODUCTION Historical Perspective Since the early 1970s the New Jersey Department of Environmental Protection (NJDEP) has conducted biological monitoring of the state s water bodies. These biomonitoring studies, currently conducted by the Bureau of Freshwater and Biological Monitoring (BFWM), have included both long-term ambient monitoring and short-term intensive surveys. The information gathered contributes significantly to State water quality management and pollution mitigation efforts. The United States Environmental Protection Agency (USEPA) has recognized that a thorough program of monitoring aquatic biota can be a cost-efficient means of gauging the quality of water and watershed areas [1, 2]. Because flora and fauna of various trophic levels can integrate the effects of water quality or habitat changes over time, they become very effective pollution indicators. For lotic (running water) systems, analysis of benthic macroinvertebrate communities provides the principal means of achieving this, particularly since macroinvertebrates are more stationary than fish, and less temporal than periphytic, or attached microscopic communities. New Jersey s initial long-term ambient biological stream monitoring program, in the mid 1970s, included only a limited number (31) of fixed stations," many of which proved later to be either inaccessible or in degraded condition. In 1991, however, the BFWM received numerous requests from the Office of Regulatory Policy to reinitiate or upgrade long-term monitoring of benthic macroinvertebrate communities; the data obtained would be most beneficial in the generation of the 305b (Water Quality Inventory) biennial report [3], in the updating the 303d List (of water quality limited stream segments). Thus, the present Ambient Biomonitoring Network (AMNET) program was developed to provide NJDEP with the greater resolution of baseline data now necessary to support sound policy decisions in water quality/watershed management, and to direct regulatory, or permit," activities. Initiated in 1992, AMNET samples over 800 stream sites statewide, with approximately 200 sites in each of five major drainage basins (upper and lower Delaware, greater Passaic, Raritan and Atlantic) once every five years. This ambitious project is facilitated by the use of Rapid Bioassessment Protocol II (RBPII) methods, devised by the USEPA, which provide an expedient tool for site ranking, screening and trend monitoring [2]. The present report, on the upper Delaware River basin, marks the start of the second round of AMNET. Page 1 of 13 udel98.doc
4 Rationale for Biological Monitoring Biological monitoring, as referenced in this report, pertains to the collection and analysis of stream macroinvertebrate communities as indicators of water or habitat quality. Macroinvertebrates are larger-thanmicroscopic, primarily benthic (bottom-dwelling) fauna, which are generally ubiquitous in freshwater and estuarine environments, and play an integral role in the aquatic food web. Insects (largely immature forms) are especially characteristic of freshwaters; other major groups include worms, mollusks (snails, clams) and crustaceans (scuds, shrimp, water fleas, etc.). They are more readily collected and quantified than either fish or periphyton communities. Species comprising the in-stream community occupy various niches, based on functional adaptation or feeding mode (e.g. predators, filter or detritus feeders, scavengers); their presence and relative abundance is governed by environmental conditions (which may determine available food supply), and by pollution tolerance levels of the respective species. The overall community thus is holistically reflective of conditions in its environment. Assessments of ambient water and habitat quality can then be made based upon standardized procedures, which can show perturbations measured as changes or differences in community structure [2, 4]. STUDY DESIGN Data Quality Objectives The major goal of AMNET is to establish a network of stream sites that would adequately represent New Jersey s major drainage basins and NJDEP s Watershed Management Areas (WMA). Twenty WMAs have recently been delineated within New Jersey's five basins. Each basin constitutes a "Water Region." Within each WMA are several sub-basins, delineated by the United States Geological Survey (USGS) as hydrologic units," scale 11 (HUC11). The study area of the present report includes WMAs 1, 2, and 11 (see Maps 1 7). The sampling frequency reflects a realistic temporal lag between cessation of an environmental perturbation and recovery of the impacted biological community. The 305b Water Quality Inventory [3], which reexamines changes in New Jersey s stream systems on a two-year cycle, has indicated that five years is an optimum period for long-term biomonitoring. An ample network of stations is required for the creation of a long-term database, which in turn, is necessary for trend analysis and operation of water quality predictive models. Another program goal is to monitor a complete basin s complement of stations within a fiscal year (beginning July 1), giving our modelers and planners a snapshot of ambient biological impacts during that particular year. Monitoring will be rotated to a different basin each new fiscal year. The spatial distribution of stations is adequate to provide biological impact data on a long-term, basin-wide or statewide scale. It is likely not sufficient, however, to assess the biological impact(s) of any one point source of pollution, as this would be better served by a site-specific or intensive survey of the stream segment in question. Biological monitoring cannot replace chemical monitoring, toxicity testing, and other standard environmental measurements. Each of these tools provides the analyst with specific information available only through its respective methodology. Page 2 of 13 udel98.doc
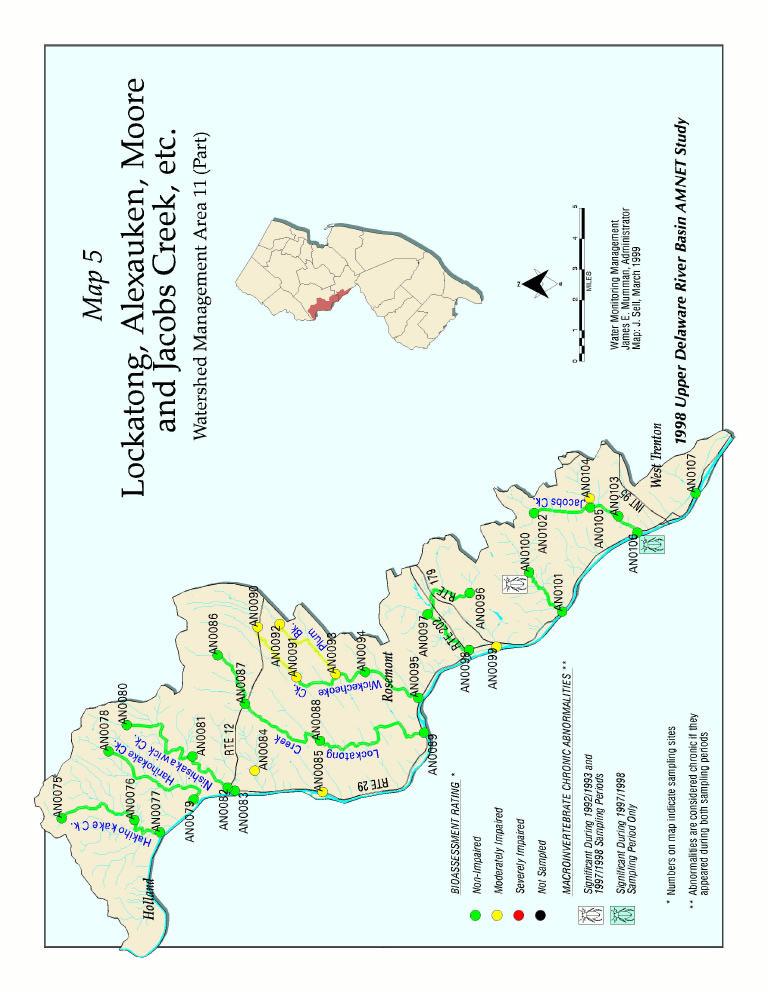
5 Site Selection For the first round of AMNET, a total of 192 stations had been established in the upper Delaware basin from [5]. This area (shown in Figure 1) included all sub-basins that drain to the Delaware River from its upper tidal portion at Cooper River (Camden County) northward to Clove Brook near the New Jersey/New York border (Sussex County). On the smallest tributaries, sampling sites were located as closely as to headwaters as practical. To ensure enough flow for sampling, sites on "first-order" streams were situated at least three miles downstream of headwaters (first order streams are those with no tributaries). Since most streams at this level have very little, or only intermittent, flow, most of our sites were situated on second-order streams (with only first-order streams as tributaries) and higher (with a greater hierarchy of tributaries). All sites were located in reasonably accessible and primarily wadable segments, proceeding downstream to just above the confluence with the Delaware River. The Delaware River main stem was not monitored, since this was presumably being done by the Delaware River Basin Commission (DRBC). For the second round of AMNET (FY98), the original study area was divided into two segments in conformance with the boundary between the newly established Water Regions. The lower portion (WMA #19 & 20), which drains to the upper tidal Delaware River, was deleted from the present study, and the results of that study are to be included as a separate supplemental report. In the Upper Delaware Region (WMA #1 & 11), seven new sites were added and one site was relocated for better access; also, the Wallkill River drainage basin (WMA 2) and its 16 AMNET sites, plus one new site, were included (Figure 2). During the initial AMNET survey in 1993, the Wallkill sub-basin had been included with the greater Passaic, or northeast basin [6]. These additions brought the total number of sampling sites in the Upper Delaware Region to 142, although three of these (AN013, 023, 034) were not sampled due to low flow conditions. Figure 1 Map of study area To maximize data correlation, AMNET, wherever possible, incorporated existing stations of the ambient Surface Water Chemical Monitoring Network, which is administered jointly by NJDEP and the USGS [7]. Furthermore, so as to gauge the effects of major tributaries and larger lakes, many AMNET sites were located near their confluence or outlet. Also considered when selecting sites were known sources of contamination (e.g. point-source discharges, agricultural operations) and significant natural features such as wetlands, parks or wildlife management areas. Figure 2 Map of study area Exact AMNET site locations were determined via the Global Positioning System (GPS) using Trimble Pathfinder units and the appropriate correction sources utilized by NJDEP. All positions were logged into the Geographical Information System (GIS) (see Maps 1 7, Appendix A). FIELD & LABORATORY METHODS Benthic macroinvertebrate sampling and analyses were performed in accordance with the NJDEP Field Procedures Manual [8], Rapid Bioassessment (RBP) Protocol II guidelines of the USEPA [2] and Standard Operating Procedures (SOP) of the BFWM Aquatic Biomonitoring Laboratory [9]. Page 3 of 13 udel98.doc
6 Field Collection Because the low gradient of the southern regions precludes streams from having dominant riffle areas (the preferred sampling habitat) we modified the RBP field methods for New Jersey streams by collecting multihabitat sampling. This type of sampling includes both riffle and run areas, with various types of substrate (e.g. fine sediment, gravel/rocks, woody debris, stream and bank vegetation), plus coarse particulate matter or leaf litter (CPOM). This would minimize habitat or substrate variation between stations, and include all likely functional groups of macroinvertebrates. Samples were collected in semi-quantitative fashion either with a Surber Sampler, kick net, Petite Ponar dredge, or by hand picking. During the field investigation, semiqualitative observations of habitat, surrounding land use, potential pollution sources, and other aquatic biota were recorded, although these did not figure into the final numerical rating. At each site, the entire sample was sieved through a standard #30 mesh device, put into wide-mouth glass jars, and preserved with 5 to 10% formalin (to 20% in cases of excessive organic loading). Sample Sorting & Identification In the laboratory, subsamples of 100 individuals were taken by first evenly distributing the composited sample on a grid in a light-colored pan, then removing all organisms from randomly-selected grids until a total of at least 100 organisms was obtained. The macroinvertebrates were identified to species (where possible), or at least to family level, and counted using 7 to 30X stereozoom and 40 to 400X compound magnification. A comprehensive collection of taxonomic keys and other references, including functional (or niche) descriptions and pollution tolerance classifications for most species, is maintained in the laboratory. An indexed list of these is given in the Laboratory SOP [9]. Consultation with other scientists in the field provides added assistance and confirmation, when needed. DATA ANALYSIS Biological impairment may be caused by several major factors such as organic enrichment, habitat degradation, or toxicological effects. It may be manifested in several aspects of the benthic macroinvertebrate community; these include absence of pollution-sensitive taxa, especially the EPT group, i.e. Ephemeroptera (mayflies), Plecoptera (stoneflies) and Trichoptera (caddisflies); in excessive dominance of pollution-tolerant taxa such as Chironomidae (midges) and Oligochaeta (worms); in low overall taxa numbers, or with other perceptible differences in community structure relative to a reference condition. Page 4 of 13 udel98.doc
7 Benthic Community Analysis The data analysis is an important part of the RBP protocol, developed under USEPA auspices as an expedient and cost-effective monitoring tool. It recognizes a multiple approach, utilizing several biometrics," that measure different components of community structure, including population and functional parameters, each with a different range of sensitivity to pollution stresses [2, 4]. The use of a variety of biometrics assures a more robust or valid assessment; therefore, an anomaly in any one metric is less likely to invalidate the study findings. The results are integrated through common scoring criteria, derived from an established comparable database, to determine a final numerical rating and consequent biological condition category (see Table 1). This provides the analyst with an easily communicated evaluation of relative impairment, referred to in this report as the bioassessment rating." For RBP II protocols, results are based on 100 organism sub-samples, and scoring criteria are validated for family level taxonomy, giving three final rating categories (non-impaired, moderately impaired, and severely impaired). The biometrics we employ are modified from RBP II methods, having been statistically validated for New Jersey based upon data from 200 stream sites throughout the state [10]. The final numerical rating is referred to as the New Jersey impairment score (NJIS). The scoring criteria and rating categories are presented in Table 1. The metrics from which the NJIS is derived are explained below: 1. Total Taxa or Taxa Richness (# families) an index of community diversity; the number usually increases with increasing water or habitat quality. 2. Percent Contribution of the Dominant Family (to the total # families) dominance by relatively few species/families would indicate environmental stress. 3. # EPT Families the number of families represented within the orders Ephemeroptera (mayflies), Plecoptera (stoneflies) and Trichoptera (caddisflies), which are generally pollutionsensitive. 4. Percent EPT (of the total # individuals) would increase with increasing water quality. 5. Hilsenhoff (Family) Biotic Index tolerance values of 0-10 assigned to individual families increase as water quality decreases; summarizes the overall pollution tolerance of the entire benthic macroinvertebrate community with a single value. Comparison with Results In evaluating the upper Delaware data against that for , a significant improvement or decline was considered to have occurred when the score (NJIS) changed the bioassessment rating. A complete list of site-by-site comparisons is presented in Table 2, where a (+) indicates a significant improvement, a (-) indicates a significant decline, and a (/)indicates no change in rating; a slash may have a (+) or a (-) indicating that the score improved or declined, but the bioassessment rating did not. Page 5 of 13 udel98.doc
8 Morphological Abnormalities Occasionally, morphological abnormalities have been found in individual macroinvertebrates recovered in our AMNET collections. These deformities have been most readily detected in the Chironomidae (midges), where they occur primarily in the head appendages (antennae) and mouth parts (mentum and mandibles). While the incidence has been most frequent in the chironomids, especially those species categorized as detritivores, herbivores or periphyton feeders, abnormalities have also been observed in individuals of other taxonomic groups. Although this is not a factor in the NJIS data analysis, such features are noted, as they may signify possible contaminants or stressful conditions in the respective drainages. In the course of identification, chironomid larvae were examined for abnormalities. These results are summarized by sample site in Table 3. For chironomidae, the data is displayed as (# of chironomids with abnormalities / # of chironomids examined). For all other taxa, just the number of individuals with abnormalities is presented. Deformities found in greater than five percent (>5%) of chironomids examined were considered to be significant (personal communication R. Bode, New York Department of Environmental Conservation; J. Kurtz, NJDEP). Abnormalities were considered to be "chronic" at a particular station if that site yielded >5% abnormalities for both the and sampling periods (see Table 3). Photographic examples of abnormalities in midge larvae and amphipods (scuds), plus maps of the sites where these were found, are contained in Appendix B. AMNET sites found with significant and chronic abnormalities in chironomids are also indicated in Maps 1-7. SUPPLEMENTAL ANALYSIS / EVALUATION Habitat Assessment The physical attributes of habitat play an integral role in the health of the macroinvertebrate community. Where stations are physically comparable, detected impacts can be attributed to water quality factors; however, habitat degradation alone can account for biological impairment in a stream [2]. Parameters we evaluated included in-stream substrate, channel morphology, bank structural features, and riparian vegetation. The area evaluated included the sample site and its immediate surroundings (usually within a foot radius). The qualitative habitat assessment involves four condition categories, rating each parameter as optimal, suboptimal, marginal or poor based on recently revised USEPA criteria [11]. Habitat assessments may be temporarily downgraded by adverse weather conditions, such as excessive rainfall or prolonged drought (which existed during this study period). It should also be noted that habitat assessments are performed independently of the macroinvertebrate community analysis; thus they do not factor into the final impairment score, but are used primarily as supplementary information. For each parameter, the range of conditions and the numerical rating scale are presented for high and low gradient streams, respectively, in Table 4. Comparisons of these final scores against the respective NJIS scores and relative trends, are shown in Appendix C. Page 6 of 13 udel98.doc
9 All streams in the northern portion of New Jersey, i.e. the Piedmont, Valley/Ridge and Highlands regions, are considered to be high gradient streams, having substrates of rock and cobble of various sizes, and with relatively swift flow. Those in the Coastal Plain region of southern New Jersey are considered as low gradient streams, having slower flow and more homogeneous substrates, primarily of sand or gravel and finer sediments. These major physiographic subregions are illustrated in the New Jersey State EcoMap [12]. The transition from high gradient to low gradient is marked by the Fall Line," a geologic/topographic feature that bisects New Jersey in a southwest northeasterly direction from the Delaware River at Trenton through the lower Raritan River near New Brunswick. The trajectory of the Fall Line is superficially traced by the lower Assunpink Creek at the southwest juncture (see Map # 6), and its alignment with Lawrence Brook to the northeast in the Raritan River drainage. Administratively, the Assunpink sub-basin forms the southern boundary of the Upper Delaware Water Region, the area of the present study, with terrain principally of high gradient. Sediment Toxicity Testing To supplement the results of the benthic macroinvertebrate sampling, the BFWM from 1996 to 1998 performed acute sediment toxicity tests on several AMNET sites that exhibited severely impaired biological conditions in the earlier upper Delaware survey. The methods conformed to standardized USEPA protocols as reflected in our laboratory Standard Operating Procedures [9]. The amphipod, Hyalella azteca, was used as the test organism in the 10-day tests that measured effects on both survival and growth. Results from the test sites were compared to the responses observed in reference sediment from non-impaired AMNET sites that were similar in morphology or habitat features. One site in Warren County (AN0042, Map 3), found to be severely impaired in the sampling, was tested. The test site and corresponding reference site is as follows: Test Site AN0042 Furnace Brook Reference Site Used AN0045 Beaver Bk Page 7 of 13 udel98.doc
10 RESULTS AND DISCUSSION Overall, bioassessment ratings developed for each of the monitoring stations were used as the basis for evaluating the degree of biological impairment within the coincident stream segments. The estimated bioassessment ratings for each stream segment are presented as color-coded highlighted segments on the GIS maps # 1-7. In each WMA, starting from the AMNET station farthest downstream, estimated bioassessment ratings were assigned to the stream segments by interpolating from the downstream station to the next contiguous upstream station. These ratings are best estimates of the in-stream biological impairment based upon the available data. For any given segment, however, the actual in-situ conditions may vary due to unknown differences in habitat or sources of degradation. Detailed taxonomic and statistical data, bioassessment ratings, habitat assessment scores and observations, are given in Appendix D. Severely impaired 0.7% Moderately impaired 1998 Upper Delaware Region Bioassessment Results Non-impaired 58.0% Overall, out of 139 monitoring stations sampled during this study period, 80 or 58% were rated as NON- IMPAIRED, 57 or 41.3% were rated as MODERATELY IMPAIRED, and one site (0.7%) was rated as SEVERELY IMPAIRED (see Figure 3). 41.3% Figure Upper Delaware Region Bioassessment Results For comparison, Figure 4 depicts the results of 127 monitoring sites within the same Watershed Management Areas that were sampled during the 1993 study period. Severely impaired 5.4% Non-impaired 66.9% Figure 4 Moderately impaired 27.7% Figure 5 Percent Change in Rating Between the 1993 and the 1998 Monitoring Positive Change 12.6% Negative Change 15.7% No Change 71.7% Figure 5 displays the percentage of change in rating that has occurred for the 127 sites that were sampled during both the 1993 and 1998 monitorings. The green indicates a positive change, yellow indicates no change, and red indicates a change for the worse (see Table 2). Notably, fewer severely impaired sites were found in 1998 than in 1993; however, the 1998 data also revealed more moderately impaired sites and fewer non-impaired sites (Figures 3 & 4). Page 8 of 13 udel98.doc
11 In the upper Delaware Water Region, the majority of NJIS scores (58%) are high and fall within the "nonimpaired" range; less than half are "moderately impaired" and only one site (AN0117) is rated as "severely impaired" (from Table 2 and Appendix D). The entire Upper Delaware Region is situated north of the "Fall Line" and superimposes on portions of the Ridge and Valley, Highlands, Reading Prong and Piedmont physiographic sub-regions [12]. Significantly, 52 of the 80 non-impaired sites (65%) are located within the Ridge and Valley and Reading Prong sub-regions in the northernmost sector of the Delaware drainage basin, which constitutes a major portion of WMA #1. This area features forested uplands and high gradient terrain. Of the moderately impaired sites, 35 of 57 (61.4%) are located within the Wallkill sub-basin (WMA #2), which drains northwestward to the Hudson River in New York and the Piedmont sub-region in the southern portion of the upper Delaware drainage (WMA #11). The latter two regions feature somewhat lower relief, with agricultural areas thoughout and with greater urbanization (e.g. Trenton) in the southernmost portion. Thus, impacts of an anthropogenic nature are reflected in the biotic integrity of our stream systems. The Assunpink Creek drainage in WMA #11 constitutes the southern boundary of the Upper Delaware Water Region, and its main stem marks the "Fall Line" that separates this region from the low-gradient terrain of the Atlantic Coastal Plain. Macroinvertebrate Abnormalities Locations of all AMNET sites yielding macroinvertebrate abnormalities are shown in Appendix B, while only those sites with "significant" (>5% of the individuals examined) and "chronic" (>5% in both and ) abnormalities are shown in Maps 1-7. In the current samples, 50 of the 138 AMNET sites in the Upper Delaware Water Region (36%) exhibited morphological abnormalities in at least one individual examined; 29 sites (21%) exhibited significant numbers of abnormalities (75%); only seven sites (5%) yielded chronic abnormalities. The occurrence of chronic abnormalities at a given site signifies the presence of chronic environmental stressor(s), possibly from toxicants, in the vicinity, therefore indicating that these areas should be more intensely investigated. Such locations found in the current upper Delaware AMNET sampling included three in the Pequest River and Musconetcong River/Pohatcong Creek sub-basins (Maps 3 and 4, WMA 1), and one in Moores Creek (Map 5, WMA 11). Habitat Assessment vs. Biological Condition Habitat assessment scores and corresponding NJIS scores (Appendix D) for each station in the upper Delaware AMNET area are plotted along a spatial gradient, north to south/upstream to downstream, in Appendix C. In this scenario, paralleling of the trend lines, in some degree (which is seen in much of the data), would reflect a direct relationship or positive correlation between the two parameters. In the northernmost regions (WMA 1 and, to a lesser extent, WMA 2), spatial trends are seen to parallel each other closely, with both at high levels, thus reflecting favorable habitat and water quality. Southward from here (WMA 11), we see a rather abrupt decline in NJIS scores relative to habitat scores; therefore, the influence of other factors (e.g. physiochemical conditions) is indicated, as the more urban and agricultural areas are approached. In a few situations, a non-impaired biological community was found where habitat appeared to be impaired. Conversely, in some cases of optimal habitat, an impaired biological community was found; therefore, water quality or other physiochemical factors likely were involved. Habitat assessments were not performed in the earlier ( ) AMNET surveys [5, 6]; thus, no temporal comparisons could be made. Further assessments and statistical analyses relating habitats assessments to biological condition should be conducted in order to reveal possible trends and correlations. Page 9 of 13 udel98.doc
12 Sediment Toxicity Test Results Acute toxicity, as measured by mortality, was not demonstrated in the test performed, as none of the survival responses observed were significantly different from those observed in the controls. Growth responses (average dry weights) also were not significantly different from those of the control, thus indicating no chronic effects in this regard over the 10-day test period. Since the test site results largely showed no significant difference from the control results, the severe impairment levels previously found were likely due to other causes, such as habitat alteration or various physiochemical factors. This also does not preclude the presence of toxic substances at low, but chronically toxic, levels undetectable by the present methodology, or which may have been introduced into the stream episodically, rather than continuously. Therefore, it is advisable based on these study results that supplemental sampling be performed for target analytes such as fertilizer nutrients (usually forms of nitrogen and phosphorus), pesticides, or other suspected toxic compounds. Causes and Conditions of Impairment Biological impairment, as determined through RBP analysis, is manifested by alterations or differences in macroinvertebrate community structure, compared to a reference or "ideal" condition. In an impaired situation, species of pollution-tolerant groups (such as worms and midges) tend to dominate over pollutionintolerant forms (e.g. mayflies, stoneflies, etc.), with an overall depression in species diversity. Such discrepancies are typically due to degraded instream environmental conditions, which may be caused by various human activities or land-uses and, in some cases, by natural features or events. Environmental factors that may adversely affect stream biology, including both chemical and physical parameters, are listed below: 1. Lack of dissolved oxygen 2. Higher than normal temperature 3. Excessive turbidy 4. Presence of toxicants (in various chemical forms) 5. Eutrophication (= excessive nutrients promoting undesirable vegetation or algal blooms, and increased turbidity 6. Degraded habitat (see Table 4) a. lack of bank vegetation/canopy (= poor bank stability, lack of shade) b. excessive sedimentation (= poor substrate and water clarity) c. lack of streamflow (= low dissolved oxygen, possible sedimentation, undesirable vegetation) Inter-related human activities or practices, land uses, and natural features or events contributing to degraded stream quality: 1.Deforestation/development/construction (largely via runoff from non-point sources) 2. Urbanization/industrialization (largely via runoff from non-point sources) 3. Agricultural operations (largely via runoff from non-point sources) 4. Municipal or industrial wastewater discharge (point source) 5. Artificial channelization or habitat alteration 6. Upstream impoundment, lake or pond 7. Drought conditions Page 10 of 13 udel98.doc
13 As reflected in the present study results, human land uses and practices, superimposed on the physical terrain, play a major role in controlling the degree of pollution or degradation in a stream system. Levels of benthic community impairment (or lack of it) have been statistically related to different physiographic land types, corresponding land uses and other anthropogenic factors, on a statewide scale using data generated from the AMNET program [13]. The following section discusses observed impairment of AMNET sites within each Water Management Area of the Upper Delaware Water Region, and possible contributing factors. Evaluation by WMA Watershed Management Area #1 extends from Clove Brook in the northernmost corner of New Jersey, to the Musconetcong River, with a total of 74 AMNET sites sampled (see Maps 1, 2, 3, & 4). Figure 6 shows that the majority of the sites (68.9%) were rated as nonimpaired while the remaining 31.1% were rated as moderately impaired. No sites were found to be severely impaired. A significant improvement over the earlier results was seen at seven sites, and a significant decline at eight sites (see Table 2). Figure 7 depicts the results of the 1993 survey for comparison. While the Figure 7 Severely impaired 1% Moderately impaired 26% Watershed Management Area Bioassessment Results Non-impaired 73% Moderately impaired Figure 6 Watershed Management Area Bioassessment Results Musconetcong River drainage has exhibited a slight increase in NJIS scores over those of the earlier (1992, 93) study, WMA 1 is otherwise unchanged. Habitat scores are fairly evenly split between "optimal" and "suboptimal," indicating that physiochemical conditions are optimal, even where habitat is less than optimal. Overall, suboptimal habitat is a possible contributing factor in 72% of impaired sites; water quality or physiochemical conditions may be involved in 58% of impaired sites, including 8% from lakes situated upstream of the sampling site. In the current samples, abnormalities in chironomid larvae were found to be chronic at eight sites (AN0039, AN0041, AN0045, AN0052, AN0055, AN0065, AN0070, and AN0072); eleven additional sites, although without chronic abnormalities, exhibited significant levels of abnormalities in both chironomid larvae and other invertebrates (see Table 3). 31.1% Non-impaired 68.9% Page 11 of 13 udel98.doc
14 Watershed Management Area #11 extends from Hakihokoke Creek in northern Hunterdon County to the Assunpink Creek in Trenton, with a total of 47 AMNET sites sampled (see Maps 5, & 6). Figure 8 shows that 53.2% of the sites were rated non-impaired, 44.7% were rated as moderately impaired, and only one site (2.1%) was rated as severely impaired. A significant improvement was seen at nine sites, and a significant decline at four sites (see Table 2). Figure 9 depicts the results of the earlier (1993) survey for comparison. Severely impaired Figure 8 Overall, WMA #11 exhibited a slight increase in NJIS scores over those of the previous study, especially in the Assunpink Creek drainage. The degree of biological impairment in the Assunpink, Watershed Management Area Bioassessment Results however, is generally greater than in the smaller drainages to the north. Habitat scores from WMA #11 sites are favorable, except in the lower Assunpink creek Severely impaired 14% (which flows through the urban Trenton area), thus it Non-impaired appears that physiochemical conditions are having the 56% Moderately greater influence on impairment levels. Physiochemical impaired conditions appear to be factors in 52% of impaired sites, 30% Figure 9 and suboptimal habitat in 41%. Agriculture is a possible source of degraded (physiochemical or habitat) conditions in 34% of impaired sites. In the current study, abnormalities in chironomid larvae were found to be chronic at three sites (AN0100, AN0106, and AN0113), while nine additional sites, although without chronic abnormalities, exhibited significant levels of abnormalities in chironomid larvae (see Table 3). 2.1% Moderately impaired 44.7% Watershed Management Area Bioassessment Results Non-impaired 53.2% Watershed Management Area #2 encompasses the Wallkill River and its tributaries, with 17 AMNET sites sampled (see Map 7). As shown in Figure 10, a nonimpaired rating was given to 17.6% of the sites, while 1997 Bioassessment Results Watershed Management Area 2 the remaining 82.4% were given a moderately impaired rating. No site was found to be severely Non-impaired impaired, yet no sites were found to be significantly 18% Moderately impaired improved. A significant decline was seen at eight sites 82% (see Table 2). Figure 11 depicts the results of the 1993 survey for comparison. Since it was first studied Figure 10 under the AMNET program [6], there has been a general decline in NJIS scores in the Wallkill area. Biological impairment is largely attributed to physiochemical conditions, although suboptimal habitat may be a factor in 64% of impaired sites. Agriculture Moderately impaired Watershed Management Area Bioassessment Results appears to be contributing to degraded conditions at 71% of impaired sites. No abnormalities in chironomid larvae or other invertebrates were found in WMA #2 during the current sampling period (see Table 3). 29% Figure 11 Non-impaired 71% Page 12 of 13 udel98.doc
15 REFERENCES 1. U.S. Environmental Protection Agency and Basic water monitoring program. EPA 440/ USEPA. Washington, D.C. 25 pp. and appendices. 2. Plafkin, J.L., M.T. Barbour, K.D. Porter, S.K. Gross and R.M. Hughes, Rapid bioassessment protocols for use in streams and rivers benthic macroinvertebrates and fish. EPA/44/ US Environmental Protection Agency. Washington, D.C. 143pp. and appendices. 3. New Jersey Department of Environmental Protection State water quality inventory report. Office of Land and Water Planning. Trenton, N.J. 468pp. 4. Klemm, D.J., P.A. Lewis, F. Fulk and J.M. Lazorchak Macroinvertebrate field and laboratory methods for evaluating the biological integrity of surface waters. EPA/600/4-90/030. U.S. Environmental Protection Agency. Cincinnati, OH. 206pp. and appendices. 5. New Jersey Department of Environmental Protection. Data report, Ambient biomonitoring network, upper Delaware drainage basin. Bureau of Water Monitoring. Trenton. 8pp. and maps and appendices. 6. New Jersey Department of Environmental Protection. Data report, Ambient biomonitoring network, Arthur Kill, Passaic, Hackensack, and Wallkill River drainage basins. Bureau of Water Monitoring. Trenton, NJ. 10pp. and maps and appendices. 7. New Jersey Department of Environmental Protection. Data report, New Jersey s modernized ambient chemical monitoring network. Division of Watershed Management. Trenton. 12pp. 8. New Jersey Department of Environmental Protection Field sampling procedures manual. NJDEP. Trenton, NJ 360pp. 9. New Jersey Department of Environmental Protection. Unpublished report, Standard operating procedures for the aquatic biomonitoring laboratory. Bureau of Freshwater & Biological Monitoring. Trenton. 10. Kurtenbach, J A method for rapid bioassessment of streams in New Jersey using benthic macroinvertebrates. Bull. N. Am. Benth. Soc. 8(1): Barbour, M.T., J. Gerritson, B.D. Snyder and J.B. Stribling Revision to rapid bioassessment protocols for use in streams and rivers: periphyton, benthic macroinverbrates, and fish. USEPA 841-D Chp and appendices. 12. New Jersey Department of Environmental Protection New Jersey State ECOMAP. State Forestry Services. Trenton. 13. U.S. Geological Survey Relation of benthic macroinvertebrate community impairment to basin characteristics in New Jersey streams. Fact Sheet FS USGS. West Trenton, NJ. Page 13 of 13 udel98.doc
16 TABLE 1 BIOLOGICAL CRITERIA FOR SCREENING WATER QUALITY IN NEW JERSEY FRESHWATER STREAMS * Scoring Criteria for Rapid Bioassessments 1 Biometrics Taxa Richness (total Families) > E+P+T Index 2 (EPT) > Percent Dominance 3 (%CDF) < >60 Percent EPT 4 (%EPT) > <10 Modified Family Biotic Index 5 (FBI) <5 5-7 >7 NOTE: The previous AMNET reports ( ) contained incorrect number ranges for Modified Family Biotic Index. Using the incorrect numbers could lower the biological assessment on 9% of the sites evaluated. The numbers now presented in this table are correct and scores from previous reports were calculated using these ranges. No incorrect biological assessments exist in the previous reports. Attributes Biological Assessment Total Score Non-impaired Moderately Impaired 9-21 Severely Impaired 0-6 Non-impaired: benthic community comparable to other undisturbed streams within the region; community characterized by a maximum taxa richness, balanced taxa groups, and good representation of intolerant individuals. Moderately Impaired: macroinvertebrate richness reduced, in particular EPT taxa; reduced community balance and numbers of intolerant taxa. Severely Impaired: benthic community dramatically different from those in less impaired situations; macroinvertebrates dominated by a few taxa, but with many individuals; only tolerant individuals present. * From Kurtenbach, 1991, based on RBP II protocols. 1 Follows RBP Protocol II; using 100 organism subsample, family level taxonomy 2 Ephemeroptera, Plecoptra, Trichoptera 3 % contribution of the dominant family 4 Including the hydropsychid family 5 Also known as the Hilsenhoff Biotic Index
17 New Jersey AMNET Study 1998 Upper Delaware Region Station NJ Impairment Score 92 / / 98 Change in Rating Habitat Score Table 2 Comparative Scores / Ratings (see notes) Watershed Management Areas 1, 2, and 11 Station NJ Impairment Score 92 / / 98 Change in Rating Habitat Score Station NJ Impairment Score 92 / / 98 Change in Rating / / / A / / / / / / / / A / / / / / / / / / / / / / / / / / / / / / / / / / / / / / / / / / / / / / / / / / A / / / / / / / / / / / A / / B / / / / A / / / / / / / / A / / / / / / / / Habitat Score NOTES: Comparison of NJ impairment score with earlier study results: + indicates positive change in rating indicates negative change in rating / indicates no change in rating /+ or /- indicates change in score, but not in rating (see Table 1) NJ Impairment Score Value Habitat Score Value Non-Impaired Optimal Moderately Impaired 9-21 Sub-optimal Severely Impaired 0-6 Marginal Poor <60 udel98.doc
18 New Jersey AMNET Study 1998 Upper Delaware Region Table 2 (continued) Comparative Scores / Ratings (see notes) Watershed Management Areas 1, 2, and 11 Station NJ Impairment Score 92 / / 98 Change in Rating Habitat Score Station NJ Impairment Score 92 / / 98 Change in Rating Habitat Score Station NJ Impairment Score 92 / / 98 Change in Rating Habitat Score / / / / / / A NOTES: Comparison of NJ impairment score with earlier study results: + indicates positive change in rating indicates negative change in rating / indicates no change in rating /+ or /- indicates change in score, but not in rating (see Table 1) NJ Impairment Score Value Habitat Score Value Non-Impaired Optimal Moderately Impaired 9-21 Sub-optimal Severely Impaired 0-6 Marginal Poor <60 udel98.doc
19 New Jersey AMNET Study 1998 Upper Delaware Region Table 3 NOTES: Macroinvertebrate Abnormalities (see notes) Watershed Management Areas 1, 2, and 11 Station 1992 / / 98 Station 1992 / / 98 Station 1992 / / /12 * 085 3/54 * 004 1/9 * 089 1/ / /30 * 014 4/15 * 093 1/ /8 * 096 1/16 * 027 2/16 * 099 3/24 * 028 1/ * 100 2/31 * 3/22 * 031 2/6 * /27 * / /24 * 039 3/15 * 4/11 * 106 1/30 4/ * 041 1/16 * 2/12 * 107 1/5 * 042 3/ * /30 109A /6 * 4/20 * 109B 1/15 * 052 3/30 * 1/ /24 * 054 1/13 * 112 2/21 * 055 1/12 * 1/12 * 113 1/34 1/ /28 * 114 1/ /8 * /32 115A 1/ / / * 294 1/8 * 062 3/24 * 302 1/10 * 064 1/ /9 * 065 2/10 * 3/9 + 1 * 308 2/22 * 066 4/19 * 309 1/ / /3 * 069 2/14 * /31 2/ /14 * 2/ * /9 * 076 1/ /16 * 079 1/13 * 080 2/33 * 083 5/35 * 084 2/61 # chironomids with deformities / # chironomids examined + indicates the number of non-chironomids having abnormalities. * indicates significant levels (> 5%), although not statistically evaluated. abnormalities considered chronic if they appear in both the 1992 / 1993 and the 1997 / 1998 columns. udel98.doc
20 Table 4 HABITAT ASSESSMENT FOR HIGH GRADIENT STREAMS Habitat Condition Category Parameter Optimal Suboptimal Marginal Poor 1. Epifaunal Substrate/Available Cover Greater than 50% of substrate favorable for epifaunal colonization and fish cover; mix of snags, submerged logs, undercut banks, cobble or other stable habitat and at stage to allow full colonization potential (i.e., logs/snags that are not new fall and not transient) % mix of stable habitat; well suited for full colonization potential; adequate habitat for maintenance of populations; presence of additional substrate in the form of newfall, but not yet prepared for colonization (may rate at high end of scale) % mix of stable habitat; habitat availability less than desirable; substrate frequently disturbed or removed. Less than 10% stable habitat; lack of habitat is obvious; substrate unstable or lacking. SCORE Embeddedness Gravel, cobble, and boulder particles are 0-25% surrounded by fine sediment. Gravel, cobble, and boulder particles are 25-50% surrounded by fine sediment. Gravel, cobble, and boulder particles are 50-75% surrounded by fine sediment. Gravel, cobble, and boulder particles are more than 75% surrounded by fine sediment. SCORE Riffle Quality Well-developed riffle and run; riffle is as wide as stream and length extends two times the width of stream; abundance of cobble. (Boulders prevalent in headwater streams). Riffle is as wide as stream but length is less than two times width; abundance of cobble; boulders and gravel common. Run area may be lacking; riffle not as wide as stream and its length is less than 2 times the stream width; gravel or bedrock prevalent; some cobble present. Riffles or runs virtually nonexistent; bedrock prevalent; cobble lacking SCORE Sediment Deposition Little or no enlargement of islands or point bars and less than 5% (<20% for low-gradient streams) of the bottom affected by sediment deposition. Some new increase in bar formation, mostly from gravel, sand or fine sediment; 5-30% (20-50% for low-gradient) of the bottom affected; slight deposition in pools. Moderate deposition of new gravel, sand or fine sediment on old and new bars; 30-50% (50-80% for low-gradient) of the bottom affected; sediment deposits at obstructions, constrictions, and bends; moderate deposition of pools prevalent. Heavy deposits of fine material, increased bar development; more than 50% (80% for low-gradient) of the bottom changing frequently; pools almost absent due to substantial sediment deposition. SCORE Channel Flow Status Water reaches base of both lower banks, and minimal amount of channel substrate is exposed. Water fills >75% of the available channel; or <25% of channel substrate is exposed. Water fills 25-75% of the available channel, and/or riffle substrates are mostly exposed. Very little water in channel and mostly present as standing pools. SCORE Channel Alteration Channelization or dredging absent or minimal; stream with normal pattern. Some channelization present, usually in areas of bridge abutments; evidence of past channelization, i.e., dredging, (greater than past 20 yrs.) may be present, but recent channelization is not present. Channelization may be extensive; embankments or shoring structures present on both banks; and 40 to 80% of stream reach channelized and disrupted. Banks shored with gabion or cement; over 80% of the stream reach channelized and disrupted. In stream habitat greatly altered or removed entirely. SCORE Frequency of Riffles (or bends) Occurrence of riffles relatively frequent; ratio of distance between riffles divided by width of the stream <7:1 (generally 5 to 7); variety of habitat is key. In streams where riffles are continuous, placement of boulders or other large, natural obstruction is important. All 4 velocity/depth patterns present. Occurrence of riffles infrequent; distance between riffles divided by the width of the stream is between 7 to 15. Only 3 of 4 velocity/depth patterns present (i.e. slow [<0.3 m/s]-deep [>0.5 m]; slow-shallow; fastdeep; fast-shallow). Occasional riffle or bend; bottom contours provide some habitat; distance between riffles divided by the width of the stream is between 15 to 25. May be only 2 velocity/depth patterns present; usually lacking deep areas. Generally all flat water or shallow riffles; poor habitat; distance between riffles divided by the width of the stream is a ratio of >25. Dominated by one velocity/depth pattern. SCORE Bank Stability (score each bank) Note: determine left or right side by facing downstream. Banks stable; evidence of erosion or bank failure absent or minimal; little potential for future problems. <5% of bank affected. Moderately stable; infrequent, small areas of erosion mostly healed over. 5-30% of bank in reach has areas of erosion. Moderately unstable; 30-60% of bank in reach has areas of erosion; high erosion potential during floods. Unstable; many eroded areas; "raw" areas frequent along straight sections and bends; obvious bank sloughing; % of bank has erosional scars. SCORE (LB) Left Bank SCORE (RB) Right Bank Bank Vegetative Protection (score each bank) More than 90% of the streambank surfaces and immediate riparian zone covered by native vegetation, including trees, under story shrubs, or nonwoody macrophytes; vegetative disruption through grazing or mowing minimal or not evident; almost all plants allowed to grow naturally % of the streambank surfaces covered by native vegetation, but one class of plants is not well-represented; disruption evident but not affecting full plant growth potential to any great extent; more than one-half of the potential plant stubble height remaining % of the streambank surfaces covered by vegetation; disruption obvious; patches of bare soil or closely cropped vegetation common; less than one-half of the potential plant stubble height remaining. Less than 50% of the streambank surfaces covered by vegetation; disruption of streambank vegetation is very high; vegetation has been removed to 5 centimeters or less in average stubble height. SCORE (LB) Left Bank SCORE (RB) Right Bank Riparian Vegetative Zone Width (score each bank riparian zone) Width of riparian zone >18 meters; human activities (i.e., parking lots, roadbeds, clear-cuts, lawns, or crops) have not impacted zone. Width of riparian zone meters; human activities have impacted zone only minimally. Width of riparian zone 6-12 meters; human activities have impacted zone a great deal. Width of riparian zone <6 meters: little or no riparian vegetation due to human activities. SCORE (LB) Left Bank SCORE (RB) Right Bank HABITAT SCORES VALUE OPTIMAL 160 C 200 SUB-OPTIMAL 110 C 159 MARGINAL 60 C 109 POOR < 60
21 Table 4 (cont.) HABITAT ASSESSMENT FOR LOW GRADIENT STREAMS Habitat Condition Category Parameter Optimal Suboptimal Marginal Poor 1. Epifaunal Substrate/Available Cover Greater than 50% of substrate favorable for epifaunal colonization and fish cover; mix of snags, submerged logs, undercut banks, cobble or other stable habitat and at stage to allow full colonization potential (i.e., logs/snags that are not new fall and not transient) % mix of stable habitat; well suited for full colonization potential; adequate habitat for maintenance of populations; presence of additional substrate in the form of newfall, but not yet prepared for colonization (may rate at high end of scale) % mix of stable habitat; habitat availability less than desirable; substrate frequently disturbed or removed. Less than 10% stable habitat; lack of habitat is obvious; substrate unstable or lacking. SCORE Pool Substrate Characterization Mixture of substrate materials, with gravel and firm sand prevalent; root mats and submerged vegetation common. Mixture of soft sand, mud, or clay; mud may be dominant; some root mats and submerged vegetation present. All mud or clay or sand bottom; little or no root mat; no submerged vegetation. Hard-pan clay or bedrock; no root mat or vegetation. SCORE Pool Variability Even mix of large-shallow, largedeep, small-shallow, small-deep pools present. Majority of pools large-deep; very few shallow. Shallow pools much more prevalent than deep pools. Majority of pools small-shallow or pools absent. SCORE Sediment Deposition Little or no enlargement of islands or point bars and less than 5% <20% for low-gradient streams) of the bottom affected by sediment deposition. Some new increase in bar formation, mostly from gravel, sand or fine sediment; 5-30% (20-50% for low-gradient) of the bottom affected; slight deposition in pools. Moderate deposition of new gravel, sand or fine sediment on old and new bars; 30-50% (50-80% for low-gradient) of the bottom affected; sediment deposits at obstructions, constrictions, and bends; moderate deposition of pools prevalent. Heavy deposits of fine material, increased bar development; more than 50% (80% for low-gradient) of the bottom changing frequently; pools almost absent due to substantial sediment deposition. SCORE Channel Flow Status Water reaches base of both lower banks, and minimal amount of channel substrate is exposed. Water fills >75% of the available channel; or <25% of channel substrate is exposed. Water fills 25-75% of the available channel, and/or riffle substrates are mostly exposed. Very little water in channel and mostly present as standing pools. SCORE Channel Alteration Channelization or dredging absent or minimal; stream with normal pattern. Some channelization present, usually in areas of bridge abutments; evidence of past channelization, i.e., dredging, (greater than past 20 yrs.) may be present, but recent channelization is not present. Channelization may be extensive; embankments or shoring structures present on both banks; and 40 to 80% of stream reach channelized and disrupted. Banks shored with gabion or cement; over 80% of the stream reach channelized and disrupted. In stream habitat greatly altered or removed entirely. SCORE Channel Sinuosity The bends in the stream increase the stream length 3 to 4 times longer than if it was in a straight line. (Note - channel braiding is considered normal in coastal plains and other low-lying areas. This parameter is not easily rated in these areas. The bends in the stream increase the stream length 2 to 3 times longer than if it was in a straight line. The bends in the stream increase the stream length 2 to 1 times longer than if it was in a straight line. Channel straight; waterway has been channelized for a long distance. SCORE Bank Stability (score each bank) Banks stable; evidence of erosion or bank failure absent or minimal; little potential for future problems. <5% of bank affected. Moderately stable; infrequent, small areas of erosion mostly healed over. 5-30% of bank in reach has areas of erosion. Moderately unstable; 30-60% of bank in reach has areas of erosion; high erosion potential during floods. Unstable; many eroded areas; "raw" areas frequent along straight sections and bends; obvious bank sloughing; % of bank has erosional scars. SCORE (LB) Left Bank SCORE (RB) Right Bank Bank Vegetative Protection (score each bank) Note: determine left or right side by facing downstream. More than 90% of the streambank surfaces and immediate riparian zone covered by native vegetation, including trees, under story shrubs, or nonwoody macrophytes; vegetative disruption through grazing or mowing minimal or not evident; almost all plants allowed to grow naturally % of the streambank surfaces covered by native vegetation, but one class of plants is not well-represented; disruption evident but not affecting full plant growth potential to any great extent; more than one-half of the potential plant stubble height remaining % of the streambank surfaces covered by vegetation; disruption obvious; patches of bare soil or closely cropped vegetation common; less than one-half of the potential plant stubble height remaining. Less than 50% of the streambank surfaces covered by vegetation; disruption of streambank vegetation is very high; vegetation has been removed to 5 centimeters or less in average stubble height. SCORE (LB) Left Bank SCORE (RB) Right Bank Riparian Vegetative Zone Width (score each bank riparian zone) Width of riparian zone >18 meters; human activities (i.e., parking lots, roadbeds, clear-cuts, lawns, or crops) have not impacted zone. Width of riparian zone meters; human activities have impacted zone only minimally. Width of riparian zone 6-12 meters; human activities have impacted zone a great deal. Width of riparian zone <6 meters: little or no riparian vegetation due to human activities. SCORE (LB) Left Bank SCORE (RB) Right Bank HABITAT SCORES VALUE OPTIMAL 160 C 200 SUB-OPTIMAL 110 C 159 MARGINAL 60 C 109 POOR < 60
22 MAPS 1998 Upper Delaware AMNET Study WMAs 1, 2, & 11 AMNET site locations and their respective biological ratings, for each major sub-basin, are shown in maps 1-7. Also identified are sites that exhibited significant and chronic macroinvertebrate abnormalities.
23 Appendix A Station Numbers and Locations for the 1998 Upper Delaware Region AMNET Study Site Stream Latitude Longitude Watershed Management Area AN0001 Clove Bk 41 18'53.373"N 74 40'07.154"W 1 AN0002 Clove Bk 41 21'06.335"N 74 41'10.161"W 1 AN0003 Shimers Bk 41 18'46.731"N 74 46'43.451"W 1 AN0004 Little Flat Bk 41 17'02.719"N 74 45'29.275"W 1 AN0005 Little Flat Bk 41 15'45.716"N 74 47'33.516"W 1 AN0005A Little Flat Bk 41 11'54.521"N 74 50'08.747"W 1 AN0006 Big Flat Bk 41 12'00.054"N 74 48'55.832"W 1 AN0007 Flat Bk 41 09'25.965"N 74 52'38.074"W 1 AN0008 Flat Bk 41 06'05.606"N 74 57'43.855"W 1 AN0009 Van Campens Bk 41 05'43.209"N 74 55'45.708"W 1 AN0010 Van Campens Bk 41 04'22.070"N 74 57'45.202"W 1 AN0011 Van Campens Bk 41 03'27.651"N 75 00'11.308"W 1 AN0012 Dunnfield Ck 40 58'14.065"N 75 07'34.898"W 1 AN0013 Stony Bk 40 56'22.413"N 75 06'13.117"W 1 AN0014 UNT to Paulins Kill 41 04'00.778"N 74 41'15.963"W 1 AN0015 Paulins Kill 41 05'07.878"N 74 41'57.964"W 1 AN0016 UNT to Paulins Kill 41 06'21.295"N 74 40'56.237"W 1 AN0017 Culvers Ck 41 10'05.657"N 74 47'30.702"W 1 AN0018 Culvers Ck 41 09'21.025"N 74 46'57.541"W 1 AN0019 Dry Bk 41 10'09.042"N 74 44'10.326"W 1 AN0020 Dry Bk 41 08'36.840"N 74 44'43.274"W 1 AN0021 Paulins Kill 41 06'13.513"N 74 45'29.351"W 1 AN0022 Paulins Kill 41 03'08.907"N 74 49'40.505"W 1 AN0023 Troy Bk 41 03'33.471"N 74 51'11.835"W 1 AN0023A Troy Bk 41 05'05.510"N 74 49'37.287"W 1 AN0024 Trout Bk 41 03'20.519"N 74 51'41.591"W 1 AN0025 Paulins Kill 40 58'52.121"N 74 57'12.460"W 1 AN0025A Blair Ck 41 04'19.874"N 74 55'13.513"W 1 AN0026 Blair Ck 41 03'00.829"N 74 56'40.113"W 1 AN0027 Blair Ck 40 58'54.804"N 74 57'35.356"W 1 AN0028 Jacksonburg Ck 41 02'20.775"N 74 57'53.670"W 1 AN0029 Jacksonburg Ck 40 59'14.684"N 1 Site AN0030 AN0031 AN0032 AN0032A AN0033 AN0034 AN0035 AN0036 AN0037 AN0038 AN0039 AN0040 AN0040A AN0041 AN0042 AN0043 AN0044 AN0045 AN0046 AN0047 AN0048 AN0049 AN0050 AN0051 AN0052 AN0053 AN0054 AN0055 AN0056 AN0057 AN0058 Stream Yards Ck Yards Ck Paulins Kill Paulins Kill Delawanna Ck Ramseysburg Ck Pequest R UNT to Pequest R Pequest R Trout Bk Pequest R Bear Ck Bear Ck Pequest R Furnace Bk Pequest R Mountain Lake Bk Beaver Bk Honey Run Beaver Bk Pequest R Pophandusing Bk Buck Horn Ck Lopatcong Ck Lopatcong Ck Lopatcong Ck Pohatcong Ck Pohatcong Ck Brass Castle Ck Pohatcong Ck Pohatcong Ck Latitude Longitude 74 58'43.178"W Watershed Management Area 40 59'43.000"N 75 01'55.902"W '23.847"N 75 03'34.777"W '15.243"N 75 05'17.479"W '00.450"N 75 01'14.763"W '52.815"N 75 04'19.347"W '05.044"N 75 03'36.520"W '51.811"N 74 45'59.931"W '07.663"N 74 45'52.968"W '50.814"N 74 46'35.360"W '48.127"N 74 49'08.167"W '17.022"N 74 50'25.852"W '48.566"N 74 53'05.961"W '30.344"N 74 50'57.831"W '58.398"N 74 54'19.347"W '21.769"N 74 59'06.341"W '49.847"N 74 58'39.953"W '10.847"N 74 59'07.246"W '33.270"N 74 56'32.780"W '33.971"N 74 58'40.558"W '36.857"N 75 02'46.374"W '45.841"N 75 04'55.768"W '20.221"N 75 04'50.983"W '17.971"N 75 07'50.883"W '24.624"N 75 07'15.934"W '07.878"N 75 08'12.891"W '38.350"N 75 10'01.855"W '18.689"N 74 53'59.968"W '06.111"N 74 57'41.175"W '53.533"N 75 00'43.295"W '41.365"N 75 00'49.018"W '57.959"N 75 04'18.230"W 1 Page 1 of 3
24 Appendix A Station Numbers and Locations for the 1998 Upper Delaware Region AMNET Study Site Stream Latitude Longitude Watershed Management Area AN0059 Merrill Ck 40 45'00.107"N 75 05'06.940"W 1 AN0060 Merrill Ck 40 41'11.491"N 75 06'29.268"W 1 AN0061 Pohatcong Ck 40 37'29.855"N 75 11'08.755"W 1 AN0062 Musconetcong R 40 55'01.431"N 74 39'56.687"W 1 AN0063 Musconetcong R 40 54'08.398"N 74 42'48.549"W 1 AN0064 Musconetcong R 40 55'15.877'N 74 43'54.037"W 1 AN0065 Lubbers Run 40 57'51.270"N 74 40'28.210"W 1 AN0066 Lubbers Run 40 55'35.979"N 74 43'07.086"W 1 AN0067 Mine Brook 40 49'58.240"N 74 49'22.029"W 1 AN0068 Trout Brook 40 49'46.217"N 74 49'52.241"W 1 AN0069 Musconetcong R 40 48'46.767"N 74 50'29.995"W 1 AN0070 Hances Brook 40 48'16.140"N 74 51'37.606"W 1 AN0071 UNT to Musconetcong R 40 47'00.267"N 74 54'02.633"W 1 AN0072 Musconetcong R 40 43'22.996"N 74 57'35.801"W 1 AN0073 Musconetcong R 40 39'19.616"N 75 05'19.716"W 1 AN0074 Musconetcong R 40 35'33.407"N 75 11'17.230"W 1 AN0075 Hakihokake Ck 40 37'42.344"N 75 05'04.447"W 11 AN0076 Hakihokake Ck 40 35'02.591"N 75 05'07.655"W 11 AN0077 Hakihokake Ck 40 34'06.359"N 75 05'42.610"W 11 AN0078 Harihokake Ck 40 36'00.393"N 75 01'50.641"W 11 AN0079 Harihokake Ck 40 32'53.072"N 75 04'07.766"W 11 AN0080 Nishisakawick Ck 40 35'20.651"N 75 00'34.071"W 11 AN0081 Nishisakawick Ck 40 32'56.275"N 75 02'03.953"W 11 AN0082 Nishisakawick Ck 40 31'38.526"N 75 03'32.940"W 11 AN0083 Little Nishisakawick Ck 40 31'22.623"N 75 03'41.890"W 11 AN0084 Copper Ck 40 30'39.544"N 75 02'43.388"W 11 AN0085 Warford Ck 40 28'09.916"N 75 03'43.655"W 11 AN0086 Lockatong Ck 40 32'02.357"N 74 57'11.604"W 11 AN0087 Lockatong Ck 40 31'01.719"N 74 59'30.835"W 11 AN0088 Lockatong Ck 40 28'16.532"N 75 01'16.150"W 11 AN0089 Lockatong Ck 40 24'28.293"N 75 00'50.967"W 11 AN0090 Wickecheoke Ck 40 30'34.613"N 11 Site AN0091 AN0092 AN0093 AN0094 AN0095 AN0096 AN0097 AN0098 AN0099 AN0100 AN0101 AN0102 AN0103 AN0104 AN0105 AN0106 AN0107 AN0108 AN0109 AN0109A AN0109B AN0110 AN0111 AN0112 AN0113 AN0114 AN0115 AN0115A AN0116 AN0117 AN0118 Stream Wickecheoke Ck Plum Brook Plum Brook Wickecheoke Ck Wickecheoke Ck Alexauken Ck UNT to Alexauken Ck Alexauken Ck Swan Ck Moores Ck Moores Ck Jacobs Ck Airport Br of Jacobs Ck Woolseys Bk Jacobs Ck Jacobs Ck Gold Run Assunpink Ck Assunpink Ck Assunpink Ck New Sharon Br UNT to Shipetaukin Ck Shipetaukin Ck Little Shabakunk Ck Shabakunk Ck Shabakunk Ck Miry Run Miry Run Assunpink Ck Pond Run Assunpink Ck Latitude Longitude 74 55'49.813"W Watershed Management Area 40 29'08.865"N 74 58'13.799"W '46.410"N 74 55'40.768"W '49.932"N 74 58'04.041"W '38.138"N 74 57'57.999"W '41.329"N 74 59'11.194"W '49.353"N 74 54'10.197"W '22.175"N 74 55'10.615"W '50.158"N 74 56'52.659"W '50.273"N 74 56'42.853"W '39.621"N 74 53'08.715"W '26.394"N 74 55'01.395"W '29.374"N 74 50'18.357"W '24.047"N 74 50'26.702"W '27.419"N 74 49'35.358"W '25.937"N 74 50'01.804"W '42.298"N 74 51'12.939"W '34.962"N 74 49'19.588"W '43.204"N 74 28'37.300"W '29.782"N 74 37'03.130"W '06.002"N 74 33'37.024"W '59.755"N 74 33'38.479"W '11.335"N 74 43'30.882"W '46.003"N 74 42'17.453"W '44.226"N 74 43'03.763"W '06.648"N 74 45'59.203"W '13.579"N 74 44'31.498"W '49.546"N 74 41'13.758"W '04.950"N 74 37'35.147"W '08.450"N 74 44'19.749"W '56.316"N 74 41'25.388"W '01.939"N 74 45'58.939"W 11 Page 2 of 3
25 Appendix A Station Numbers and Locations for the 1998 Upper Delaware Region AMNET Study Site AN0294 AN0295 AN0296 AN0297 AN0298 AN0299 AN0300 AN0301 AN0302 AN0303 AN0304 AN0305 AN0306 AN0307 AN0308 AN0309 AN0309A Stream Lake Lookout Bk Wawayanda Ck Black Ck Wallkill R Wallkill R Wallkill R Wallkill R Beaver Run Wallkill R Papakating Ck Papakating Ck W Br Papakating Ck W Br Papakating Ck Papakating Ck UNT to Clove Bk Clove Bk Clove Bk Latitude Longitude Watershed Management Area 41 11'31.864"N 74 24'58.251"W '40.705"N 74 28'02.504"W '22.080"N 74 28'32.078"W '20.323"N 74 37'48.469"W '12.932"N 74 35'41.539"W '00.210"N 74 34'43.645"W '09.255"N 74 34'54.492"W '49.311"N 74 35'33.715"W '38.230"N 74 34'30.320"W '59.891"N 74 43'37.885"W '45.418"N 74 40'31.047"W '05.916"N 74 40'16.315"W '49.793"N 74 37'53.861"W '38.765"N 74 37'17.144"W '41.160"N 74 37'25.749"W '28.256"N 74 36'33.133"W '43.069"N 74 37'48.196"W 2 Page 3 of 3

26

27

28

29
30

31

32
33 APPENDIX B Pictures and Site Locations of Morphological Abnormalities in Larval Chironomidae and Amphipoda Recovered in the 1998 Upper Delaware AMNET Study


34 Chironomus riparius Note the abnormal teeth in the top picture and the normal teeth in the bottom picture. ABNORMAL* NORMAL** * Photograph taken by J. Kurtz, NJDEP. ** From: A Key to Some Larvae of Chironomidae (Diptera) From the Mackenzie & Porcupine River Watersheds, D.R. Oliver, D. McClymont, & M.E. Roussel, 1978, Fisheries & Marine Service Technical Report # 791.

35 Dicrotendipes nervosus Note that the antenna on the right is abnormal. The antennae on the left and in the bottom picture are normal. Antenna* NORMAL antenna** * Photograph taken by J. Kurtz, NJDEP. ** From: An Introduction to the Aquatic Insects of North America, second edition, R.W. Merritt & K.W. Cummins, 1988, Kendall/Hunt Publ. Co.

36 Micropsectra deflecta In the top picture note the left antenna is abnormal as compared to the normal antenna in the bottom picture. ABNORMAL* NORMAL** * Photograph taken by J. Kurtz, NJDEP. ** From: An Introduction to the Aquatic Insects of North America, second edition, R.W. Merritt & K.W. Cummins, 1988, Kendall/Hunt Publ. Co.

 From the Mackenzie & Porcupine River Watersheds, D.R. Oliver, D. McClymont, & M.E.")
37 Microtendipes sp. Note the abnormal teeth and antenna in the top picture compared to the bottom pictures, which depict normal antenna and teeth. The normal pictures on the bottom are magnified to show detail. ABNORMAL* NORMAL antenna** * Photograph taken by J. Kurtz, NJDEP. NORMAL teeth*** ** From: An Introduction to the Aquatic Insects of North America, second edition, R.W. Merritt & K.W. Cummins, 1988, Kendall/Hunt Publ. Co. *** From: A Key to Some Larvae of Chironomidae (Diptera) From the Mackenzie & Porcupine River Watersheds, D.R. Oliver, D. McClymont, & M.E. Roussel, 1978, Fisheries & Marine Service Technical Report # 791.

38 Microtendipes caducus Note the abnormal antenna in the top picture and compare to the lower picture, which depicts a normal antenna. ABNORMAL antenna * NORMAL antenna** * Photograph taken by J. Kurtz, NJDEP. ** From: An Introduction to the Aquatic Insects of North America, second edition, R.W. Merritt & K.W. Cummins, 1988, Kendall/Hunt Publ. Co.


39 Polypedilum convictum The first two pictures show abnormal teeth as compared to the normal teeth depicted in the picture below. The second picture is a higher magnification of the first one. ABNORMAL* ABNORMAL* NORMAL** * Photograph taken by J. Kurtz, NJDEP. ** From A Key to Some Larvae of Chironomidae (Diptera) From the Mackenzie & Porcupine River Watersheds, D.R. Oliver, D. McClymont, & M.E. Roussel, 1978, Fisheries & Marine Service Technical Report # 791.

 From the Mackenzie & Porcupine River")
40 Polypedilum fallax Note that in the top picture the teeth are absent or abnormal. Compare with the lower picture that shows a normal tooth pattern. ABNORMAL* NORMAL** * Photograph taken by J. Kurtz, NJDEP. ** From: A Key to Some Larvae of Chironomidae (Diptera) From the Mackenzie & Porcupine River Watersheds, D.R. Oliver, D. McClymont, & M.E. Roussel, 1978, Fisheries & Marine Service Technical Report # 791.


41 Gammarus fasciatus Note in the first three pictures that the left 1 st antenna and flagella are deformed and reduced. The right 1 st antenna is broken. The fourth picture shows normal flagella and antennae. Close-up of flagella on abnormal 1 st antenna Close-up of last segment on abnormal 1 st antenna with normal setae. Normal 1 st antennae and flagella Photographs taken by J. Kurtz, NJDEP.
BUREAU OF CLEAN WATER. Appendix C Biological Field Methods C1. Habitat Assessment DECEMBER 2013
 BUREAU OF CLEAN WATER Appendix C Biological Field Methods C1. Assessment DECEMBER 2013 HABITAT ASSESSMENT The Department has adopted the habitat assessment methods outlined in EPA s Rapid Bioassessment
C. STUDENT FIELD DATA SHEETS
 C. STUDENT FIELD DATA SHEETS Student Name Date Time Stream Location Parameter to find Your Group s Results Units trial trial average Transparency cm Water Temperature Air Temperature Weather N sunny N
Use of benthic invertebrate biological indicators in evaluating sediment deposition impairment on the Middle Truckee River, California
 Use of benthic invertebrate biological indicators in evaluating sediment deposition impairment on the Middle Truckee River, California David B. Herbst Sierra Nevada Aquatic Research Laboratory University
Step 6: Rapid Habitat Assessment (RHA)
") Step 6: Rapid Habitat Assessment (RHA) Background Physical processes, combined with chemical constituents and biological interactions, are what determine biological productivity and diversity; and, in
Step 6: Rapid Habitat Assessment (RHA) Background Physical processes, combined with chemical constituents and biological interactions, are what determine biological productivity and diversity; and, in
Monitoring and evaluation of benthic macroinvertebrates in the Big Hole River and tributaries
 Monitoring and evaluation of benthic macroinvertebrates in the Big Hole River and tributaries Michael A. Bias Big Hole River Foundation Introduction BMI used to evaluate stream biological health Quantifies
How Do Human Impacts and Geomorphological Responses Vary with Spatial Scale in the Streams and Rivers of the Illinois Basin?
 How Do Human Impacts and Geomorphological Responses Vary with Spatial Scale in the Streams and Rivers of the Illinois Basin? Bruce Rhoads Department of Geography University of Illinois at Urbana-Champaign
Geomorphic Assessment of the Middle and Lower Swan Lake Watershed, Calhoun Division of Two Rivers National Wildlife Refuge.
 Geomorphic Assessment of the Middle and Lower Swan Lake Watershed, Calhoun Division of Two Rivers National Wildlife Refuge Report Figures 33 34 Figure 1. Location of Middle and Lower Swan Lake watersheds
APPENDIX A REACH DECRIPTIONS. Quantico Creek Watershed Assessment April 2011
 APPENDIX A REACH DECRIPTIONS Basin 615, South Fork of Quantico Creek - Project Reach Descriptions Reach Name: 615-A Coordinates (NAD 83, Virginia State Plane North): 11796510.57, 6893938.95 to 11801555.79,
Mobrand to Jones and Stokes. Sustainable Fisheries Management Use of EDT
 Sustainable Fisheries Management Use of EDT Ecosystem Diagnosis and Treatment EDT EDT designed to provide a practical, science-based approach for developing and implementing watershed plans. Provides decision
Riparian Assessment. Steps in the right direction... Drainage Basin/Watershed: Start by Thinking Big. Riparian Assessment vs.
 Riparian Assessment vs. Monitoring Riparian Assessment What is a healthy stream? Determine stream/riparian health Determine change or trend, especially in response to mgmt Classification = designation
Rapid Geomorphic Assessments: RGA s
 Establishing Current Reference Conditions Rates and concentrations of suspended-sediment transport vary over time and space due to factors such as precipitation characteristics and discharge, geology,
low turbidity high turbidity
 What is Turbidity? Turbidity refers to how clear the water is. The greater the amount of total suspended solids (TSS) in the water, the murkier it appears and the higher the measured turbidity. Excessive
BZ471, Steam Biology & Ecology Exam
 BZ471, Eam1, p.1 BZ471, Steam Biology & Ecology Eam Name Multiple choice When benthic organisms enter the water column with a regular diel periodicity: a) catastrophic drift b) behavioral drift c) constant
Savannah District s Revised SOP: Moving Towards A Functional Approach. US Army Corps of Engineers BUILDING STRONG
 Savannah District s Revised SOP: Moving Towards A Functional Approach US Army Corps of Engineers Agenda SOP Revision Concept New Aquatic Resource Credit Types New Urban Mitigation Service Area Filter Background
Why Geomorphology for Fish Passage
 Channel Morphology - Stream Crossing Interactions An Overview Michael Love Michael Love & Associates mlove@h2odesigns.com (707) 476-8938 Why Geomorphology for Fish Passage 1. Understand the Scale of the
Limitation to qualitative stability indicators. the real world is a continuum, not a dichotomy ~ 100 % 30 % ~ 100 % ~ 40 %
 Stream Stability Assessment & BEHI Surveys Joe Rathbun MDEQ Water Resources Division rathbunj@michigan.gov 517--373 517 373--8868 Stability Stream can transport its water and sediment inputs without changing
PolyMet NorthMet Project
 RS 26 Draft-01 December 8, 2005 RS26 Partridge River Level 1 Rosgen Geomorphic Survey Rosgen Classification Partridge River from Headwaters to Colby Lake Prepared for PolyMet NorthMet Project December
Stream Ecological Assessment in Virginia Using INSTAR. Greg Garman Leonard Smock Stephen McIninch William Shuart Virginia Commonwealth University
 Stream Ecological Assessment in Virginia Using INSTAR Greg Garman Leonard Smock Stephen McIninch William Shuart Virginia Commonwealth University Interactive Stream Assessment Resource (INSTAR( INSTAR)
CR AAO Bridge. Dead River Flood & Natural Channel Design. Mitch Koetje Water Resources Division UP District
 CR AAO Bridge Dead River Flood & Natural Channel Design Mitch Koetje Water Resources Division UP District Old County Road AAO Bridge Map courtesy of Marquette County Silver Lake Basin McClure Basin
DETAILED DESCRIPTION OF STREAM CONDITIONS AND HABITAT TYPES IN REACH 4, REACH 5 AND REACH 6.
 DETAILED DESCRIPTION OF STREAM CONDITIONS AND HABITAT TYPES IN REACH 4, REACH 5 AND REACH 6. The Eklutna River was divided into study reaches (figure 1) prior to this site visit. Prominent geologic or
Dam Removal Analysis Guidelines for Sediment
 A review of: Dam Removal Analysis Guidelines for Sediment Joe Rathbun (Retired) rathbunj@sbcglobal.net Some Potential Sediment Issues Reservoir restoration Downstream water quality Downstream deposition
Section 4: Model Development and Application
 Section 4: Model Development and Application The hydrologic model for the Wissahickon Act 167 study was built using GIS layers of land use, hydrologic soil groups, terrain and orthophotography. Within
Natural Shoreline Landscapes on Michigan Inland Lakes
 Natural Shoreline Landscapes on Michigan Inland Lakes Excerpts from Chapters 2 and 3 Photo Photo by Jane by Jane Herbert Herbert Did you know? Twenty-four species of amphibians, 25 species of reptiles,
GENERAL SUMMARY BIG WOOD RIVER GEOMORPHIC ASSESSMENT BLAINE COUNTY, IDAHO
 GENERAL SUMMARY BIG WOOD RIVER GEOMORPHIC ASSESSMENT BLAINE COUNTY, IDAHO Prepared For Trout Unlimited 300 North Main Street, Hailey, Idaho, 83333 Prepared By P. O. Box 8578, 140 E. Broadway, Suite 23,
United States Department of the Interior NATIONAL PARK SERVICE Northeast Region
 United States Department of the Interior NATIONAL PARK SERVICE Northeast Region June 17, 2017 REQUEST FOR STATEMENTS OF INTEREST and QUALIFICATIONS Project Title: ASSESSMENT OF NATURAL RESOURCE CONDITION
Lower South Fork McKenzie River Floodplain Enhancement Project
 Lower South Fork McKenzie River Floodplain Enhancement Project McKenzie River Ranger District Willamette National Forest Project Location The project is located in the South Fork McKenzie River Watershed,
Clinton and Potter Counties, Pennsylvania
 Clinton and Potter Counties, Pennsylvania Prepared For: Trout Unlimited & Kettle Creek Watershed Association Prepared By: LARSON DESIGN GROUP, INC. 1000 COMMERCE PARK DRIVE WILLIAMSPORT, PA 17703-0487
Stream Geomorphology. Leslie A. Morrissey UVM July 25, 2012
 Stream Geomorphology Leslie A. Morrissey UVM July 25, 2012 What Functions do Healthy Streams Provide? Flood mitigation Water supply Water quality Sediment storage and transport Habitat Recreation Transportation
Weathering, Erosion, Deposition, and Landscape Development
 Weathering, Erosion, Deposition, and Landscape Development I. Weathering - the breakdown of rocks into smaller particles, also called sediments, by natural processes. Weathering is further divided into
Step 5: Channel Bed and Planform Changes
 Step 5: Channel Bed and Planform Changes When disturbed, streams go through a series of adjustments to regain equilibrium with the flow and sediment supply of their watersheds. These adjustments often
Sediment Distribution and Characteristics
 Sediment Distribution and Characteristics Sediments at the bottom of ponds are a source or sink for nutrients in relation to the water column, contribute to turbidity during storm events, serve as the
Watershed concepts for community environmental planning
 Purpose and Objectives Watershed concepts for community environmental planning Dale Bruns, Wilkes University USDA Rural GIS Consortium May 2007 Provide background on basic concepts in watershed, stream,
Stream Study LIFE SCIENCE STANDARDS. LEVELS K-4 LEVELS 5-8 LEVELS 9-12 Characteristics of organisms
 Stream Study LIFE SCIENCE STANDARDS Objectives: LEVELS K-4 LEVELS 5-8 LEVELS 9-12 Characteristics of organisms Structure and function in living systems Interdependence of organisms Life cycles of Populations
SECTION G SEDIMENT BUDGET
 SECTION G SEDIMENT BUDGET INTRODUCTION A sediment budget has been constructed for the for the time period 1952-2000. The purpose of the sediment budget is to determine the relative importance of different
In-channel coarse sediment trap Best Management Practice
 In-channel coarse sediment trap Best Management Practice By Henry R. Hudson July 2002 Environmental Management Associates Ltd., Christchurch Complexity Environmental Value Cost Low Moderate High Low Moderate
Appendix K.2: Sediment Management Excerpt from South Orange County Hydromodification Management Plan
 Appendix K.2: Sediment Management Excerpt from South Orange County Hydromodification Management Plan 4 Sediment Supply Management Requirements Permit Order R9-2013-0001 as amended by Order No. R9-2015-0001Section
Channel Assessments of Selected Watersheds within TFL 52
 Channel Assessments of Selected Watersheds within TFL 52 prepared for: West Fraser Mills Ltd. Quesnel, BC prepared by: John Berry, M.Sc., R.P.F. Victoria, BC Channel Assessments TFL 52 Summary SUMMARY
Kootenai River Habitat Restoration Program Update
 Kootenai River Habitat Restoration Program Update Kootenai Tribe of Idaho Kootenai Valley Resource Initiative November 19, 2012 Bonners Ferry, Idaho Changes to Kootenai Basin Beaver trapping Floodplain
Habitat Assessment. Peggy Compton UW-Extension Water Action Volunteers Program Coordinator
 Habitat Assessment Peggy Compton UW-Extension Water Action Volunteers Program Coordinator Adapted from a presentation by Jean Unmuth, Water Quality Biologist, WI DNR dnr.wi.gov www.uwex.edu erc.cals.wisc.edu
Assessment. Assessment
 2001 SPRINGBROOK CREEK RESTORATION - THREE YEAR POST-CONSTRUCTION REVIEW - Presented by Bruce Henderson and Andy Harris 2005 River Restoration Northwest Symposium Skamania Lodge, Washington www.hendersonlandservices.com
Erosion Surface Water. moving, transporting, and depositing sediment.
 + Erosion Surface Water moving, transporting, and depositing sediment. + Surface Water 2 Water from rainfall can hit Earth s surface and do a number of things: Slowly soak into the ground: Infiltration
ADDRESSING GEOMORPHIC AND HYDRAULIC CONTROLS IN OFF-CHANNEL HABITAT DESIGN
 ADDRESSING GEOMORPHIC AND HYDRAULIC CONTROLS IN OFF-CHANNEL HABITAT DESIGN Conor Shea - Hydrologist U.S. Fish and Wildlife Service Conservation Partnerships Program Arcata, CA Learning Objectives Examine
Juanita Bacey Environmental Scientist. Terrell Barry Research Scientist III. April 2008
 A Comparison Study of the Proper use of Hester-Dendy Samplers to Achieve Maximum Diversity and Population Size of Benthic Macroinvertebrates Sacramento Valley, California Juanita Bacey Environmental Scientist
SEARCHING FOR SEDIMENT SOURCES IN SPRING CREEK
 SEARCHING FOR SEDIMENT SOURCES IN SPRING CREEK Christopher Frederick, Department of Earth Sciences, University of South Alabama, Mobile, AL 36688. E-mail: cjf702@jaguar1.usouthal.edu. Sediment deposition
3.11 Floodplains Existing Conditions
 Other stormwater control practices may be needed to mitigate water quality impacts. In addition to detention facilities, other practices such as vegetated basins/buffers, infiltration basins, and bioswales
Upper Mississippi River Basin Environmental Management Program Workshop
 Presentation to the Upper Mississippi River Basin Environmental Management Program Workshop by Michael Rodgers River Engineer US Army Corps of Engineers, St. Louis District August 17, 2007 Engineering
Fish Passage at Road Crossings
 Fish Passage at Road Crossings 1 Crossing Design Workshop Outline 1:00 to 2:00 Intro, Design Overview, Channel Width 2:00 to 2:15 Break 2:15 to 3:15 No-Slope, Stream Simulation Design 3:15 to 3:30 Break
River Nith restoration, cbec UK Ltd, October 2013 APPENDIX A
 APPENDIX A FLUVIAL AUDIT METHOD STATEMENT Fluvial Audit Methodology INTRODUCTION The procedure used to characterize the geomorphic and sedimentary regimes of the River Till is an adaptation of the Fluvial
A Comprehensive Inventory of the Number of Modified Stream Channels in the State of Minnesota. Data, Information and Knowledge Management.
 A Comprehensive Inventory of the Number of Modified Stream Channels in the State of Minnesota Data, Information and Knowledge Management Glenn Skuta Environmental Analysis and Outcomes Division Minnesota
Instream Erosion Control General
 Instream Erosion Control General EROSION CONTROL TECHNIQUES Revegetation Temperate Climates Short-Term Non Vegetation Wet Tropics Long-Term Weed Control [1] Semi-Arid Zones Permanent [1] Weed control attributes
Birch Creek Geomorphic Assessment and Action Plan
 Birch Creek Geomorphic Assessment and Action Plan Jim Webster Tim Hanrahan, PhD, CFM Jesse Schwartz, PhD Zach Hill January 22, 2015 White Eagle Grange This Project is a First Step in Strategy Planning
Chapter 3 - White Oak River Subbasin Includes Bogue Sound and the Newport River
 Chapter 3 - White Oak River Subbasin 03-05-03 Includes Bogue Sound and the Newport River 3.1 Water Quality Overview Subbasin 03-05-03 at a Glance Land and Water Area (sq. mi.) Total area: 228 Land area:
Rosgen Classification Unnamed Creek South of Dunka Road
 Rosgen Classification Unnamed Creek South of Dunka Road Prepared for Poly Met Mining Inc. September 2013 Rosgen Classification Unnamed Creek South of Dunka Road Prepared for Poly Met Mining Inc. September
Watershed Assessment of River Stability and Sediment Supply: Advancing the Science of Watershed Analysis
 Watershed Assessment of River Stability and Sediment Supply: Advancing the Science of Watershed Analysis 2009 MWEA Annual Conference Rob Myllyoja, CET rmyllyoja@hrc-engr.com Watershed Assessment of River
Opportunities to Improve Ecological Functions of Floodplains and Reduce Flood Risk along Major Rivers in the Puget Sound Basin
 Opportunities to Improve Ecological Functions of Floodplains and Reduce Flood Risk along Major Rivers in the Puget Sound Basin Christopher Konrad, US Geological Survey Tim Beechie, NOAA Fisheries Managing
Project Proposal. Lyme Brook. Newcastle-under-Lyme. 3 rd July 2015
 Project Proposal Lyme Brook Newcastle-under-Lyme 3 rd July 2015 Contents Page 1.0 Introduction... 1.0 2.0 Background and rationale... 2.0 3.0 Proposed measures... 5 4.0 Summary of Recommendations... 10
EAGLES NEST AND PIASA ISLANDS
 EAGLES NEST AND PIASA ISLANDS HABITAT REHABILITATION AND ENHANCEMENT PROJECT MADISON AND JERSEY COUNTIES, ILLINOIS ENVIRONMENTAL MANAGEMENT PROGRAM ST. LOUIS DISTRICT FACT SHEET I. LOCATION The proposed
Assignment 1. Measuring River Characteristics- Vernon Creek. Applied Fluvial Geomorphology Field Techniques EESc 435
 Assignment 1 Measuring River Characteristics- Vernon Creek Applied Fluvial Geomorphology Field Techniques EESc 435 Amanda Jardine 30100093 Jaime McDonald 14177083 Erica Massey 50870088 April 28, 2012 Introduction
Overview of fluvial and geotechnical processes for TMDL assessment
 Overview of fluvial and geotechnical processes for TMDL assessment Christian F Lenhart, Assistant Prof, MSU Research Assoc., U of M Biosystems Engineering Fluvial processes in a glaciated landscape Martin
Sixteen Mile Creek Tributaries Meander Belt Width Assessment November 2009
 SIXTEEN MILE CREEK TRIBUTARIES THE CATHOLIC CEMETERIES OF THE DIOCESE OF HAMILTON -MEANDER BELT WIDTH ASSESSMENT - Report to: Attention: From: Director of Cemeteries Catholic Cemeteries of the Diocese
Conceptual Model of Stream Flow Processes for the Russian River Watershed. Chris Farrar
 Conceptual Model of Stream Flow Processes for the Russian River Watershed Chris Farrar Several features of creeks affect the interactions between surface and groundwater. This conceptual model uses the
FUTURE MEANDER BEND MIGRATION AND FLOODPLAIN DEVELOPMENT PATTERNS NEAR RIVER MILES 200 TO 191 OF THE SACRAMENTO RIVER PHASE III REPORT
 FUTURE MEANDER BEND MIGRATION AND FLOODPLAIN DEVELOPMENT PATTERNS NEAR RIVER MILES 200 TO 191 OF THE SACRAMENTO RIVER PHASE III REPORT Eric W. Larsen REPORT FOR DUCKS UNLIMITED March 31, 2006-1 - Contents
Sediment and nutrient transport and storage along the urban stream corridor
 Sediment and nutrient transport and storage along the urban stream corridor Greg Noe, Cliff Hupp, Ed Schenk, Jackie Batson, Nancy Rybicki, Allen Gellis What is the role of floodplains everywhere? Noe 2013,
The River Continuum Concept (or not?) Stream Classification
 Stream Classification") The River Continuum Concept (or not?) Stream Classification Goal: Generalization 2 general types of classification streams (longitudinal) streams (e.g., hydrologic regime classification) Longitudinal Classification
The River Continuum Concept (or not?) Stream Classification Goal: Generalization 2 general types of classification streams (longitudinal) streams (e.g., hydrologic regime classification) Longitudinal Classification
Georgia Performance Standards for Urban Watch Restoration Field Trips
 Georgia Performance Standards for Field Trips 6 th grade S6E3. Students will recognize the significant role of water in earth processes. a. Explain that a large portion of the Earth s surface is water,
Little Blackfoot TPA 2009 Sediment and Habitat Assessment QAQC Review March 9, 2010
 Little Blackfoot TPA 2009 Sediment and Habitat Assessment QAQC Review March 9, 2010 1.0 PROJECT OVERVIEW Sediment and habitat monitoring in the Little Blackfoot TPA was conducted in July of 2009 as outlined
TSEGI WASH 50% DESIGN REPORT
 TSEGI WASH 50% DESIGN REPORT 2/28/2014 Daniel Larson, Leticia Delgado, Jessica Carnes I Table of Contents Acknowledgements... IV 1.0 Project Description... 1 1.1 Purpose... 1 Figure 1. Erosion of a Headcut...
BEFORE LEAVING THE SITE, CHECK DATA SHEETS TO ENSURE THAT ALL VARIABLES HAVE BEEN RECORDED
 AUSRIVAS Physical Assessment Protocol Field Data Sheets Page 1 Site No. Date _ Date Site No. Time Recorder's Name River Name _ Location Weather Rain in last week? Y [ ] N [ ] deg min sec deg min sec Latitude:
Template for Sediment and Erosion Control Plan General Instructions. Section Instructions
 Template for Sediment and Erosion Control Plan General Instructions Introduction: Soil erosion and sediment deposition from farmlands can contribute to degraded surface water quality. Sediment delivery
Fact sheet: Glacial rivers (all Europe)
") Fact sheet: Glacial rivers (all Europe) General description Valleyplanform Hydrology and The valley form varies from a gorge to a V-shaped valley and the single-thread channel is mainly characterized by
Fact sheet: Glacial rivers (all Europe) General description Valleyplanform Hydrology and The valley form varies from a gorge to a V-shaped valley and the single-thread channel is mainly characterized by
ROAD SEDIMENT ASSESSMENT & MODELING: KOOTENAI-FISHER TMDL PLANNING AREA ROAD GIS LAYERS & SUMMARY STATISTICS
 ROAD SEDIMENT ASSESSMENT & MODELING: KOOTENAI-FISHER TMDL PLANNING AREA ROAD GIS LAYERS & SUMMARY STATISTICS Prepared by: ATKINS Water Resources Group 820 North Montana Avenue Helena, MT 59601 November
How Do Geology and Physical Streambed Characteristics Affect Water Quality?
 Teacher s Guide How Do Geology and Physical Streambed Characteristics Affect Water Quality? Lesson Description In this lesson, the students research a dynamic, vertical dimension of a watershed - the geological
Aquifer an underground zone or layer of sand, gravel, or porous rock that is saturated with water.
 Aggradation raising of the streambed by deposition that occurs when the energy of the water flowing through a stream reach is insufficient to transport sediment conveyed from upstream. Alluvium a general
HYDROLOGY AND HYDRAULICS MUSKEG RIVER BRIDGE
 PUBLIC WORKS CANADA HYDROLOGY AND HYDRAULICS MUSKEG RIVER BRIDGE KILOMETRE 207.9, LIARD HIGKWAY December 1978 I I f I I I I # Bolter Parish Trimble Ltd. ONLIULTINO Public Works, Canada, 9925-109 Street,
1.1 What is Site Fingerprinting?
 Site Fingerprinting Utilizing GIS/GPS Technology 1.1 What is Site Fingerprinting? Site fingerprinting is a planning tool used to design communities where protection of natural resources is the primary
The effectiveness of check dams in controlling upstream channel stability in northeastern Taiwan
 Erosion, Debris Mows and Environment in Mountain Regions (Proceedings of the Chengdu Symposium, July 1992). IAHS Publ. no. 209, 1992. 423 The effectiveness of check dams in controlling upstream channel
The River Restoration Centre therrc.co.uk. Understanding Fluvial Processes: supporting River Restoration. Dr Jenny Mant
 The River Restoration Centre therrc.co.uk Understanding Fluvial Processes: supporting River Restoration Dr Jenny Mant Jenny@therrc.co.uk Understanding your catchment Hydrology Energy associated with the
CAUSES FOR CHANGE IN STREAM-CHANNEL MORPHOLOGY
 CAUSES FOR CHANGE IN STREAM-CHANNEL MORPHOLOGY Chad A. Whaley, Department of Earth Sciences, University of South Alabama, MobileAL, 36688. E-MAIL: caw408@jaguar1.usouthal.edu The ultimate goal of this
This material is part of the collection of the Philadelphia Water Department and was downloaded from the website Please contact the
 This material is part of the collection of the Philadelphia Water Department and was downloaded from the website www.phillyh2o.org Please contact the PhillyH2O webmaster for more information about this
Starting at Rock Bottom
 Starting at Rock Bottom At rock bottom of the Brushy Creek site s geological column lies the first clue to human habitation: A smelting and heattreating furnace, and mold, carved into Bed Ked: Figure 15
Distinct landscape features with important biologic, hydrologic, geomorphic, and biogeochemical functions.
 1 Distinct landscape features with important biologic, hydrologic, geomorphic, and biogeochemical functions. Have distinguishing characteristics that include low slopes, well drained soils, intermittent
STUDY GUIDE FOR CONTENT MASTERY. Surface Water Movement
 Surface Water SECTION 9.1 Surface Water Movement In your textbook, read about surface water and the way in which it moves sediment. Complete each statement. 1. An excessive amount of water flowing downslope
GEOL 652. Poudre River Fieldtrip
 GEOL 652. Poudre River Fieldtrip One of the more difficult variables to measure and/or estimate when studying flow in natural channels is that of roughness. Roughness, usually approximated with Manning
Appendix E: Cowardin Classification Coding System
 Appendix E: Cowardin Classification Coding System The following summarizes the Cowardin classification coding system and the letters and numbers used to define the USFWS NWI wetland types and subtypes:
Keanahalululu Gulch, Hawaiÿi
 DAR Watershed Code: 85021 WATERSHED FEATURES Keanahalululu Gulch watershed occurs on the island of Hawaiÿi. The Hawaiian meaning of the name is unknown. The area of the watershed is 4.1 square mi (10.6
FOREST RESEARCH INSTITUTE, DEHRADUN
 PROJECT REPORT DRAINAGE AND REPLENISHMENT STUDY OF MINED AREA OF GANGA SHYAMPUR RIVER HARIDWAR Submitted to UTTARAKHAND FOREST DEVELOPMENT CORPORATION (UFDC) 73, Nehru Road, Deharadun Prepared&Submitted
Chapter 4 French Broad River Subbasin Including the: French Broad River, Little Ivy Creek (River), Ivy Creek, California Creek and Bull Creek
, Ivy Creek, California Creek and Bull Creek") Chapter 4 French Broad River Subbasin 04-03-04 Including the: French Broad River, Little Ivy Creek (River), Ivy Creek, California Creek and Bull Creek 4.1 Subbasin Overview Subbasin 04-03-04 at a Glance
Chapter 4 French Broad River Subbasin 04-03-04 Including the: French Broad River, Little Ivy Creek (River), Ivy Creek, California Creek and Bull Creek 4.1 Subbasin Overview Subbasin 04-03-04 at a Glance
Summary. Streams and Drainage Systems
 Streams and Drainage Systems Summary Streams are part of the hydrologic cycle and the chief means by which water returns from the land to the sea. They help shape the Earth s surface and transport sediment
Name: Mid-Year Review #2 SAR
 Name: Mid-Year Review #2 SAR Base your answers to questions 1 through 3 on on the diagram below, which shows laboratory materials used for an investigation of the effects of sediment size on permeability,
3/3/2013. The hydro cycle water returns from the sea. All "toilet to tap." Introduction to Environmental Geology, 5e
 Introduction to Environmental Geology, 5e Running Water: summary in haiku form Edward A. Keller Chapter 9 Rivers and Flooding Lecture Presentation prepared by X. Mara Chen, Salisbury University The hydro
Environmental Science
 Environmental Science A Study of Interrelationships Cui Jiansheng Hebei University of Science and Technology CH06 Kinds of Ecosystems and Communities Chapter Objectives After reading this chapter, you
Section B - Chapter 1 Tar-Pamlico River Subbasin Tar River, Fishing Creek, Cedar Creek, Coon Creek and Tabbs Creek
 Section B - Chapter 1 Tar-Pamlico River Subbasin 03-03-01 Tar River, Fishing, Cedar, Coon and Tabbs 1.1 Subbasin Overview Subbasin 03-03-01 at a Glance Land and Water Area Total area: 642 mi 2 Land area:
TPDES: Soil, Erosion and Sedimentation Methods
 SAWS TPDES: Soil, Erosion and Sedimentation Methods Philip Handley Supervisor-Resource Protection & Compliance August 25, 2014 TPDES: Soil, Erosion and Sedimentation Methods Soil Common term: Dirt Common
Southwest LRT Habitat Analysis. May 2016 Southwest LRT Project Technical Report
 Southwest LRT Habitat Analysis Southwest LRT Project Technical Report This page intentionally blank. Executive Summary This technical report describes the habitat analysis that was performed to support
PENNSYLVANIA DEPARTMENT OF TRANSPORTATION ENGINEERING DISTRICT 3-0
 PENNSYLVANIA DEPARTMENT OF TRANSPORTATION ENGINEERING DISTRICT 3-0 LYCOMING COUNTY S.R.15, SECTION C41 FINAL HYDROLOGIC AND HYDRAULIC REPORT STEAM VALLEY RUN STREAM RELOCATION DATE: June, 2006 REVISED:
Puakea, Hawaiÿi. Puakea, Hawaiÿi WATERSHED FEATURES
 Puakea, Hawaiÿi DAR Watershed Code: 85046 Puakea, Hawaiÿi WATERSHED FEATURES Puakea watershed occurs on the island of Hawaiÿi. The Hawaiian meaning of the name is white blossom. The area of the watershed
Elevation (ft) Slope ( ) County CONDITION CATEGORY. Parameter Natural Condition Slightly impacted Moderately Impacted Heavily Impacted
 Slope ( ) County CONDITION CATEGORY. Parameter Natural Condition Slightly impacted Moderately Impacted Heavily Impacted") Version: 8/25/14 Meadow Name Date : / / MM DD YYYY GPS Location:. N. W GPS Datum (e.g., WGS 84, NAD 27) Elevation (ft) Slope ( ) County Watershed (HUC8) Landowner USGS Quad Name Observers: 7.5 or 15 (circle
Version: 8/25/14 Meadow Name Date : / / MM DD YYYY GPS Location:. N. W GPS Datum (e.g., WGS 84, NAD 27) Elevation (ft) Slope ( ) County Watershed (HUC8) Landowner USGS Quad Name Observers: 7.5 or 15 (circle
SAN FRANCISCO DISTRICT INFORMATION REQUESTED FOR VERIFICATION OF CORPS JURISDICTION
 DEPARTMENT OF THE ARMY SAN FRANCISCO DISTRICT, U.S. ARMY CORPS OF ENGINEERS 1455 MARKET STREET SAN FRANCISCO, CALIFORNIA 94103-1398 SAN FRANCISCO DISTRICT INFORMATION REQUESTED FOR VERIFICATION OF CORPS
Biological Response to the Gold King Mine Release in the Animas and San Juan Rivers
 Biological Response to the Gold King Mine Release in the and San Juan Rivers Lareina Guenzel 1, Richard Mitchell, PhD 1, Kate Sullivan, PhD 2, and Michael Cyterski, PhD 2 1 U.S. Environmental Protection
George Host and Tom Hollenhorst Natural Resources Research Institute University of Minnesota Duluth
 George Host and Tom Hollenhorst Natural Resources Research Institute University of Minnesota Duluth Marc Hershfield Minnesota Pollution Control Agency Duluth, MN St. Louis River watershed Duluth-Superior