Paleocene-Eocene Thermal Maximum environmental change in the New Jersey Coastal Plain: benthic foraminiferal biotic events
|
|
|
- Jodie Russell
- 5 years ago
- Views:
Transcription
1 Paleocene-Eocene Thermal Maximum environmental change in the New Jersey Coastal Plain: benthic foraminiferal biotic events STASSEN Peter 1, THOMAS Ellen 2, 3 and SPEIJER Robert, P. 1 1 Department of Earth and Environmental Sciences, KU Leuven, Celestijnenlaan 200E, B-3001, Leuven, Belgium (Peter.Stassen@ees.kuleuven.be, Robert.Speijer@ees.kuleuven.be). 2 Department of Geology and Geophysics, Yale University, 210 Whitney Avenue, New Haven, Connecticut , USA (ellen.thomas@yale.edu). 3 Department of Earth and Environmental Sciences, 265 Church Street, Wesleyan University, Middletown, Connecticut 06459, USA (ethomas@wesleyan.edu). ABSTRACT The environmental impact of the Paleocene-Eocene Thermal Maximum (PETM) has been intensively studied in the New Jersey Coastal Plain, but the benthic foraminiferal response, reflecting bottom water conditions, has not been documented at high resolution. We use benthic foraminiferal data across the Paleocene-Eocene boundary in cores from Wilson Lake (WL) and Bass River (BR) to recognize 5 foraminiferal associations (based on species clusters). Their varying abundances allow the identification of a stratigraphic succession of 8 distinct biofacies across the studied interval. Uppermost Paleocene biofacies 1 corresponds to the glauconitic sands of the Vincentown Formation and contains rare, small planktic foraminifera and a diverse benthic fauna. Sediments accumulated slowly in a sufficiently oxygenated, outer neritic setting (depth: m at WL, m at BR) under fairly oligotrophic conditions. The embayment was storm-dominated and influenced by strong currents, inhibiting deposition of suspended fine particles (e.g., planktic foraminifera, clay) and enhancing re-suspension. No significant pre- PETM environmental changes are detected in the benthic foraminiferal assemblages. Deposition of the fine-grained silty clays of the Marlboro Clay started at the onset of the PETM, with transitional lithology present at Wilson Lake. Gavelinella beccariiformis, common at deep shelfal to bathyal-abyssal depths, is the only taxon to become extinct at this level. Water depth increased during the PETM to a maximum of m at WL. Planktic foraminifera increased strongly in abundance, while the benthic foraminiferal assemblage changed to a more opportunistic, less diverse assemblage dominated by stress-tolerant taxa (Tappanina selmensis, Pulsiphonina prima and Anomalinoides acutus, biofacies 2). Increased riverine influence may have reduced vertical mixing, initiating stratification of the water column, and establishment of a continuously dysoxic mud belt. Benthic diversity then gradually increased, indicating environmental recovery (biofacies 3 and 4; kyr post PETM-onset). Riverine influence probably became more variable, generating peak abundances of specialized taxa in a mud belt system with increased accumulation rates. The latest PETM biofacies 5 (>95 kyr post-onset) contains a poorly diverse Bulimina callahani assemblage, indicative of reoxygenated, but still eutrophic bottom water conditions, with renewed vertical mixing. The lower Eocene glauconitic sandy clays of the Manasquan Formation contain an outer neritic benthic fauna (biofacies 6 to 8, depth: m at WL) indicative of persistent high primary production, with return of more vigorous currents. Higher abundances of buliminids may have been triggered by upwelling along frontal zones. Our environmental interpretations indicate relatively stable benthic foraminiferal ecosystems at persistently outer neritic water depths ( m), despite distinct temporary 1
2 changes during the PETM, including eustatic sea-level rise of up to ~30 m, and widespread establishment of dysoxic conditions * Corresponding author Dr. Peter Stassen Biogeology Research Group, Department of Earth and Environmental Sciences, KU Leuven Celestijnenlaan 200E, B-3001 Leuven, Belgium Tel: +32 (0) Fax: + 32 (0) Peter.Stassen@ees.kuleuven.be KEYWORDS Paleocene-Eocene Thermal Maximum; Wilson Lake, NJ, USA; Bass River, NJ, USA; benthic foraminifera; sea level; paleoenvironment; hypoxia; eutrophication 1 INTRODUCTION The early Paleogene was a climatically dynamic period with relatively rapid global warming events, called hyperthermals, superimposed on a warm background greenhouse climate. The best known and most extreme hyperthermal is the Paleocene-Eocene Thermal Maximum (PETM; Kennett and Stott, 1991; Thomas and Shackleton, 1996; Zachos et al., 2008), characterized by worldwide 5-8 C warming of Earth s surface as well as the deep oceans (McInerney and Wing, 2011; Dunkley Jones et al., 2013). Sea-surface temperature records of the New Jersey shelf indicate up to 8 C local warming during the early stages of the PETM, with peak temperatures in excess of 33 C (Zachos et al., 2006). The PETM is also marked by a globally recorded negative carbon isotope excursion (CIE; Thomas and Shackleton, 1996; McInerney and Wing, 2011), which base marks the Paleocene-Eocene (P-E) boundary (Dupuis et al., 2003; Aubry et al., 2007). Although the ultimate cause and trigger of the CIE are under debate, the thermal liberation of methane hydrates along continental margins is a plausible way to rapidly inject large amounts of 13 C-depleted carbon into the ocean-atmosphere system (e.g., Dickens et al., 1997; Dickens, 2011). Other hypotheses include a rapid release of thermogenic methane from volcanic basins (Svensen et al., 2004), burning of peat deposits or oxidation of organic matter following desiccation of inland seas (Kurtz et al., 2003; Higgins and Schrag, 2006), thawing Antarctic permafrost (DeConto et al., 2012) and comet impact (Kent et al., 2003; Wright and Schaller, 2013). This abrupt warming was coupled with major evolutionary changes in the marine biosphere (Speijer et al., 2012), including extinction of common, cosmopolitan deep-sea benthic foraminifera (e.g., Tjalsma and Lohmann, 1983; Thomas, 1989, 1998), rapid evolutionary turnover in planktic communities (e.g., Kelly et al., 1996; Bralower, 2002; Gibbs et al., 2006a; 2006b; Schneider et al., 2013), an acme of the dinoflagellate Apectodinium at middle and high latitudes (e.g., Crouch et al., 2001; Sluijs et al., 2007a), and reorganization of carbonate platform communities with a turnover of larger foraminifera (e.g., Scheibner et al., 2005; Scheibner and Speijer, 2008). Compared to the deep-sea foraminiferal crisis, the evolutionary effect of the 2
3 PETM on benthic foraminiferal communities was apparently less severe in shelf settings (e.g., Speijer et al., 1996), although shelf benthic foraminiferal communities has not yet been extensively documented worldwide. The New Jersey Wilson Lake (WL) and Bass River (BR) drill sites in the Atlantic Coastal Plain of North America contain upper Paleocene - lower Eocene shelf sequences with a welldocumented PETM (Figs. 1 and 2). These sediments include kaolinite-rich, silty clays deposited during the PETM, and contain biogenic magnetic particles (Kopp et al., 2007; Lippert and Zachos, 2007; Schumann et al., 2008). Their accumulation and preservation implies expansion of the suboxic zone within the sediment (Dickens, 2008), possibly linked to the establishment of a tropical river-dominated shelf (Kopp et al., 2009). High-resolution records are available for stable isotopes (Cramer et al., 1999; Zachos et al., 2006, 2007; Sluijs et al., 2007b; John et al., 2008; Stassen et al., 2012b), calcareous nannoplankton (Gibbs et al., 2006a; 2006b) and organic dinocyst assemblages (Sluijs et al., 2007b; Sluijs and Brinkhuis, 2009). A bloom of the heterotrophic dinocyst Apectodinium preceded the PETM by 4-5 to kyr, continuing in the early stages of global warming (Sluijs et al., 2007b; Stassen et al., 2012c). PETM dinocyst distribution indicates varying riverine influence across the shelf, causing eutrophication and potentially salinity-driven stratification (Sluijs and Brinkhuis, 2009). In contrast, highly diverse nannoplankton assemblages indicate stable, mesotrophic surface water conditions with limited salinity changes (Gibbs et al., 2006b). Paleoenvironmental reconstructions of sea-floor conditions based on benthic foraminifera have been performed at low resolution only (e.g., Gibson et al., 1993; Gibson and Bybell, 1994; Harris et al., 2010). Benthic biota provide essential information on sea-level fluctuation, bottom water oxygenation and organic fluxes to the sea floor at the time of deposition. We present highresolution benthic foraminiferal distribution patterns for the two best-studied New Jersey Coastal Plain sites (Wilson Lake and Bass River), aiming to document the response of shallow marine benthic foraminifera to greenhouse warming during the PETM, to detect regional biotic patterns, and to decipher environmental mechanisms controlling benthic ecosystems of this continental shelf, using the stratigraphic framework of Stassen et al. (2012b). 2 MATERIAL AND METHODS Samples were obtained from cores at Wilson Lake (drilled by the United States Geological Survey (USGS), latitude N , longitude W ) and Bass River (drilled by Ocean Drilling Program (ODP) Leg 174X, latitude N39 36'42", longitude W74 26'12"). Bass River is approximately 35 km down-dip along the basin gradient (1:1000, Olsson and Wise, 1987), thus in waters about 35 m deeper than at Wilson Lake. Sample spacing was 30 cm for most of the studied interval, up to 5-10 cm around the P-E boundary. Published calcareous nannofossil (Aubry et al., 2000; Gibbs et al., 2006a, 2006b; Bybell, pers. comm. 2013) and stable isotope records (Cramer et al., 1999; Zachos et al., 2006; John et al., 2008) provide the main stratigraphic framework (Fig. 2), supported by a sequence of bioevents (Sluijs and Brinkhuis, 2009; Stassen et al., 2012b, 2012c). Unconformities are recognized by sharp lithologic changes and nannoplankton biostratigraphy (Cramer et al., 1999; Gibbs et al., 2006a). We note a previously unreported unconformity at Wilson Lake at m, coinciding with a major change in lithology and biota. Preservation of calcareous nannofossils is good to excellent, and we used the biozonation by Aubry (1996; 1999). The lowest occurrence of Discoaster araneus separates NP9a and NP9b. Zone NP10 is subdivided using the ranges of Tribrachiatus digitalis (NP10b) and Tribrachiatus 3
4 contortus (NP10d) and the partial range of Tribrachiatus bramlettei (NP10a and NP10c). These subdivisions are commonly applied in shelf settings (e.g., Dupuis et al., 2003), yet deep-sea records show that the lowest occurrence of T. contortus may precede the lowest occurrence of T. digitalis, so that this subdivision may not be globally valid (e.g., Agnini et al., 2007). Here Subzones NP10b, 10c and 10d are combined into zone NP10b-d, its base being defined by the lowest occurrence of either T. digitalis or T. contortus, its top by the highest occurrence of T. contortus (Fig. 2). About g sediment was dried and washed over a 63 µm sieve until complete disaggregation. A representative split for quantitative analysis (approximately benthic specimens) was obtained from the >63 µm fraction using a microsplitter. From these splits all benthic specimens were picked, identified, counted and permanently stored in Plummer slides (KU Leuven). In order to concentrate the calcareous foraminiferal tests in samples with abundant quartz or glauconite grains, a flotation technique (zinc chloride solution) was applied, which slightly reduces absolute abundances, but relative abundances are unaffected (Semensatto and Dias-Brito, 2007). Visual inspection of the heavy fraction (quartz and glauconite grains) revealed only broken chambers of large nodosariids. We determined foraminiferal numbers (individuals >63 µm per gram sediment), the planktic-benthic ratio (%P), the proportions of epi- and endobenthic morphotypes, faunal diversity (Fisher alpha: F(α) and Shannon: H(s) indices), benthic foraminiferal abundances and paleoecologic preferences of the most common taxa. The terms coastal, inner neritic, middle neritic and outer neritic correspond respectively to 0-30 m, m, m, m paleodepth. Benthic foraminifera were mostly identified to species level, but in some cases to genus level, e.g., Pullenia spp., Lenticulina spp. and other nodosariids. Diversity indices were calculated using initial data sets containing all counted benthic species (PAST-software, Hammer et al., 2001). Relative benthic foraminiferal abundances are expressed as the proportion (percentage) of a species in the entire benthic foraminiferal assemblage. Only the most common taxa (>2.5% in at least one sample) are displayed in the figures, with remaining species placed in the rest group, which also includes indeterminable benthic taxa. Cluster analysis and detrended correspondence analysis (DCA) was performed to analyze the relative abundance data of Wilson Lake and Bass River statistically (data set with >2.5%; PAST-software; Hammer et al., 2001). We used cluster analysis to group benthic foraminiferal taxa in species associations, supposedly containing taxa with closely related paleoecologic preferences. A stratigraphic succession of biofacies is based upon varying abundances of these benthic foraminiferal associations. Benthic foraminifera are employed widely as a tool to reconstruct paleoenvironments and benthic foraminiferal shelf species are directly affected by environmental parameters that tend to vary proportionally with depth. Food availability and oxygen are the main factors controlling the density and microhabitat distribution of benthic foraminifera (e.g., Jorissen et al., 1995, 2007; van der Zwaan et al., 1999). In general, organic flux is important, but it becomes subordinate in food-rich environments when oxygen becomes strongly limiting. High proportions of epibenthic morphotypes are generally indicative of well-ventilated, relatively oligotrophic marine conditions (e.g., Corliss and Chen, 1988; Corliss, 1991; Jorissen et al., 1995). Taxa with an endobenthic morphology become more prominent as the organic flux to the seafloor increases (mesotrophic to eutrophic conditions) and show relative population increases under low-oxygen bottom water conditions (Jorissen, 1999; Jorissen et al., 2007). Low-oxygen assemblages commonly have low diversity and are dominated by small, thin-walled benthic taxa (Boltovskoy et al., 1991; Bernhard and Sen Gupta, 1999), which might better survive under such conditions (e.g., Ernst et al., 2005). 4
5 The abundance of planktic foraminifera generally increases with distance from the coast and water depth, and is highest in open ocean environments (e.g., van der Zwaan et al., 1990), so that the %P has been proposed as an indicator of water depth. Planktic abundance reflects the vertical niche availability (thermocline structure) and niche stability throughout the year. However, quantitative calibration is difficult and varies regionally because %P may also be influenced by bottom water conditions (van Hinsbergen et al., 2005), productivity (Berger and Diester-Haass, 1988; Olsson et al., 1997), surface salinity and turbulence, and post-mortem taphonomic change. We assigned paleodepth preferences to our foraminiferal associations (see supplementary data) and our depth estimates for each biofacies are based on the relative cumulative abundances of each species association. Depth trend = 1/n total * (n i *(depth min, i + depth max, i )/2, in which n i represents the percentage of association 'i, minimal and maximal depth of association 'i refer to the upper and lower limits of preferred water depth. Two calculations are performed, including or excluding species association IIa (indicated by *), because this group has reported peak abundances at radically differing water depths, suggesting large environmental tolerance. 3 GEOLOGICAL SETTING AND STRATIGRAPHY The central Atlantic coast of North America is a passive continental margin where Cenozoic sediments were deposited in embayments separated by elevated areas, related to flexures in the underlying basement (e.g., Gibson et al., 1993). The New Jersey Coastal Plain (NJCP) is situated in the northern part of the Salisbury embayment, and contains expanded marine records of P-E boundary sediments (Gibson et al., 1993; Gibson and Bybell, 1994; Cramer et al., 1999). The present-day Fall Line marks the outcrop boundary between deformed basement rocks and onlapping undeformed Mesozoic and Cenozoic sediments (Fig. 1). Marine sediments were deposited more westward, to an unknown extent due to erosion (Gibson and Bybell, 1994). The upper Paleocene (NP9a) Vincentown Formation (Fm.) consists of glauconitic quartz sands, and shifts downdip to more fine-grained glauconitic quartz-rich silts and clays (Olsson and Wise, 1987). The lower Eocene Manasquan Fm. (top NP10a to base NP11) consists commonly of extensively burrowed calcareous clays to silts or very fine sands, with some glauconitic beds (Olsson and Wise, 1987), and is stratigraphically more complete at Wilson Lake (Stassen et al., 2012b). The sediments accumulated slowly on a sediment-starved, siliciclastic shelf and regional unconformities are present (Olsson and Wise, 1987; Browning et al., 2008). An interval of silty clay is intercalated in these glauconitic sediments (thickness WL: 13.5 m and BR: 10.5 m; Fig. 2), initially referred to as the unnamed unit (Olsson and Wise, 1987), or attributed either to the Vincentown or the Manasquan Fm. (e.g., Gibson et al., 1993; John et al., 2008). This sequence is now assigned to the PETM, based on the recognition of the CIE, high proxy-derived temperatures, and distinctive nannoplankton marker taxa (Cramer et al., 1999; Gibbs et al., 2006a; Zachos et al., 2006). At Bass River, the CIE onset is at m below surface. The onset is not as clear at Wilson Lake because of a carbonate-free level, but recognized around 110 m below surface in the δ 13 C org (dinocyst) record. The upper boundary of the CIE interval is truncated at both sites, unconformably overlain by glauconitic clays to clayey silts (unconformity BR m and WL m). The New Jersey silty clays are in a similar stratigraphic position as the Marlboro Clay in the southern Salisbury Embayment (Gibson and Bybell, 1994; Kopp et al., 2009). The basal Eocene clays in the NJCP are therefore also attributed to the Marlboro Clay, which has been described as deposited in a shelf-wide mud belt on a river- 5
6 dominated shelf, with high detrital input (Kopp et al., 2009; Stassen et al., 2012b), in contrast with the sediment-starved glauconitic depositional regimes which are more common in the basin. 4 RESULTS 4.1. General The foraminiferal assemblage in the uppermost Paleocene glauconitic sands of the Vincentown Fm. in both cores consists of sparse, small planktic foraminifera and a diverse benthic foraminiferal fauna (Figs. 3 and 4), with large trochospiral epibenthic (e.g., Gavelinella beccariiformis, Cibicidoides alleni) as well as common, fairly small triserial endobenthic components (e.g., Bulimina virginiana, Bulimina hornerstownensis). Foraminifera at both sites are fairly well-preserved, but have a whitish ( frosty ) appearance and commonly are broken or abraded. The onset of the CIE occurs at the transition from glauconitic sands to silty clays (Fig. 2). A transitional biofacies, composed of both Paleocene and Eocene faunal components, occurs at Wilson Lake within a gradual lithologic transition, which was not recognized at Bass River (Figs. 5 and 6). Planktic foraminiferal abundance rapidly increases from this level onwards. In the PETM interval, the benthic foraminiferal fauna is less diverse, and dominated by Pulsiphonina prima, Tappanina selmensis and Anomalinoides acutus. In general, specimens are excellently preserved (translucent) and not abraded. Foraminiferal diversity gradually increases upwards within the PETM interval, with high abundances of Pseudouvigerina wilcoxensis and Spiroplectinella laevis, and distinct higher abundances of Bulimina callahani in the upper meters of the clayey strata at Bass River. An unconformity cuts into the upper part of the PETM at both sites (Stassen et al., 2012b). The overlying glauconitic sandy clays of the Manasquan Fm. at Wilson Lake contain relatively well-preserved foraminifera with only minor abrasion, and the fauna is most comparable to the uppermost Paleocene one, but richer in planktic foraminifera. 4.2 Foraminiferal species associations and biofacies Benthic foraminiferal taxa are grouped in 5 species associations (I to V in Fig. 7) using cluster analysis, with the associations supposedly containing taxa with closely related paleoecologic preferences. Species association III, composed of Fursenkoina wilcoxensis and Bulimina ovata, is not discussed in detail due to the low abundances of these taxa. Representative taxa for all species associations are illustrated: Ia and Ib (plate 1), IIa, IIb, III and IV (plate 2), and V (plate 3). The sedimentary sequence is subdivided in 8 distinct biofacies with 1 transitional biofacies, based on the varying proportions of the species associations and lithologic characteristics (Tables 1 and 2). The base of biofacies 3 is placed at a major increase in sedimentation rates (Stassen et al., 2012b). The biofacies subdivision forms the framework of the paleoenvironmental interpretation, supported by detrended correspondence analysis (Fig. 8; see 4.3). The correlations of the biofacies between the studied sites are considered isochronous, based on the tie points in the carbon isotope excursion, nannoplankton biostratigraphy and site-to-site correlation of dinocysts events (Stassen et al., 2012b). Foraminiferal distributions at the deeper Bass River and shallower Wilson Lake sites are thus stratigraphically consistent through the studied sections, indicating that environmental changes at the onset of the PETM occurred on a larger regional scale, rather than migrating up- or downdip with changes in sea level (Stassen et al., 2012b). Stratigraphically, biofacies 1 was deposited during the latest Paleocene, biofacies 2 and 3 during the peak warming of the PETM (CIE core ), and biofacies 4 to 5 during the CIE 6
7 recovery phase (Fig. 2, Stassen et al., 2012b). Post-PETM, lower Eocene biofacies 6 to 8 are intercalated between unconformities. Uppermost Paleocene biofacies 1 occurs at Wilson Lake ( m), in glauconitic (clayey) sands between barren intervals, and is characterized by the lowest foraminiferal numbers and %P of all biofacies. The benthic fauna is moderately diverse, with a strong dominance of association Ia species, mainly B. virginiana. At Bass River ( m), this biofacies occurs in glauconitic silty micaceous clay and foraminifera are more common than at Wilson Lake. The assemblage is more diverse and mainly composed of association Ib species, such as B. hornerstownensis, G. beccariiformis and Paralabamina lunata. As noted by Gibson et al. (1993), the transitional biofacies at the CIE onset is more diverse, containing characteristic elements of both Paleocene and PETM biota. It is restricted to thin intervals at Wilson Lake ( m, directly above the barren interval) and Bass River ( m). The lithology is transitional, with sediments becoming more finegrained upwards (clayey silt), while the glauconite content decreases. Gavelinella beccariiformis has its highest occurrence below this level. Benthic foraminifera are less common, yet planktic foraminifera become more abundant than in biofacies 1. Bulimina virginiana (WL) and B. hornerstownensis (BR) remain common, and A. acutus and P. prima (association IIa) become abundant at both sites. At Wilson Lake, isotope records of C. alleni (association Ia) and A. acutus (association IIa) both show CIE values, but at Bass River isotope values are a mixture of Paleocene and CIE values (Fig. 2) indicating bioturbation and/or reworking (Cramer et al., 1999; Stassen et al., 2012b). Biofacies 2 is present in dark gray silty clay without glauconite (WL m; BR m), deposited during peak warming of the PETM. Foraminiferal numbers and %P increase significantly compared to the transitional biofacies, reaching the highest mean values of all biofacies (Figs. 3 and 4). Extremely high foraminiferal numbers occur in the basal PETM at Bass River, which is condensed relative to Wilson Lake (Stassen et al., 2012b, 2012c). The benthic foraminiferal assemblage is less diverse than in the transitional biofacies, with a dominance of association IIa species (T. selmensis, A. acutus and P. prima). The succeeding biofacies 3 is present in dark silty clays without glauconite and is the uppermost biofacies represented at both sites (WL m, truncated by an unconformity; BR m). At Wilson Lake, %P and foraminiferal numbers remain high, although %P decreases upwards, whereas diversity remains stable (Fig. 3). Species of association IIa (A. acutus and P. prima, no T. selmensis) are less dominant, and association IIb taxa reach maximum abundances (e.g., P. wilcoxensis). The patterns are similar at Bass River, but there diversity gradually increases upwards. Anomalinoides acutus, P. prima and T. selmensis (association IIa), and B. hornerstownensis and P. lunata (association Ib) are major faunal components. Species of association IIb are more evenly distributed, because P. wilcoxensis is less dominant. Biofacies 4 and 5 represent the PETM recovery phase, both present at Bass River only, in dark clays mostly without glauconite. Biofacies 4 (initial CIE recovery phase, Fig. 2) occurs at m. Foraminiferal numbers and %P remain high, but gradually decrease upwards. This biofacies is the most diverse, consisting of a mixture of all foraminiferal species associations, with P. prima (association IIa) and P. lunata (association Ib) being most common. Biofacies 5 (BR m), is truncated at the top by an unconformity and rare glauconite grains at the top (BR m) probably indicate downward bioturbation. Foraminiferal numbers are very low, with reduced %P and low carbonate content. The assemblage is poorly diverse and strongly dominated by B. callahani (association V). 7
8 Lower Eocene biofacies 6 to 8 are intercalated between unconformities at Wilson Lake (Fig. 2). The sediments containing biofacies 6 (WL m) consist of glauconitic, clayey silts with high benthic foraminiferal numbers and low %P relative to the underlying PETM biofacies. The diverse benthic foraminiferal assemblage is mainly composed of association V species, while taxa of association IIa (A. acutus and P. prima) are consistently present, but association I species are rare. Biofacies 7 (WL m) occurs at Wilson Lake in glauconite-rich clayey silt. Benthic foraminiferal numbers increase significantly and the poorly diverse assemblage is mainly composed B. virginiana (association Ia). The dominant lithology within biofacies 8 (WL m) is glauconitic clayey silt with common fine quartz grains. The assemblage is moderately diverse and resembles biofacies 1, although A. acutus and P. prima are continuously present. 4.3 Detrended correspondence analysis (DCA) The biofacies with hypothetical derived environmental conditions are visualized in a bivariate plot of sample scores on the first and second DCA axes (Fig. 8A), the ordinations of the most common taxa (>5% in at least one sample, 34 taxa in total) are shown in Fig. 8B, and the paleoecologic interpretation of the main species associations in Fig. 8C. Axis 1 (explaining 20.8% of the variance) separates PETM biofacies 2 and 3 from all others. Axis 2 (explaining 17.7% of the variance) mainly separates PETM biofacies 5 from all others, particularly Paleocene Bass River biofacies 1. Most large epibenthic morphotypes (e.g., Cibicidoides succedens, C. alleni and G. beccariiformis) have more positive scores on axis 1 than most endobenthic morphotypes (Fig. 8B). Gavelinella beccariiformis, which is characteristic for oxic, oligotrophic environments (Widmark and Speijer, 1997; Clemmensen and Thomsen, 2005), plots very high on axis 1, low on axis 2, whereas most buliminids, with the exception of B. hornerstownensis, plot more positively on axis 2. Paralabamina lunata is a common species in mesotrophic, moderately to well-ventilated shelf environments in the North Sea and Egyptian basins (Clemmensen and Thomsen, 2005; Ernst et al., 2006), extending into overall oligotrophic deep-sea environments (Thomas, 1998). This species has intermediate values on axis 1 and relatively low values on axis 2. Anomalinoides zitteli and B. callahani plot high on both axes 1 and 2. These species have generally been reported to occupy dysoxic to oxic environments with high organic flux (e.g., Dababiya section in Egypt, Ernst et al., 2006). Tappanina selmensis, A. acutus and P. prima have low values on axis 1 and intermediate values on axis 2. Olsson and Wise (1987) noted that these stress-tolerant taxa are common components in small-sized, low-diversity faunas in the NJCP, and are regarded as indicators of hypoxic environments. We conclude that the DCA axes represent changes in bottom water conditions, linked to bottom water oxygenation (axis 1) and organic flux to the sea floor (axis 2). Paleodepth appears less important, because taxa associated with an outer shelf living habitat (Fig. 9 and supplementary data) have both high and low scores on both axes (e.g., B. callahani: association V, G. beccariiformis: association Ib, A. acutus: association IIa). Distinct paleoecologic affinities are thus attributed to these statistically identified foraminiferal associations (Fig. 8C). Many benthic foraminiferal taxa (e.g., C. alleni, C. succedens, A. acutus, P. prima ) are part of the globally recognized, Midway-type shelf fauna (Berggren and Aubert, 1975), although some common taxa may be restricted to the Salisbury embayment (e.g., B. virginiana and B. hornerstowensis). These interpretations may be extended to other open shelf settings in the Salisbury embayment, but extrapolation to more remote shelf 8
9 margins is more problematic. Some of these foraminiferal associations are recognizable in other shelf settings despite differences in paleodepth (association IIa in the shallow shelf setting of the Gulf Coastal Plain, e.g., Kellough, 1965), or sea floor sediments (association V in the hemipelagic Egyptian settings, e.g., Ernst et al., 2006). 4.4 Trophic and redox conditions Biofacies 1, corresponding to coarse-grained sediment, contains the highest abundances of epibenthic morphogroups (Figs. 10 and 11), indicating well-oxygenated bottom waters, possibly close to the storm wave base. Oligotrophic to somewhat mesotrophic oxic environments occurred during the latest Paleocene in the deeper parts of the basin (Bass River) as indicated by the common presence of G. beccariiformis, a bathyal species capable of invading oligotrophic shelf margins (Widmark and Speijer, 1997). At the more inland Wilson Lake, foraminiferal assemblages were less diverse and dominated by B. virginiana, indicative of a slightly more eutrophic, yet oxic environments. The transitional biofacies with increasing abundance of association IIa taxa (A. acutus and P. prima) indicates more stressful environmental conditions, probably due to a change to moderately dysoxic bottom waters, but oxygenation levels were sufficient to sustain moderately diverse benthic assemblages. The unusually high proportion of stress-tolerant taxa of association IIa in biofacies 2 suggests that bottom water conditions were either persistently or intermittently stressful for the benthic biota. This foraminiferal species association has been linked to high surface productivity and/or lowered bottom water ventilation (e.g., Olsson and Wise, 1987; Gibson et al., 1993; Gibson and Bybell, 1994). The lower scores on DCA axis 2 point to the strongest oxygen depletion (extreme dysoxia) of all studied biofacies, probably extending from the sediment into the lowermost parts of the water column, as indicated by the near absence of large epibenthic morphogroups. High foraminiferal densities indicate that anoxia were not persistent. Biofacies 3 is more diverse, characterized by stable abundance of association IIb species, indicating improvement of environmental conditions as more species were able to obtain a niche. Dysoxia no longer extended into the water column or were less continuous throughout the year, as indicated by the reappearance of epibenthic morphogroups (e.g., C. succedens) at Bass River (moderate to severe dysoxia), and to a lesser extent at Wilson Lake (extreme to severe dysoxia). The large proportion of endobenthic morphogroups and stress-tolerant taxa (association IIa) indicate persistent mesotrophic bottom water conditions. Biogenic magnetic nanoparticles are common in biofacies 2 and 3 (Kopp et al., 2007, 2009; Stassen et al., 2012b). Magnetiteprecipitating bacteria thrive in suboxic pore water conditions at high iron bioavailability, but in anoxic conditions magnetite dissolves. The occurrence of the magnetic particles thus supports the reconstruction of dysoxic, but not anoxic conditions within the sediment as deduced from the benthic assemblages. Biofacies 4 contains the most diverse PETM assemblage, indicating further improvement of bottom water oxygenation to somewhat less dysoxic (severe-moderate dysoxia) conditions, and the magnetic particles decline. The disappearance of biogenic magnetic nanoparticles and sudden dominance of B. callahani indicates a major environmental change within biofacies 5. At Dababiya (Egypt), a similar and coeval peak abundance of B. callahani (Stassen et al., 2012d) is linked to the occurrence of a high organic flux in a re-oxygenated basin (Ernst et al., 2006). Biofacies 5 thus probably reflects eutrophic oxic bottom waters, sustaining large populations of buliminids. 9
10 High foraminiferal diversity within biofacies 6 indicates a stable, not perturbed environment. More coarse-grained sediments suggest stronger turbulence and more oxygenated conditions, yet the abundance of endobenthic morphotypes and the consistent occurrence of A. acutus and P. prima indicate moderate dysoxic bottom water conditions and a high organic flux to the sea floor. Similar environmental conditions occurred during the deposition of biofacies 8. Biofacies 7 is enriched in lobate glauconite grains and contains a low-diversity foraminiferal assemblage, dominated by B. virginiana, indicative of higher food availability and severely dysoxic bottom water conditions. 4.5 Taphonomy Although the foraminifera are generally well-preserved, specimens from the sandy facies are less translucent ( frosty ) than those within the PETM clays, with a selective alteration of large epibenthic forms, indicating differential taphonomic effects in different lithologies. Upper Paleocene sediments in the NJCP accumulated relatively slowly (<1 cm/kyr), and sediment accumulation rates increased strongly during the PETM (Sluijs et al., 2007b; John et al., 2008; Stassen et al., 2012b). The very low numbers in the upper Paleocene most likely indicate taphonomic loss in these sandy strata and the higher foraminiferal numbers within the PETM clays are probably also indicative of increased test production. Condensation results in exceptionally high foraminiferal numbers without significant %P changes, as observed at the base of biofacies 2 at Bass River. The elevated foraminiferal numbers at the base of biofacies 7 correspond to very low %P, suggesting taphonomic processes in addition to condensation. These sediment recovered by drilling has not been subject to secondary leaching in outcrop, thus dissolution may have occurred only syn- or early post-depositional, e.g. due to oxidation of organic material (e.g., Murray and Alve, 1999). Dissolution generally results in increased relative abundances of large, robust taxa (Nguyen et al., 2009), yet small fragile species are common throughout the studied intervals (e.g., B. virginiana), suggesting limited alteration by dissolution. Only thin intervals devoid of nannofossils in the uppermost Paleocene correspond to carbonate-poor, foraminiferal barren zones (Figs. 3 and 4; Gibbs et al., 2006a). Tappanina selmensis and planktic foraminifera are more common in the PETM clays, also indicating a lack of carbonate dissolution as both are more prone to dissolution (e.g., Nguyen et al., 2009). The low %P, very low foraminiferal numbers and a prominent drop in the carbonate content in biofacies 5 indicate partial dissolution (Fig. 4). This taphonomic change did not affect the paleoecologic signal much, because the moderately dissolution-resistant B. callahani (Nguyen et al., 2009) remains abundant. Taphonomic modification also includes physical abrasion of foraminiferal tests in slowly accumulating sediments, subjected to constant sediment mixing through intense bioturbation, and re-suspension by strong tidal or wind-induced currents. Abrasion results in the selective loss of planktic and fragile benthic foraminiferal specimens at the sediment surface, and a residue of polished and/or broken large tests (Brunner and Biscaye, 2003; Murray, 2006). Foraminiferal tests of biofacies 1 remained long time near the sediment surface (low accumulation rates), consequently undergoing intense abrasion, leading to the observed impoverished assemblage, with damaged, large frosty epibenthic morphotypes. Only small endobenthic morphotypes are better preserved, somewhat protected by their infaunal habitat, as the taphonomically active zone moved up slowly with sedimentation (Loubere et al., 1993). Depth estimates of the Vincentown Fm. based on %P may thus be severe underestimated due to selective loss of planktic specimens. These periods of post-mortem abrasion and 10
11 dissolution within the taphonomically active zone were more intense in the shallower and sandier Wilson Lake than in the siltier Bass River setting. Mechanical test damage and dissolution are thus generally absent in the silty clays of the Marlboro Clay, in exception of biofacies 5. Glauconitic grains in the sandy to silty clays of the lower Eocene Manasquan Fm. are significantly larger and more lobular in shape than the surrounding quartz grains, indicating an authigenic origin in a lower-energy environment. Foraminiferal test damage is also less severe in the silty clays of the Manasquan Fm. than in the upper Paleocene Vincentown Fm. 5 DISCUSSION 5.1 Late Paleocene-early Eocene water depths and sedimentary regimes Wilson Lake is positioned more proximal to the coast than Bass River (Fig. 1) and respectively inner to middle (WL: m), and deep middle to outer neritic settings (BR: m) are inferred (e.g., Zachos et al., 2006; John et al., 2008; Harris et al., 2010; Wright and Schaller, 2013). These estimates are mainly based on foraminiferal faunas and basin gradient modeling (e.g., Olsson and Wise, 1987; Browning et al., 1997a). This modeling technique integrates foraminiferal abundance data with the paleoslope gradient, but the paleodepth calibration is hampered by lack of accurate paleo-coastline positioning due to erosion of the nearshore facies. Backstripping analysis allows an assessment of the regional New Jersey sea level curve, indicating that minor fluctuations in sea level (falls ~10-20 m; rises ~10-40 m) occurred during the early Paleogene, with highest sea level reached during the early Eocene (Van Sickel et al., 2004; Kominz et al., 2008). Various paleobathymetric approaches (based on lithology and foraminiferal assemblages) point to a significant sea-level change across the P-E boundary (Figs. 10 and 11), as has been long recognized (e.g., Olsson and Wise, 1987; Gibson et al., 1993). Olsson and Wise (1987) assumed an unconformity at the base of the Marlboro Clay (their unnamed unit ) with an unknown rate of sea-level change across this hiatus. Recognition of the CIE led to the realization that this apparent New Jersey sea-level rise (60-70 m; Harris et al., 2010) must have occurred over less than about 10 kyr, which seems highly improbable or even impossible in a largely icefree greenhouse world (DeConto and Pollard, 2003). ). Harris et al. (2010) thus argued that the paleodepth estimates for the Marlboro clay were overestimates due to non-specified severe environmental changes during the PETM, and that the paleodepth estimates for the Vincentown Fm. were correct. The paleodepth estimate of ~70-80 m for the Marlboro Clay at Bass River was accepted by Wright and Schaller (2013). In contrast, Stassen et al (2014) argued that the paleodepth estimates for the well preserved assemblages of the Marlboro Clay are correct (i.e. ~ 130 m for Bass River), and those for the Vincentown Fm. incorrect due to taphonomic changes. Nevertheless, a rapid eustatic sea-level rise has been reconstructed at about the PETM-onset worldwide, possibly reflecting the melting of small Antarctic ice sheets combined with steric sealevel rise (Speijer and Wagner, 2002; Sluijs et al., 2008), with estimates of PETM-related eustatic sea-level rise of ~20-40 m in the southern Tethys (Speijer and Morsi, 2002; Stassen et al., 2012a). Therefore, a careful assessment of environmental and taphonomic changes is needed to evaluate the paleobathymetric development of the NJCP across the base of the CIE. We do not directly rely on the relationship between %P and water depth as this can be strongly distorted by taphonomy and anoxia (Van der Zwaan et al. 1990). We compare paleodepth estimates based on lithology, planktic foraminiferal abundance and benthic foraminiferal associations (biofacies 11
12 model). The different methods (Fig. 9) result in similar trends in sea-level change, but with different magnitudes (Figs. 10 and 11) Late Paleocene (Biofacies 1) The lithofacies in the NJCP have been interpreted in terms of paleobathymetry (Olsson and Wise, 1987). Their simple lithofacies model suggests deposition of uppermost Paleocene glauconitic sands and silts in middle neritic settings, in agreement with low %P. However, characteristic nearshore species recognized in other regions (Anomalinoides umboniferus, Globulina gibba and Pararotalia perclara; Olsson and Wise, 1987) are absent, as are bivalves and other invertebrates, indicating that water depths were never shallower than ~50 m over the studied interval. The benthic foraminiferal fauna indicates shallow outer neritic (WL: m) to deeper outer neritic settings (BR: m) during the latest Paleocene, with an inter-site depth difference in agreement with the paleoslope gradient, and estimates not influenced by exclusion of association IIa species. Such a deep shelf setting is supported by the common presence of G. beccariiformis, diverse nannoplankton associations (Gibbs et al., 2006a), and the presence of a (at least seasonally) well-developed water column temperature and carbon isotope gradient (Zachos et al., 2006, 2007; John et al., 2008). Our biofacies estimates indicate significantly greater depths than inferred from the accumulation of quartz-rich sands with low %P. We argue that the uppermost Paleocene sediments probably were subject to extensive winnowing leading to lag deposits of relatively large quartz grains, with significant taphonomic loss of planktic and epibenthic foraminifera, especially at the shallower Wilson Lake. Fair-weather and storm wave base, important levels in sediment dynamics, reach depths between 30 to 50 m in modern open shelf regions (Immenhauser, 2009), but sediments in deeper parts of the shelf may be subject to intense, episodic wave agitation or tidally-driven currents (e.g., Scott et al., 2003). In addition, bottom currents triggered by extreme storms or hurricanes can re-suspend sediments and scour the sea floor up to depths of 50 to 90 m (Teague et al., 2007). Offshore currents parallel to the coastline may also have been active (e.g., Huber et al., 2003). The sediment-starved New Jersey shelf (Browning et al., 2008) was gradually shallowing in the late Paleocene (Gibson and Bybell, 1994; Harris et al., 2010) and the slow accumulation of coarse grained sediments in deep-shelf settings may have been close to equilibrium, with re-suspension through vigorous bottom water currents PETM (transitional biofacies, biofacies 2-5) The shift to more clayey sediments (Marlboro Clay, the onset of the PETM) suggests a significant sea-level rise, and the establishment of deep outer neritic settings (Olsson and Wise, 1987; Gibson et al., 1993). At both sites, a rapid increase of planktic foraminifera at the base of the CIE also suggests a significant shift to deeper waters, with water depth estimates during the PETM exceeding 150 m. A pronounced increase in water depth is also indicated by the onset of the benthic foraminiferal transitional biofacies and biofacies 2, resulting in water depth estimates of m ( * m) at Wilson Lake, and approximately 140/135* m at Bass River. Note that we evaluate the effect of dysoxic bottom water conditions during the PETM by excluding the more opportunistic association IIa taxa from the biofacies paleodepth calculations (* indicates exclusion), as peak abundances of these species are questionable paleodepth indicators in poorly diverse assemblages. Nonetheless, paleodepth remained quite deep for the overlying more diverse 12
13 overlying PETM biofacies (WL m/ * m; BR / * m). Biofacies 5 is dominated by B. callahani, representing considerable environmental stress and therefore generating unreliable depths as such opportunistic species probably have wide ecologic niches without bathymetric preference. PETM sediments are thus characterized by high abundances of planktic foraminifera, diverse nannoplankton assemblages, changes in the benthic foraminiferal assemblage, a large increase in the amount of clay, and virtual absence of sand-sized particles, all indicating an increase in water depth, a larger distance to the coast, and considerably less vigorous bottom currents. According to the Wilson Lake biofacies model, water depth increased by approximately by m at the CIE-onset, and remained high in the succeeding PETM biofacies. Such a rise in sea level cannot be discerned at Bass River due to the deeper initial setting. The rising sea level created additional accommodation space and deepened the New Jersey shelf at least in part below the storm wave base, resulting in silty clay deposition. An indirect effect of sea-level rise may have been a change in geomorphology, influencing the strength of tidal currents. Yet, the shift to more clayey strata cannot have been caused by sealevel rise alone, because this alone would cause a simple coastward shift of depositional settings (e.g., PETM assemblages and lithology at Wilson Lake resembling pre-petm settings at Bass River). This is not observed, as depositional settings changed significantly and in the same way along the NJCP (Stassen et al., 2012b), and probably most of the Salisbury embayment (Gibson and Bybell, 1994). These changes in depositional setting were related to global warming during the PETM, and include an intensified hydrologic cycle with variable seasonal precipitation patterns (intense wet season and prolonged dry season), and accelerated hinterland erosion of exposed kaolinite-rich Cretaceous deposits (Kopp et al., 2009; John et al., 2012). Intensified erosion resulted in increasing sediment loads in the rivers, supplying large amounts of suspended clay (Gibson et al., 1993; Zachos et al., 2006; Kopp et al., 2009), and leading to enhanced sediment accumulation rates at all sites. A major additional increase in accumulation rates occurred from the base of biofacies 3, although inter-site differences exist (Stassen et al., 2012b). The elevated sediment supply, pulses of dinocysts with a low-salinity affinity (Sluijs and Brinkhuis, 2009), influx of kaolinite (Cramer et al., 1999; Gibson et al., 2000), and magnetofossil evidence all support establishment of a tropical river-dominated shelf (Kopp et al., 2009). Yet the high %P and stable isotope gradients between planktic genera (symbiont-bearing taxa calcifying in the mixed layer, non-symbiont bearing species in the thermocline, Zachos et al., 2006; John et al., 2008) indicate periods of non-turbulent surface water. The foraminiferal assemblages thus point to at least a seasonally clear photic zone, reduced vertical mixing (absence of bottom currents) and mud belt deposition in a deep shelf setting during the PETM, contrasting with the Paleocene sedimentary regime. Episodically occurring flood events would supply the large sediment flux (Kopp et al., 2009) Early Eocene (post-petm, biofacies 6-8) The PETM clays are truncated by a regional sequence boundary (Stassen et al., 2012b), yet the exact magnitude of the associated sea-level fall cannot be deduced. The lobate and variable sized glauconite grains from the Manasquan Fm. indicate deposition below the storm wave base in a low-energetic, sediment-starved deep shelf environment (in analogy with modern >125 m settings, Porrenga, 1967; Immenhauser, 2009). The lower %P and coarser-grained lithology of the lower Eocene biofacies 6-8 at Wilson Lake indicate a return of shallower settings. Foraminiferal depth estimates for biofacies 6 are roughly 135/130* m, for biofacies 7: 13
14 / * m, and for biofacies 8: / * m. The coarse fraction of biofacies 7 consists of almost pure glauconite, indicating strong winnowing or intensification of lowenergy highly productive environments (dominance by B. virginiana), which may reflect regional upwelling as suggested by climate models (Huber et al., 2003). 5.2 Regional sequence stratigraphy The NJCP is a well-studied passive continental margin, where Cenozoic sea-level changes have been extensively reconstructed because of an assumed simple subsidence history and good chronostratigraphic control (e.g., Harris et al., 2010), although this simplicity is questioned (e.g., Rowley et al., 2013). Important sequence boundary surfaces are recognized, yet attribution of the biofacies to specific systems tract is presently not possible due to the uncertain positioning of the maximum flooding surfaces, environmental disturbance during the PETM and multiple Eocene discontinuities with an erosive base. Our studied intervals correspond to the Pa3a, Pa3b, E1 and E2 sequences (Browning et al., 1997b; Harris et al., 2010). Based on the %P (Harris et al., 2010) and the dinoflagellate Spiniferites Areoligera ratio (Sluijs et al., 2008), a latest Paleocene transgression has been proposed, with a subtle sequence break at BR m (Harris et al., 2010). Our observations indicate a %P increase below this level (Fig. 4), but no distinct pre-cie benthic foraminiferal biofacies changes. The %P increase at Bass River most probably is a taphonomic signal (slightly better preservation of the planktic foraminifera), and no equivalent signal is present at Wilson Lake. We thus argue that no significant sea-level change occurred prior to the PETM, and transgression started at the P-E boundary (Figs. 10 and 11). All uppermost Paleocene glauconitic sands and silts of the Vincentown Fm. are thus attributed to the Pa3a sequence (Fig. 12). Our paleodepth estimates support a sea-level rise on the order of m, followed by high sea level during the PETM. At all sites, the Pa3b sequence is confined to the CIE interval, encompassing the entire Marlboro Clay interval. A regional unconformity marks the top of Pa3b, indicative of a significant post-petm sea-level fall, and partial removal of PETM sediments, varying between the different sites (Stassen et al., 2012b). Eocene sequences E1 and E2 in the NJCP correspond respectively to nannoplankton Zones NP10 and NP11 (Browning et al., 1997b). The placement of the E1 sequence above the WL m unconformity and E2 sequence above the WL m unconformity results in a stratigraphic overlap of E2 at Wilson Lake with E1 at Bass River (Miller et al., 1998). The recognition of a previously unreported discontinuity at WL m, recognizable by a decline of B. virginiana and a decrease in glauconite content, supports a sequence boundary for E2 at WL m, with the E1 sequence subdivided in E1a and E1b (Fig. 12). The two closely spaced sequence boundaries at Bass River ( and m) may reflect a very thin E1a sequence. 5.3 Paleoenvironmental evolution from late Paleocene into early Eocene The P-E boundary sequence in the NJCP has been the subject of high-resolution studies, including dinocysts (Sluijs and Brinkhuis, 2009), calcareous nannoplankton (Gibbs et al., 2006b) and stable isotopes (Zachos et al., 2006; John et al., 2008). We integrate these data with our foraminiferal abundance patterns and biofacies distribution into a paleoenvironmental reconstruction of surface and bottom water conditions (Fig. 12) within a regional stratigraphic framework (Stassen et al., 2012b). 14
15 5.3.1 Pre-PETM paleoenvironments Benthic foraminiferal assemblages (biofacies 1) indicate for the latest Paleocene moderately dysoxic to oxic, mesotrophic (Wilson Lake) and oxic oligotrophic (Bass River) outer shelf environments, under the influence of energetic, tidal or storm-induced currents. The occurrence of G. beccariiformis indicates a shelf-ward expansion of oligotrophic conditions, thus frontal upwelling was probably absent. Biofacies 1 was deposited in a sediment-starved, currentdominated, moderately productive open marine environment with normal surface water salinity (Fig. 12). This is in agreement with the dinocyst record indicative for energetic surface water conditions (Sluijs and Brinkhuis, 2009), and a diverse nannoplankton assemblage adapted to oligotrophic warm-water conditions (Gibbs et al., 2006b). Limited precursor events occurred prior to the PETM, such as the start of the Apectodinium bloom and a higher Spiniferites-Areoligera ratio (Sluijs and Brinkhuis, 2009), rising surface water temperatures (Sluijs et al., 2007b), increased accumulation rates and declining grain-size at Wilson Lake (Stassen et al., 2012c) and increased kaolinite input (John et al., 2012). These pre-petm environmental changes are corroborated by the increasing %P and diversity from WL m and BR m onwards, starting 40 to 45 kyr prior to the main environmental changes (Fig. 12, Stassen et al., 2012c). This may indicate a transition in the climate system through reduced storm activity and perhaps intensification of near-shore riverine influence PETM environments Paleo-rivers in the Salisbury Embayment were relatively quiescent during the early Paleogene with only nearshore influences, but probably strongly intensified during the PETM (Kopp et al., 2009). The present-day analog for the NJCP during the PETM may be a tropical river-dominated shelf fed by large-scale energetic river systems, combining high surface water productivity with low-organic carbon bearing sediments, and thick sedimentary suboxic zones (Schumann et al., 2008). Associated shelf density currents control the (re)distribution of suspended mud, which is kept in suspension by internal turbulence, regionally reaching the shelf break (Leeder, 1999). For instance, during periods of high river discharge, the Amazon plume reaches out to about km from the shoreline, before being deflected by strong offshore currents. Similar dynamics may have developed in an Appalachian-fed deltaic system, with variable clay accumulation in a wide mud belt (Kopp et al., 2009; Stassen et al., 2012b). The overall controlling parameter of benthic communities within this mud belt was probably the long-lasting oxygen deficiency and the increased organic fluxes to the sea floor. The succession of different biofacies indicates transitional changes in bottom water conditions (Fig. 12). Conditions that may have pushed bottom waters to hypoxia (oxygen deficiency) in the NJCP include increased primary production, thus higher oxygen consumption rates (Gibbs et al., 2006b), intensification of water column stratification triggered by fresh water discharge (Sluijs and Brinkhuis, 2009), and substantially higher PETM temperatures (Zachos et al., 2006; John et al., 2008). However, the consistent presence of benthic biota and magnetofossils exclude the occurrence of long-term anoxia. Near-coastal settings on such river-dominated shelves are characterized by reduced phytoplankton productivity and rapid accumulation of allochthonous organic matter, whereas increased stratification regulates the water column ventilation in the more distal, and less turbid settings (e.g., Bianchi et al., 2010). High rates of mud accumulation in the NJCP and high 15
16 planktic foraminiferal abundances in combination with a vertical isotope gradient in different genera of planktic foraminifera (Zachos et al., 2006; John et al., 2008) indicate non-turbid open marine conditions during at least part of the year, in a distal, outer shelf setting. The lack of terrestrial palynomorphs in the NJCP (Zachos et al., 2006) could be due to scarce vegetation in the hinterland, but this is not supported by vegetation modeling (Herold et al., 2014), and is thus consistent with a setting remote from the river discharge area. In modern mud belts close to a major river outflow, seasonally developing hypoxia are common (van der Zwaan and Jorissen, 1991). For example, in the Gulf of Mexico near the Mississippi River outflow, the development of hypoxia begins with spring runoff, reaching a maximum during the summer, then disappearing during autumn storm mixing (Osterman, 2003). Biofacies in mud belts surrounding large river mouths therefore commonly show a systematic seasonal increase of less diverse benthic fauna, which can be used as a proxy for shelf hypoxia (e.g., Culver and Buzas, 1983; van der Zwaan and Jorissen, 1991; Osterman, 2003; Gooday et al., 2009). Species from the association IIa are the most common taxa in PETM assemblages, with only rare occurrence in the uppermost Paleocene sediments. We consider that they represent such a river-influenced foraminiferal community. Association IIa probably reflects a seasonal signal of stress-tolerant taxa (ecologic generalists), taking advantage of the high food availability and low competition during hypoxic conditions, whereas the total dead assemblage contains a mixture of assemblages reflecting the different seasonal conditions (remaining benthic foraminiferal fauna). The foraminiferal data indicate a sea-level rise at the PETM onset (transitional fauna), followed by the establishment of poorly diverse foraminiferal assemblages. The dominance of taxa of association IIa (T. selmensis, A. acutus, and P. prima) in the lower part of biofacies 2 is possibly indicative of year-round strong hypoxic (extreme dysoxia) conditions at high organic flux during the PETM peak warming ( 40 kyr after onset, Fig. 12). Climate during PETM peak warming was probably warm and humid (Bowen et al., 2004), consistent with increased mean precipitation rates in the northern mid latitudes (Winguth et al., 2010). We thus reconstruct a regional prodeltaic environment in a warm humid climate, with a buoyant hyperpycnal plume and mud flow related to regular periods of increased river discharge (biofacies 2). Stratification could have been thermal and/or salinity driven, in the absence of vigorous bottom currents. Runoff periods (increased riverine nutrient supply) provoked continuous eutrophication of the outer shelf and establishment of long-lasting river-influenced foraminiferal communities. Surface salinity did not fall severely in view of the highly diverse planktic biota, and the lack of persistently abundant low-salinity tolerant dinocysts in the early stages of the PETM, although the genus Apectodinium was likely euryhaline (Sluijs and Brinkhuis, 2009). Increasing abundances of foraminiferal association IIb taxa and increasing diversity towards the top of biofacies 2 indicate a weakening of constant dysoxia at the sea floor and probably record the gradual evolution of a warm humid climate to a climate system with seasonally variable precipitation patterns (Fig. 12). Accumulation rates increased significantly 40 kyr after the onset of the PETM (Stassen et al., 2012b), probably indicating the establishment of extreme, monsoon-like seasonal precipitation patterns during brief wet seasons and prolonged dry seasons (Zachos et al., 2006). The combination of diverse planktic biota and highest abundances of low-salinity tolerant dinocysts also points to episodic, probably seasonal, salinity changes, or longer duration of the oxygenated season. Increased diversity and more stable foraminiferal abundances in biofacies 3 and 4 suggest a general amelioration of environmental bottom-water conditions. These biofacies are therefore interpreted as the result of weakened persistent stratification and cyclic flood events, creating pulsed organic fluxes and periodic dysoxia. Association IIa species still flourished under seasonal perturbations, and under more stable conditions relatively diverse and more even 16
17 foraminiferal faunas occurred (associations IIb and IV), although the water column was not fully oxygenated during any part of the year. Biofacies 5 corresponds to the final CIE recovery, starting 95 kyr after the PETM onset (Stassen et al., 2012b). The strong dominance of B. callahani coincides with blooms of dinocysts indicative of eutrophic conditions. Reduced foraminiferal abundance is probably caused by dissolution, reflecting increased vertical mixing due to pycnocline weakening and/or increasing tidal current or storm activity (coeval siltier strata at Ancora, Stassen et al., 2012b), and resulting enhanced oxidation in the taphonomically active zone. The absence of the river-influenced foraminiferal associations suggests that river influence on the outer shelf setting was declining, although river-induced eutrophication of the shelf continued (Fig. 12) Post-PETM paleoenvironments Post-PETM biofacies lack evidence of dysoxia and stratification, suggesting a more ventilated basin with eutrophic, slightly dysoxic bottom-water conditions, in part under the influence of frontal upwelling. The recurrence of river-influenced assemblages (association IIa) at the top of studied interval coincided with new pulses of low saline tolerant dinocysts (Fig. 12), marking the return of episodic river discharges towards the outer shelf. This riverine influence was too weak to disturb the benthic communities. 5.4 Shallow water biotic turnover during the PETM At the onset of the PETM, deep-sea benthic foraminifera suffered severe extinction (Tjalsma and Lohmann, 1983; Thomas, 1989, 2007). Extinction was considerably less severe on the southern Tethyan shelves, as most shelfal taxa reappeared in the aftermath of the PETM (Speijer et al., 1995, 1996; Stassen et al., 2012a), with limited net ecosystem changes (Stassen et al., 2012d). Most taxa which became extinct have a deep-water affinity, including G. beccariiformis and Angulogavelinella avnimelechi (Speijer et al., 1996; Speijer and Schmitz, 1998; Ernst et al., 2006). Although there were major environmental changes at the onset of the PETM in the NJCP, with a large biotic response, only G. beccariiformis became extinct, and Bulimina cacumenata and B. callahani first appeared during the PETM. The appearance of these buliminids is migratory, because they were extant in the Paleocene (B. cacumenata: Gulf Coastal Plain; e.g., Cushman, 1951 and B. callahani: Egypt; e.g., Ernst et al., 2006). Most disappearances at the P-E boundary in the NJCP were temporary, as species reappeared in the upper part of the Marlboro Clay or the Manasquan Fm., resulting in a minor taxonomic turnover compared to the extinction in the deep-sea. In addition, the presence of a transitional biofacies at the PETM onset indicates a gradual biotic response to the massive release of greenhouse gasses. We speculate that the extinction rate in the NJCP was very low because most species could survive in refugia which remained oxygenated, either in time (seasonally?) or in space (adjacent embayments?). Cosmopolitan G. beccariiformis was not capable of retaining a suitable niche, because this species was adapted to oligotrophic deep shelf and bathyal settings. The Paleocene New Jersey shelf occurrence reflects the upper limits of its distribution, and the combination of shelf eutrophy and perturbation of the deep-sea habitat (Thomas, 1998; Winguth et al., 2012) pushed this species to extinction. 6 CONCLUSIONS 17
18 Foraminiferal analysis allowed the recognition of a stratigraphic succession of eight biofacies at Wilson Lake and Bass River, reflecting changes in oxygenation, organic fluxes and paleodepth across the PETM in the New Jersey Coastal Plain. The biotic impact of the PETM was significant and oxygen deficiency was probably the major controlling parameter, but net extinction of benthic species was limited. The uppermost Paleocene sandy Vincentown Formation was deposited in an outer neritic setting with mesotrophic to oligotrophic, oxic to moderately dysoxic bottom conditions. Its paleodepth previously inferred as inner neritic was underestimated due to taphonomic effects reducing the number of planktic foraminifera. No significant foraminiferal events preceded the onset of the PETM, although a gradual transition into the PETM climate system may have occurred, starting 40 kyr prior to the CIE onset. The onset of the PETM marks the diminution of Paleocene benthic communities, but the overall taxonomic turnover is insignificant compared to the deep-sea extinction event, with only one species becoming extinct in this shelf region (Gavelinella beccariiformis). Benthic communities were severely disrupted during the early stages of the PETM peak warming (< 40 kyr) with the establishment of an outer shelf river-influenced assemblage, in response to persistent stratification, oxygen depletion and eutrophication. Sediments accumulated in a continuously dysoxic mud belt system during the PETM. The later stages of the PETM (40-70 kyr) and initial recovery (70-95 kyr) were characterized by seasonal variations in dysoxia, possibly related to pulses of riverine outflow due to extreme seasonal precipitation patterns. The final recovery at Bass River is associated with re-oxygenation of the sea floor, by increased vertical mixing at continued eutrophic conditions, starting ±95 kyr after the onset of the PETM. No complete faunal recovery occurs below the Eocene unconformities. Post-PETM environments were meso- to eutrophic, yet sufficiently ventilated to avoid severe benthic stress. 7 ACKNOWLEDGEMENTS This research used samples and data of the United States Geological Survey (USGS) and ODP Leg 174AX, provided by the Integrated Ocean Drilling Program (IODP). Financial support was provided by grants from the KU Leuven Research Fund and the Research Foundation Flanders (FWO) to Robert P. Speijer and Peter Stassen, and by the National Science Foundation (NSF) Grant OCE to Ellen Thomas, who also received funding from the Leverhulme Trust. This work benefitted from Synthesis projects SE-TAF-2732 and BG-TAF-3966, which were financed by the EU-Research Infrastructure Action under the FP7 Capacities Specific Program. We thank the editor Frans Jorissen and two anonymous reviewers for constructive comments. APPENDIX Supplementary data associated with this article can be found in the online version. Appendix A: Census data of the benthic foraminifera in the larger than 63 µm fraction. Appendix B: Supplementary information on paleobathymetric preference of the New Jersey Coastal Plain benthic foraminifera. Appendix C: Taxonomic notes. 18
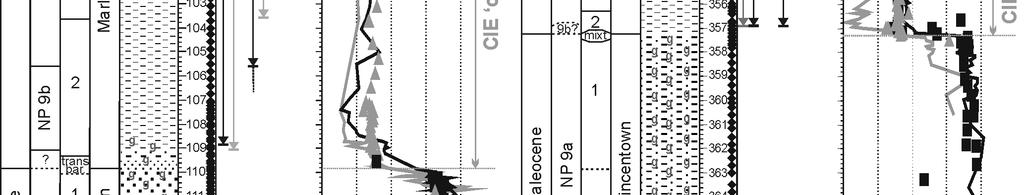
19 10 FIGURE CAPTIONS Figure 1 A: Paleogeographic reconstruction of North America during the Paleocene (60 Ma, modified after Blakey s maps, B: Enlarged view of the New Jersey Coastal Plain with the position of the Wilson Lake and Bass River sites. Fall Line represents the boundary between undeformed Cretaceous-Cenozoic sediments and pre-cretaceous basement rocks. Figure 2 Detailed stratigraphy of the Wilson Lake and Bass River sites. Nannoplankton ranges after Aubry et al. (2000, medium gray), Gibbs et al. (2006a, black) and Laurel Bybell (pers. comm., light gray). Isotope records after Zachos et al. (2006; WL bulk carbonate), Sluijs et al. (2007b, WL and BR dinocyst organic material), John et al. (2008, BR bulk carbonate) and Stassen et al. (2012b, WL and BR foraminiferal isotope records). Figure 3 Weight percentage of the fraction larger than 63 micrometer (wt% > 63 µm) ), carbonate content (% carbonate, Zachos et al., 2006) and general foraminiferal parameters such as planktic-benthic ratio (%P), planktic and benthic foraminifera per gram sediment (respectively PF/gram and BF/gram) and benthic foraminiferal diversity indices, such as Shannon diversity number (H(s)) and Dominance (D). Figure 4 Weight percentage of the fraction larger than 63 micrometer (wt% > 63 µm), carbonate content (% carbonate, John et al., 2008) and general foraminiferal parameters such as planktic-benthic ratio (%P), planktic and benthic foraminifera per gram sediment (respectively PF/gram and BF/gram) and benthic foraminiferal diversity indices, such as Shannon diversity number (H(s)) and Dominance (D). Figure 5 Benthic foraminiferal abundances of the most common taxa at Wilson Lake (>2.5% in at least one sample). The division into biofacies is based on the varying proportions of benthic foraminiferal species associations (Ia to V). Figure 6 Benthic foraminiferal abundances of the most common taxa at Bass River (>2.5% in at least one sample). The division into biofacies is based on the varying proportions of benthic foraminiferal species associations (Ia to V). Figure 7 Cluster analysis (Pearson correlation paired groups) indicates several benthic foraminiferal species associations (I to V); the most common taxa are underlined (>5% in at least one sample). Association I taxa have highest abundances within uppermost Paleocene and lower Eocene sediments. Species of associations IIa to IV have highest abundances within the PETM (CIE 19
20 core ). Association V contains taxa that are mainly dominant with the upper part of the PETM (CIE recovery) and lower Eocene (Manasquan Fm.). Figure 8 A) Bivariate plots of sample scores on the first and second detrended correspondence analysis axes and paleoecologic interpretation (nomenclature of oxygen levels after Tyson and Pearson, 1991). This two-dimensional ordination of the samples supports the subdivision into separated biofacies. B) The ordinations of the most common taxa (>5% in at least one sample) are plotted along the axes. C) Summary of paleoecologic interpretation of the different species association. Figure 9 New Jersey Coastal Plain paleodepth proxies, A: Paleocene and Eocene planktic-benthic ratios plotted versus their interpreted paleodepths (based on data of Youssefnia, 1978; Olsson and Wise, 1987; Browning et al., 1997a). B: Lithofacies model expressing the relationship between water depth and dominant lithology (modified after Olsson and Wise, 1987). C: Summary of paleodepth preference of the 5 discussed foraminiferal species associations (see supplementary data for more information). Figure 10 Paleodepth estimations are based on trends in lithology, planktic foraminiferal abundances and varying benthic species abundances (species associations). Interpretation of the high-food/lowoxygen indices (morphogroup proportions) indicates a close relationship with the distribution of the different foraminiferal associations, mimicking the axes of the detrended correspondence analysis (axis 1: bottom water oxygenation and axis 2: organic flux to the sea floor). Figure 11 Paleodepth estimations are based on trends in lithology, planktic foraminiferal abundances and varying benthic species abundances (species associations). Interpretation of the high-food/lowoxygen indices (morphogroup proportions) indicates a close relationship with the distribution of the different foraminiferal associations, mimicking the axes of the detrended correspondence analysis (axis 1: bottom water oxygenation and axis 2: organic flux to the sea floor). Figure 12 Summary of the biofacies, associated paleoenvironmental indicators and the interpreted paleoenvironmental reconstructions in this study (based upon Sluijs et al., 2007b; Sluijs and Brinkhuis, 2009; Stassen et al., 2012b; see text for discussion). 11 TABLE CAPTIONS Table 1 Detailed positions of the biofacies intervals stratigraphic assignment as recognized at Wilson Lake and Bass River (nannoplankton: NP; carbon isotope excursion subdivision: CIE and sequence assignment: Seq.; stratigraphic subdivision after Stassen et al., 2012b). Table 2 Averaged values of the foraminiferal parameters in the uppermost Paleocene to lowermost Eocene biofacies (planktic-benthic ratio: %P, planktic and benthic foraminifera per gram: 20
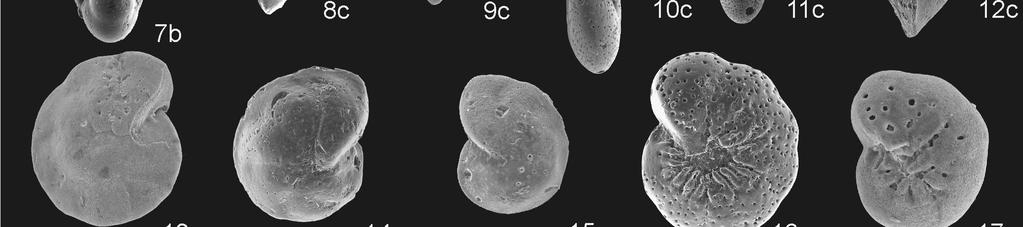
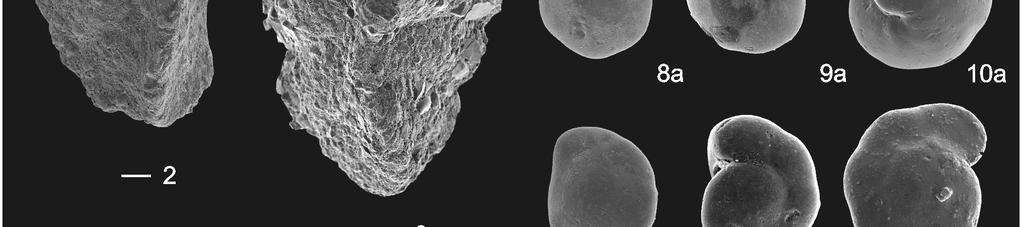
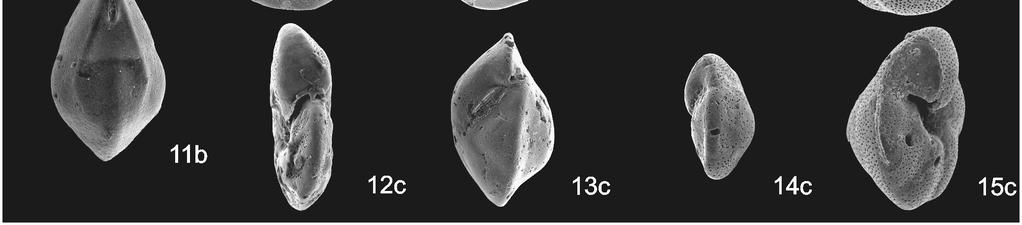
21 PF/gram and BF/gram, weight percentage >63 µm: wt%, total abundances of species associations, number of taxa: S, Fisher-alpha: F(α), Shannon-Weaver: H(s) and dominance: D). 12 PLATE CAPTIONS Plate 1 Foraminiferal species association Ia and Ib: Paleocene and continuous occurrences. Scale bar represents 100 µm. 1) Pyramidulina group (WL m) 2) Stilostomella group, e.g., Stilostomella plummerae (Cushman) (WL m) 3) Bulimina midwayensis (Cushman and Parker) (WL m) 4) Bulimina virginiana (Cushman) (WL m) 5) Bulimina hornerstownensis Olsson (WL m) 6) Tritaxia clavata (Cushman) (BR m) 7) a/b Pullenia species, e.g., Pullenia quinqueloba (Reuss) is most frequent (BR ) 8) a/b/c Paralabamina lunata (Brotzen) (WL m) 9) a/b/c Anomalinoides compressus (Olsson) (WL m) 10) a/b/c Anomalinoides affinis (Hantken) (BR m) 11) a/b/c Anomalinoides affinis (Hantken) (WL m) 12) a/b/c Osangularia plummerae Brotzen (WL m) 13) a/b/c Cibicidoides alleni (Plummer) (WL m) 14) a/b/c Cibicidoides howelli (Toulmin) (BR m) 15) a/b/c Cibicidoides howelli (Toulmin) (WL m) 16) a/b/c Gavelinella beccariiformis (White) (BR m) 17) a/b/c Gavelinella beccariiformis (White) (WL m) Plate 2 Foraminiferal species associations IIa, IIb, III and IV: mainly PETM occurrences. Scale bar represents 100 µm. 1) Spiroplectinella laevis (Roemer) (BR m) 2) Ammobaculites expansus Plummer (WL m) 3) Bulimina ovata d Orbigny (WL m) 4) Fursenkoina wilcoxensis (Cushman and Ponton) (WL m) 5) Fursenkoina aquiensis Nogan (WL m) 6) Pseudouvigerina wilcoxensis Cushman and Ponton (WL m) 7) Uvigerina elongata Cole (WL m) 8) Stainforthia sp.1 (BR m) 9) Eouvigerina whitei? Brotzen (BR m) 10) Tappanina selmensis (Cushman) (WL m) 11) Siphogenerinoides brevispinosa Cushman (BR m) 12) Uvigerina rippensis Cole (WL m) 13) Coryphostoma midwayensis (Cushman) (WL m) 14) Globocassidulina subglobosa (Brady, WL m) 15) Globocassidulina subglobosa (Brady) (WL m) 16) a/b/c Gyroidinoides subangulatus (Plummer) (BR m) 17) a/b/c Pulsiphonina prima (Plummer) (WL m) 18) a/b/c Alabamina midwayensis Brotzen (WL m) 21
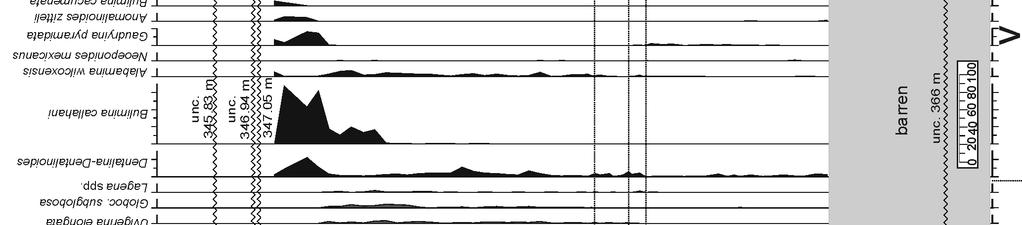
22 19) a/b/c Anomalinoides acutus (Plummer) (WL m) 20) a/b/c Valvalabamina depressa (Alth) (WL m) 21) a/b/c Cibicidoides succedens (Brotzen) (BR m) 22) a/b/c Cibicidoides succedens (Brotzen) (WL m) Plate 3 Foraminiferal species association V: PETM recovery and early Eocene occurrences. Scale bar represents 100 µm. 1) Dentalina-Dentalinoides group: Dentalinoides (cf.) longiscata (d Orbigny) (WL m) 2) Gaudryina pyramidata (Cushman) (WL m) 3) Gaudryina pyramidata (Cushman) (BR m) 4) Pseudouvigerina triangularis Jennings (WL m) 5) Bulimina cacumenata Cushman and Parker (WL m) 6) Bulimina callahani Galloway and Morrey (WL m) 7) Turrilina brevispira ten Dam (WL m) 8) a/b/c Alabamina wilcoxensis Toulmin (WL m) 9) a/b/c Gyroidinoides aequilateralis (Plummer) (WL m) 10) a/b/c Gyroidinoides aequilateralis (Plummer) (BR m) 11) a/b Lenticulina spp. (WL m) 12) a/b/c Anomalinoides zitteli (Leroy) (WL m) 13) a/b/c Oridorsalis plummerae (Cushman) (BR m) 14) a/b/c Neoeponides mexicanus (Cushman) (WL m) 15) a/b/c Neoeponides lotus (Schwager) (WL m) 22
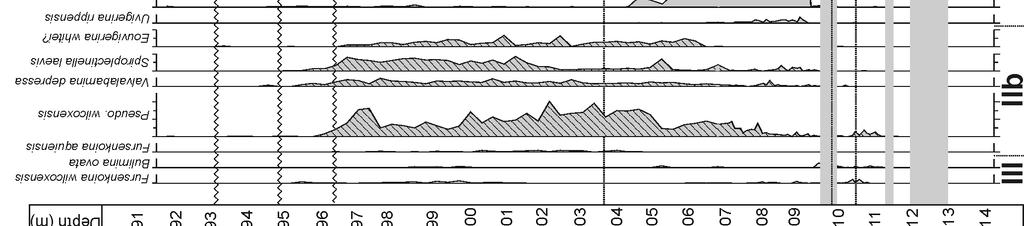
23 Stratigraphy Wilson Lake Bass River biofacies NP zone CIE Seq. base top lithology associations base top lithology associations NP10b/d- Ia, Ib, IIa and 8 NP11 post E glauconitic clayey sand V / very glauconitic clays not studied unconformity unconformity at m unconformity at m 7 NP10a-b/d post E1b very glauc. clayey sand Ia very glauconitic clays not studied unconformity unconformity at m unconformity at m 6 NP10a post E1a glauconitic clayey silt Ia, IIa and V very glauconitic clays not studied unconformity unconformity at m unconformity at m 5 NP10a recovery Pa3b not present (eroded) dark greenish gray clay V Ib, IIa, IV and 4 NP10a recovery Pa3b not present (eroded) dark greenish gray clay V 3 NP10a peak Pa3b dark clay IIa and IIb dark greenish gray clay Ib, IIa and IIb change in sedimentary regime tipping point at m tipping point at m 2 NP9b-10a peak Pa3b dark clay IIa and IIb dark greenish gray clay IIa transitional? onset Pa3b (glauconitic) clayey silt Ia, IIa and V dark greenish gray clay IIa (mixture) barren? onset? glauconitic (clayey) sand barren no dissolution 1 NP9a pre Pa3a glauconitic (clayey) sand Ia and Ib glauc. silty micaceous clay Ib minor pre-petm change tipping point at m tipping point at m 1 NP9a pre Pa3a glauconitic (clayey) sand Ia and Ib glauc. silty micaceous clay Ib barren? pre Pa3a glauconitic (clayey) sand barren glauc. silty micaceous clay barren Table 1 Wilson Lake general parameters Species association (% of total benthic) diversity biofacies P/B PF/gram BF/gram wt% Ia Ib IIa IIb III IV V S F(α) H(s) D / / / / / / / / / / / / / / / 4 / / / / / / / / / / / / / / / transition Bass River general parameters Species association (% of total benthic) diversity biofacies %P PF/gram BF/gram wt% Ia Ib IIa IIb III IV V S F(α) H(s) D 8 / / / / / / / / / / / / / / / 7 / / / / / / / / / / / / / / / 6 / / / / / / / / / / / / / / / transition Table 2 23


24 24


25 25

26 26


27 27


28 28


29 29


30 30
31 31


32 32


33 33


34 34


35 35


36 36
PALEOCEANOGRAPHY, VOL. 27, PA4210, doi: /2012pa002323, 2012
 PALEOCEANOGRAPHY, VOL. 27,, doi:10.1029/2012pa002323, 2012 Integrated stratigraphy of the Paleocene-Eocene thermal maximum in the New Jersey Coastal Plain: Toward understanding the effects of global warming
Abstract. A 40 feet core was sampled from the Mattawoman Creek in Maryland to analyze grain-size
 Abstract A 4 feet core was sampled from the Mattawoman Creek in Maryland to analyze grain-size changes during the Paleocene-Eocene Thermal Maximum (PETM). Grain-size decreases abruptly at the onset of
Depositional Sequences Sequences
 Depositional Sequences Transgressive and Regressive packages can be bound by unconformities Because sediment can only be preserved during net aggradation and progradation All other times there is either
Sedimentary Geology. Strat and Sed, Ch. 1 1
 Sedimentary Geology Strat and Sed, Ch. 1 1 Sedimentology vs. Stratigraphy Sedimentology is the study of the origin and classification of sediments and sedimentary rocks Mostly the physical and chemical
Lecture 18 Paleoceanography 2
 Lecture 18 Paleoceanography 2 May 26, 2010 Trend and Events Climatic evolution in Tertiary Overall drop of sea level General cooling (Figure 9-11) High latitude (deep-water) feature Two major step Middle
Paleo Lab #4 - Sedimentary Environments
 Paleo Lab #4 - Sedimentary Environments page - 1. CHARACTERISTICS OF SEDIMENT Grain size and grain shape: The sizes and shapes of sedimentary particles (grains) are modified considerably during their transportation
ES120 Sedimentology/Stratigraphy
 Midterm Exam 5/05/08 NAME: 1. List or describe 3 physical processes that contribute to the weathering of rocks (3pts). exfoliation frost wedging many others. roots, thermal expansion/contraction also credit
Integrated stratigraphic studies of Paleocene lowermost Eocene sequences, New Jersey Coastal Plain: Evidence for glacioeustatic control
 PALEOCEANOGRAPHY, VOL. 25,, doi:10.1029/2009pa001800, 2010 Integrated stratigraphic studies of Paleocene lowermost Eocene sequences, New Jersey Coastal Plain: Evidence for glacioeustatic control Ashley
Chapter 3 Sedimentation of clay minerals
 Chapter 3 Sedimentation of clay minerals 3.1 Clay sedimentation on land 3.2 From land to sea 3.3 Clay sedimentation in the sea 1 3.1 Clay sedimentation on land Deserts Glaciers Rivers Lacustrine 2 University
Chapter 15 Millennial Oscillations in Climate
 Chapter 15 Millennial Oscillations in Climate This chapter includes millennial oscillations during glaciations, millennial oscillations during the last 8000 years, causes of millennial-scale oscillations,
NAME: GEL 109 Final Winter 2010
 GEL 109 Final Winter 2010 1. The following stratigraphic sections represents a single event followed by the slow accumulation of background sedimentation of shale. Describe the flows that produced the
Figure 1. Locations of Sites 280 and 281.
 33. DETRITAL AND BIOGENIC SEDIMENT TRENDS AT DSDP SITES 280 AND 281, AND EVOLUTION OF MIDDLE CENOZOIC CURRENTS Monty A. Hampton, Geology Department, University of Rhode Island, Kingston, Rhode Island ABSTRACT
SEDIMENTARY PHOSPHORITES: GENESIS, FACIES AND OCCURRENCE. Peter Berger Samantha Dwyer Jessica Hellwig Eric Obrock Kristin Read
 SEDIMENTARY PHOSPHORITES: GENESIS, FACIES AND OCCURRENCE Peter Berger Samantha Dwyer Jessica Hellwig Eric Obrock Kristin Read Introduction Phosphogenesis & Deposystems Facies Case Studies: Western U.S.,
Biostratigraphic and Lithostratigraphic Correlation of Sedimentary Strata in the Atlantic Coastal Plain
 Biostratigraphic and Lithostratigraphic Correlation of Sedimentary Strata in the Atlantic Coastal Plain Introduction to the Atlantic Coastal Plain (Please read this page prior to doing the lab) The Atlantic
Processes affecting continental shelves
 Marine Sediments Continental Shelves Processes affecting continental shelves 1. Glaciation 2. Sea-level change (±130 m during continental glaciation) 3. Waves and currents 4. Sedimentation 5. Carbonate
Lab 7: Sedimentary Structures
 Name: Lab 7: Sedimentary Structures Sedimentary rocks account for a negligibly small fraction of Earth s mass, yet they are commonly encountered because the processes that form them are ubiquitous in the
This PDF file is subject to the following conditions and restrictions:
 Geological Society of America 3300 Penrose Place P.O. Box 9140 Boulder, CO 80301 (303) 447-2020 fax 303-357-1073 www.geosociety.org This PDF file is subject to the following conditions and restrictions:
Development of the Global Environment
 Development of the Global Environment G302: Spring 2004 A course focused on exploration of changes in the Earth system through geological history Simon C. Brassell Geological Sciences simon@indiana.edu
The Eocene Gir Formation of the Ghani and Ed Dib Fields, Eastern Libya - an example of "Virtual Core Study"
 The Eocene Gir Formation of the Ghani and Ed Dib Fields, Eastern Libya - an example of "Virtual Core Study" Henry Williams*, Suncor Energy Inc., Calgary, AB hwilliams@suncor.com Summary The Gir Formation
TWO-DIMENSIONAL PALEOSLOPE MODELING: A NEW METHOD FOR ESTIMATING WATER DEPTHS OF BENTHIC FORAMINIFERAL BIOFACIES AND PALEOSHELF MARGINS
 TWO-DIMENSIONAL PALEOSLOPE MODELING: A NEW METHOD FOR ESTIMATING WATER DEPTHS OF BENTHIC FORAMINIFERAL BIOFACIES AND PALEOSHELF MARGINS STEPHEN F. PEKAR 1 AND MICHELLE A. KOMINZ 2 1 Lamont-Doherty Earth
Sediment and Sedimentary rock
 Sediment and Sedimentary rock Sediment: An accumulation of loose mineral grains, such as boulders, pebbles, sand, silt or mud, which are not cemented together. Mechanical and chemical weathering produces
Biocomplexity and Biogeochemical Cycles of the Paleocene Eocene Thermal Maximum (BIOPE) Workshop Santa Cruz, CA - May 2-4, 2002
 Workshop Santa Cruz, CA - May 2-4, 2002") Biocomplexity and Biogeochemical Cycles of the Paleocene Eocene Thermal Maximum (BIOPE) Workshop Santa Cruz, CA - May 2-4, 2002 Executive Summary Approximately 55 million years ago, the Earth experienced
Biocomplexity and Biogeochemical Cycles of the Paleocene Eocene Thermal Maximum (BIOPE) Workshop Santa Cruz, CA - May 2-4, 2002 Executive Summary Approximately 55 million years ago, the Earth experienced
Sediment and sedimentary rocks Sediment
 Sediment and sedimentary rocks Sediment From sediments to sedimentary rocks (transportation, deposition, preservation and lithification) Types of sedimentary rocks (clastic, chemical and organic) Sedimentary
Seismic stratigraphy, some examples from Indian Ocean, interpretation of reflection data in interactive mode
 Seismic stratigraphy, some examples from Indian Ocean, interpretation of reflection data in interactive mode K. S. Krishna National Institute of Oceanography, Dona Paula, Goa-403 004. krishna@nio.org Seismic
Middle Eocene western north Atlantic biostratigraphy and environmental conditions
 Shari Hilding-Kronforst Shari Hilding-Kronforst is currently a Ph.D. candidate at Texas A&M University. Born in Illinois, she received a microscope at age 8 and dinosaur models at age 9. She completed
THE DEPOSITS OF TSUNAMIS WESLEY PESANTEZ, CATHERINE NIELD, COLIN WINTER
 THE DEPOSITS OF TSUNAMIS WESLEY PESANTEZ, CATHERINE NIELD, COLIN WINTER AN OVERVIEW OF OUR SEMINAR WHAT IS A TSUNAMI WHY STUDY TSUNAMIS PROPERTIES OF TSUNAMIS TSUNAMI HYDRODYNAMICS IDEALIZED DEPOSITS SEDIMENT
Depositional Environment
 Depositional Environment Sedimentary depositional environment describes the combination of physical, chemical and biological processes associated with the deposition of a particular type of sediment. Types
Sequence Stratigraphy. Historical Perspective
 Sequence Stratigraphy Historical Perspective Sequence Stratigraphy Sequence Stratigraphy is the subdivision of sedimentary basin fills into genetic packages bounded by unconformities and their correlative
Phanerozoic Diversity and Mass Extinctions
 Phanerozoic Diversity and Mass Extinctions Measuring Diversity John Phillips produced the first estimates of Phanerozoic diversity in 1860, based on the British fossil record Intuitively it seems simple
Lake Levels and Climate Change in Maine and Eastern North America during the last 12,000 years
 Maine Geologic Facts and Localities December, 2000 Lake Levels and Climate Change in Maine and Eastern North America during the last 12,000 years Text by Robert A. Johnston, Department of Agriculture,
Marine Sediments EPSS15 Spring 2017 Lab 4
 Marine Sediments EPSS15 Spring 2017 Lab 4 Why Sediments? Record of Earth s history - Tectonic plate movement - Past changes in climate - Ancient ocean circulation currents - Cataclysmic events 1 Classification
Marine Micropaleontology
 Marine Micropaleontology 92 93 (2012) 61 80 Contents lists available at SciVerse ScienceDirect Marine Micropaleontology journal homepage: www.elsevier.com/locate/marmicro Calcareous nannofossil assemblage
Question. What caused the recent explosive eruptions of hot ash and gas at Kilauea s Halema uma u crater:
 OCN 201 Deep Sea Sediments Question What caused the recent explosive eruptions of hot ash and gas at Kilauea s Halema uma u crater: A. The interaction of lava with seawater B. Drainage of the lava lake
Reading Material. See class website. Sediments, from Oceanography M.G. Gross, Prentice-Hall
 Reading Material See class website Sediments, from Oceanography M.G. Gross, Prentice-Hall Materials filling ocean basins Dissolved chemicals especially from rivers and mid-ocean ridges (volcanic eruptions)
Biogeochemical changes over long time scales
 Biogeochemical changes over long time scales Eric Galbraith McGill University, Montreal, Canada Overview What is a long time? Long timescale observations from marine sediments Very quick look at biogeochemical
CHAPTER 1 INTRODUCTION
 1 CHAPTER 1 INTRODUCTION 1.1 GENERAL Washover sandsheets are often found in low-lying coastal embayment s (Sedgwick and Davis 2003). Washover deposition of marine sand is usually attributed to storm activity
Viking Lowstand Deposits in West Central Saskatchewan: Depositional Model for the Reservoir Units in Dodsland-Hoosier Area, Saskatchewan, Canada
 Viking Lowstand Deposits in West Central Saskatchewan: Depositional Model for the Reservoir Units in Dodsland-Hoosier Area, Saskatchewan, Canada Hasan Ferdous* PetroSed Geoconsulting Resources, Calgary,
IODP EXPEDITION 306: NORTH ATLANTIC CLIMATE II SITE U1314 SUMMARY
 IODP EXPEDITION 306: NORTH ATLANTIC CLIMATE II SITE U1314 SUMMARY Hole U1314A Latitude: 56 21.883'N, Longitude: 27 53.309'W Hole U1314B Latitude: 56 21.896'N, Longitude: 27 53.311'W Hole U1314C Latitude:
SUPPLEMENTARY INFORMATION
 doi:10.1038/nature23646 Earth system modelling further model and model-data analysis In our main analysis, we noted that the predicted peak increase in global surface temperature is close to estimates
Feet CLAY; silty, greenish gray and clayey fine sand; Color: 5Y 3/1
 -. CLAY; silty, greenish gray and clayey fine sand; Color: Y /. -. SAND; fine-medium, clayey, with sandy clay layers; very abundant broken thin, tiny shells; shell hash at several horizons, heavily burrowed;
GEOLOGY MEDIA SUITE Chapter 5
 UNDERSTANDING EARTH, SIXTH EDITION GROTZINGER JORDAN GEOLOGY MEDIA SUITE Chapter 5 Sedimentation Rocks Formed by Surface Processes 2010 W.H. Freeman and Company Mineralogy of sandstones Key Figure 5.12
Foundations of Earth Science, 6e Lutgens, Tarbuck, & Tasa
 Foundations of Earth Science, 6e Lutgens, Tarbuck, & Tasa Oceans: The Last Frontier Foundations, 6e - Chapter 9 Stan Hatfield Southwestern Illinois College The vast world ocean Earth is often referred
GeoCanada 2010 Working with the Earth
 Lithofacies Identification and the Implications for SAGD Well Planning in the McMurray Formation, Christina Lake Area, Alberta Travis Shackleton*, Robert Gardner, Sung Youn, Grace Eng and Lori Barth Cenovus
Lecture Outline Wednesday - Friday February 14-16, 2018
 Lecture Outline Wednesday - Friday February 14-16, 2018 Quiz 2 scheduled for Friday Feb 23 (Interlude B, Chapters 6,7) Questions? Chapter 6 Pages of the Past: Sedimentary Rocks Key Points for today Be
QUANTITATIVE CONSTRAINTS ON THE ORIGIN OF STRATIGRAPHIC ARCHITECTURE AT PASSIVE CONTINENTAL MARGINS: OLIGOCENE SEDIMENTATION IN NEW JERSEY, U.S.A.
 QUANTITATIVE CONSTRAINTS ON THE ORIGIN OF STRATIGRAPHIC ARCHITECTURE AT PASSIVE CONTINENTAL MARGINS: OLIGOCENE SEDIMENTATION IN NEW JERSEY, U.S.A. STEPHEN F. PEKAR, 1 NICHOLAS CHRISTIE-BLICK, 2 KENNETH
Feet. SAND; clayey, fine grained; shells are common; rounded quartz grains. SHELLS; muddy; almost no sand, shells and fragments common
 SAND; clayey, fine grained; shells are common; rounded quartz grains SHELLS; muddy; almost no sand, shells and fragments common SAND; back to medium to fine; has a mottled appearance and looks burrowed;
Marine Sediments. Introductory Oceanography. Ray Rector: Instructor
 Marine Sediments Introductory Oceanography Ray Rector: Instructor Ocean Basins are Vast Sinks for Huge Amounts of Sediment from Numerous Different Sources Four Major Types of Seafloor Sediments 1. Lithogenous
Beckenanalyse 2. Genetische stratigraphische Konzepte
 Beckenanalyse 2. Genetische stratigraphische Konzepte Einsele 2000 CYCLIC BEDDING Einsele 2000 1 Sequenzstratigraphie Das Konzept der Sequenzstratigraphie beruht auf dem Zusammenspiel von Sedimentzufuhr
A TALE OF TWO BOUNDARIES: BEGINNING AND END OF THE PALEOCENE
 A TALE OF TWO BOUNDARIES: BEGINNING AND END OF THE PALEOCENE Ellen Thomas Geology & Geophysics, Yale University Earth & Environmental Sciences, Wesleyan University Cross sec(on benthic foraminifer Nu#allides
LITHOSTRATIGRAPHIC SERIES / SUBSERIES BENTHIC UNITS NORDLAND GROUP ELPHIDIUM PLEISTO- CENE EXCAVATUM - NONION CUM ASSEM. GYRIODINA SOLDANII
 WELL 36/1-2 DEPTH (mrkb) 900 800 700 600 GAMMA RAY Unit: GAPI 0 100 LITHOLOGY LITHOSTRATIGRAPHIC UNITS NORDLAND GROUP HORDALAND GROUP BALD. - SELE SERIES / SUBSERIES PLEISTO- CENE UPPER OLIGOCENE LOWER
1. Summary of Observations from a 40-Meter Cored Interval of the New Albany Shale in Well 1-3 Kavanaugh, Daviess County, Indiana
 2004 Annual Field Conference of the Great Lakes Section of SEPM 1 1. Summary of Observations from a 40-Meter Cored Interval of the New Albany Shale in Well 1-3 Kavanaugh, Daviess County, Indiana by Remus
EARTH SURFACE PROCESSES AND SEDIMENTATION!
 Sed and Strat EARTH SURFACE PROCESSES AND SEDIMENTATION! 2/27 Lecture 7- Exposure: Weathering and the Sediment Factory 3/04 Lecture 8 - Rivers and Landscapes 3/06 Lecture 9 - Waves (not Tides) 3/11 Lecture
S.F. Pekar a, *, K.G. Miller a, M.A. Kominz b
 Sedimentary Geology 134 (2000) 93 109 www.elsevier.nl/locate/sedgeo Reconstructing the stratal geometry of latest Eocene to Oligocene sequences in New Jersey: resolving a patchwork distribution into a
DATA REPOSITORY MATERIAL: PALEOCHANNEL GROUP MAPPING DESCRIPTIONS
 Data Repository item 2695 DATA REPOSITORY MATERIAL: PALEOCHANNEL GROUP MAPPING DESCRIPTIONS Groups 1 (North Myrtle Beach) and 2 (Atlantic Beach) Channel Groups 1 (North Myrtle Beach) and 2 (Atlantic Beach)
Announcements. First problem set due next Tuesday. Review for first exam next Thursday. Quiz on Booth (1994) after break today.
 after break today.") Announcements First problem set due next Tuesday. Review for first exam next Thursday. Quiz on Booth (1994) after break today. Intertidal, Lowes Cove, ME Marine Sediments: Clues to the ocean s past There
Announcements First problem set due next Tuesday. Review for first exam next Thursday. Quiz on Booth (1994) after break today. Intertidal, Lowes Cove, ME Marine Sediments: Clues to the ocean s past There
Sedimentology & Stratigraphy. Thanks to Rob Viens for slides
 Sedimentology & Stratigraphy Thanks to Rob Viens for slides Sedimentology The study of the processes that erode, transport and deposit sediments Sedimentary Petrology The study of the characteristics and
North American continental margin records of the Paleocene-Eocene thermal maximum: Implications for global carbon and hydrological cycling
 Click Here for Full Article PALEOCEANOGRAPHY, VOL. 23,, doi:10.1029/2007pa001465, 2008 North American continental margin records of the Paleocene-Eocene thermal maximum: Implications for global carbon
SCOPE 35 Scales and Global Change (1988)
") 1. Types and origins of marine sediments 2. Distribution of sediments: controls and patterns 3. Sedimentary diagenesis: (a) Sedimentary and organic matter burial (b) Aerobic and anaerobic decomposition
1. Types and origins of marine sediments 2. Distribution of sediments: controls and patterns 3. Sedimentary diagenesis: (a) Sedimentary and organic matter burial (b) Aerobic and anaerobic decomposition
Land subsidence due to groundwater withdrawal in Hanoi, Vietnam
 Land Subsidence (Proceedings of the Fifth International Symposium on Land Subsidence, The Hague, October 1995). 1AHS Publ. no. 234, 1995. 55 Land subsidence due to groundwater withdrawal in Hanoi, Vietnam
By Paul M. (Mitch) Harris 1 and Barry J. Katz 2. Search and Discovery Article #40305 (2008) Posted September 4, Abstract
 Harris 1 and Barry J. Katz 2. Search and Discovery Article #40305 (2008) Posted September 4, Abstract") PS Carbonate Mud and Carbonate Source Rocks* By Paul M. (Mitch) Harris 1 and Barry J. Katz 2 Search and Discovery Article #435 (28) Posted September 4, 28 *Adapted from poster presentation at AAPG Annual
PS Carbonate Mud and Carbonate Source Rocks* By Paul M. (Mitch) Harris 1 and Barry J. Katz 2 Search and Discovery Article #435 (28) Posted September 4, 28 *Adapted from poster presentation at AAPG Annual
Thickness, Compositional and Textural Variability, and Genesis of El-Lajjun Oil Shale, Central Jordan
 Thickness, Compositional and Textural Variability, and Genesis of El-Lajjun Oil Shale, Central Jordan H Alnawafleh 1, D Large 2 & B Spiro 3 1 Department of Mining Engineering, Al-Hussein Bin Talal University,
4 Sedimentary phosphate deposits 4.1 Introduction
 4 Sedimentary phosphate deposits 4.1 Introduction Sedimentary phosphate deposits or phosphorites contain few percents of calcium phosphate in form of grains of apatite, bone fragments or coprolites, and
Chapter 5: Weathering and Soils. Fig. 5.14
 Chapter 5: Weathering and Soils Fig. 5.14 OBJECTIVES Recognize that weathering breaks down minerals and rocks and occurs as a result of both mechanical and chemical processes. Explain the processes that
Laboratory#6 Sediment Particle Size Distribution and Turbidity Flows
 Laboratory#6 Sediment Particle Size Distribution and Turbidity Flows Although this laboratory will pertain to oceanic sediments similar processes can also be observed on land and other aquatic systems
EXTINCTION CALCULATING RATES OF ORIGINATION AND EXTINCTION. α = origination rate Ω = extinction rate
 EXTINCTION CALCULATING RATES OF ORIGINATION AND EXTINCTION α = origination rate Ω = extinction rate 1 SPECIES AND GENERA EXTINCTION CURVES INDICATE THAT MOST SPECIES ONLY PERSIST FOR A FEW MILLION YEARS.
Oceanography is the scientific study of oceans Oceans make up over 70% of the Earth s surface
 Oceanography Oceanography is the scientific study of oceans Oceans make up over 70% of the Earth s surface An ocean must be large and have features which set it apart from other oceans (currents, water
Question: What is the primary reason for the great abundance of fish along the Peruvian coast?
 Buzzer Question # 1 Question Type: toss-up Question Format: Multiple Choice Category: Biology What is the primary reason for the great abundance of fish along the Peruvian coast? Answer W: upwelling Answer
Weathering, Erosion and Deposition
 Weathering, Erosion and Deposition Shaping the Earth s Surface Weathering the process of breaking down rocks into smaller fragments Erosion the transport of rock fragments from one location to another
Application of Predictive Modeling to the Lower Cretaceous Sedimentary Sequences of the Central Scotian Basin
 Application of Predictive Modeling to the Lower Cretaceous Sedimentary Sequences of the Central Scotian Basin Christopher R. Sangster 1, Nicolas Hawie 2, Georgia Pe-Piper 1, Francky Saint-Ange 2, David
17. CARBONATE SEDIMENTARY ROCKS FROM THE WESTERN PACIFIC: LEG 7, DEEP SEA DRILLING PROJECT
 17. CARBONATE SEDIMENTARY ROCKS FROM THE WESTERN PACIFIC: LEG 7, DEEP SEA DRILLING PROJECT Ralph Moberly, Jr., Hawaii Institute of Geophysics, University of Hawaii, Honolulu, Hawaii and G. Ross Heath,
Physical Oceanography
 Physical Oceanography SECTION 15.1 The Oceans In your textbook, read about modern oceanography. For each item in Column A, write the letter of the matching item in Column B. e b c d a Column A 1. German
Warming the Fuel for the Fire: Evidence for the Thermal Dissociation of Methane Hydrate During the Paleocene-Eocene Thermal Maximum
 Wesleyan University WesScholar Division III Faculty Publications Natural Sciences and Mathematics 2002 Warming the Fuel for the Fire: Evidence for the Thermal Dissociation of Methane Hydrate During the
Geological Overview of the Niobrara Chalk Natural Gas Play
 Geological Overview of the Niobrara Chalk Natural Gas Play W. Lynn Watney Kansas Geological Survey KU Energy Research Center The University of Kansas Lawrence, KS Outline Geologic Setting Paleogeography
A Tectonostratigraphic History of Orphan Basin, Offshore Newfoundland, Canada
 A Tectonostratigraphic History of Orphan Basin, Offshore Newfoundland, Canada Lynn T. Dafoe*, Charlotte E. Keen, Graham L. Williams, and Sonya A. Dehler, Geological Survey of Canada, Dartmouth, NS Canada
Mechanical Weathering
 Weathering is the disintegration and decomposition of material at or near the surface. Erosion is the incorporation and transportation of material by a mobile agent, usually water, wind, or ice. Geologists
Sedimentary facies and sequence stratigraphy of the Asmari Formation at Tange Arabi,Zagros Basin, Iran
 Sedimentary facies and sequence stratigraphy of the Asmari Formation at Tange Arabi,Zagros Basin, Iran Atefe Abbasi, Geology student of Shiraz Payam-noor University Abstract The Oligocene Miocene ASMARI
Last Time. Submarine Canyons and Fans. Turbidites. MAS 603: Geological Oceanography. Lecture 16: Greenhouse vs. Icehouse Earths
 UNIVERSITY OF SOUTH ALABAMA Last Time MAS 603: Geological Oceanography Lecture 16: Greenhouse vs. Icehouse Earths Submarine Fans Definition and morphology Transport mechanisms (density currents) Submarine
6. What has been the most effective erosive agent in the climate system? a. Water b. Ice c. Wind
 Multiple Choice. 1. Heinrich Events a. Show increased abundance of warm-water species of planktic foraminifera b. Show greater intensity since the last deglaciation c. Show increased accumulation of ice-rafted
The Eocene Gir Formation of the Ghani and Ed Dib Fields, Eastern Libya -An example of "Virtual Core Study"*
 The Eocene Gir Formation of the Ghani and Ed Dib Fields, Eastern Libya -An example of "Virtual Core Study"* Henry Williams 1 Search and Discovery Article #20288 (2014) Posted December 29, 2014 *Adapted
Rocks and the Rock Cycle. Banded Iron Formation
 Rocks and the Rock Cycle Banded Iron Formation Rocks Big rocks into pebbles, Pebbles into sand. I really hold a million, million Rocks here in my hand. Florence Parry Heide How do rocks change? How are
Igneous and Metamorphic Rock Forming Minerals. Department of Geology Mr. Victor Tibane SGM 210_2013
 Igneous and Metamorphic Rock Forming Minerals Department of Geology Mr. Victor Tibane 1 SGM 210_2013 Classification of sedimentary rocks Sedimentary rocks are products of weathered, fragmented or dissolved,
Ordovician. System. Cambrian. System
 443 495 543 Late Middle Early Late Middle Early Ordovician System Cambrian System Earth History, Ch. 13 1 Ch. 13 Review: Early Paleozoic life & Burgess Shale fauna Most animal phyla originated in Cambrian;
An Investigation of Antarctic Circumpolar Current Strength in Response to Changes in Climate. Presented by Matt Laffin
 An Investigation of Antarctic Circumpolar Current Strength in Response to Changes in Climate Presented by Matt Laffin Presentation Outline Introduction to Marine Sediment as a Proxy Introduction to McCave
Permafrost-influenced Geomorphic Processes
 Section 4 Permafrost-influenced Geomorphic Processes Geomorphic processes vary greatly among ecoregions in northern Alaska, extending from the Beaufort Sea coast to the Brooks Range (Figure 4.1). Regional
Chapter 4 Implications of paleoceanography and paleoclimate
 Age ka / Chapter 4 Implications of paleoceanography and paleoclimate 4.1 Paleoclimate expression 4.2 Implications of paleocirculation and tectonics 4.3 Paleoenvironmental reconstruction MD05-2901 (Liu
Earth Science Lesson Plan Quarter 2, Week 10, Day 1
 Earth Science Lesson Plan Quarter 2, Week 10, Day 1 Outcomes for Today Standard Focus: PREPARE 1. Background knowledge necessary for today s reading. Beaches are created by the actions of waves, tides,
ARE YOU READY TO THINK? Look at the first slide THINK PAIR SHARE!
 ARE YOU READY TO THINK? Look at the first slide THINK PAIR SHARE! WHAT PROMINENT FEATURE CAN YOU IDENTIFY IN THIS PICTURE? What do you think the different colors represent? Who might find such a picture
Droser, M., Bottjer, D.J., A semiquantitative field classification of ichnofabric. Journal of Sedimentary Petrology 56,
 GSA Data Repository 2015329 Chemosymbiont-dominated seafloor communities in modern and Cretaceous upwelling systems support a new, high-productivity variant of standard low-oxygen models Y. Edelman-Furstenberg
Accommodation. Tectonics (local to regional) Subsidence Uplift
 Subsidence Uplift") Accommodation Accommodation varies over time; it is the distance between a reference horizon and the sea surface (i.e. relative sea level). The space to be filled in with sediments or water What are the
Accommodation Accommodation varies over time; it is the distance between a reference horizon and the sea surface (i.e. relative sea level). The space to be filled in with sediments or water What are the
Oligocene eustasy from two-dimensional sequence stratigraphic backstripping
 Oligocene eustasy from two-dimensional sequence stratigraphic backstripping Michelle A. Kominz* Department of Geosciences, Western Michigan University, 1187 Rood Hall, Kalamazoo, Michigan 49008-5150, USA
OCN 201: Deep-Sea Sediments
 OCN 201: Deep-Sea Sediments Eric Heinen De Carlo, F2011 Where is the Sediment? Continental Margins: 87% (covers ~21% of ocean area) Deep-ocean floor: 13% ~21% ~87% Sediment Deposition Rates (time to deposit
The Marine Environment
 The Marine Environment SECTION 16.1 Shoreline Features In your textbook, read about erosional landforms, beaches, estuaries, longshore currents, and rip currents. For each statement below, write or. 1.
Geography of the world s oceans and major current systems. Lecture 2
 Geography of the world s oceans and major current systems Lecture 2 WHY is the GEOMORPHOLOGY OF THE OCEAN FLOOR important? (in the context of Oceanography) WHY is the GEOMORPHOLOGY OF THE OCEAN FLOOR important?
Chapter 5. The Sedimentary Archives
 Chapter 5 The Sedimentary Archives Factors affecting Sedimentary Characteristics 1. Tectonic setting 2. Physical, chemical, and biological processes in the depositional environment 3. Method of sediment
Chapter 9 Lecture Outline. Oceans: The Last Frontier
 Chapter 9 Lecture Outline Oceans: The Last Frontier The Vast World Ocean Earth is referred to as the blue planet 71% of Earth s surface is oceans and marginal seas Continents and islands comprise the remaining
4. The map below shows a meandering stream. Points A, B, C, and D represent locations along the stream bottom.
 1. Sediment is deposited as a river enters a lake because the A) velocity of the river decreases B) force of gravity decreases C) volume of water increases D) slope of the river increases 2. Which diagram
NAME: GEL 109 Final Study Guide - Winter 2008 Questions 6-24 WILL be on the final exactly as written here; this is 60% of the test.
 GEL 109 Final Study Guide - Winter 2008 Questions 6-24 WILL be on the final exactly as written here; this is 60% of the test. 1. Sketch a map view of three types of deltas showing the differences in river,
Biosphere. All living things, plants, animals, (even you!) are part of the zone of the earth called the biosphere.
 are part of the zone of the earth called the biosphere.") Unit 1 Study Guide Earth s Spheres Biosphere All living things, plants, animals, (even you!) are part of the zone of the earth called the biosphere. Hydrosphere Water covers ¾ of the earth, made up mostly
Unit 1 Study Guide Earth s Spheres Biosphere All living things, plants, animals, (even you!) are part of the zone of the earth called the biosphere. Hydrosphere Water covers ¾ of the earth, made up mostly
Greenhouse Effect & Global Warming
 Chemical Cycles: Greenhouse Effect: Cause and effect Chemical Cycles: CO 2 and O 2 Chemical Fluxes: CO 2 and O 2 Proxies for climate change: Isotopes Greenhouse Effect & Global Warming Global Warming World
Making Sediments: Biogenic Production, Carbonate Saturation and Sediment Distributions
 Making Sediments: Biogenic Production, Carbonate Saturation and Sediment Distributions OCN 623 Chemical Oceanography Reading: Libes, Chapters 15 and 16 Outline I. Deep sea sedimentation Detrital sediments