USGS National Hydrography Dataset (NHD) and NHDPlus
|
|
|
- Tyrone Wade
- 5 years ago
- Views:
Transcription


1 + 1 + USGS National Hydrography Dataset (NHD) and NHDPlus Al Rea USGS National Geospatial Program Western States Water Council August 1, 2018
 The drainage")


2 + 2 USGS National Hydrography Datasets Hydrologic networks, units, catchments, and more National Hydrography Dataset (NHD) The drainage network with features such as rivers, streams, canals, lakes, ponds, and stream gages National Hydrography Dataset Watershed Boundary Dataset (WBD) The drainage basins at 8 scales of a nested hierarchy; defines the areal extent of surface water drainage to a point NHDPlus Incorporates features of the NHD, WBD and 3DEP elevation data to create a networked hydrography framework that incorporates the entire landscape Watershed Boundary Dataset NHDPlus
3 + 3 The Evolution of NHD and NHDPlus EPA/USGS-W Reach File Version 1 (RF1) (1:500,000) EPA/USGS-W/USGS-G Medium Res NHD (1:100,000) EPA/USGS-W Medium Res NHDPlus (1:100,000) The blue boxes identify the Framework versions used to estimate stream flow volume and velocity. 2006, 2012 USGS-G High Res NHD (1:24,000 or better) 2007 USGS-G High Res NHDPlus (1:24,000 or better with generalization) ~2020 Slide: Tommy Dewald (USEPA)
4 + 4 National Hydrography Dataset Water network for mapping and modeling National drainage network of streams and lakes, plus other hydro info, in a GIS format Currently 1:24K or better (1:63K 1:24K in AK) Shapefile and GDB downloads, plus webbased map services

5 + Attributes: Names 5 and flow condition Perennial Intermittent Swan Creek Ephemeral
6 + 6 However Original topo maps were made over many decades, with somewhat changing standards, and different source materials Sometimes they didn t finish the maps and published provisional P-maps Since 2007 many updates Correcting errors Different interpretation by stewards Densification of networks using higher resolution sources like lidar

7 A Hypothesis for classification differences Differences in climate during field check years of USGS quad maps may affect stream permanence classifications Throughout the US, quad maps were field checked across varying climate conditions scpdsi and precipitation percentile used as indicators of wetness


8 In the CRB Majority of topo quads collected Conditions during quad collection varied substantially, from extremely wet to extremely dry

9 This is a good example of a 24k provisional map. If you have the secret decoder ring, you can see the little P s and I s and the bars that indicate where the change occurs or where the stream disappears. These maps were published before the final symbols were applied. The field person had the original stereo complied manuscripts and took them into the field and annotated the manuscript. As you can see, everything is hand annotated. The problem is, the MRNHD for this area had to use the 1:62.5k map because this provisional map wasn t available. Next slide shows the source for this data.

10 NHD is a multi-scale dataset

11 NHD is a multi-scale dataset

12 Contour Crenulations added as intermittent

13 More additions
")
14 + 14 NHDPlus Completes the Framework Brings together NHD, WBD and elevation data to incorporate the landscape as a part of the stream network Creates a national framework for waterrelated information and enhance modeling capabilities NHD WBD Medium Resolution completed for CONUS (1:100,000) Elevation

15 + 15 NHDPlus includes A nationally seamless network of stream reaches Value-added attributes for stream network navigation and analysis Flow surfaces in raster format Elevation-based catchment areas for each stream segment that catchment area Create a seamless, scalable hydrologic framework Enable modeling of water flow across the landscape, linking terrestrial characteristics to the stream network NHD Streams
16 + 16

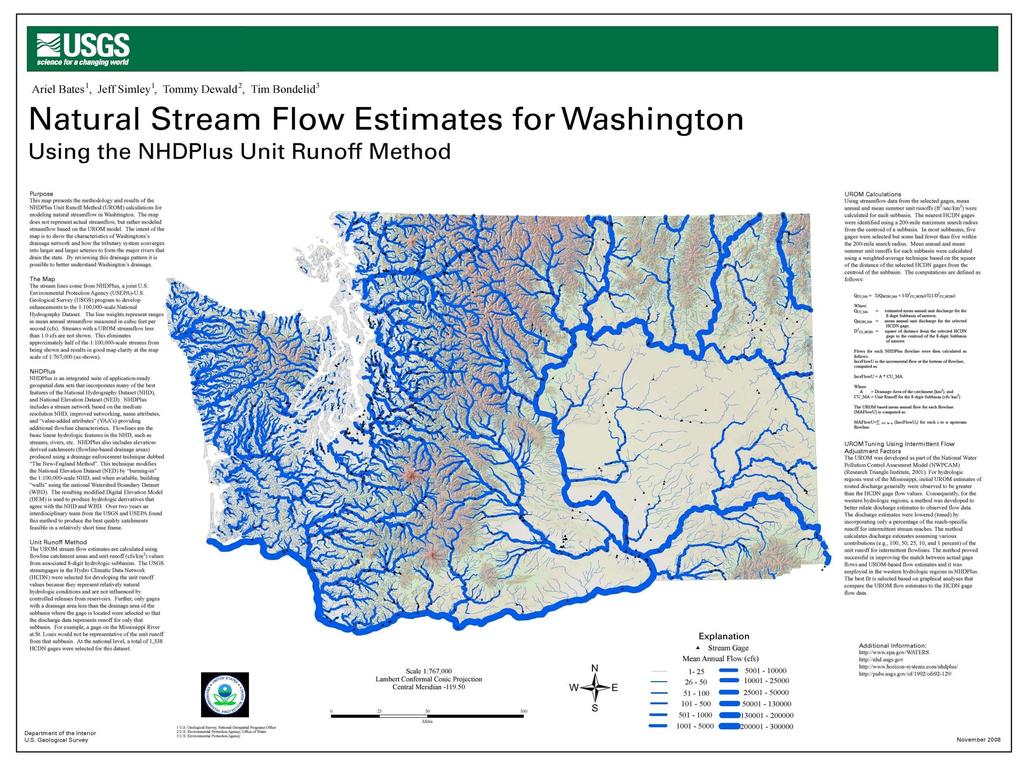
17 MR NHDPlus for Region 17 Blue are all perennial streams. Red are intermittent streams with less than 1 cfs MA. Most intermittent NHD streams anywhere in the country have flow from EROM less than 1 cfs, so these are probably classified correctly.
18 MR NHDPlus for Region 17 Blue are all perennial streams Red are intermittent streams with less than 1 cfs MA Green are intermittent with more than 1 cfs MA. These need to be looked at. They are suspicious.
19 The area in the box seems to be have too many intermittent streams with more than 1 cfs MA compared to the surroundings.
20 In this case, the MRNHD (green) is misclassified as intermittent compared to the HRNHD (blue). This is the area where the 100K maps used 1:62.5k scale maps because there were no 1:24k maps.
21 + 21 Bottom Line NHD has a lot of valuable information However, it is something of a mixed bag NHDPlus has even more valuable information, including simple modeled flow estimates that may help counter the mixed bag issue NHDPlus also provides data used in other models, including SPARROW, StreamStats, and PROSPER
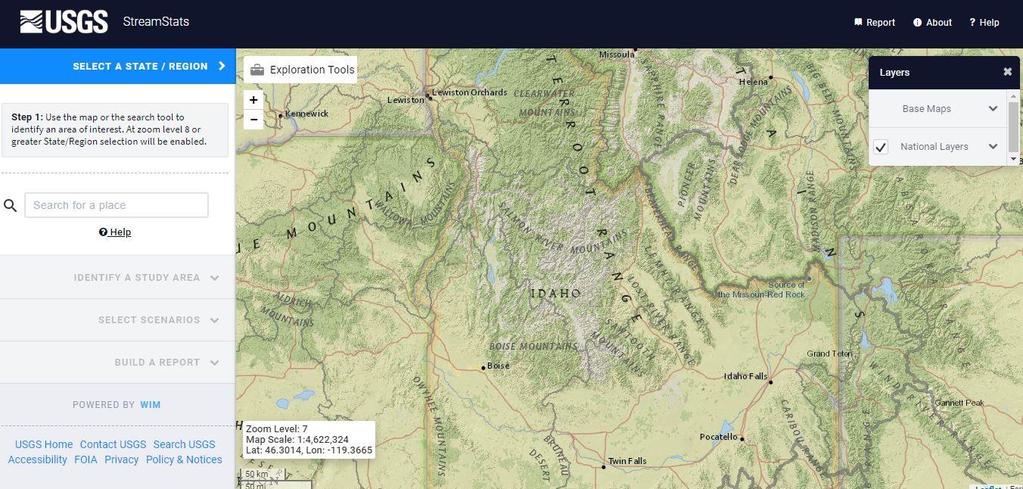
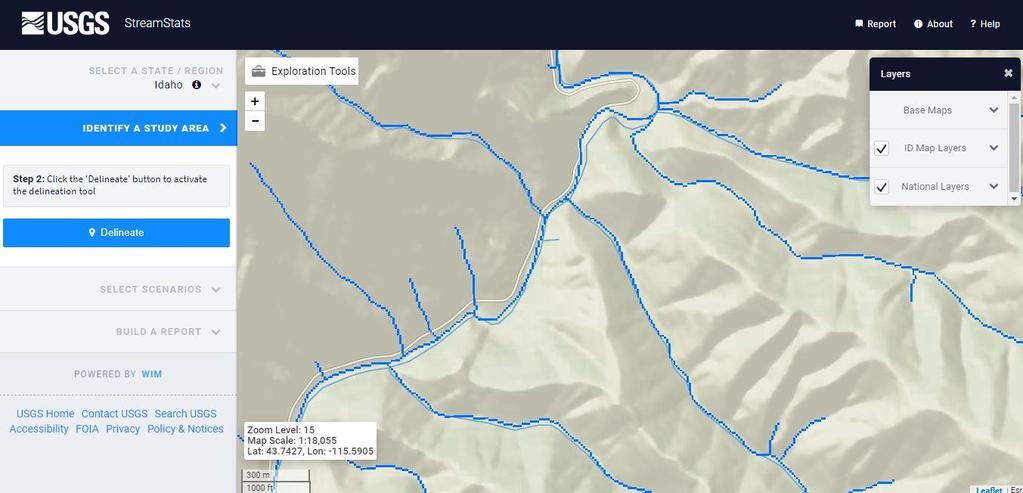
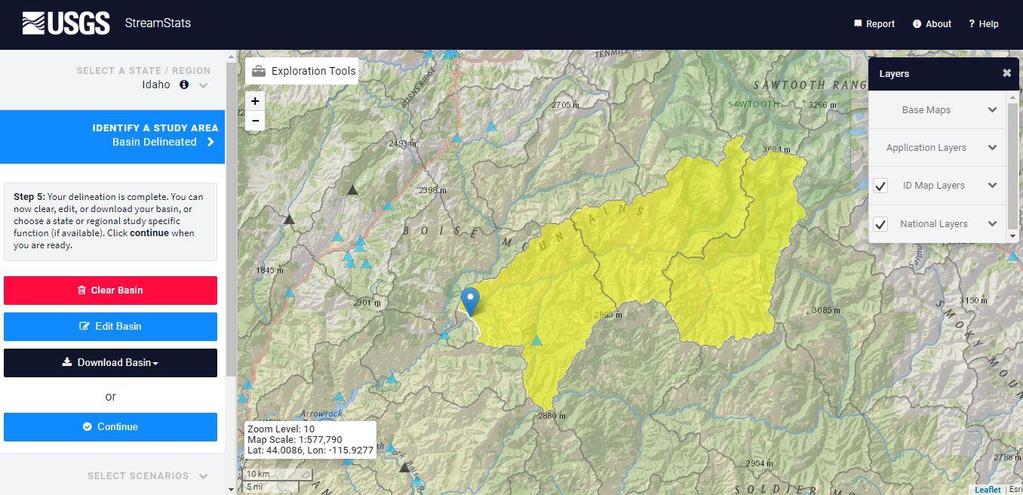
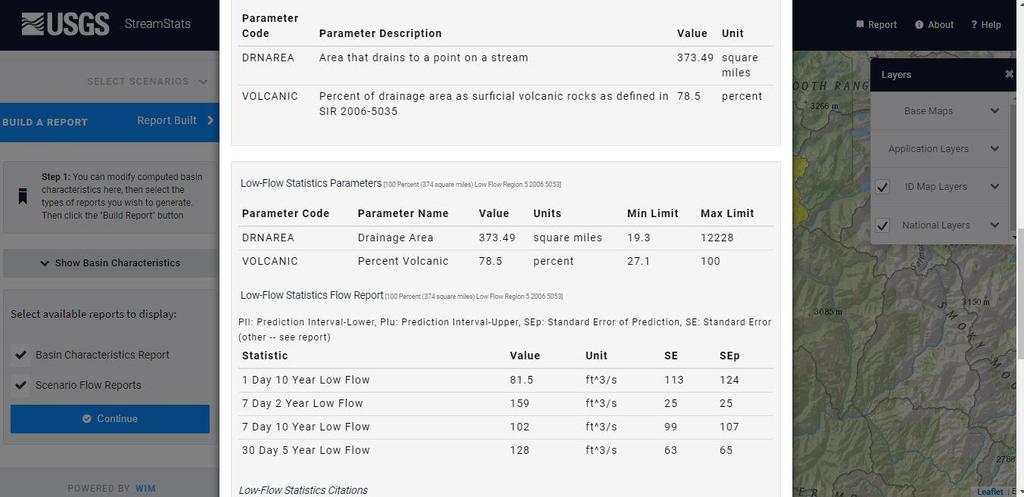
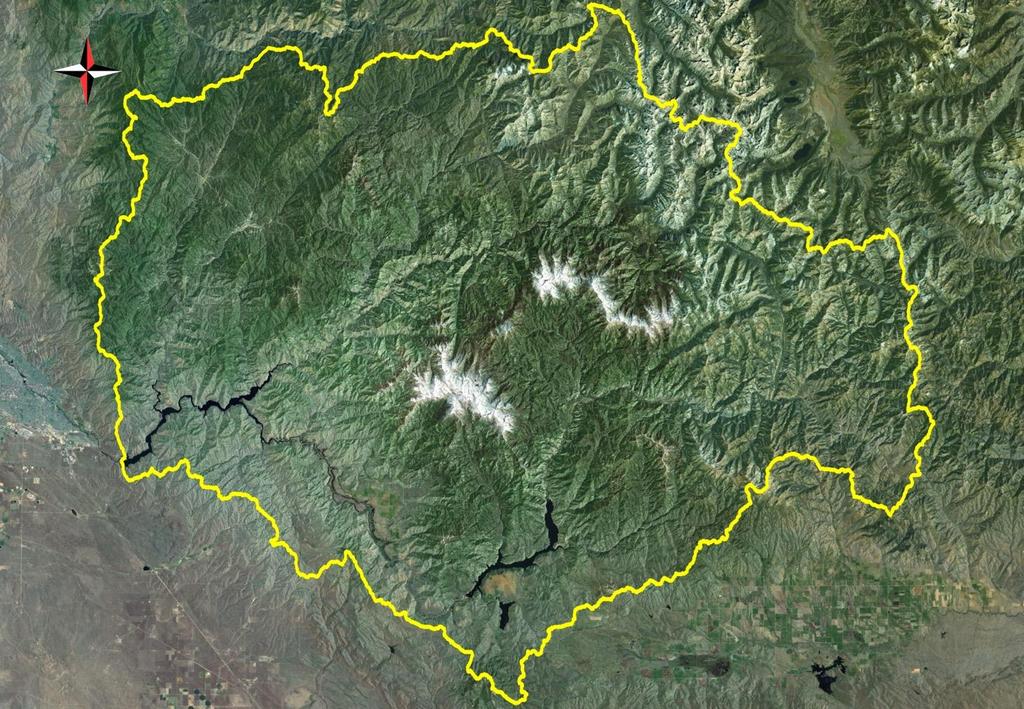
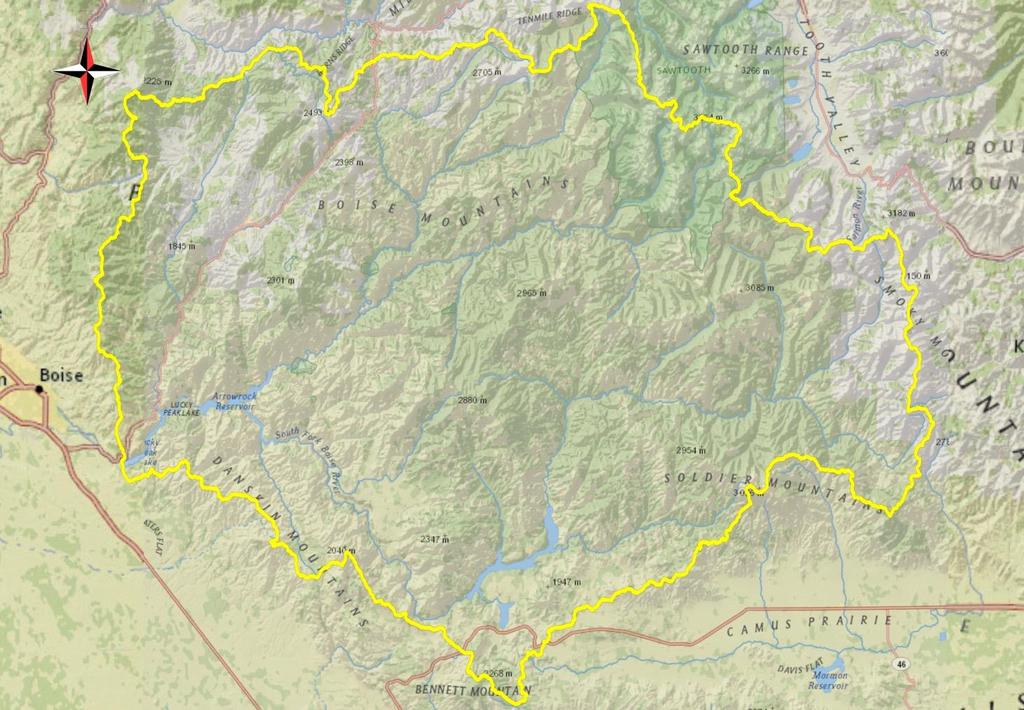
22 + 22 USGS StreamStats 1. Web application provides access to an assortment of Geographic Information Systems (GIS) analytical tools 2. Map-based user delineates drainage areas for userselected sites on streams and calculates basin characteristics for any selected drainage 3. Estimates flow statistics for the selected sites anywhere this functionality is available. 4. Incorporates relational data base that contains information for data-collection stations and regression equations 5. Application and mapping functionality exist for most of our western states
23 + 23
24 + 24
25 + 25
26 + 26
27 + 27 USGS SPARROW Model (SPAtially Referenced Regressions On Watershed attributes) Estimates water quality and water quantity attributes by linking monitoring data with information on watershed characteristics and contaminant sources. Can be used to explore relations between human activities, natural processes, and contaminant transport using interactive Mappers. Could be used to explore flow attributes and sources such as the groundwater component of flow (baseflow) at a given point of interest

28 + 28 A non-linear regression model that relates measured transport at monitoring stations to upland catchment attributes including upstream reaches

29 + 29 Upper Colorado River Basin SPARROW Stream network: NHD 10,813 unique reaches/catchments 1 to 78 mi monitoring sitescalibration reaches

30 Example of Streamflow Permanence Model in the Boise River Basin Probability of annual streamflow permanence for ,000 observations of wet and dry streams in the headwaters Used to calibrate a streamflow permanence model using geographic and climatic variables
31 Provisional data
32 2004 Rather than having distinct, rigid boundaries, stream reaches classified as perennial, intermittent, and ephemeral may more accurately be described as dynamic zones within stream networks. - Ken Fritz, EPA > 60% Probability of year-round flow < 40% Probability of year-round flow Provisional data
33 2005 Rather than having distinct, rigid boundaries, stream reaches classified as perennial, intermittent, and ephemeral may more accurately be described as dynamic zones within stream networks. - Ken Fritz, EPA > 60% Probability of year-round flow < 40% Probability of year-round flow Provisional data
34 2006 Rather than having distinct, rigid boundaries, stream reaches classified as perennial, intermittent, and ephemeral may more accurately be described as dynamic zones within stream networks. - Ken Fritz, EPA > 60% Probability of year-round flow < 40% Probability of year-round flow Provisional data

35 2007 Rather than having distinct, rigid boundaries, stream reaches classified as perennial, intermittent, and ephemeral may more accurately be described as dynamic zones within stream networks. - Ken Fritz, EPA > 60% Probability of year-round flow < 40% Probability of year-round flow Provisional data

36 2008 Rather than having distinct, rigid boundaries, stream reaches classified as perennial, intermittent, and ephemeral may more accurately be described as dynamic zones within stream networks. - Ken Fritz, EPA > 60% Probability of year-round flow < 40% Probability of year-round flow Provisional data
37 2009 Rather than having distinct, rigid boundaries, stream reaches classified as perennial, intermittent, and ephemeral may more accurately be described as dynamic zones within stream networks. - Ken Fritz, EPA > 60% Probability of year-round flow < 40% Probability of year-round flow Provisional data
38 2010 Rather than having distinct, rigid boundaries, stream reaches classified as perennial, intermittent, and ephemeral may more accurately be described as dynamic zones within stream networks. - Ken Fritz, EPA > 60% Probability of year-round flow < 40% Probability of year-round flow Provisional data
39 2011 Rather than having distinct, rigid boundaries, stream reaches classified as perennial, intermittent, and ephemeral may more accurately be described as dynamic zones within stream networks. - Ken Fritz, EPA > 60% Probability of year-round flow < 40% Probability of year-round flow Provisional data
40 2012 Rather than having distinct, rigid boundaries, stream reaches classified as perennial, intermittent, and ephemeral may more accurately be described as dynamic zones within stream networks. - Ken Fritz, EPA > 60% Probability of year-round flow < 40% Probability of year-round flow Provisional data
41 2013 Rather than having distinct, rigid boundaries, stream reaches classified as perennial, intermittent, and ephemeral may more accurately be described as dynamic zones within stream networks. - Ken Fritz, EPA > 60% Probability of year-round flow < 40% Probability of year-round flow Provisional data
42 2014 Rather than having distinct, rigid boundaries, stream reaches classified as perennial, intermittent, and ephemeral may more accurately be described as dynamic zones within stream networks. - Ken Fritz, EPA > 60% Probability of year-round flow < 40% Probability of year-round flow Provisional data
43 2015 Rather than having distinct, rigid boundaries, stream reaches classified as perennial, intermittent, and ephemeral may more accurately be described as dynamic zones within stream networks. - Ken Fritz, EPA > 60% Probability of year-round flow < 40% Probability of year-round flow Provisional data
44 2016 Rather than having distinct, rigid boundaries, stream reaches classified as perennial, intermittent, and ephemeral may more accurately be described as dynamic zones within stream networks. - Ken Fritz, EPA > 60% Probability of year-round flow < 40% Probability of year-round flow
45 Wet more than 75% of years Dry more than 75% of years Provisional data
 For location-based PROSPER data For each location: Select years for which you want data For each year selected: Raw Probabilities Categorical Classifications Warnings Year Raw Probability")
46 StreamStats ( For location-based PROSPER data For each location: Select years for which you want data For each year selected: Raw Probabilities Categorical Classifications Warnings Year Raw Probability Categorical Stream Status Warnings Mean

47 + 47 NHDPlus HR Status First datasets released in April, 2017 NHDPlus HR Beta will be completed in 2019 for the conterminous U.S., followed by AK, HI, and territories in later years Users are invited to review and provide feedback to the Beta version datasets Feedback will be used to update and improve the refreshed data release, beginning in 2019

48 Questions? + 48 Al Rea USGS National Hydrography Co-Lead ahrea@usgs.gov
USGS Hydrography Overview. May 9, 2018
 + 1 USGS Hydrography Overview May 9, 2018 + 2 The National Geospatial Program Provides the geospatial baseline of the Nation s topography, natural landscape and built environment through The National Map,
3D Elevation Program- Status and Updates. Oklahoma GI Council Meeting November 2, 2018 Claire DeVaughan US Geological Survey
 + 1 3D Elevation Program- Status and Updates Oklahoma GI Council Meeting November 2, 2018 Claire DeVaughan US Geological Survey + 2 3D Elevation Program (3DEP) Goals Complete acquisition in 8 years Address
What's New with NHDPlus (Classic)?
?") What's New with NHDPlus (Classic)? 1987 Reach File Version 1 2017 - NHDPlus Annie Mejaes EPA, Office of Water 2 Overview NHD-NHDPlus Basics Evolving NHD-NHDPlus Data and Tools Training and Support The
What's New with NHDPlus (Classic)? 1987 Reach File Version 1 2017 - NHDPlus Annie Mejaes EPA, Office of Water 2 Overview NHD-NHDPlus Basics Evolving NHD-NHDPlus Data and Tools Training and Support The
What s New in Topographic Information - USGS National Map
 + What s New in Topographic Information - USGS National Map SARGIS Workshop November 14, 2016 Rob Dollison, 703-648-5724 rdollison@usgs.gov + USGS 2 National Geospatial Program The National Geospatial
Hydrography Webinar Series
 Hydrography Webinar Series Session 2 May 21, 2015 U.S. Department of the Interior U.S. Geological Survey U.S. GEOLOGICAL SURVEY HYDROGRAPHY WEBINAR SERIES Hosted by: Jeff Simley Al Rea Hydrography Webinar
A Simple Drainage Enforcement Procedure for Estimating Catchment Area Using DEM Data
 A Simple Drainage Enforcement Procedure for Estimating Catchment Area Using DEM Data David Nagel, John M. Buffington, and Charles Luce U.S. Forest Service, Rocky Mountain Research Station Boise Aquatic
Introducing Iowa StreamStats Version 4, a Redesign of the USGS Application for Estimating Streamflow Stats
 Introducing Iowa StreamStats Version 4, a Redesign of the USGS Application for Estimating Streamflow Stats Presented at the 2016 Iowa Water Conference Ames, IA March 24, 2016 by David Eash U.S. Geological
Within this document, the term NHDPlus is used when referring to NHDPlus Version 2.1 (unless otherwise noted).
.") Exercise 7 Watershed Delineation Using ArcGIS Spatial Analyst Last Updated 4/6/2017 Within this document, the term NHDPlus is used when referring to NHDPlus Version 2.1 (unless otherwise noted). There
Exercise 7 Watershed Delineation Using ArcGIS Spatial Analyst Last Updated 4/6/2017 Within this document, the term NHDPlus is used when referring to NHDPlus Version 2.1 (unless otherwise noted). There
Lecture 3. Data Sources for GIS in Water Resources
 Lecture 3 Data Sources for GIS in Water Resources GIS in Water Resources Spring 2015 http://www.data.gov/ 1 USGS GIS data for Water http://water.usgs.gov/maps.html Watersheds of the US 2-digit water resource
Designing a Dam for Blockhouse Ranch. Haley Born
 Designing a Dam for Blockhouse Ranch Haley Born CE 394K GIS in Water Resources Term Paper Fall 2011 Table of Contents Introduction... 1 Data Sources... 2 Precipitation Data... 2 Elevation Data... 3 Geographic
StreamStats: Delivering Streamflow Information to the Public. By Kernell Ries
 StreamStats: Delivering Streamflow Information to the Public By Kernell Ries U.S. Department of the Interior U.S. Geological Survey MD-DE-DC District 410-238-4317 kries@usgs.gov StreamStats Web Application
Improvement of the National Hydrography Dataset for Parts of the Lower Colorado Region and Additional Areas of Importance to the DLCC
 Improvement of the National Hydrography Dataset for Parts of the Lower Colorado Region and Additional Areas of Importance to the DLCC Carlos Reyes-Andrade California State University, Northridge September
Influence of spatial variation in precipitation on artificial neural network rainfall-runoff model
 Hydrology Days 212 Influence of spatial variation in precipitation on artificial neural network rainfall-runoff model André Dozier 1 Department of Civil and Environmental Engineering, Colorado State University
GIS in Water Resources Exercise #4 Solution Prepared by Irene Garousi-Nejad and David Tarboton
 GIS in Water Resources Exercise 4 Solution Prepared by Irene Garousi-Nejad and David Tarboton 1. Cell length (N-S) in m, width (E-W) in m, area in m 2 for the DEM cells in the merged DEM. N-S y = R e φ
Hydrologically Consistent Pruning of the High- Resolution National Hydrography Dataset to 1:24,000-scale
 Hydrologically Consistent Pruning of the High- Resolution National Hydrography Dataset to 1:24,000-scale Lawrence V. Stanislawski 1, Ariel Doumbouya 2, Barbara P. Buttenfield 3, 1 Center for Excellence
The National Hydrography Dataset in the Pacific Region. U.S. Department of the Interior U.S. Geological Survey
 The National Hydrography Dataset in the Pacific Region U.S. Department of the Interior U.S. Geological Survey The National Map The National Map is built on partnerships and standards The National Map consists
Making the Digital Water Flow The Evolution of Geospatial Surfacewater Frameworks
 1 P a g e Making the Digital Water Flow The Evolution of Geospatial Surfacewater Frameworks (T.Dewald, USEPA, Office of Water, Washington, DC - June, 2015. Revised June, 2017) The application of digital
USING GIS TO MODEL AND ANALYZE HISTORICAL FLOODING OF THE GUADALUPE RIVER NEAR NEW BRAUNFELS, TEXAS
 USING GIS TO MODEL AND ANALYZE HISTORICAL FLOODING OF THE GUADALUPE RIVER NEAR NEW BRAUNFELS, TEXAS ASHLEY EVANS While the state of Texas is well-known for flooding, the Guadalupe River Basin is one of
George Mason University Department of Civil, Environmental and Infrastructure Engineering. Dr. Celso Ferreira Prepared by Lora Baumgartner
 George Mason University Department of Civil, Environmental and Infrastructure Engineering Dr. Celso Ferreira Prepared by Lora Baumgartner Exercise Topic: Downloading Spatial Data Objectives: a) Become
Hydrologic and Hydraulic Analyses Using ArcGIS
 Hydrologic and Hydraulic Analyses Using ArcGIS Two day training class Overview ArcGIS and Arc Hydro provide strong foundation for support of hydrologic and hydraulic (H&H) analyses. This two-day course
National Hydrography Dataset (NHD) Update Project for US Forest Service Region 3
 Update Project for US Forest Service Region 3") National Hydrography Dataset (NHD) Update Project for US Forest Service Region 3 Allison Moncada California State University, Northridge February 2017 July 2017 Advisor: Joel Osuna Center for Geographical
National Hydrography Dataset (NHD) Update Project for US Forest Service Region 3 Allison Moncada California State University, Northridge February 2017 July 2017 Advisor: Joel Osuna Center for Geographical
NATIONAL HYDROGRAPHY DATASET (NHD) UPDATE PROJECT FOR US FOREST SERVICE REGION 3
 UPDATE PROJECT FOR US FOREST SERVICE REGION 3") NATIONAL HYDROGRAPHY DATASET (NHD) UPDATE PROJECT FOR US FOREST SERVICE REGION 3 Allison Moncada California State University, Northridge February 2018 July 2018 Advisor: Joel Osuna Center for Geospatial
NATIONAL HYDROGRAPHY DATASET (NHD) UPDATE PROJECT FOR US FOREST SERVICE REGION 3 Allison Moncada California State University, Northridge February 2018 July 2018 Advisor: Joel Osuna Center for Geospatial
Management and Sharing of Hydrologic Information of Cache County
 Geographic Information System in Water Resources CEE6440 Fall Semester 2012 Management and Sharing of Hydrologic Information of Cache County To: Dr. David Tarboton Instructor By: Tian Gan Dec.7, 2012 I.
Leveraging LiDAR for Statewide NHD Hydrography Projects. Susan Phelps, CFM, GISP
 Leveraging LiDAR for Statewide NHD Hydrography Projects Susan Phelps, CFM, GISP Mon, July 11 th, 2016 National Hydrography Dataset (NHD) Background Why Local-Res NHD? Drivers Include: Availability of accurate
International Geospatial Harmonization of Sister Datasets Hydrography and Watershed Boundaries between Canada and the U.S.A
 International Geospatial Harmonization of Sister Datasets Hydrography and Watershed Boundaries between Canada and the U.S.A by Judy Kwan and Pete Steeves Environment Canada and US Geological Survey in
Improvement of the National Hydrography Dataset for US Forest Service Region 3 in Cooperation with the National Forest Service
 Improvement of the National Hydrography Dataset for US Forest Service Region 3 in Cooperation with the National Forest Service Christian L. DeCasas California State University, Northridge November 7 th,
Figure 0-18: Dendrogeomorphic analysis of streambank erosion and floodplain deposition (from Noe and others, 2015a)
") Appendix 9A: Stream to River During the development of the Phase 6 Watershed Model, multiple methods for determining coefficients were often attempted. In some cases, the methods are averaged or otherwise
Appendix 9A: Stream to River During the development of the Phase 6 Watershed Model, multiple methods for determining coefficients were often attempted. In some cases, the methods are averaged or otherwise
Development and Land Use Change in the Central Potomac River Watershed. Rebecca Posa. GIS for Water Resources, Fall 2014 University of Texas
 Development and Land Use Change in the Central Potomac River Watershed Rebecca Posa GIS for Water Resources, Fall 2014 University of Texas December 5, 2014 Table of Contents I. Introduction and Motivation..4
Creating Watersheds and Stream Networks. Steve Kopp
 Creating Watersheds and Stream Networks Steve Kopp Workshop Overview Demo Data Understanding the tools Elevation Data Types DEM : Digital Elevation Model bare Earth DSM : Digital Surface Model Data Structure
Estimating Stream Gradient Using NHD Stream Lines and DEM Data
 Estimating Stream Gradient Using NHD Stream Lines and DEM Data David Nagel, John M. Buffington, and Daniel Isaak U.S. Forest Service, Rocky Mountain Research Station Boise Aquatic Sciences Lab Boise, ID
Plastic debris in 29 Great Lakes tributaries: Relations to watershed attributes and hydrology
 Plastic debris in 29 Great Lakes tributaries: Relations to watershed attributes and hydrology Supporting Information Austin K. Baldwin a, *, Steven R. Corsi a, Sherri A. Mason b a U.S. Geological Survey,
GRAPEVINE LAKE MODELING & WATERSHED CHARACTERISTICS
 GRAPEVINE LAKE MODELING & WATERSHED CHARACTERISTICS Photo Credit: Lake Grapevine Boat Ramps Nash Mock GIS in Water Resources Fall 2016 Table of Contents Figures and Tables... 2 Introduction... 3 Objectives...
Web-Based Engine For Discovery Of Observations Using Landscape Units
 City University of New York (CUNY) CUNY Academic Works International Conference on Hydroinformatics 8-1-2014 Web-Based Engine For Discovery Of Observations Using Landscape Units Haowen Xu Abbas Ali Amir
THE ROLE OF GEOCOMPUTATION IN THE HYDROLOGICAL SCIENCES
 INTERNATIONAL SYMPOSIUM ON GEOCOMPUTATION AND ANALYSIS THE ROLE OF GEOCOMPUTATION IN THE HYDROLOGICAL SCIENCES JOHN P. WILSON UNIVERSITY OF SOUTHERN CALIFORNIA GIS RESEARCH LABORATORY Outline Background
Preparing a NFIE-Geo Database for Travis County
 Preparing a NFIE-Geo Database for Travis County By David R. Maidment Center for Research in Water Resources University of Texas at Austin 2 February 2015 Contents Introduction... 1 Step 1. Download and
Watershed Delineation
 Watershed Delineation Jessica L. Watkins, University of Georgia 2 April 2009 Updated by KC Love February 25, 2011 PURPOSE For this project, I delineated watersheds for the Coweeta synoptic sampling area
USGS National Geospatial Program Understanding User Needs. Dick Vraga National Map Liaison for Federal Agencies July 2015
 + USGS National Geospatial Program Understanding User Needs Dick Vraga National Map Liaison for Federal Agencies July 2015 + Topics 2 Background Communities of Use User Surveys National Map Liaisons Partnerships
Exercise 4. Watershed and Stream Network Delineation
 Exercise 4. Watershed and Stream Network Delineation GIS in Water Resources, Fall 2018 Prepared by David G Tarboton and David R. Maidment Revised 9 October, 2018 Purpose The purpose of this exercise is
Drainage Area: GL, VPU: 04 - Release Notes. 12/01/2018 Updated and New Data
 Drainage Area: GL, VPU: 04 - Release Notes 12/01/2018 Updated and New Data Time of Travel and Related Attributes: The new and updated data is included in new versions of the NHDPlusAttributes and EROMExtension
A GIS-based Approach to Watershed Analysis in Texas Author: Allison Guettner
 Texas A&M University Zachry Department of Civil Engineering CVEN 658 Civil Engineering Applications of GIS Instructor: Dr. Francisco Olivera A GIS-based Approach to Watershed Analysis in Texas Author:
Assessment of a Rapid Approach for Estimating Catchment Areas for Surface Drainage Lines
 Assessment of a Rapid Approach for Estimating Catchment Areas for Surface Drainage Lines U.S. Geological Survey Center of Excellence for Geospatial Information Science 1400 Independence Road, Rolla Missouri,
ARMSTRONG COUNTY, PA
 ARMSTRONG COUNTY, PA Revised Preliminary DFIRM Mapping March 31, 2013 Kevin Donnelly, P.E., CFM GG3, Greenhorne & O Mara, Inc. Presentation Agenda Armstrong County DFIRM Overview - June 25, 2010 DFIRM
HYDROLOGIC AND WATER RESOURCES EVALUATIONS FOR SG. LUI WATERSHED
 HYDROLOGIC AND WATER RESOURCES EVALUATIONS FOR SG. LUI WATERSHED 1.0 Introduction The Sg. Lui watershed is the upper part of Langat River Basin, in the state of Selangor which located approximately 20
Welcome to NetMap Portal Tutorial
 Welcome to NetMap Portal Tutorial Potential Applications What Can you do with the Portal? At least 25 things! 1) Locate the best potential fish habitats. 2) Identify biological hotspots. 3) Map floodplain
GIS in Water Resources Exercise #4 Solution
 GIS in Water Resources Exercise #4 Solution 1. Table giving the length of the Logan River main stream from NHDPlus Length (km) column, Landscape.gdb\NHDPlusv shape_length and Logan.gdb\Basemap\LoganMain
SAN FRANCISCO DISTRICT INFORMATION REQUESTED FOR VERIFICATION OF CORPS JURISDICTION
 DEPARTMENT OF THE ARMY SAN FRANCISCO DISTRICT, U.S. ARMY CORPS OF ENGINEERS 1455 MARKET STREET SAN FRANCISCO, CALIFORNIA 94103-1398 SAN FRANCISCO DISTRICT INFORMATION REQUESTED FOR VERIFICATION OF CORPS
A Help Guide for Using gssurgo to Find Potential Wetland Soil Landscapes
 A Help Guide for Using gssurgo to Find Potential Wetland Soil Landscapes Wetland Mapping Consortium Webinar September 17, 2014 Dr. John M. Galbraith Crop & Soil Environmental Sciences Virginia Tech Wetland
used to transport sediments throughout the lands. In this regard, understanding erosion is
 David Rounce GIS in Water Resources 11/23/2010 Erosion Potential in Travis County INTRODUCTION Erosion has played a vital role in the morphology of the Earth as its processes have been used to transport
Water Information Portal User Guide. Updated July 2014
 Water Information Portal User Guide Updated July 2014 1. ENTER THE WATER INFORMATION PORTAL Launch the Water Information Portal in your internet browser via http://www.bcogc.ca/public-zone/water-information
Leon Creek Watershed October 17-18, 1998 Rainfall Analysis Examination of USGS Gauge Helotes Creek at Helotes, Texas
 Leon Creek Watershed October 17-18, 1998 Rainfall Analysis Examination of USGS Gauge 8181400 Helotes Creek at Helotes, Texas Terrance Jackson MSCE Candidate University of Texas San Antonio Abstract The
Hydrologic Engineering Applications of Geographic Information Systems
 Hydrologic Engineering Applications of Geographic Information Systems Davis, California Objectives: The participant will acquire practical knowledge and skills in the application of GIS technologies for
Indiana GIS Local Resolution NHD Applications. Indiana State GIS Conference
 Indiana GIS Local Resolution NHD Applications Indiana State GIS Conference May 7, 2013 Agenda Topics I. Indiana s National Hydrography y Data II. Accessing NHD Data III. Demonstrations Using Local NHD
Areal Reduction Factors for the Colorado Front Range and Analysis of the September 2013 Colorado Storm
 Areal Reduction Factors for the Colorado Front Range and Analysis of the September 2013 Colorado Storm Doug Hultstrand, Bill Kappel, Geoff Muhlestein Applied Weather Associates, LLC - Monument, Colorado
Lidar-derived Hydrography as a Source for the National Hydrography Dataset
 Lidar-derived Hydrography as a Source for the National Hydrography Dataset Lidar-Derived Hydrography, Bathymetry, and Topobathymetry in the National Hydrography Dataset and 3-Dimensional Elevation Program
USGS Community Engagement and its Role in Improving The National Map
 USGS Community Engagement and its Role in Improving The National Map ESRI User Conference, 2014 Bob Davis Carol Ostergren Drew Decker USGS Strategic Direction Provides a sharpened focus on our topographic
Exercise 4. Watershed and Stream Network Delineation
 Exercise 4. Watershed and Stream Network Delineation GIS in Water Resources, Fall 2015 Prepared by David G Tarboton and David R. Maidment Purpose The purpose of this exercise is to illustrate watershed
Hydrography - the building block of IP - Session Guide
 Hydrography - the building block of IP - Session Guide Lead(s): Mindi Sheer (NOAA), Dan Miller (ESI), Bill Kaiser (USFS), Group Goal: discuss technical hydro considerations independent of source, review
Workshop: Build a Basic HEC-HMS Model from Scratch
 Workshop: Build a Basic HEC-HMS Model from Scratch This workshop is designed to help new users of HEC-HMS learn how to apply the software. Not all the capabilities in HEC-HMS are demonstrated in the workshop
Exercise 5 - Watershed and Stream Network Delineation from DEMs GIS in Water Resources Fall 2014
 1 Exercise 5 - Watershed and Stream Network Delineation from DEMs GIS in Water Resources Fall 2014 Prepared by Ayse Kilic and Bhavneet Soni 1 University of Nebraska-Lincoln This exercise illustrates watershed
NEEA Refresh aka 3D Nation Requirements and Benefits Study. Allyson Jason, Carol Ostergren, Xan Fredericks and Lou Driber November 9, 2017
 + NEEA Refresh aka 3D Nation Requirements and Benefits Study Allyson Jason, Carol Ostergren, Xan Fredericks and Lou Driber November 9, 2017 + 2 Study Context Background The National Enhanced Elevation
Guide to Hydrologic Information on the Web
 NOAA s National Weather Service Guide to Hydrologic Information on the Web Colorado River at Lees Ferry Photo: courtesy Tim Helble Your gateway to web resources provided through NOAA s Advanced Hydrologic
National Flood Interoperability Experiment
 National Flood Interoperability Experiment David R. Maidment, University of Texas at Austin Catchment-based Hydrological Data Assimilation (CAHMDA) VI Conference 8 September 2014 Located on Tuscaloosa
The National Map Data Delivery Services
 The National Map Data Delivery Services U.S. Department of the Interior U.S. Geological Survey April 2015 Jim Langtry jlangtry@usgs.gov Topics for Today The National Map Delivery Services The National
Areal Reduction Factors for the Colorado Front Range and Analysis of the September 2013 Colorado Storm
 Areal Reduction Factors for the Colorado Front Range and Analysis of the September 2013 Colorado Storm Doug Hultstrand, Bill Kappel, Geoff Muhlestein Applied Weather Associates, LLC - Monument, Colorado
4. GIS Implementation of the TxDOT Hydrology Extensions
 4. GIS Implementation of the TxDOT Hydrology Extensions A Geographic Information System (GIS) is a computer-assisted system for the capture, storage, retrieval, analysis and display of spatial data. It
GIS in Water Resources Midterm Quiz Fall There are 5 questions on this exam. Please do all 5. They are of equal credit.
 Name: GIS in Water Resources Midterm Quiz Fall 2003 There are 5 questions on this exam. Please do all 5. They are of equal credit. 1. Data Representation (a) In ArcGIS, vector and tabular data have a number
Exercise 4. Watershed and Stream Network Delineation
 Exercise 4. Watershed and Stream Network Delineation GIS in Water Resources, Fall 2016 Prepared by David G Tarboton and David R. Maidment Updated to ArcGIS Pro by Paul Ruess [9/29/16 Further updated to
USING A GEOGRAPHIC INFORMATION SYSTEM TO PREDICT FLOW DURATION CURVES AT UNGAGED STREAM SITES IN GUAM
 USING A GEOGRAPHIC INFORMATION SYSTEM TO PREDICT FLOW DURATION CURVES AT UNGAGED STREAM SITES IN GUAM Dr. Leroy F. Heitz lheitz@triton.uog.edu Dr. Shahram Khosrowpanah khosrow@triton.uog.edu Water and
Using the Stock Hydrology Tools in ArcGIS
 Using the Stock Hydrology Tools in ArcGIS This lab exercise contains a homework assignment, detailed at the bottom, which is due Wednesday, October 6th. Several hydrology tools are part of the basic ArcGIS
Hydrography Program Highlights and Demonstrations
 Hydrography Program Highlights and Demonstrations 2018-05-09, Reston North American Mapping Mark Sondheim & Marie-Eve Martin Overview Common Hydrology Features model: CHyF (chief) Linked Open Data: LOD
Objectives: After completing this assignment, you should be able to:
 Data Analysis Assignment #1 Evaluating the effects of watershed land use on storm runoff Assignment due: 21 February 2013, 5 pm Objectives: After completing this assignment, you should be able to: 1) Calculate
Model Calibration and Forecast Error for NFIE-Hydro
 Corey Van Dyk C E 397 Flood Forecasting 5/8/15 Model Calibration and Forecast Error for NFIE-Hydro Introduction The forecasting component of the National Flood Interoperability Experiment (NFIE), like
WDCloud: An End to End System for Large- Scale Watershed Delineation on Cloud
 WDCloud: An End to End System for Large- Scale Watershed Delineation on Cloud * In Kee Kim, * Jacob Steele, + Anthony Castronova, * Jonathan Goodall, and * Marty Humphrey * University of Virginia + Utah
Georeferencing Water Quality Assessments to NHDPlus Catchments
 Georeferencing Water Quality Assessments to NHDPlus Catchments A New Approach to Evaluating and Measuring Progress in Surface Water Quality DWANE YOUNG, U.S. EPA, OFFICE OF WATER Outline Georeferencing
Observatories in the context of the Digital Continent: CZO s and HIS
 Observatories in the context of the Digital Continent: CZO s and HIS Dr. Richard P. Hooper, President, Consortium of Universities for the Advancement of Hydrologic Science, Inc. Why Observatories? From
REMOTE SENSING AND GEOSPATIAL APPLICATIONS FOR WATERSHED DELINEATION
 REMOTE SENSING AND GEOSPATIAL APPLICATIONS FOR WATERSHED DELINEATION Gaurav Savant (gaurav@engr.msstate.edu) Research Assistant, Department of Civil Engineering, Lei Wang (lw4@ra.msstate.edu) Research
Snowcover interaction with climate, topography & vegetation in mountain catchments
 Snowcover interaction with climate, topography & vegetation in mountain catchments DANNY MARKS Northwest Watershed Research Center USDA-Agricultural Agricultural Research Service Boise, Idaho USA RCEW
GREENE COUNTY, PA. Revised Preliminary DFIRM Mapping FEMA. Kevin Donnelly, P.E., CFM GG3, Greenhorne & O Mara, Inc. April 10, 2013
 GREENE COUNTY, PA Revised Preliminary DFIRM Mapping April 10, 2013 Kevin Donnelly, P.E., CFM GG3, Greenhorne & O Mara, Inc. Presentation Agenda Greene County DFIRM Overview September 30, 2010 DFIRM Countywide
Base Level Engineering FEMA Region 6
 Base Level Engineering Over the past five years, has been evaluating its investment approach and data preparation work flow to establish an efficient and effective change in operation, generating an approach
Rick Faber CE 513 Watershed and Streamwork Delineation Lab # 3 4/24/2006
 Rick Faber CE 513 Watershed and Streamwork Delineation Lab # 3 4/24/2006 1. Objective & Discussion: 2 To learn to use the ArcHydro tools to produce hydrologically descriptive data sets starting from a
Exercise 4. Watershed and Stream Network Delineation
 Exercise 4. Watershed and Stream Network Delineation GIS in Water Resources, Fall 2014 Prepared by David G Tarboton and David R. Maidment Purpose The purpose of this exercise is to illustrate watershed
GISHydro2000: A Tool for Automated Hydrologic Analysis in Maryland. G. E. Moglen 1
 GISHydro2000: A Tool for Automated Hydrologic Analysis in Maryland G. E. Moglen 1 1 Department of Civil and Environmental Engineering, University of Maryland, College Park, MD 20742; PH (301) 405-1964;
Spatial Data and Synoptic Protocols: LINX-2. Assessment of Nitrate Concentration Patterns in River Networks
 Spatial Data and Synoptic Protocols: LINX-2 Assessment of Nitrate Concentration Patterns in River Networks Revision 2.2: July 31, 2004 Landscape Analysis Contact Info: M.S. Student: (Primary contact) Landscape
NWT Open Report Delineation of Watersheds in the Mackenzie Mountains
 NWT Open Report 2015-007 Delineation of Watersheds in the Mackenzie Mountains K.L. Pierce and H. Falck Recommended Citation: Pierce, K.L. and Falck, H., 2015. Delineation of watersheds in the Mackenzie
Land Cover and Soil Properties of the San Marcos Subbasin
 Land Cover and Soil Properties of the San Marcos Subbasin Cody McCann EWRE Graduate Studies December 6, 2012 Table of Contents Project Background............................................................
CE 394K.3 GIS in Water Resources Midterm Quiz Fall There are 5 questions on this exam. Please do all 5. They are of equal credit.
 Name: CE 394K.3 GIS in Water Resources Midterm Quiz Fall 2000 There are 5 questions on this exam. Please do all 5. They are of equal credit. 1. The ArcView Geographic Information System can display different
Speakers: NWS Buffalo Dan Kelly and Sarah Jamison, NERFC Jeane Wallace. NWS Flood Services for the Black River Basin
 Speakers: NWS Buffalo Dan Kelly and Sarah Jamison, NERFC Jeane Wallace NWS Flood Services for the Black River Basin National Weather Service Who We Are The National Oceanic and Atmospheric Administration
MODULE 7 LECTURE NOTES 5 DRAINAGE PATTERN AND CATCHMENT AREA DELINEATION
 MODULE 7 LECTURE NOTES 5 DRAINAGE PATTERN AND CATCHMENT AREA DELINEATION 1. Introduction Topography of the river basin plays an important role in hydrologic modelling, by providing information on different
Hydrology and Watershed Analysis
 Hydrology and Watershed Analysis Manual By: Elyse Maurer Reference Map Figure 1. This map provides context to the area of Washington State that is being focused on. The red outline indicates the boundary
A Comprehensive Inventory of the Number of Modified Stream Channels in the State of Minnesota. Data, Information and Knowledge Management.
 A Comprehensive Inventory of the Number of Modified Stream Channels in the State of Minnesota Data, Information and Knowledge Management Glenn Skuta Environmental Analysis and Outcomes Division Minnesota
BSYSE 456/556 Surface Hydrologic Processes and Modeling
 BSYSE 456/556 Surface Hydrologic Processes and Modeling Lab 9 (Prepared by Erin Brooks and Jan Boll, UI, and Joan Wu, WSU) P Introduction One of the most difficult tasks in watershed assessment and management
Current and Future Plans. R. Srinivasan
 Current and Future Plans R. Srinivasan Contents 1 The ArcSWAT Interface 2 VizSWAT: Output Visualization 3 User online support 4 MapWindows SWAT interface 5 ArcGIS SWAT/APEX interfaces 6 Radar Rainfall
Watershed Modeling With DEMs
 Watershed Modeling With DEMs Lesson 6 6-1 Objectives Use DEMs for watershed delineation. Explain the relationship between DEMs and feature objects. Use WMS to compute geometric basin data from a delineated
Wetlands and Riparian Mapping Framework Technical Meeting
 Wetlands and Riparian Mapping Framework Technical Meeting Meghan Burns Landscape Ecologist Linda Vance Senior Ecologist Why wetland and riparian mapping? Preliminary site assessment for the presence of
USGS Flood Inundation Mapping of the Suncook River in Chichester, Epsom, Pembroke and Allenstown, New Hampshire
 USGS Flood Inundation Mapping of the Suncook River in Chichester, Epsom, Pembroke and Allenstown, New Hampshire NH Water & Watershed Conference Robert Flynn, USGS NH-VT Water Science Center March 23, 2012
Watershed Analysis of the Blue Ridge Mountains in Northwestern Virginia
 Watershed Analysis of the Blue Ridge Mountains in Northwestern Virginia Mason Fredericks December 6, 2018 Purpose The Blue Ridge Mountain range is one of the most popular mountain ranges in the United
USGS QUADRANGLES IN GOOGLE EARTH
 USGS QUADRANGLES IN GOOGLE EARTH By Thomas G. Davis 1, PhD, PE, PLS and Rollins Turner 2, PhD INTRODUCTION QUADS (http://www.metzgerwillard.us/quads/) is a web-based service for visualizing USGS quadrangle
Exercise 4. Watershed and Stream Network Delineation
 Exercise 4. Watershed and Stream Network Delineation GIS in Water Resources, Fall 2017 Prepared by David G Tarboton and David R. Maidment Updated to ArcGIS Pro by Paul Ruess Purpose The purpose of this
GIS INSTRUCTIONAL MANUAL
 GIS INSTRUCTIONAL MANUAL: BEAVER RESTORATION AND ASSESSMENT TOOL (BRAT) CASE STUDY: ESCALANTE RIVER WATERSHED VERSION 1.0 (RELEASE DATE: JANUARY 21, 2013) Prepared by: WILLIAM W. MACFARLANE, Research Associate
Analysis of the Sacramento Soil Moisture Accounting Model Using Variations in Precipitation Input
 Meteorology Senior Theses Undergraduate Theses and Capstone Projects 12-216 Analysis of the Sacramento Soil Moisture Accounting Model Using Variations in Precipitation Input Tyler Morrison Iowa State University,