Statistical methods for evaluating air pollution and temperature effects on human health
|
|
|
- Sarah Cooper
- 5 years ago
- Views:
Transcription
1 Statistical methods for evaluating air pollution and temperature effects on human health Ho Kim School of Public Health, Seoul National University ISES-ISEE 2010 Workshop August 28, 2010, COEX, Seoul, Korea
2 # Hour Description File names 1 8:30-9:30 Introduction to Air pollution Epidemiology 1Intro.pdf 2 9:30-10:00 Introduction to R (1) 2introR.pdf,2introR.r prerequirement.r 10:00-10:30 Coffee break (R install and/or lab) Introduction to R (2) Exploring data, Introduction to R data, reading Korea data, Descriptive statistics 3expl.pdf 3 10:30-11:30 Box plot, Summary 3expl.r Time-series plot for air pollution, temperature, and mortality 4 11:30-12:30 Time-series analysis (1) 4times1.pdf 12:30-2:00 Lunch 5 2:00-3:00 Statistical analysis 5times1.pdf GAM/GLM 5times1.r 3:00-3:30 Coffee break 6 3:30-4:00 Time-series analysis (2) 6times2.pdf 7 4:00-5:00 Multisite studies, Threshold model 7times2.pdf,7times :00-6:00 Case-crossover analysis - Matching variables - Stratum 8cc1.pdf, 8cc2.pdf 8cc2.r
3 Introduction and Basic Theories Outline Introduction to Environmental Epidemiology (Air Pollution and Temperature) Time-series analysis Lag structure Multi-pollutant models Sensitivity check (df, lag, ) Meta analysis Case-crossover analysis Non-linear problems (threshold model)
4 Air pollution epidemiology (Environmental epidemiology) Assessing Air Pollution Effects on Human Health Air pollution Health Outcome Confounders (weather, time trend, Seasonality, etc)
5 Environmental epidemiology Assessing Air Pollution & Meteorological Effects on Human Health Air pollution, weather Health Outcome Confounders (time trend, Seasonality, etc)


 Number 550 600 650 700")

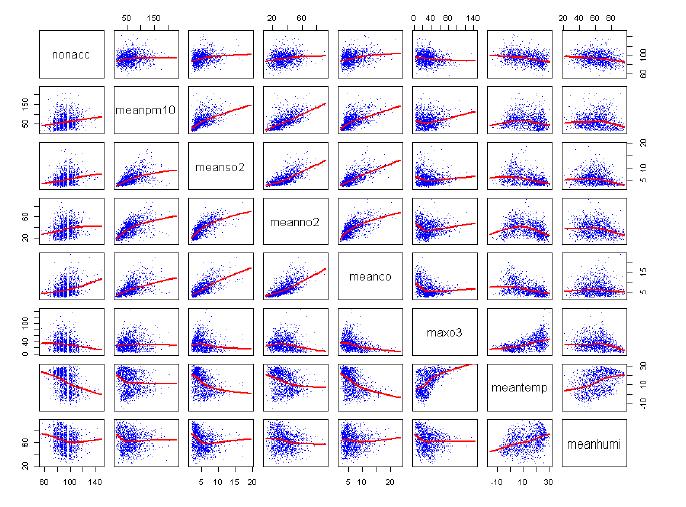
6 Environmental epidemiology Assessing Air Pollution & Meteorological Effects on Human Health Weather Mean, Max, & Air Min pollution Temp Humidity, PM10, Ozone, SO2, etc. Confounders Daily Mortality Number in Korea (time trend, seasonality) Number # of daily events: Health Outcome Death, hospitalization Time
7 Environmental Data Time and Space Time series analysis Reduce spatial complexity: calculate daily mean PM10 value over 27 monitoring stations Date temp PM10 Humidity SO2 Ozone 2010/1/ /1/ Number Daily Mortality Number in Korea Time


8 Spatial analysis Modeling spatial dependencies between geographical sites Park et al. Locating major PM10 source areas in Seoul using multivariate receptor modeling, Environmental and Ecological Statistics 2004;11:9-19
9 Health Data Several problems Accuracy of cause of death (disease) Morbidity data is not easy to collect and analyze # daily Daily hospitalization Haspital Number in Korea in Seoul National Health Insurance Data are excellent sources of health information, BUT Number Q1 Q2 Q3 Q4 Q1 Q2 Q3 Q4 Q1 Q2 Q3 Q4 Q1 Q2 Q3 Q4 Q Time
10 Health Data Several problems Accuracy of cause of death (disease) Morbidity data is not easy to collect and analyze # daily Daily hospitalization Haspital Number in Korea in Seoul Monday Sundays and holidays Number Q1 Q2 Q3 Q4 Q1 Q2 Q3 Q4 Q1 Q2 Q3 Q4 Q1 Q2 Q3 Q4 Q Time Adjustment of weekdays is essential!

11 Association between air-pollution and health outcomes Time-series plots Daily Mortality Number in Korea Number Time Correlations: Pearson corr and Spearman s rank correlations 0: No association
12
13 Q: Air Pollution,health outcome is it possible to have positive association? A H
14 Q: Air Pollution,health outcome is it possible to have positive association? YES A H
15 Q: Air Pollution,health outcome is it possible to have positive association? YES A We want to remove 1) long-term time trend 2) Seasonal trend H After controlling for those confounding factors, We want to compare dayto-day variations between air pollution and health outcomes
16 Q: Air Pollution,health outcome is it possible to have positive association? Long-term trend removed A We want to remove 1) long-term time trend 2) Seasonal trend H After controlling for those confounding factors, We want to compare dayto-day variations between air pollution and health outcomes
17 Nonparametric Smoothing: lowess Smoothing Consider X Y plot. Draw a regression line which requires no parametric assumptions The regression line is not linear The regression line is totally dependent on the data Two components of smoothing Kernal function : How to calculate weighted mean Bandwidth : width of the window (span), determines the smoothness of the regression line; wider > smoother
18 Nonparametric Smoothing: lowess Uniform Kernel
19 Nonparametric Smoothing: lowess Uniform Kernel
20 Nonparametric Smoothing: lowess Uniform Kernel
21 Nonparametric Smoothing: lowess Uniform Kernel
22 Nonparametric Smoothing: lowess Triangular Kernel
23 Nonparametric Smoothing: lowess Normal Kernel
24 Nonparametric Smoothing: lowess Linear assumptions at the both ends Default Lowess line : Span=0.5 Use 50% of data to calculate 1 point
25 Nonparametric Smoothing: lowess Lowess line : Span=0.2
26 Nonparametric Smoothing: lowess Lowess line : Span=0.1 Caution: Linear assumptions at the ends
27 Natural cubic spline df=4 Cubic polynomials with same values and derivatives at the bounds
28 ## Types of degree of freedom in ns (PM 10 in Seoul, )
29 Choosing df is not an easy task Typically 4(seasons) time # years We are interested in robustness of the estimator of air pollution -> sensitivity analysis
30 temperature-health study

31 IPCC 2007b
32 Global Average Surface Temperature IPCC 2007b
33 Surface Temperature Anomalies IPCC 2007b

34 Health Impacts of Climate Change McMichael et al. 2003a
35 Direction and Magnitude of Climate Change Health Impacts IPCC 2007a

36 UNEP 2009 Total CO 2 Emissions
")
37 Health Burden of Climate Change Impacts Deaths from malaria and dengue fever, diarrhoea, malnutriti on, flooding, and (in OECD countries) heatwaves

38 Vulnerable Groups Subgroup analysis Interactions in a model
39
40
41
42
43
44
45
46

47 2003 European heat wave killed more than 35,000 people These conditions are forecasted to be common by Image courtesy of NASA Earth Observatory
48 Daily mortality in Paris during summer 2003 Source: Institut de Veille Sanitaire, France
49 Daily mortality in London, summer 2003 Daily mortality Mean temperature 01jun jul aug sep2003 Date Source: Hajat Observed deaths Mean temperature Baseline deaths

50 Why was Paris so badly affected? Temperature extremes - high minimum temperature Poor meteorological forecast Institutional failures - hospital and care home staff on holiday No health surveillance No previous experience/knowledge - no public health measures Source: Hajat
51 Time-series analysis Daily mortality in London: Daily mortality Mean temperature Source: Hajat
52 Daily mortality in London: Daily mortality Source: Hajat Mean temperature Heat threshold Heat slope
53 FC Curriero et al. AJE 2002
54 Ho Kim, Jong-Sik Ha, Jeongim Park, High Temperature, heat index, and mortality in six major cities in South Korea Archives of Environmental and Occupational Health, 2006;61(6):
55 Curriero et al., (2002) AJE 55
56 Vulnerable population groups The elderly Infants and Children People with Chronic Diseases People taking certain medications People whose socioeconomic status may make them more vulnerable People in certain occupation Source: Heat-related Action Plans, WHO EUROPE
Comparing the Relationships Between Heat Stress Indices and Mortality in North Carolina
 Comparing the Relationships Between Heat Stress Indices and Mortality in North Carolina Jordan Clark PhD Student CISA Research Assistant Department of Geography UNC-Chapel Hill 10/30/2018 Overview Background
African dust and forest fires: Impacts on health MED-PARTICLES-LIFE+ project
 African dust and forest fires: Impacts on health MED-PARTICLES-LIFE+ project Massimo Stafoggia Barcelona, April 28 th 2015 Particles size and composition in Mediterranean countries: geographical variability
Dr. Haritini Tsangari Associate Professor of Statistics University of Nicosia, Cyprus
 Dr. Haritini Tsangari Associate Professor of Statistics University of Nicosia, Cyprus H. Tsangari (presenting) 1, Z. Konsoula 1, S. Christou 1, K. E. Georgiou 2, K. Ioannou 3, T. Mesimeris 3, S. Kleanthous
A time stratified to time series data
 Case crossover method A time stratified to time series data ISEE workshop 2010 Contents Case crossover? casecross(), a function in R Application to casecross() 1) matching day of the week 2) matching temperature
Extreme Weather Events: Infrastructure Damage and Impact on Vulnerable Populations
 Extreme Weather Events: Infrastructure Damage and Impact on Vulnerable Populations Cindy L. Parker MD, MPH Physicians for Social Responsibility Johns Hopkins Bloomberg School of Public Health 1 Climate
Climate and Health Vulnerability & Adaptation Assessment Profile Manaus - Brazil
 Climate and Health Vulnerability & Adaptation Assessment Profile Manaus - Brazil Christovam Barcellos (ICICT/Fiocruz) Diego Xavier Silva (ICICT/Fiocruz) Rita Bacuri (CPqLMD/Fiocruz) Assessment Objectives
Causal Modeling in Environmental Epidemiology. Joel Schwartz Harvard University
 Causal Modeling in Environmental Epidemiology Joel Schwartz Harvard University When I was Young What do I mean by Causal Modeling? What would have happened if the population had been exposed to a instead
Evaluation of building-scale heat-stress analysis system (BioCAS) based on mortality observation in Seoul
 based on mortality observation in Seoul") ICUC9 9th International Congress on Urban Climate 20 24 July, 2015, Toulouse France Evaluation of building-scale heat-stress analysis system (BioCAS) based on mortality observation in Seoul National Institute
ICUC9 9th International Congress on Urban Climate 20 24 July, 2015, Toulouse France Evaluation of building-scale heat-stress analysis system (BioCAS) based on mortality observation in Seoul National Institute
Short-term effects of ultrafine, fine and coarse particles on cause-specific mortality in 7 European cities Massimo Stafoggia
 Short-term effects of ultrafine, fine and coarse particles on cause-specific mortality in 7 European cities Massimo Stafoggia Dresden, Nov 28 th 2014 BACKGROUND Conflicting evidence on UF effects, often
Heat and Health: Reducing the Impact of the Leading Weather-Related Killer
 Heat and Health: Reducing the Impact of the Leading Weather-Related Killer Laurence S. Kalkstein, Ph.D. Department of Public Health Sciences Miller School of Medicine University of Miami June, 2017 Quick
TEMPERATURE AND HEAT WAVE TRENDS IN MEXICALI, MEXICO
 TEMPERATURE AND HEAT WAVE TRENDS IN MEXICALI, MEXICO Polioptro Martinez-Austria polioptro.martinez@udlap.mx Carlos Villegas-Zeron Carlos.villegaszn@udlap.mx Department of Civil and Environmental Engineering,
Heat Alert and Response Systems in Canada
 Heat Alert and Response Systems in Canada Development of Climate Information Systems for Heat Health Early Warning Workshop Chicago, Illinois July 28-30 Sharon Jeffers Meteorological Service of Canada
David Rogers Health and Climate Foundation
 David Rogers Health and Climate Foundation Using environmental information Weather and Climate Informed Decisions Climate Information for Health Sector Decisions -
Introduction to Extreme Heat Events
 Introduction to Extreme Heat Events Chapter 1 Extreme heat events can cause a number of health-related problems, including an increase in deaths (mortality) and nonfatal outcomes (morbidity). Yet, almost
Flexible Spatio-temporal smoothing with array methods
 Int. Statistical Inst.: Proc. 58th World Statistical Congress, 2011, Dublin (Session IPS046) p.849 Flexible Spatio-temporal smoothing with array methods Dae-Jin Lee CSIRO, Mathematics, Informatics and
Seasonal prediction of extreme events
 Seasonal prediction of extreme events C. Prodhomme, F. Doblas-Reyes MedCOF training, 29 October 2015, Madrid Climate Forecasting Unit Outline: Why focusing on extreme events? Extremeness metric Soil influence
Hot Weather Response Plan
 City of Greater Sudbury Hot Weather Response Plan For Public Release Version 1.3 July 2007 May 2009 Revised: May 2010 TABLE OF CONTENTS Introduction... 3 Essential Components... 4 Objectives... 4 Roles
Climate impact on seasonal patterns of diarrhea diseases in Tropical area
 Climate impact on seasonal patterns of diarrhea diseases in Tropical area Akari Teshima 1, Michio Yamada 2, *Taiichi Hayashi 1, Yukiko Wagatsuma 3, Toru Terao 4 (1: DPRI, Kyoto Univ., Japan, 2: RIMS, Kyoto
Inference for stochastic processes in environmental science. V: Meteorological adjustment of air pollution data. Coworkers
 NRCSE Inference for stochastic processes in environmental science V: Meteorological adjustment of air pollution data Peter Guttorp NRCSE Coworkers Fadoua Balabdaoui, NRCSE Merlise Clyde, Duke Larry Cox,
THE STOCHASTIC PROPERTIES OF HIGH DAILY MAXIMUM TEMPERATURES
 THE STOCHASTIC PROPERTIES OF HIGH DAILY MAXIMUM TEMPERATURES By DAVID J. KEELLINGS A THESIS PRESENTED TO THE GRADUATE SCHOOL OF THE UNIVERSITY OF FLORIDA IN PARTIAL FULFILLMENT OF THE REQUIREMENTS FOR
Development and Application of Climate Prediction Technology to Limit Adverse Impact of Natural Disaster
 2017/EPWG/SDMOF/016 Thematic Session 2.4 Development and Application of Climate Prediction Technology to Limit Adverse Impact of Natural Disaster Submitted by: APEC Climate Center 11 th Senior Disaster
MISSION DEBRIEFING: Teacher Guide
 Activity 2: It s Raining Again?! Using real data from one particular location, students will interpret a graph that relates rainfall to the number of cases of malaria. Background The relationship between
Air Quality Modelling under a Future Climate
 Air Quality Modelling under a Future Climate Rachel McInnes Met Office Hadley Centre Quantifying the impact of air pollution on health - Fri 12th Sep 2014 Crown copyright Met Office Rachel.McInnes@metoffice.gov.uk
Paper Two - Optional Themes for Standard and Higher Level
 Paper Two - Optional Themes for Standard and Higher Level Timing: Approximately 40 minutes for each question (each is worth 20 marks). Choice: Higher Level candidates must answer three questions and Standard
AREP GAW. AQ Forecasting
 AQ Forecasting What Are We Forecasting Averaging Time (3 of 3) PM10 Daily Maximum Values, 2001 Santiago, Chile (MACAM stations) 300 Level 2 Pre-Emergency Level 1 Alert 200 Air Quality Standard 150 100
Current and Future Impacts of Wildfires on PM 2.5, Health, and Policy in the Rocky Mountains
 Current and Future Impacts of Wildfires on PM 2.5, Health, and Policy in the Rocky Mountains Yang Liu, Ph.D. STAR Grants Kick-off Meeting Research Triangle Park, NC April 5, 2017 Motivation The Rocky Mountains
Cluster Analysis using SaTScan
 Cluster Analysis using SaTScan Summary 1. Statistical methods for spatial epidemiology 2. Cluster Detection What is a cluster? Few issues 3. Spatial and spatio-temporal Scan Statistic Methods Probability
ASSESSING CLIMATE CHANGE IN CITIES USING URBCLIM. Hooyberghs, H.; De Ridder, K.; Lauwaet, D.; Maiheu, B.; Lefebvre, W.
 ASSESSING CLIMATE CHANGE IN CITIES USING URBCLIM Hooyberghs, H.; De Ridder, K.; Lauwaet, D.; Maiheu, B.; Lefebvre, W. Overview» The urban heat island» UrbClim model» Description» Validation» Current climate
Supplementary appendix
 Supplementary appendix This appendix formed part of the original submission and has been peer reviewed. We post it as supplied by the authors. Supplement to: Lowe R, Stewart-Ibarra AM, Petrova D, et al.
Evidence on the impact of sustained exposure to air pollution on life expectancy from China s Huai River policy, Chen et al.
 Evidence on the impact of sustained exposure to air pollution on life expectancy from China s Huai River policy, Chen et al. 2013, PNAS 11.4.2017 Matti Liski Department of Economics, BIZ Research question
Chapter 11. Correlation and Regression
 Chapter 11. Correlation and Regression The word correlation is used in everyday life to denote some form of association. We might say that we have noticed a correlation between foggy days and attacks of
DOWNLOAD PDF SCENERY OF SWITZERLAND, AND THE CAUSES TO WHICH IT IS DUE.
 Chapter 1 : The Scenery of Switzerland (Sir John Lubbock - ) (ID) ebay The scenery of Switzerland and the causes to which it is due / Related Titles Series: Collection of British authors ; vol. These diseases
Central Ohio Air Quality End of Season Report. 111 Liberty Street, Suite 100 Columbus, OH Mid-Ohio Regional Planning Commission
 217 218 Central Ohio Air Quality End of Season Report 111 Liberty Street, Suite 1 9189-2834 1 Highest AQI Days 122 Nov. 217 Oct. 218 July 13 Columbus- Maple Canyon Dr. 11 July 14 London 11 May 25 New Albany
World Weather Research Program: a ten years vision. PM Ruti, F Vitart, S Majumdar IWTC VIII Dec Jeju
 World Weather Research Program: a ten years vision PM Ruti, F Vitart, S Majumdar IWTC VIII Dec 014 - Jeju An overarching question Disaster risk reduction Climate services How should we move from weather
Jun Tu. Department of Geography and Anthropology Kennesaw State University
 Examining Spatially Varying Relationships between Preterm Births and Ambient Air Pollution in Georgia using Geographically Weighted Logistic Regression Jun Tu Department of Geography and Anthropology Kennesaw
Air Quality Modelling for Health Impacts Studies
 Air Quality Modelling for Health Impacts Studies Paul Agnew RSS Conference September 2014 Met Office Air Quality and Composition team Paul Agnew Lucy Davis Carlos Ordonez Nick Savage Marie Tilbee April
Impacts of Climate Change on Public Health: Bangladesh Perspective
 Global Journal of Environmental Research 5 (3): 97-15, 211 ISSN 199-925X IDOSI Publications, 211 Impacts of Climate Change on Public Health: Bangladesh Perspective M. Ruhul Amin, S.M. Tareq and S.H. Rahman
Reducing Vulnerability to Extreme Heat: Science-Policy Interface
 Reducing Vulnerability to Extreme Heat: Science-Policy Interface Olga Wilhelmi, Mary Hayden, Jennifer Boehnert, Ursula Lauper and SIMMER research team October 23, 2013 Toronto SIMMER workshop Science-Policy
OUTBREAK INVESTIGATION AND SPATIAL ANALYSIS OF SURVEILLANCE DATA: CLUSTER DATA ANALYSIS. Preliminary Programme / Draft_2. Serbia, Mai 2013
 OUTBREAK INVESTIGATION AND SPATIAL ANALYSIS OF SURVEILLANCE DATA: CLUSTER DATA ANALYSIS Preliminary Programme / Draft_2 Serbia, 20-24 Mai 2013 1. Course presentation Outbreak investigation is one of the
Smoothed Prediction of the Onset of Tree Stem Radius Increase Based on Temperature Patterns
 Smoothed Prediction of the Onset of Tree Stem Radius Increase Based on Temperature Patterns Mikko Korpela 1 Harri Mäkinen 2 Mika Sulkava 1 Pekka Nöjd 2 Jaakko Hollmén 1 1 Helsinki
Utilization of seasonal climate predictions for application fields Yonghee Shin/APEC Climate Center Busan, South Korea
 The 20 th AIM International Workshop January 23-24, 2015 NIES, Japan Utilization of seasonal climate predictions for application fields Yonghee Shin/APEC Climate Center Busan, South Korea Background Natural
Validation Results of a Spatially Fine-Scale Air Temperature Statistical Model in New York City
 Validation Results of a Spatially Fine-Scale Air Temperature Statistical Model in New York City Brian Vant-Hull, Maryam Karimi, Awalou Sossa, Louis Waxman, Estatio Guiterrez, Sarah Johnson*, Rouzbeh Nazari
Social Vulnerability Index. Susan L. Cutter Department of Geography, University of South Carolina
 Social Vulnerability Index Susan L. Cutter Department of Geography, University of South Carolina scutter@sc.edu Great Lakes and St. Lawrence Cities Initiative Webinar December 3, 2014 Vulnerability The
Regional Climate Centre Network (RCC) in RA VI as a GFCS contribution
 in RA VI as a GFCS contribution") Regional Climate Centre Network (RCC) in RA VI as a GFCS contribution Stefan Rösner and Peter Bissolli Deutscher Wetterdienst (German Meteorological Service) Dep. Climate Monitoring, Offenbach, Germany
Regional Climate Centre Network (RCC) in RA VI as a GFCS contribution Stefan Rösner and Peter Bissolli Deutscher Wetterdienst (German Meteorological Service) Dep. Climate Monitoring, Offenbach, Germany
Operational event attribution
 Operational event attribution Peter Stott, NCAR, 26 January, 2009 August 2003 Events July 2007 January 2009 January 2009 Is global warming slowing down? Arctic Sea Ice Climatesafety.org climatesafety.org
An application of the GAM-PCA-VAR model to respiratory disease and air pollution data
 An application of the GAM-PCA-VAR model to respiratory disease and air pollution data Márton Ispány 1 Faculty of Informatics, University of Debrecen Hungary Joint work with Juliana Bottoni de Souza, Valdério
1Department of Demography and Organization Studies, University of Texas at San Antonio, One UTSA Circle, San Antonio, TX
 Well, it depends on where you're born: A practical application of geographically weighted regression to the study of infant mortality in the U.S. P. Johnelle Sparks and Corey S. Sparks 1 Introduction Infant
La santé dans les villes : de l approche géographique aux collaborations entre chercheurs et décideurs
 La santé dans les villes : de l approche géographique aux collaborations entre chercheurs et décideurs Pr. Gérard Salem, Université Paris-Nanterre, ISUH-ICSu Séminaire Maladies Infectieuses Emergentes
Changing risks in a changing climate
 Changing risks in a changing climate Martin Beniston Head, Environmental Science Dept. University of Geneva, Switzerland Martin.Beniston@unige.ch ENSEMBLES Workshop, Venice, 11.12.2008 Outline of the presentation
CALIOPE EU: Air Quality
 CALIOPE EU: Air Quality CALIOPE EU air quality forecast application User Guide caliope@bsc.es Version 30/09/2015 TABLE OF CONTENTS 1. Description... 1 2. Installation... 1 3. User Guide... 2 3.1 Air quality
From Bears to Bikes: Transdisciplinary Spatial Research
 Species 2016-02-16 From Bears to Bikes: Transdisciplinary Spatial Research Dr. Trisalyn Nelson Professor, UVic Geography Lansdowne Research Chair in Spatial Sciences Director of Geomatics Director of SPAR
WEATHER NORMALIZATION METHODS AND ISSUES. Stuart McMenamin Mark Quan David Simons
 WEATHER NORMALIZATION METHODS AND ISSUES Stuart McMenamin Mark Quan David Simons Itron Forecasting Brown Bag September 17, 2013 Please Remember» Phones are Muted: In order to help this session run smoothly,
of the 7 stations. In case the number of daily ozone maxima in a month is less than 15, the corresponding monthly mean was not computed, being treated
 Spatial Trends and Spatial Extremes in South Korean Ozone Seokhoon Yun University of Suwon, Department of Applied Statistics Suwon, Kyonggi-do 445-74 South Korea syun@mail.suwon.ac.kr Richard L. Smith
Mountain View Community Shuttle Monthly Operations Report
 Mountain View Community Shuttle Monthly Operations Report December 6, 2018 Contents Passengers per Day, Table...- 3 - Passengers per Day, Chart...- 3 - Ridership Year-To-Date...- 4 - Average Daily Ridership
Mio Matsueda (University of Oxford) Tetsuo Nakazawa (WMO)
 Tetsuo Nakazawa (WMO)") GIFS-TIGGE WG 10@UKMO (12-14 June, 2013) Early warning products for extreme weather events using operational medium-range ensemble forecasts Mio Matsueda (University of Oxford) Tetsuo Nakazawa (WMO) with
GIFS-TIGGE WG 10@UKMO (12-14 June, 2013) Early warning products for extreme weather events using operational medium-range ensemble forecasts Mio Matsueda (University of Oxford) Tetsuo Nakazawa (WMO) with
Bayesian dynamic modeling for large space-time weather datasets using Gaussian predictive processes
 Bayesian dynamic modeling for large space-time weather datasets using Gaussian predictive processes Sudipto Banerjee 1 and Andrew O. Finley 2 1 Biostatistics, School of Public Health, University of Minnesota,
Regional services and best use for boundary conditions
 Regional services and best use for boundary conditions MACC-III User Workshop Roma, 11 May 2015 Virginie Marécal (Météo-France) Laurence Rouïl (INERIS) and the MACC regional consortium Regional services
Application of Unified Model (UM) weather prediction data for rice disease forecast
 weather prediction data for rice disease forecast") Application of Unified Model (UM) weather prediction data for rice disease forecast Ki Seok Do, Hyo-suk Kim, and Eun Woo Park National Center for Agricultural Meteorology Seoul National University Moon
Application of Unified Model (UM) weather prediction data for rice disease forecast Ki Seok Do, Hyo-suk Kim, and Eun Woo Park National Center for Agricultural Meteorology Seoul National University Moon
Predicting Long-term Exposures for Health Effect Studies
 Predicting Long-term Exposures for Health Effect Studies Lianne Sheppard Adam A. Szpiro, Johan Lindström, Paul D. Sampson and the MESA Air team University of Washington CMAS Special Session, October 13,
REVISION: POPULATION ECOLOGY 01 OCTOBER 2014
 REVISION: POPULATION ECOLOGY 01 OCTOBER 2014 Lesson Description In this lesson we revise: Introduction to Population Ecology What s Happening in the Environment Human Population: Analysis & Predictions
Country Presentation-Nepal
 Country Presentation-Nepal Mt.Everest, Shiva Pd. Nepal, DHM South Asia Drought Monitor Workshop Dhaka Bangladesh 2 th April 215 Overview Brief Climatology Climate activities- DHM PPCR (Pilot Program for
Transmission of Hand, Foot and Mouth Disease and Its Potential Driving
 Transmission of Hand, Foot and Mouth Disease and Its Potential Driving Factors in Hong Kong, 2010-2014 Bingyi Yang 1, Eric H. Y. Lau 1*, Peng Wu 1, Benjamin J. Cowling 1 1 WHO Collaborating Centre for
the university of british columbia department of statistics technical report # 217
 the university of british columbia department of statistics technical report # 217 seasonal confounding and residual correlation in analyses of health effects of air pollution by isabella r ghement nancy
Seamless weather and climate for security planning
 Seamless weather and climate for security planning Kirsty Lewis, Principal Climate Change Consultant, Met Office Hadley Centre 28 June 2010 Global Climate Models Mitigation timescale changes could be avoided
Sea level change around the Philippines
 Sea level Sea level around the Philippines Institute of Environmental Science for Social Change (ESSC) Conference on Internal Migration and Displacement Davao City, Philippines 20 May 2012 Regional How
Satellite data for African applications
 Satellite data for African applications Henk Verschuur, EUMETSAT henk.verschuur@eumetsat.int Introduction Some examples of satellite products which are useful for Africa Satellite products Tropical cyclones
Brent Coull, Petros Koutrakis, Joel Schwartz, Itai Kloog, Antonella Zanobetti, Joseph Antonelli, Ander Wilson, Jeremiah Zhu.
 Harvard ACE Project 2: Air Pollutant Mixtures in Eastern Massachusetts: Spatial Multi-resolution Analysis of Trends, Effects of Modifiable Factors, Climate, and Particle-induced Mortality Brent Coull,
Keeping healthy when it is really hot
 Heatwave Plan for England Keeping healthy when it is really hot Easy Read version of: The Heatwave Plan for England: To protect the health of people from the effects of hot weather What is in this plan
JOINT STRATEGIC NEEDS ASSESSMENT (JSNA) Key findings from the Leicestershire JSNA and Charnwood summary
 Key findings from the Leicestershire JSNA and Charnwood summary") JOINT STRATEGIC NEEDS ASSESSMENT (JSNA) Key findings from the Leicestershire JSNA and Charnwood summary 1 What is a JSNA? Joint Strategic Needs Assessment (JSNA) identifies the big picture in terms of
JOINT STRATEGIC NEEDS ASSESSMENT (JSNA) Key findings from the Leicestershire JSNA and Charnwood summary 1 What is a JSNA? Joint Strategic Needs Assessment (JSNA) identifies the big picture in terms of
The Economics of European Regions: Theory, Empirics, and Policy
 The Economics of European Regions: Theory, Empirics, and Policy Dipartimento di Economia e Management Davide Fiaschi Angela Parenti 1 1 davide.fiaschi@unipi.it, and aparenti@ec.unipi.it. Fiaschi-Parenti
Understanding Weather and Climate Risk. Matthew Perry Sharing an Uncertain World Conference The Geological Society, 13 July 2017
 Understanding Weather and Climate Risk Matthew Perry Sharing an Uncertain World Conference The Geological Society, 13 July 2017 What is risk in a weather and climate context? Hazard: something with the
Climate Change Impact Analysis
 Climate Change Impact Analysis Patrick Breach M.E.Sc Candidate pbreach@uwo.ca Outline July 2, 2014 Global Climate Models (GCMs) Selecting GCMs Downscaling GCM Data KNN-CAD Weather Generator KNN-CADV4 Example
Bayesian dynamic modeling for large space-time weather datasets using Gaussian predictive processes
 Bayesian dynamic modeling for large space-time weather datasets using Gaussian predictive processes Andrew O. Finley Department of Forestry & Department of Geography, Michigan State University, Lansing
Available online Journal of Scientific and Engineering Research, 2018, 5(3): Research Article
: Research Article") Available online www.jsaer.com, 2018, 5(3):166-180 Research Article ISSN: 2394-2630 CODEN(USA): JSERBR Impact of Climate Variability on Human Health- A Case Study at Kanchanpur Union, Basail, Tangail District,
Available online www.jsaer.com, 2018, 5(3):166-180 Research Article ISSN: 2394-2630 CODEN(USA): JSERBR Impact of Climate Variability on Human Health- A Case Study at Kanchanpur Union, Basail, Tangail District,
Predicting Malaria Epidemics in Ethiopia
 Predicting Malaria Epidemics in Ethiopia Eskindir Loha, Hawassa University Torleif Markussen Lunde, UoB 5th Conference on Global Health and Vaccination Research: Environmental Change and Global Health
The Arable Mark: Accuracy and Applications
 The Arable Mark: Accuracy and Applications January 7, 2018 Overview Physical and Biological Observations Precipitation Air temperature, humidity, pressure Shortwave (SW) radiation (down & upwelling) Longwave
Witchampton CofE First School Geography Curriculum Map
 2016-2017 Autumn People and : 30-50 Show interest in the lives of people who are familiar to them. Shows interest in different occupations. Remembers and talks significant events in their own experience.
On Climate Change and Temperature Variance: A Discussion of the paper Perception of Climate Change by Hansen et al. [2012]
![On Climate Change and Temperature Variance: A Discussion of the paper Perception of Climate Change by Hansen et al. [2012]](/thumbs/85/91919236.jpg "On Climate Change and Temperature Variance: A Discussion of the paper Perception of Climate Change by Hansen et al. [2012]") On Climate Change and Temperature Variance: A Discussion of the paper Perception of Climate Change by Hansen et al. [2012] Zeke Hausfather Berkeley Earth Surface Temperature Project In their recent paper
On Climate Change and Temperature Variance: A Discussion of the paper Perception of Climate Change by Hansen et al. [2012] Zeke Hausfather Berkeley Earth Surface Temperature Project In their recent paper
International Journal of Computer Science Trends and Technology (IJCST) Volume 3 Issue 3, May-June 2015
 Volume 3 Issue 3, May-June 2015") RESEARCH ARTICLE OPEN ACCESS Analysis of Meteorological Data in of Tamil Nadu Districts Based On K- Means Clustering Algorithm M. Mayilvaganan [1], P. Vanitha [2] Department of Computer Science [2], PSG
RESEARCH ARTICLE OPEN ACCESS Analysis of Meteorological Data in of Tamil Nadu Districts Based On K- Means Clustering Algorithm M. Mayilvaganan [1], P. Vanitha [2] Department of Computer Science [2], PSG
Assessing Environmental Equity Related to Local Air Pollution in Tampa, FL
 Assessing Environmental Equity Related to Local Air Pollution in Tampa, FL Extended Abstract #466 Amy L. Stuart, Michelle Zeager, and Noreen D. Poor University of South Florida, 13201 Bruce B. Downs Blvd.,
Biometeorological modelling and forecasting of monthly ambulance demand for Hong Kong
 Hong Kong Journal of Emergency Medicine Biometeorological modelling and forecasting of monthly ambulance demand for Hong Kong HT Wong, PC Lai, S Chen Introduction: Given the aging population in Hong Kong
Modeling Spatial Relationships Using Regression Analysis. Lauren M. Scott, PhD Lauren Rosenshein Bennett, MS
 Modeling Spatial Relationships Using Regression Analysis Lauren M. Scott, PhD Lauren Rosenshein Bennett, MS Workshop Overview Answering why? questions Introduce regression analysis - What it is and why
Multi-model approach for projecting future climate change conditions in Central Vietnam
 2011/03/03 at the ICSS-Asia 2011 conference Multi-model approach for projecting future climate change conditions in Central Vietnam Thanh NGO-DUC, Van Tan PHAN, Trung NGUYEN QUANG Department of Meteorology
P -spline ANOVA-type interaction models for spatio-temporal smoothing
 P -spline ANOVA-type interaction models for spatio-temporal smoothing Dae-Jin Lee 1 and María Durbán 1 1 Department of Statistics, Universidad Carlos III de Madrid, SPAIN. e-mail: dae-jin.lee@uc3m.es and
Confronting Climate Change in the Great Lakes Region. Technical Appendix Climate Change Projections EXTREME EVENTS
 Confronting Climate Change in the Great Lakes Region Technical Appendix Climate Change Projections EXTREME EVENTS Human health and well-being, as well as energy requirements, building standards, agriculture
Implementation Status & Results Brazil Integrated Health and Water Management Project (SWAP) (P095171)
 (P095171)") Public Disclosure Authorized Public Disclosure Authorized The World Bank Implementation Status & Results Brazil Integrated Health and Water Management Project (SWAP) (P095171) Operation Name: Integrated
Public Disclosure Authorized Public Disclosure Authorized The World Bank Implementation Status & Results Brazil Integrated Health and Water Management Project (SWAP) (P095171) Operation Name: Integrated
CLIMATE VARIABILITY AND DISEASE PATTERNS IN TWO SOUTH EASTERN CARIBBEAN COUNTRIES. Dharmaratne Amarakoon, Roxann Stennett and Anthony Chen
 1 CLIMATE VARIABILITY AND DISEASE PATTERNS IN TWO SOUTH EASTERN CARIBBEAN COUNTRIES Dharmaratne Amarakoon, Roxann Stennett and Anthony Chen Climate Studies Group Mona, Department of Physics, University
STAFF REPORT ACTION REQUIRED. Extreme Cold Weather Alerts in Toronto SUMMARY. Date: April 13, Board of Health. To: Medical Officer of Health
 HL3.6 STAFF REPORT ACTION REQUIRED Extreme Cold Weather Alerts in Toronto Date: April 13, 2015 To: From: Wards: Board of Health Medical Officer of Health All Reference Number: SUMMARY Cold weather can
Buenos días. Perdón - Hablo un poco de español!
 Buenos días Perdón - Hablo un poco de español! Introduction to different downscaling tools Rob Wilby Climate Change Science Manager rob.wilby@environment-agency.gov.uk Source: http://culter.colorado.edu/nwt/site_info/site_info.html
THE IMPACTS OF TEMPERATURE AND THE URBAN HEAT ISLAND ON MORTALITY IN THE WEST MIDLANDS AND GREATER LONDON
 THE IMPACTS OF TEMPERATURE AND THE URBAN HEAT ISLAND ON MORTALITY IN THE WEST MIDLANDS AND GREATER LONDON by FANG ZHANG A thesis submitted to the University of Birmingham for the degree of DOCTOR OF PHILOSOPHY
Ultra-High Resolution Time Traveling AgMet Information from Seeding to Harvesting
 Ultra-High Resolution Time Traveling AgMet Information from Seeding to Harvesting - seamless data for prospect estimation of crop yields - Dec. 5, 2016 Jai-ho Oh & Kyung-Min Choi Dept. Env. & Atmos. Sci.,
Responsibilities of Harvard Atmospheric Chemistry Modeling Group
 Responsibilities of Harvard Atmospheric Chemistry Modeling Group Loretta Mickley, Lu Shen, Daniel Jacob, and Rachel Silvern 2.1 Objective 1: Compile comprehensive air pollution, weather, emissions, and
4.3.3 Extreme Temperature
 4.3.3 Extreme Temperature This section provides a profile and vulnerability assessment for the extreme temperature hazard, including extreme heat and extreme cold. Extreme heat can be described as temperatures
PREDICTING OVERHEATING RISK IN HOMES
 PREDICTING OVERHEATING RISK IN HOMES Susie Diamond Inkling Anastasia Mylona CIBSE Simulation for Health and Wellbeing 27th June 2016 - CIBSE About Inkling Building Physics Consultancy Susie Diamond Claire
Study of Changes in Climate Parameters at Regional Level: Indian Scenarios
 Study of Changes in Climate Parameters at Regional Level: Indian Scenarios S K Dash Centre for Atmospheric Sciences Indian Institute of Technology Delhi Climate Change and Animal Populations - The golden
The Impacts of Wildfire Smoke and the Western Canada BlueSky Wildfire Smoke Forecasting System
 The Impacts of Wildfire Smoke and the Western Canada BlueSky Wildfire Smoke Forecasting System Wildland Fire Canada Conference October 2012 Steve Sakiyama, British Columbia Ministry of Environment Steve.Sakiyama@gov.bc.ca
Seasonal Climate Watch June to October 2018
 Seasonal Climate Watch June to October 2018 Date issued: May 28, 2018 1. Overview The El Niño-Southern Oscillation (ENSO) has now moved into the neutral phase and is expected to rise towards an El Niño
List of Supplemental Figures
 Online Supplement for: Weather-Related Mortality: How Heat, Cold, and Heat Waves Affect Mortality in the United States, GB Anderson and ML Bell, Epidemiology List of Supplemental Figures efigure 1. Distribution
A Report on a Statistical Model to Forecast Seasonal Inflows to Cowichan Lake
 A Report on a Statistical Model to Forecast Seasonal Inflows to Cowichan Lake Prepared by: Allan Chapman, MSc, PGeo Hydrologist, Chapman Geoscience Ltd., and Former Head, BC River Forecast Centre Victoria
Hadley Centre for Climate Prediction and Research, Met Office, FitzRoy Road, Exeter, EX1 3PB, UK.
 Temperature Extremes, the Past and the Future. S Brown, P Stott, and R Clark Hadley Centre for Climate Prediction and Research, Met Office, FitzRoy Road, Exeter, EX1 3PB, UK. Tel: +44 (0)1392 886471 Fax