Brahmatwinn Twinning European and South Asian River Basins to enhance capacity and implement adaptive management approaches
|
|
|
- Victor Cooper
- 6 years ago
- Views:
Transcription


1 Brahmatwinn Twinning European and South Asian River Basins to enhance capacity and implement adaptive management approaches WP 3 Assessment of the Natural Environment Stefan Lang, Z_GIS (Centre for Geoinformatics, U Salzburg) BRAHMATWINN 2 nd Annual Meeting in Munich, Oct 20-22, th EU Framework Programme Priority: Global Change and Ecosystems Contract: No Launch:
2 WP 3 Assessment of the NE Objectives to assess, classify and quantify the components of the natural environment (NE) including topography, climate, hydrology, snow and glacier cover, permafrost and slope stability, land use and land cover, soils and geology, sediments and erosion, (ground-)water quality, eco-hydrology and biodiversity


3 WP 3 Rationale Terrain classification Land use / land cover Glacier change and permafrost distribution Hydrology, wetlands, groundwater HRUs RBIS documentation
4 WP 3 Work Tasks & Deliverables [lead contractor] (month of completion) WT_3.1 / Dl_3.1 SRTM-based terrain classification according to IPPC recommendations and digital terrain models (DTM) for the UDRB and UBRB [FSU] (14) WT_3.2 / Dl_3.2 Analysis of historical glacier and snow distribution with change detection analyses [UniOs] (14) WT_3.3 / Dl_3.3 Terrain based permafrost distribution and vulnerability analyses of slope stability [ITP] (14) WT_3.4 / Dl_3.4 IPCC based classification of land use and land cover (LULC) with change detection analysis [Z_GIS] (14) WT_3.5 / Dl_3.5 Assessments of wetlands, their functions and groundwater recharge [UniVie] (18) WT_3.6 / Dl_3.6 Hydrological systems analysis and delineation of Hydrological Response Units [FSU] (18) WT_3.7 / Dl_3.7 Documented results for reporting and RBIS population [Z_GIS] (18)
5 Achievements Overview The components of the Natural Environment (NE) in the Upper Brahmaputra and Upper Danube River Basins as well as those of 5 reference catchments have been established in spatial layers. These comprise: Digital surface models at 1 km resolution for the basins and 90 m for the reference catchments. Terrain parameters (e.g. aspect, slope, profile curvature, solar radiation index) are available for all areas. Historical glacier and snow distribution are compiled for the headwater regions of the two basins and the decadal changes up to 2006 been assessed. Terrain based permafrost distribution was modelled and validated by station records and/or presence of rock glaciers. Harmonised land use and land cover data are available for all areas. Fine-scaled classifications have been carried out for specific assessments of wetlands as well as change detection studies conducted to evaluate the impact of bank erosion in Assam. Wetlands, their location and functions in respect to ecosystem services, have been assessed for all areas. Groundwater availability has been compiled for Assam. Hydrological response units (HRU) have been established from the above data layers to reflect the hydrological dynamics of the basins. The River Basin Information System has been populated with these spatial data layers.
6 WT / DL 3-1 Terrain Classification Achievements for UBRB and UDRB DSMs at 1 km resolution for the basins and 90 m for the reference catchments Terrain parameters (e.g. aspect, slope, profile curvature, solar radiation index) for all areas Remaining challenges Task completed, but ever improvable (SRTM 4...)
7 WT / DL 3-1 Terrain Classification for UBRB and UDRB Significance of task: Terrain and surface information (i.e. Morphology) is a key layer for hydrological analysis Work performed DSM derived from Shuttle-Radar Topography Mission (SRTM), resolution of 90 x 90 m Voids filled by ASTER data derived DEM For the river basin level DSMs were re-sampled from a 90m to 1kmraster, and clipped to the basins boundaries. In the reference catchments, 90m DSMs served to represent were used For providing adequate data for modeling, sinks in the DSM were filled where required DSM classified according to morphometric and hydrological criteria required to delineate HRUs as well as to model parameters such as permafrost distribution and slope instability (see subsequent WTs)
 UBRB UDRB")
8 WT / DL 3-1 Terrain Classification for UBRB and UDRB DSM (1 x 1 km) UBRB UDRB


9 WT / DL 3-1 Terrain Classification for UBRB and UDRB DSM (90 x 90 m) Wang Chu Lhasa river Assam AOI Salzach Lech
10 WT / DL 3-1 Terrain Classification for UBRB and UDRB Slope Profile curvature Aspect Morphometric derivatives Solar radiation index
11 WT / DL 3-2 Historical Glacier and Achievements Snow Distribution Historical glacier and snow distribution are compiled for the headwater regions of the two basins Decadal changes up to 2006 were assessed Remaining challenges (3-2 and 3-3) Proposal of WP3 work extension from UniOs Not finished glacier and permafrost scenarios, because climate scenarios from WP2 still missing (available soon), slope vulnerability will be analysed using glacier and permafrost change data estimated for the climate scenarios as soon as they are available Not finished repeated glacier lake mapping (so far done on Landsat imagery). Corona data available since spring Aims to include in the overall UBRB results finding from a diploma thesis from FSU (co-supervised by UniOs) Satellite scene from Thailand not arrived, though ordered in spring. Alternatives looked at.
12 WT / DL 3-2 Historical Glacier and Snow Distribution Significance of task: Run-off characteristics in glacierized river basins significantly depend on glacier distribution, glacier area and mass changes Work performed Using optical remote sensing data, starting from the 1970s (mainly Landsat, supplemented by ASTER), to classify the historical spatial distribution of glaciers together with their mass loss dynamics. Existing glacier inventories and the digital elevation model (DEM) were used validated by station time series provided by local partners. glacier change detection was carried out by means of GIS analysis to classify the spatial distribution of glacier retreat Glacier inventories of the year 2000 have been compiled for three test regions of the UBRB and checked against the Chinese Glacier Inventory from the 1960s. Manual control and selection of all glaciers for the comparison of 1960s-2000 has been carried out. Derivation of area changes and description of glacier characteristics for the UBRB are available. For the UDRB test area glacier change detection has been analysed especially for the Salzach catchment test site. Change detection for the years 1969 and 1998 based on existing glacier inventories
13 WT / DL 3-2 Historical Glacier and Snow Distribution Significance of task: Run-off characteristics in glacierized river basins significantly depend on glacier distribution, glacier area and mass changes Work performed cont. Glacier mass changes obtained from monitoring stations and published research are used together with the digital elevation model to estimate the glacier run-off contribution for the discharge flow component analyses to be carried out in WP_7. Glacier volume changes have been modelled based on above glacier area changes for the UBRB. Comparison to existing glacier mass balance measurements in the Tien Shan was conducted Snow cover change detection has been analysed for the UBRB and UDRB based on MODIS satellite data (Moderate Resolution Imaging Spectro-Radiometer on the Terra Platform Satellite scenes identified for for the months April and October. Three models: Difference between successive years, difference to mean, and percentage mean. Static and animated results available Snow and glacier water content obtained from monitoring stations and published research is applied together with the DEM to estimate melt volumina delivered to the discharge flow component analyses to carried out in WP_7

14 WT / DL 3-2 Historical Glacier and Snow Distribution Glacier change in the NW Himalayas Example for changes 1960s (Chinese Glacier Inventory CGI) (Landsat); Green lines: CGI, yellow: interpretation from satellite imagery. Lower left: % glacier change in different glacier size classes. Right: Numbers of glaciers in these size classes

15 WT / DL 3-2 Historical Glacier and Snow Distribution Decadal glacier area changes in the UBRB
 using MODIS/Terra Snow Cover 8-Day L3 Global 0.")
16 WT / DL 3-2 Historical Glacier and Snow Distribution Snow Cover Range April in the UBRB resolution: 5km * 5km) using MODIS/Terra Snow Cover 8-Day L3 Global 0.05Deg CMG, Version 4
17 WT / DL 3-3 Permafrost Distribution Achievements and Slope (In-)Stability Terrain based permafrost distribution was modelled and validated by station records and/or presence of rock glaciers (UBRB) Remaining challenges (see 3.2)
18 WT / DL 3-3 Permafrost Distribution and Slope (In-)Stability Significance of task: Changes in mountain permafrost distribution, i.e. the loss of perennial ground ice, can be an important driver for changes in slope stability and sediment fluxes Work performed By means of models developed by the UniOs for the Alps the permafrost distribution is calculated and validated using ground based station measurements The meteorological station data were necessary to calibrate the permafrost models The permafrost distribution was modelled for the UBRB/UDRB and validated using a second, physical-based, permafrost model and a rock-glacier inventory in a test site. By downscaled temperature simulations obtained from Dl_2 likely permafrost retreat was modelled and areas vulnerable to slope instabilities were delineated Using an existing inventory for a test region in Bhutan, rock-glaciers are found at the lower boundary of modelled permafrost distribution Lowland-permafrost distribution is estimated by models developed in Tibet. As a rule-of-thumb for mountain permafrost (PF) in the UBRB one can assume for south-slopes: PF above 5400 m asl., north-slopes: PF above m asl

19 WT / DL 3-3 Permafrost Distribution and Slope (In-)Stability Estimate of permafrost distribution in the Lhasa River catchment
 120 100 80 y = -0.0481x + 105.87 R 2 = 0.")
20 WT / DL 3-3 Permafrost Distribution and Slope (In-)Stability Estimation of potential permafrost areas Upper Salzach Catchment based on mean annual air temperature measurements over Salzburg Regression analysis of annual air temperature means of Salzburg ( ) y = x R 2 = temperature [1/10 C] altitude [m]

21 WT / DL 3-3 Permafrost Distribution and Slope (In-)Stability
22 WT / DL 3-4 Land Use / Land Cover Achievements Classification & Changes Harmonised land use and land cover data are available for all areas. Fine-scaled classifications have been carried out for specific assessments of wetlands Change detection studies conducted to evaluate the impact of bank erosion in Assam, and Lhasa river catchment Remaining challenges Full coverage change analysis not available for all test sites
23 WT / DL 3-4 Land Use / Land Cover Classification & Changes Significance of task: Land use and land cover reflect as an integrated indicators on current (biophysical and socio-economic) response to climatic conditions. are one of the critical geospatial information layers to be used in HRU delineation. Work performed For compatibility reasons the classification was carried out according to the IPCC (2003) guideline which uses six land use and cover classes A harmonized classification scheme was developed by an LULC working group established in month 6 of the project comprising key experts for imagery classification from the consortium. The classification scheme is adaptive and hierarchical, where different levels are defined by the underlying data type, the availability of external knowledge and ground truthing. Level 1 and level 2 comprise 8 main classes and 22 subclasses. To be derived from satellite imagery and additional, auxiliary data (like DSM derivatives). Level 3 and level 4 require additional external knowledge, either form experts or from field surveys. Level 3 contains structurally defined sub-classes (e.g. dense vs. sparse forest), whereas level 4 reflects specific land use types (e.g. irrigated vs. inundated). Level 5, finally, the species level requires very high spatial resolution data and field verifications
24 WT / DL 3-4 Land Use / Land Cover Classification & Changes Significance of task: Land use and land cover reflect as an integrated indicators on current (biophysical and socio-economic) response to climatic conditions. are one of the critical geospatial information layers to be used in HRU delineation. Work performed cont. Classifications in the UBRB catchment (especially those areas heavily influenced by shadow effects, mainly occurring in the Wang Chu catchment and the Lhasa catchment) have been improved by ground-truthing missions carried out by ICIMOD in Oct/Nov Verification has been based on a collection of 285 GPS measured ground reference points in Lhasa and 112 reference points in Bhutan, respectively Change analysis was performed in areas along the Brahmaputra in Guwahati floodplain, Assam (focus: bank erosion) and Lhasa catchment (focus: change in arable land) based on a comparison between the Landsat ETM mosaic of 2000 and the Landsat TM mosaic of 1990

25 WT / DL 3-4 Land Use / Land Cover Classification & Changes Hierarchical BRAHMATWINN LULC Scheme

26 WT / DL 3-4 Land Use / Land Cover Classification & Changes


27 WT / DL 3-4 Land Use / Land Cover Classification & Changes Open water, ice and snow decision tree for classification

28 WT / DL 3-4 Land Use / Land Cover Classification & Changes Urban settlements were delineated using image a thematic layer using Definiens software
29 WT / DL 3-4 Land Use / Land Cover Classification & Changes
30 WT / DL 3-4 Land Use / Land Cover Classification & Changes LULC classifications Salzach Landsat-TM datasets with complete coverage available from the year 2000 (+/- 1 year)


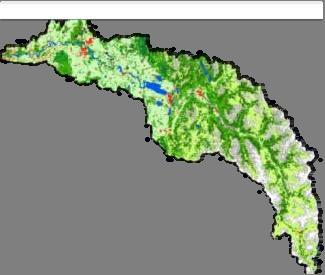

31 WT / DL 3-4 Land Use / Land Cover Classification & Changes LULC classifications Wang Chu Assam AOI Lhasa river Lech
 and 2000 (right) Assam_1990 Assam_2000 Area")
 arable land arable land 19.165,33 24.704,58 13.")

32 WT / DL 3-4 Land Use / Land Cover Classification & Changes Change Analyses Assam LOI: Course of Brahmaputra 1999 (left) and 2000 (right) Assam_1990 Assam_2000 Area 1990 (in km 2 ) Area 2000 (in km 2 ) Overlappi ng Areas (in km 2 ) Agreeemen t (in %) arable land arable land , , ,84 71,7 rock and debris/soil rock and debris/soil 2.253, , ,29 54,1 water courses water courses 2.885, ,73 591,09 20,5 forest Deciduous/ coniferous , , ,68 70,5


33 WT / DL 3-4 Land Use / Land Cover Classification & Changes Change Analyses 1990 Alpine Grassland Arable Land Bare Ground Bushland/Shrubland Built Up Area Forest Grassland Ice, Snow, Open Water Shadow, Clouds Wetlands 2000 Lhasa river: Change between 1990 and 2000


34 WT / DL 3-4 Land Use / Land Cover Classification & Changes Change Analyses Lhasa river between 1990 and 2000 Background Alpine Grassland to Grassland Bushland, Shrubland to Alpine Grassland Bushland, Shrubland to Shadow Grassland to Alpine Grassland Grassland to Bushland, Shrubland Ice, Snow, Open Water to Alpine Grassland Ice, Snow, Open Water to Bare Ground
35 WT / DL 3-5 Assessments of Wetlands, Achievements Groundwater Recharge Wetlands, their location and functions in respect to ecosystem services, have been assessed for all areas. Groundwater availability has been compiled for Assam. Remaining challenges The assessment of groundwater resources needs still to be carried out for 4 of the reference catchments.
36 WT / DL 3-5 Assessments of Wetlands, Groundwater Recharge Significance of task: Both twinning basins have extensive wetlands areas in the alpine mountain headwaters as well as in flood plains along its course. Most of them are unique in their biodiversity and at the same time strongly dependant on the hydrological dynamics of the river system. Climate change will influence the ecosystem services of these wetlands and eco-hydrological strategies can help to develop measures which allow rehabilitation and protection of these landscape features. Work performed Wetlands functions in terms of flood retention, purification of flood water (sinks for sediments and nutrients, etc.) and groundwater recharge have been assessed. The spatial extent of the river-scape was delineated by wetland-polygons from pre-existing data and wetlands-, water bodies-, and water course-polygons extracted from the LULC-classification The Assam part of the Brahmaputra catchment is characterized by three terrestrial eco-regions within the Tropical and Subtropical Moist Broadleaf Forests biome, of which the Brahmaputra Valley semi evergreen forest eco-region has the highest proportion within the river corridor. The river-scape in the Assam river valley provides low Ecosystem Services in contrast to the slopes and hills, due to the fact that lower elevations showed higher proportions of arable land and build up areas. These LULC-classes are the main driving forces for pollution. Natural environment and ecosystem services information are relevant for the further processing by the social science groups, providing indicators to be linked with socio-economic models
37 WT / DL 3-5 Assessments of Wetlands, Groundwater Recharge Significance of task: Groundwater resources have been assessed in regard to availablity, recharge and use. In order to study groundwater availability, one has to consider the different sources of recharge. Work performed cont. For Assam, the river Brahmaputra and its tributaries are the main source of ground water recharge, as the flood plains in the vicinity of the rivers act as repositories for groundwater. To meet the additional demand during non-monsoon periods, groundwater can be withdrawn from the flood plains. (The exploited aquifer zones would then be recharged during the subsequent monsoon period through flood water. ) Aquifers near the surface are subject to annual recharge from precipitation, but the rate of recharge is affected by human interference. Deep aquifers, on the other hand, occur below layers of sedimentary rocks or in fault zones of the crystaline basement away from surface polution sources but are only recharged over long periods According to government sources in Assam, the annual groundwater draft in the State corresponds to 5.44 billion cubic metres, from which 89% are used for irrigation and remainder for domestic and industrial consumption

38 WT / DL 3-5 Assessments of Wetlands, Groundwater Recharge Ecoregions Eco-regions describe similar ecosystem-complexes within its biomes; black boundaries mark the reference catchments within the UBRB


39 WT / DL 3-5 Assessments of Wetlands, Groundwater Recharge Wetland classes
: example of an ecosystem with good self-regulation potential (high index values); grassland corresponds approx.")
40 WT / DL 3-5 Assessments of Wetlands, Groundwater Recharge Forcing Index SUM: overall index for the river-scape; Components: index for each component. Kaziranga National Park. (right): example of an ecosystem with good self-regulation potential (high index values); grassland corresponds approx. to the boundary of the national park.

41 WT / DL 3-5 Assessments of Wetlands, Groundwater Recharge
; please note that large symbols indicate low")
42 WT / DL 3-5 Assessments of Wetlands, Groundwater Recharge Groundwater availability in Assam Figures are given per district in km³/yr (source CGWB, Assam); please note that large symbols indicate low availability.
43 WT / DL 3-5 Assessments of Wetlands, Groundwater Recharge
44 WT / DL 3-6 Hydrological Systems Achievements Analysis and HRUs Hydrological response units (HRU) have been established from the above data layers to reflect the hydrological dynamics of the basins Remaining challenges No specific challenges identified.
45 WT / DL 3-6 Hydrological Systems Analysis and HRUs Significance of task: The hydrological system description is carried out by statistical analysis of the climate and runoff regime in the river basins. It ultimately yields quantified physical system status parameters controlling the hydrological dynamics of the basins. Work performed Hydrological Response Units (HRU) were delineated at 1 km resolution for the UDRB and the UBRB and enhanced HRUs (90 m resolution) for all test catchments. This was done using a knowledge based reclassification, overlay and elimination approach. Based on the quantified analyses of the hydrological dynamics and the quality of the GIS input data the criteria catalogue of the HRU regionalisation concept has been adapted to a cognition network for the UDRB and the UBRB.

46 WT / DL 3-6 Hydrological Systems Analysis and HRUs Hydrological Response Units for the Wang Chu


47 WT / DL 3-6 Hydrological Systems Analysis and HRUs Delineation of HRUs for gauged sub-basins
48 WT / DL 3-7 RBIS Population Achievements Data layers and accompanying meta-data were prepared for integration into the River Basin Information System (RBIS). Analysis reports and special references are published on the BrahmaWiki Remaining challenges Verify list of required data sets on RBIS (Excel table).
 Lead Partner P_4 (ZGIS) and P_14 (ITP) Partner No. involved 1 2 3 4 5 8 12 13 14 15 16 18 19 20 Person-months (PM) spent Person-month (PM) budgeted 6.")
49 WT / DL 3-7 WP Status Report to be compiled based on 2 nd annual WP report UniOs would like to extend work Which indicators to pass over to WP 6? How integrative are HRUs? (especially terrain + LULC) Lead Partner P_4 (ZGIS) and P_14 (ITP) Partner No. involved Person-months (PM) spent Person-month (PM) budgeted (9) 4 (6) (4) 10 (12) P_1 FSU, P_2 LMU, P_3 ETH, P_4 Z_GIS, P_5 UniVie, P_8 UniOs, P_12 ICIMOD, P_13 UniBu, P14 ITP, P_15 CARR, P_16 GDS, P_18 Vodni, P_19 JWG, P_20 IITR
GOCE Project acronym: Dl_3. Natural. the. December December Month. Actual submission
 Project no: Project acronym: Instrument: Thematic Priority: GOCE 036952 BRAHMATWINN Specific Targeted Research Project Global Change and Ecosystems Project title: Twinning European and South Asian River
Biodiversität und Fernerkundung im Skalierungskontext des BrahmaTWinn-Projektes
 Biodiversität und Fernerkundung im Skalierungskontext des BrahmaTWinn-Projektes Norbert Exler - Iris Wagner - Georg Janauer 6th EU Framework Programme Priority: Global Change and Ecosystems Contract: No.
Data. Advances in Science & Research. Science
 Open Sciences doi:10.5194/asr-7-21-2011 Author(s) 2011. CC Attribution 3.0 License. Advances in Science & Research Open Access Proceedings Drinking Water Assessing components of the natural environment
Hydrologic Modelling of the Upper Malaprabha Catchment using ArcView SWAT
 Hydrologic Modelling of the Upper Malaprabha Catchment using ArcView SWAT Technical briefs are short summaries of the models used in the project aimed at nontechnical readers. The aim of the PES India
AGOG 485/585 /APLN 533 Spring Lecture 5: MODIS land cover product (MCD12Q1). Additional sources of MODIS data
. Additional sources of MODIS data") AGOG 485/585 /APLN 533 Spring 2019 Lecture 5: MODIS land cover product (MCD12Q1). Additional sources of MODIS data Outline Current status of land cover products Overview of the MCD12Q1 algorithm Mapping
AGOG 485/585 /APLN 533 Spring 2019 Lecture 5: MODIS land cover product (MCD12Q1). Additional sources of MODIS data Outline Current status of land cover products Overview of the MCD12Q1 algorithm Mapping
Watershed concepts for community environmental planning
 Purpose and Objectives Watershed concepts for community environmental planning Dale Bruns, Wilkes University USDA Rural GIS Consortium May 2007 Provide background on basic concepts in watershed, stream,
Modelling snow accumulation and snow melt in a continuous hydrological model for real-time flood forecasting
 IOP Conference Series: Earth and Environmental Science Modelling snow accumulation and snow melt in a continuous hydrological model for real-time flood forecasting To cite this article: Ph Stanzel et al
Modelling runoff from large glacierized basins in the Karakoram Himalaya using remote sensing of the transient snowline
 Remote Sensing and Hydrology 2000 (Proceedings of a symposium held at Santa Fe, New Mexico, USA, April 2000). IAHS Publ. no. 267, 2001. 99 Modelling runoff from large glacierized basins in the Karakoram
Liliana Pagliero June, 15 th 2011
 Liliana Pagliero liliana.pagliero@jrc.ec.europa.eu June, 15 th 2011 2/18 SWAT MODELLING AT PAN EUROPEAN SCALE: THE DANUBE BASIN PILOT STUDY Introduction The Danube Model Available databases Model set up
MODULE 8 LECTURE NOTES 2 REMOTE SENSING APPLICATIONS IN RAINFALL-RUNOFF MODELLING
 MODULE 8 LECTURE NOTES 2 REMOTE SENSING APPLICATIONS IN RAINFALL-RUNOFF MODELLING 1. Introduction The most common application of the remote sensing techniques in the rainfall-runoff studies is the estimation
GOVERNMENT OF NEPAL MINISTRY OF IRRIGATION GROUND WATER RESOURCES DEVELOPMENT BOARD BABARMAHAL, KATHMANDU, NEPAL
 GOVERNMENT OF NEPAL MINISTRY OF IRRIGATION GROUND WATER RESOURCES DEVELOPMENT BOARD BABARMAHAL, KATHMANDU, NEPAL GIS Based Updating of Groundwater Level Siraha District Final Report Submitted to Ground
ESTIMATING SNOWMELT CONTRIBUTION FROM THE GANGOTRI GLACIER CATCHMENT INTO THE BHAGIRATHI RIVER, INDIA ABSTRACT INTRODUCTION
 ESTIMATING SNOWMELT CONTRIBUTION FROM THE GANGOTRI GLACIER CATCHMENT INTO THE BHAGIRATHI RIVER, INDIA Rodney M. Chai 1, Leigh A. Stearns 2, C. J. van der Veen 1 ABSTRACT The Bhagirathi River emerges from
Data challenges in Trans-boundary River Basins: Case Study of the Upper Indus Basin
 Data challenges in Trans-boundary River Basins: Case Study of the Upper Indus Basin Asif Khan Lead Author (Water chapter- AR6 IPCC) Post Doctorate (Water-Energy-Food-Climate Change, IIASA, Austria) PhD
GLOBWETLAND AFRICA TOOLBOX
 The GlobWetland Africa Toolbox is an open source and free-of-charge software toolbox for inventorying, mapping, monitoring and assessing wetlands. The toolbox comes with end-to-end processing workflows
GROUNDWATER CONFIGURATION IN THE UPPER CATCHMENT OF MEGHADRIGEDDA RESERVOIR, VISAKHAPATNAM DISTRICT, ANDHRA PRADESH
 GROUNDWATER CONFIGURATION IN THE UPPER CATCHMENT OF MEGHADRIGEDDA RESERVOIR, VISAKHAPATNAM DISTRICT, ANDHRA PRADESH Prof.P.Jagadeesara Rao Department of Geo-Engineering and Centre for Remote Sensing, College
Module 2.1 Monitoring activity data for forests using remote sensing
 Module 2.1 Monitoring activity data for forests using remote sensing Module developers: Frédéric Achard, European Commission (EC) Joint Research Centre (JRC) Jukka Miettinen, EC JRC Brice Mora, Wageningen
Floodplain modeling. Ovidius University of Constanta (P4) Romania & Technological Educational Institute of Serres, Greece
 Romania & Technological Educational Institute of Serres, Greece") Floodplain modeling Ovidius University of Constanta (P4) Romania & Technological Educational Institute of Serres, Greece Scientific Staff: Dr Carmen Maftei, Professor, Civil Engineering Dept. Dr Konstantinos
Floodplain modeling Ovidius University of Constanta (P4) Romania & Technological Educational Institute of Serres, Greece Scientific Staff: Dr Carmen Maftei, Professor, Civil Engineering Dept. Dr Konstantinos
Geo-spatial Analysis for Prediction of River Floods
 Geo-spatial Analysis for Prediction of River Floods Abstract. Due to the serious climate change, severe weather conditions constantly change the environment s phenomena. Floods turned out to be one of
DEVELOPMENT OF A RIVER BASIN INFORMATION SYSTEM FOR A SUSTAINABLE
 DEVELOPMENT OF A RIVER BASIN INFORMATION SYSTEM FOR A SUSTAINABLE DEVELOPMENT IN THE UPPER BRAHMAPUTRA RIVER BASIN BRAHMATWINN - Twinning European and South Asian River Basins to enhance capacity and implement
Statewide wetland geospatial inventory update
 Statewide wetland geospatial inventory update Factsheet 1: Outcomes from the statewide wetland geospatial inventory update 1 Introduction In 2011 the Victorian Department of Environment and Primary Industries
Dynamic Land Cover Dataset Product Description
 Dynamic Land Cover Dataset Product Description V1.0 27 May 2014 D2014-40362 Unclassified Table of Contents Document History... 3 A Summary Description... 4 Sheet A.1 Definition and Usage... 4 Sheet A.2
SPATIAL AND TEMPORAL MODELLING OF ECOSYSTEM SERVICES
 SPATIAL AND TEMPORAL MODELLING OF ECOSYSTEM SERVICES Solen Le Clec h, T.Decaëns, S. Dufour, M. Grimaldi, N. Jégou and J. Oszwald ACES Conference 2016 Jacksonville, Florida (USA). December, 5-9th : issues
Flood Forecasting Tools for Ungauged Streams in Alberta: Status and Lessons from the Flood of 2013
 Flood Forecasting Tools for Ungauged Streams in Alberta: Status and Lessons from the Flood of 2013 John Pomeroy, Xing Fang, Kevin Shook, Tom Brown Centre for Hydrology, University of Saskatchewan, Saskatoon
Using MODIS imagery to validate the spatial representation of snow cover extent obtained from SWAT in a data-scarce Chilean Andean watershed
 Using MODIS imagery to validate the spatial representation of snow cover extent obtained from SWAT in a data-scarce Chilean Andean watershed Alejandra Stehr 1, Oscar Link 2, Mauricio Aguayo 1 1 Centro
CLICK HERE TO KNOW MORE
 CLICK HERE TO KNOW MORE Geoinformatics Applications in Land Resources Management G.P. Obi Reddy National Bureau of Soil Survey & Land Use Planning Indian Council of Agricultural Research Amravati Road,
Land Accounts - The Canadian Experience
 Land Accounts - The Canadian Experience Development of a Geospatial database to measure the effect of human activity on the environment Who is doing Land Accounts Statistics Canada (national) Component
Drought Monitoring with Hydrological Modelling
 st Joint EARS/JRC International Drought Workshop, Ljubljana,.-5. September 009 Drought Monitoring with Hydrological Modelling Stefan Niemeyer IES - Institute for Environment and Sustainability Ispra -
GEOSPATIAL ANALYSIS OF GLACIAL DYNAMICS OF SHIGAR AND SHAYOK BASINS. Syed Naseem Abbas Gilany 1
 GEOSPATIAL ANALYSIS OF GLACIAL DYNAMICS OF SHIGAR AND SHAYOK BASINS 1 OUTLINE Introduction Problem Statement / Rationale Objectives Material and Methods Study Area Datasets Required Data Analysis / Assessment
VISUALIZATION URBAN SPATIAL GROWTH OF DESERT CITIES FROM SATELLITE IMAGERY: A PRELIMINARY STUDY
 CO-439 VISUALIZATION URBAN SPATIAL GROWTH OF DESERT CITIES FROM SATELLITE IMAGERY: A PRELIMINARY STUDY YANG X. Florida State University, TALLAHASSEE, FLORIDA, UNITED STATES ABSTRACT Desert cities, particularly
VILLAGE INFORMATION SYSTEM (V.I.S) FOR WATERSHED MANAGEMENT IN THE NORTH AHMADNAGAR DISTRICT, MAHARASHTRA
 FOR WATERSHED MANAGEMENT IN THE NORTH AHMADNAGAR DISTRICT, MAHARASHTRA") VILLAGE INFORMATION SYSTEM (V.I.S) FOR WATERSHED MANAGEMENT IN THE NORTH AHMADNAGAR DISTRICT, MAHARASHTRA Abstract: The drought prone zone in the Western Maharashtra is not in position to achieve the agricultural
VILLAGE INFORMATION SYSTEM (V.I.S) FOR WATERSHED MANAGEMENT IN THE NORTH AHMADNAGAR DISTRICT, MAHARASHTRA Abstract: The drought prone zone in the Western Maharashtra is not in position to achieve the agricultural
Delineation of Groundwater Potential Zone on Brantas Groundwater Basin
 Delineation of Groundwater Potential Zone on Brantas Groundwater Basin Andi Rachman Putra 1, Ali Masduqi 2 1,2 Departement of Environmental Engineering, Sepuluh Nopember Institute of Technology, Indonesia
EVALUATION AND MONITORING OF SNOWCOVER WATER RESOURCES IN CARPATHIAN BASINS USING GEOGRAPHIC INFORMATION AND SATELLITE DATA
 EVALUATION AND MONITORING OF SNOWCOVER WATER RESOURCES IN CARPATHIAN BASINS USING GEOGRAPHIC INFORMATION AND SATELLITE DATA Gheorghe Stancalie, Simona Catana, Anisoara Iordache National Institute of Meteorology
National Atlas of Groundwater Dependent Ecosystems (GDE)
") National Atlas of Groundwater Dependent Ecosystems (GDE) Dr. Zaffar Sadiq Mohamed-Ghouse Executive Consultant & Practice Head-Spatial SKM, Australia zsadiq@globalskm.com Geospatial World Forum 2013, Rotterdam,
National Atlas of Groundwater Dependent Ecosystems (GDE) Dr. Zaffar Sadiq Mohamed-Ghouse Executive Consultant & Practice Head-Spatial SKM, Australia zsadiq@globalskm.com Geospatial World Forum 2013, Rotterdam,
GEOMATICS. Shaping our world. A company of
 GEOMATICS Shaping our world A company of OUR EXPERTISE Geomatics Geomatics plays a mayor role in hydropower, land and water resources, urban development, transport & mobility, renewable energy, and infrastructure
Accounting Units for Ecosystem Accounts Paper prepared by Alessandra Alfieri, Daniel Clarke, and Ivo Havinga United Nations Statistics Division
 DEPARTMENT OF ECONOMIC AND SOCIAL AFFAIRS STATISTICS DIVISION UNITED NATIONS Expert Meeting on Ecosystem Accounts London, UK 5-7 December 2011 Accounting Units for Ecosystem Accounts Paper prepared by
GIS in Weather and Society
 GIS in Weather and Society Olga Wilhelmi Institute for the Study of Society and Environment National Center for Atmospheric Research WAS*IS November 8, 2005 Boulder, Colorado Presentation Outline GIS basic
LAND COVER CATEGORY DEFINITION BY IMAGE INVARIANTS FOR AUTOMATED CLASSIFICATION
 LAND COVER CATEGORY DEFINITION BY IMAGE INVARIANTS FOR AUTOMATED CLASSIFICATION Nguyen Dinh Duong Environmental Remote Sensing Laboratory Institute of Geography Hoang Quoc Viet Rd., Cau Giay, Hanoi, Vietnam
This module presents remotely sensed assessment (choice of sensors and resolutions; airborne or ground based sensors; ground truthing)
") This module presents remotely sensed assessment (choice of sensors and resolutions; airborne or ground based sensors; ground truthing) 1 In this presentation you will be introduced to approaches for using
This module presents remotely sensed assessment (choice of sensors and resolutions; airborne or ground based sensors; ground truthing) 1 In this presentation you will be introduced to approaches for using
Distinct landscape features with important biologic, hydrologic, geomorphic, and biogeochemical functions.
 1 Distinct landscape features with important biologic, hydrologic, geomorphic, and biogeochemical functions. Have distinguishing characteristics that include low slopes, well drained soils, intermittent
Geospatial technology for land cover analysis
 Home Articles Application Environment & Climate Conservation & monitoring Published in : Middle East & Africa Geospatial Digest November 2013 Lemenkova Polina Charles University in Prague, Faculty of Science,
DEM-based Ecological Rainfall-Runoff Modelling in. Mountainous Area of Hong Kong
 DEM-based Ecological Rainfall-Runoff Modelling in Mountainous Area of Hong Kong Qiming Zhou 1,2, Junyi Huang 1* 1 Department of Geography and Centre for Geo-computation Studies, Hong Kong Baptist University,
ENGRG Introduction to GIS
 ENGRG 59910 Introduction to GIS Michael Piasecki March 17, 2014 Lecture 08: Terrain Analysis Outline: Terrain Analysis Earth Surface Representation Contour TIN Mass Points Digital Elevation Models Slope
Setting up SWAT to quantify water-related ecosystem services in a large East African watershed
 Benedikt Notter, University of Bern, Switzerland Setting up SWAT to quantify water-related ecosystem services in a large East African watershed 5th International SWAT Conference August 5 7, Boulder, Colorado
Grant 0299-NEP: Water Resources Project Preparatory Facility
 Document Produced under Grant Project Number: 45206 May 2016 Grant 0299-NEP: Water Resources Project Preparatory Facility Final Report Volume 3 East Rapti (1 of 9) Prepared by Pvt. Ltd. For Ministry of
A Crowning Achievement
 A Crowning Achievement The vast majority of Jumla s 101,000 residents depend on agriculture for their livelihood For decades, the high-mountain regions of Nepal have been caught in a perpetual catch-22.
July, International SWAT Conference & Workshops
 July, 212 212 International SWAT Conference & Workshops Hydrological Modelling of Kosi and Gandak Basins using SWAT Model S. Dutta, Pritam Biswas, Sangita Devi, Suresh A Karth and Bimlesh kumar, Ganga
Effect of land use/land cover changes on runoff in a river basin: a case study
 Water Resources Management VI 139 Effect of land use/land cover changes on runoff in a river basin: a case study J. Letha, B. Thulasidharan Nair & B. Amruth Chand College of Engineering, Trivandrum, Kerala,
Dr. S.SURIYA. Assistant professor. Department of Civil Engineering. B. S. Abdur Rahman University. Chennai
 Hydrograph simulation for a rural watershed using SCS curve number and Geographic Information System Dr. S.SURIYA Assistant professor Department of Civil Engineering B. S. Abdur Rahman University Chennai
EARTH AND SPACE SCIENCE
 EARTH AND SPACE SCIENCE Content Domain Range of Competencies l. Nature of Science 0001 0003 18% ll. Geology 0004 0007 25% lll. IV. Oceanography and Freshwater Systems 0008 0010 19% The Atmosphere, Weather,
Catalonia is a small region, managed by an autonomous government (depending from Spain), and placed in NE. Spain, next to Mediterranean sea.
, and placed in NE. Spain, next to Mediterranean sea.") Characterization of the river basin according to the WFD The Catalan Basins, a case of small Mediterranean water district Planning Department c/ Provença, 204-208 08036-Barcelona Introduction to Catalonia
Characterization of the river basin according to the WFD The Catalan Basins, a case of small Mediterranean water district Planning Department c/ Provença, 204-208 08036-Barcelona Introduction to Catalonia
Geography Class XI Fundamentals of Physical Geography Section A Total Periods : 140 Total Marks : 70. Periods Topic Subject Matter Geographical Skills
 Geography Class XI Fundamentals of Physical Geography Section A Total Periods : 140 Total Marks : 70 Sr. No. 01 Periods Topic Subject Matter Geographical Skills Nature and Scope Definition, nature, i)
Extent. Level 1 and 2. October 2017
 Extent Level 1 and 2 October 2017 Overview: Extent account 1. Learning objectives 2. Review of Level 0 (5m) 3. Level 1 (Compilers): Concepts (15m) Group exercise and discussion (15m) 4. Level 2 (Data Providers)
Biodiversity Blueprint Overview
 Biodiversity Blueprint Overview Climate Variability Climate projections for the Glenelg Hopkins Regions suggest that the weather will be hotter and drier in the coming years which will impact on land use,
Building a European-wide hydrological model
 Building a European-wide hydrological model 2010 International SWAT Conference, Seoul - South Korea Christine Kuendig Eawag: Swiss Federal Institute of Aquatic Science and Technology Contribution to GENESIS
SUPPORTING INFORMATION. Ecological restoration and its effects on the
 SUPPORTING INFORMATION Ecological restoration and its effects on the regional climate: the case in the source region of the Yellow River, China Zhouyuan Li, Xuehua Liu,* Tianlin Niu, De Kejia, Qingping
Greening of Arctic: Knowledge and Uncertainties
 Greening of Arctic: Knowledge and Uncertainties Jiong Jia, Hesong Wang Chinese Academy of Science jiong@tea.ac.cn Howie Epstein Skip Walker Moscow, January 28, 2008 Global Warming and Its Impact IMPACTS
Outline. Remote Sensing, GIS and DEM Applications for Flood Monitoring. Introduction. Satellites and their Sensors used for Flood Mapping
 Outline Remote Sensing, GIS and DEM Applications for Flood Monitoring Prof. D. Nagesh Kumar Chairman, Centre for Earth Sciences Professor, Dept. of Civil Engg. Indian Institute of Science Bangalore 560
 12 10 8 6 4 2 0 40-50 50-60 60-70 70-80 80-90 90-100 Fresh Water What we will cover The Hydrologic Cycle River systems Floods Groundwater Caves and Karst Topography Hot springs Distribution of water in
LAND CAPABILITY CLASSIFICATION FOR INTEGRATED WATERSHED DEVELOPMENT BY APPLYING REMOTE SENSING AND GIS TECHNIQUES
 LAND CAPABILITY CLASSIFICATION FOR INTEGRATED WATERSHED DEVELOPMENT BY APPLYING REMOTE SENSING AND GIS TECHNIQUES Sachin Panhalkar Department of Geography, Shivaji University, Kolhapur, Maharashtra, India
ENGRG Introduction to GIS
 ENGRG 59910 Introduction to GIS Michael Piasecki November 17, 2017 Lecture 11: Terrain Analysis Outline: Terrain Analysis Earth Surface Representation Contour TIN Mass Points Digital Elevation Models Slope
The Importance of Snowmelt Runoff Modeling for Sustainable Development and Disaster Prevention
 The Importance of Snowmelt Runoff Modeling for Sustainable Development and Disaster Prevention Muzafar Malikov Space Research Centre Academy of Sciences Republic of Uzbekistan Water H 2 O Gas - Water Vapor
Climatic Change Implications for Hydrologic Systems in the Sierra Nevada
 Climatic Change Implications for Hydrologic Systems in the Sierra Nevada Part Two: The HSPF Model: Basis For Watershed Yield Calculator Part two presents an an overview of why the hydrologic yield calculator
Effect of land cover / use change on soil erosion assessment in Dubračina catchment (Croatia)
") European Water 57: 171-177, 2017. 2017 E.W. Publications Effect of land cover / use change on soil erosion assessment in Dubračina catchment (Croatia) N. Dragičević *, B. Karleuša and N. Ožanić Faculty
European Water 57: 171-177, 2017. 2017 E.W. Publications Effect of land cover / use change on soil erosion assessment in Dubračina catchment (Croatia) N. Dragičević *, B. Karleuša and N. Ožanić Faculty
The CAWa Project. CA High Elevation Research
 The CAWa Project A New Potential for Cooperation in CA High Elevation Research Katy Unger-Shayesteh & Gerd Rücker CAWa Project Coordination Outline CAWa Project Overview Selected Activities Hydrometeorological
An Internet-based Agricultural Land Use Trends Visualization System (AgLuT)
") An Internet-based Agricultural Land Use Trends Visualization System (AgLuT) Second half yearly report 01-01-2001-06-30-2001 Prepared for Missouri Department of Natural Resources Missouri Department of
An Internet-based Agricultural Land Use Trends Visualization System (AgLuT) Second half yearly report 01-01-2001-06-30-2001 Prepared for Missouri Department of Natural Resources Missouri Department of
EU-level landslide susceptibility assessment
 in the context t of the Soil Thematic Strategy t Andreas Günther 1, Miet Van Den Eeckhaut 2, Paola Reichenbach h 3, Javier Hervás 2 & Jean-Philippe Malet 4 1 Federal Institute for Geosciences and Natural
Central Asia Regional Flash Flood Guidance System 4-6 October Hydrologic Research Center A Nonprofit, Public-Benefit Corporation
 http://www.hrcwater.org Central Asia Regional Flash Flood Guidance System 4-6 October 2016 Hydrologic Research Center A Nonprofit, Public-Benefit Corporation FFGS Snow Components Snow Accumulation and
Distributed modelling of snow- and ice-melt in the Lhasa River basin from 1971 to 2080
 Cold Regions Hydrology in a Changing Climate (Proceedings of symposium H02 held during IUGG2011 in Melbourne, Australia, July 2011) (IAHS Publ. 346, 2011). 57 Distributed modelling of snow- and ice-melt
Gully erosion and associated risks in the Tutova basin Moldavian Plateau
 Landform Analysis, Vol. 17: 193 197 (2011) Gully erosion and associated risks in the Tutova basin Moldavian Plateau University Alexandru Ioan Cuza of Iasi, Department of Geography, Romania, e-mail: catiul@yahoo.com
FLOOD RISK MAPPING AND ANALYSIS OF THE M ZAB VALLEY, ALGERIA
 River Basin Management IX 69 FLOOD RISK MAPPING AND ANALYSIS OF THE M ZAB VALLEY, ALGERIA AMEL OUCHERIF & SAADIA BENMAMAR National Polytechnic School of Algiers, Algeria ABSTRACT To contribute to flood
FOREST RESEARCH INSTITUTE, DEHRADUN
 PROJECT REPORT DRAINAGE AND REPLENISHMENT STUDY OF MINED AREA OF GANGA SHYAMPUR RIVER HARIDWAR Submitted to UTTARAKHAND FOREST DEVELOPMENT CORPORATION (UFDC) 73, Nehru Road, Deharadun Prepared&Submitted
Climate change in Central Asia:Tienshan trends and future
 Climate change in Central Asia:Tienshan trends and future Ysmail Dairov, Regional Mountain Centre of Central Asia 23 October 2012, Eger, Hungary 1 The Regional Mountain Centre of Central Asia was established
FLORA: FLood estimation and forecast in complex Orographic areas for Risk mitigation in the Alpine space
 Natural Risk Management in a changing climate: Experiences in Adaptation Strategies from some European Projekts Milano - December 14 th, 2011 FLORA: FLood estimation and forecast in complex Orographic
Pan-Arctic Digital Elevation Model - International Collaboration in Generation of ArcticDEM
 Pan-Arctic Digital Elevation Model - International Collaboration in Generation of ArcticDEM ESRI International Users Conference, June 30, 2016 Tracy Fuller, USGS Pan-Arctic DEM Technical Lead, Alaska Mapping
Chiang Rai Province CC Threat overview AAS1109 Mekong ARCC
 Chiang Rai Province CC Threat overview AAS1109 Mekong ARCC This threat overview relies on projections of future climate change in the Mekong Basin for the period 2045-2069 compared to a baseline of 1980-2005.
Kimberly J. Mueller Risk Management Solutions, Newark, CA. Dr. Auguste Boissonade Risk Management Solutions, Newark, CA
 1.3 The Utility of Surface Roughness Datasets in the Modeling of United States Hurricane Property Losses Kimberly J. Mueller Risk Management Solutions, Newark, CA Dr. Auguste Boissonade Risk Management
Lesson 4b Remote Sensing and geospatial analysis to integrate observations over larger scales
 Lesson 4b Remote Sensing and geospatial analysis to integrate observations over larger scales We have discussed static sensors, human-based (participatory) sensing, and mobile sensing Remote sensing: Satellite
LAND COVER CHANGES IN ROMANIA BASED ON CORINE LAND COVER INVENTORY
 LAND COVER CHANGES IN ROMANIA BASED ON CORINE LAND COVER INVENTORY 1990 2012 JENICĂ HANGANU, ADRIAN CONSTANTINESCU * Key-words: CORINE Land Cover inventory, Land cover changes, GIS. Abstract. From 1990
Summary Description Municipality of Anchorage. Anchorage Coastal Resource Atlas Project
 Summary Description Municipality of Anchorage Anchorage Coastal Resource Atlas Project By: Thede Tobish, MOA Planner; and Charlie Barnwell, MOA GIS Manager Introduction Local governments often struggle
Predicting ectotherm disease vector spread. - Benefits from multi-disciplinary approaches and directions forward
 Predicting ectotherm disease vector spread - Benefits from multi-disciplinary approaches and directions forward Naturwissenschaften Stephanie Margarete THOMAS, Carl BEIERKUHNLEIN, Department of Biogeography,
Using object oriented technique to extract jujube based on landsat8 OLI image in Jialuhe Basin
 Journal of Image Processing Theory and Applications (2016) 1: 16-20 Clausius Scientific Press, Canada Using object oriented technique to extract jujube based on landsat8 OLI image in Jialuhe Basin Guotao
Remote Sensing and GIS Applications for Hilly Watersheds SUBASHISA DUTTA DEPARTMENT OF CIVIL ENGINEERING IIT GUWAHATI
 Remote Sensing and GIS Applications for Hilly Watersheds SUBASHISA DUTTA DEPARTMENT OF CIVIL ENGINEERING IIT GUWAHATI Deciding Alternative Land Use Options in a Watershed Using GIS Source: Anita Prakash
Integrating Geographical Information Systems (GIS) with Hydrological Modelling Applicability and Limitations
 with Hydrological Modelling Applicability and Limitations") Integrating Geographical Information Systems (GIS) with Hydrological Modelling Applicability and Limitations Rajesh VijayKumar Kherde *1, Dr. Priyadarshi. H. Sawant #2 * Department of Civil Engineering,
Integrating Geographical Information Systems (GIS) with Hydrological Modelling Applicability and Limitations Rajesh VijayKumar Kherde *1, Dr. Priyadarshi. H. Sawant #2 * Department of Civil Engineering,
Evaluation of distributed snowpack simulation with in-situ and remote sensing information in Arveupper catchment
 Evaluation of distributed snowpack simulation with in-situ and remote sensing information in Arveupper catchment J. Revuelto 1,2, G. Lecourt 2, L. Charrois 2, T. Condom 1, M. Dumont 2, M. Lafaysse 2,,
Alaska, USA. Sam Robbins
 Using ArcGIS to determine erosion susceptibility within Denali National Park, Alaska, USA Sam Robbins Introduction Denali National Park is six million acres of wild land with only one road and one road
CHAPTER 9 SUMMARY AND CONCLUSIONS
 CHAPTER 9 SUMMARY AND CONCLUSIONS The following are the important conclusions and salient features of the present study. 1. The evaluation of groundwater potential is a prerequisite for any kind of planning
ECVs: What s operational and what still requires R&D?
 Glaciers_cci input on ECVs: What s operational and what still requires R&D? Frank Paul* Department of Geography, University of Zurich *on behalf of the Glaciers_cci consortium Google Earth Operational
Global Ecosystem Mapping For UN SEEA Ecosystem Accounting
 Global Ecosystem Mapping For UN SEEA Ecosystem Accounting Roger Sayre (U. S. Geological Survey); Dawn Wright, Sean Breyer, Charlie Frye, and others (Esri) UN SEEA Experts Forum on Ocean Ecosystem Accounting
Earth s Major Terrerstrial Biomes. *Wetlands (found all over Earth)
") Biomes Biome: the major types of terrestrial ecosystems determined primarily by climate 2 main factors: Depends on ; proximity to ocean; and air and ocean circulation patterns Similar traits of plants
Biomes Biome: the major types of terrestrial ecosystems determined primarily by climate 2 main factors: Depends on ; proximity to ocean; and air and ocean circulation patterns Similar traits of plants
UNIT 11 SOUTH ASIA SG 1 - PHYSICAL GEOGRAPHY & THE ENVIRONMENT
 UNIT 11 SOUTH ASIA SG 1 - PHYSICAL GEOGRAPHY & THE ENVIRONMENT I. PHYSICAL GEOGRAPHY TAKE OUT YOUR PHYSICAL MAP OF SOUTH ASIA A. The Himalayan Mountains form the northern boundary of the region (color
Evaluating Flood Hazard Potential in Danang City, Vietnam Using FOSS4G
 Free and Open Source Software for Geospatial (FOSS4G) Conference Proceedings Volume 15 Seoul, South Korea Article 28 2015 Evaluating Flood Hazard Potential in Danang City, Vietnam Using FOSS4G An Tran
Simulation of sedimentation rates using the SWAT model A case study of the Tarbela Dam, Upper Indus Basin
 Simulation of sedimentation rates using the SWAT model A case study of the Tarbela Dam, Upper Indus Basin Ahammad, H. I 1., Crosato A 2,3., Maskey, S 2., Masih, I 2,*, McClain, M 2. 1 Punjab Irrigation
Remote Sensing of SWE in Canada
 Remote Sensing of SWE in Canada Anne Walker Climate Research Division, Environment Canada Polar Snowfall Hydrology Mission Workshop, June 26-28, 2007 Satellite Remote Sensing Snow Cover Optical -- Snow
GIS and Remote Sensing
 Spring School Land use and the vulnerability of socio-ecosystems to climate change: remote sensing and modelling techniques GIS and Remote Sensing Katerina Tzavella Project Researcher PhD candidate Technology
MODELLING LAND USE CHANGE ON A REGIONAL SCALE
 MODELLING LAND USE CHANGE ON A REGIONAL SCALE W. Lahmer 1, A. Becker 1, B. Pfützner 2 1 Potsdam Institute for Climate Impact Research, Telegrafenberg, D-14412 Potsdam, Germany 2 Bureau for Applied Hydrology
Use of PRISM Data. for Precipitation Estimates. in ESPAM2 AS BUILT
 Use of PRISM Data for Precipitation Estimates in ESPAM2 AS BUILT Prepared by Idaho Water Resources Research Institute In fulfillment of the Water-Budget Component Precipitation of Contract # CON00803 for
Description of Simandou Archaeological Potential Model. 12A.1 Overview
 12A Description of Simandou Archaeological Potential Model 12A.1 Overview The most accurate and reliable way of establishing archaeological baseline conditions in an area is by conventional methods of
Towards a process-oriented HRU-concept in SWAT: Catchment-related control on baseflow and storage of landscape units in medium to large river basins.
 Towards a process-oriented HRU-concept in SWAT: Catchment-related control on baseflow and storage of landscape units in medium to large river basins. Martin Volk 1), J.G. Arnold 2), P.M. Allen 3), Pei-Yu
The SedAlp Project: WP6: INTERACTION WITH STRUCTURES
 The SedAlp Project: WP6: INTERACTION WITH STRUCTURES 6 th International conference Water in the Alps Herrenchiemsee, 12 th of October, 2016 Jošt Sodnik Contents Structure of SedAlp project (www.sedalp.eu)
Transactions on Information and Communications Technologies vol 18, 1998 WIT Press, ISSN
 STREAM, spatial tools for river basins, environment and analysis of management options Menno Schepel Resource Analysis, Zuiderstraat 110, 2611 SJDelft, the Netherlands; e-mail: menno.schepel@resource.nl