A MAP OF SALTCEDAR DISTRIBUTION ON WHITE SANDS NATIONAL MONUMENT
|
|
|
- Cornelius Thomas
- 6 years ago
- Views:
Transcription


1 A MAP OF SALTCEDAR DISTRIBUTION ON WHITE SANDS NATIONAL MONUMENT April 2010
2 A Map of Saltcedar Distribution on White Sands National Monument 1 Esteban H. Muldavin, Teri Neville, Lisa Arnold, and Yvonne Chauvin 2 ABSTRACT Natural Heritage New Mexico provides a map of the current distribution and estimation of stand density of saltcedar (Tamarix chinensis) within White Sands National Monument. Saltcedar covers approximately 1.8% of the park with the majority of stands (72%) classified as sparse having 1 to 10% cover of saltcedar. While some encroachment has occurred due to vehicular traffic along the main road into the park, most of the persistent stands extend from Lost River in the northeast section of the monument. Other areas of progressive recruitment lie at the margins of Lake Lucero and Lake Otero (Alkali Flat). ACKNOWLEDGEMENTS This project was supported through funds provided by the National Park Service-wide Comprehensive Call of the Natural Resource Preservation Program for Small Parks and the Chihuahuan Desert Network, with Natural Heritage New Mexico (NHNM), a division of the Museum of Southwestern Biology at the University of New Mexico. The NHNM technicians Yvonne Chauvin, Conor Flynn, Charlie Jackson, Amanda Kennedy, and Sandy Sacher conducted the majority of the fieldwork and data entry. Rebecca Keeshen provided management support and editorial review. Tom Budge and Paul Neville from Earth Data Analysis Center at the University of New Mexico provided support in imagery acquisition and development. David Bustos, White Sands National Monument, National Park Service, provided important field logistical support and GIS data. Any use of trade, product, or firm names is for descriptive purposes only and does not imply endorsement by the U.S. Government. ON THE COVER Saltcedar within active dunes at White Sands National Monument. Photograph by Charlie Jackson, Final report submitted March 2010 in fulfillment of Cooperative Agreement # H between the New Mexico Natural Heritage Program (Natural Heritage New Mexico) at the University of New Mexico and the National Park Service, Colorado Plateau Cooperative Ecosystem Studies Unit. 2 Esteban Muldavin (Senior Ecologist), Teri Neville (GIS Coordinator), Lisa Arnold (GIS Analyst), and Yvonne Chauvin (Botanist) are with Natural Heritage New Mexico, Museum of Southwestern Biology, Department of Biology at the University of New Mexico (UNM). 2
3 CONTENTS Abstract... 2 Acknowledgements... 2 Introduction... 4 Study Area... 5 Methods... 6 Field Data Collection... 6 Image Analysis... 6 Results... 8 Saltcedar map of White Sands National Monument... 8 Discussion... 9 References TABLE OF FIGURES Figure 1. Salt cedar-dominated flat with fourwing saltbush, bounded by dunes to the northeast and southwest Figure 2. White Sands National Monument study area Figure 3. Natural Heritage New Mexico field plot locations Figure 4. Distribution by stand cover value of saltcedar within the monument TABLE OF TABLES Table 1. Saltcedar cover scale values at White Sands National Monument

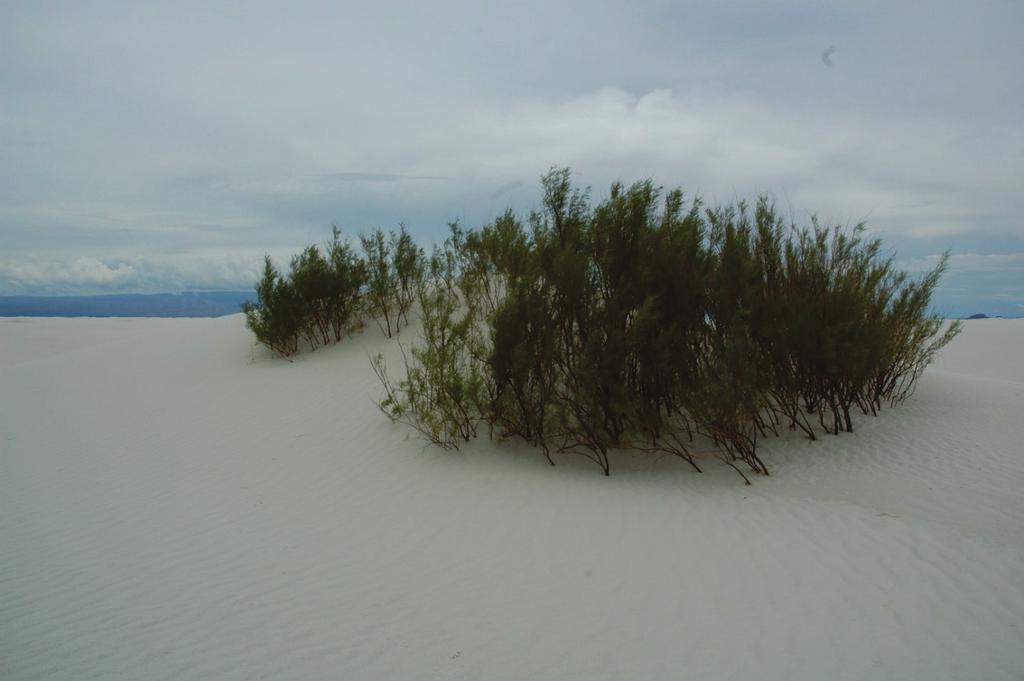
4 INTRODUCTION Saltcedar (Tamarix chinensis) is widely distributed on White Sand National Monument (WHSA). This large shrub has the potential to radically transform the active dunes of the monument through vegetative stabilization and has altered the native plant communities surrounding the alkali flats of Lake Lucero. For example, saltcedar creates pedestals within the dunes and can change local wind patterns resulting in dune distribution patterns reflecting occurrences of invasive species (Bennett and Wilder 2009). In addition, invasion into arroyos, springs, and areas with shallow water tables has lowered water tables and degraded water quality (Bennett and Wilder 2009). Both aerial and hand-spray applications have been used within the monument to manage this rapidly spreading exotic. Although recent studies indicate saltcedar evapotranspiration (ET) rates are similar to other woody phreatophytes (Stromberg et al. 2009), there is no historical precedence within the park for large, dense stands of woody phreatophytes within any of the environments where saltcedar currently dominates (Figure 1). To combat the spread of this aggressive exotic plant the park employs both aerial and hand-spray herbicide applications. Accordingly, there was a need for an accurate and precise saltcedar distribution map to be used in planning treatments and evaluating their effects. Given that total eradication is not expected, but rather a modicum of control the goal, the focus here was to identify those areas of highest concentration and density to facilitate effective and cost-efficient treatments. In addition, this map is designed to be compatible with a comprehensive vegetation map of WHSA currently being developed by Natural Heritage New Mexico (NHNM) for the park. Figure 1. Salt cedar-dominated flat with fourwing saltbush, bounded by dunes to the northeast and southwest. 4

5 STUDY AREA White Sands National Monument lies within the Tularosa Basin bounded on the west by the San Andres Mountains and the Sacramento Mountains to the east (Figure 2). The monument contains approximately half of the White Sands dune field with White Sands Missile Range and Holloman Air Force Base having stewardship of the remaining dune field. Within the monument is a portion of the ancestral, glacial Lake Otero, referred to as Alkali Flat, and Lake Lucero that form the numerous playas and alkali flats at the western boundary of the dunes and which are the source for the dune field. Lake Lucero is the topographically lowest area within the basin (1,185 m; 3,888 ft) and largest playa within the monument with water levels that fluctuate seasonally depending on inflow and evaporation (Bennett and Wilder 2009). We included the entire monument of 55,885 ha (138,095 ac) as our study area. Figure 2. White Sands National Monument study area. 5
6 METHODS Using recent (2005) digital aerial orthophotography as the base, Natural Heritage New Mexico applied a suite of image analysis, aerial photo interpretation, and GIS spatial analysis techniques along with field sampling to develop a digital map of saltcedar distribution on WHSA. FIELD DATA COLLECTION NHNM collected field data from 2007 to 2009 at 176 sites within the monument. Of these, 130 were targeted for the tamarisk mapping effort, comprising 96 plots and 34 separate GPS points at isolated trees or shrubs. The initial mapping effort in 2007 began with randomly selected field plots, however, the field efforts in 2008 and 2009 were guided by the ongoing mapping effort. Field sample points were selected and mapped in the GIS and provided to field crews to visit; these sites were a either (1) presumed to have a saltcedar component, or (2) considered vegetative cover types that were widely distributed and used to confirm there was no saltcedar component. When arriving at the pre-designated location, field crews could position themselves at the most representative site containing saltcedar or, in the cases where no saltcedar existed, the dominant species. Plots were approximately 400 m 2 (1,312 ft 2 ) and square, but occasionally other sizes and shapes were used to fit the structure of a community, especially along drainages where vegetation stands conformed to the channel shape. Data were entered on paper field datasheets and locations were recorded with a Garmen GPS Model 12 with +/- 10-m accuracy. The dominant plants for each strata (tree, shrub, forb, and grass) were recorded along with their percent relative abundance. Photos were taken from the center point of the plots in all cardinal directions. Data were entered into a database and quality checked, GIS layers developed, and photos archived and attributed with the field plot label. A total of 96 plots from 2007 to 2009 were entered into the database (Natural Heritage New Mexico 2010) and an additional 36 map points of isolated occurrences of single trees (saltcedars) were developed into a GIS with short descriptions (Figure 3). IMAGE ANALYSIS The saltcedar map was based on available natural color and color infra-red digital orthophotography acquired in June 2005 with a spatial resolution of one meter. Earth Data Analysis Center (EDAC) mosaicked the Digital Orthophoto Quarter Quadrangles (DOQQs) into a single file and added a Normalized Difference Vegetation Index (NDVI) as an additional band to emphasize areas of dense vegetative cover. The resulting image was a five-band file consisting of: visible blue, visible green, visible red, near infra-red, and the NDVI in bands one through five, respectively. The five-band file was analyzed using the object-oriented ecognition software (Definiens) to generate a first iteration of mapping polygons, creating more than 20,800 polygons. The initial set of polygons represented relatively homogeneous features within the monument. Each polygon was visually scanned into a GIS to determine whether the polygon represented a range of vegetated cover values that included saltcedar. Image interpretation across the monument was variable due to the differences in albedo intensities and vegetative cover. To adjust for this factor, we would alter the image viewing properties by switching image-band combinations, try various histogram stretches, and adjust the brightness. 6

7 For example, the NDVI caused over-saturation within the inter-dune swales in the northeast of the monument where there was high contrast between the unstabilized dunes and the vegetated interdunes. Additionally, shadows caused by the dunes tend to have high NDVI values which give the appearance of high vegetative cover. Altering the display of the imagery helped the visual interpretation so that texture and color variation were further enhanced. Figure 3. Natural Heritage New Mexico field plot locations. We followed the protocols of the U.S. Geological Survey National Park Service Vegetation Mapping Program (VMP) guidelines for content, precision and accuracy, i.e., a minimum map unit (polygon) size of 0.5 ha (1.23 ac) to be used at a 1:24,000 scale with saltcedar cover classes that follow the National Vegetation Classification standard of 1-10%, 10-25%, 25-60%, and > 60% aerial cover. These ranges in percent cover of saltcedar were used to attribute the polygons and, where needed, the ecognition polygons were spatially modified to represent the interpreters judgement of the extent and percent aerial cover of saltcedar. We used the field data plus legacy WHSA vegetation plots from the NHNM plot database (Natural Heritage New Mexico 2010), vegetation maps (Muldavin et al. 2000a, 2000b) and GIS field data 7

8 supplied by the monument to train the interpreters to recognize and differentiate saltcedar from other shrubs and trees that occupy some of the same topographic positions as saltcedar. We did not distinguish dead from live trees; however, field data was useful in helping us calibrate our assignments of density. For example, where chemical treatment had occurred, the surveyor indicated whether regrowth was occurring and with the addition of plot photos, we adjusted what typically appeared to be much greater densities to reflect on-ground estimations. RESULTS SALTCEDAR MAP OF WHITE SANDS NATIONAL MONUMENT Saltcedar covers approximately 987 ha (2.439 ac) or 1.8% of the monument (Figure 4). The classification category Scattered Trees comprises the greatest percent cover of saltcedar stands within the monument followed by Sparse, Open, and Closed Stands (Table 1). The average stand size is.88 ha (2.17 ac). The largest stand is 101 ha (250 ac), a nearly contiguous area of scattered trees at Lost River in the northeast portion of the monument. Elevation ranges of 1,185 to 1,190 m Figure 4. Distribution by stand cover value of saltcedar within the monument. 8
9 (3,888 to 3,904 ft) indicate much of the current maximal extent of both North and South Lake Lucero are circumscribed by relatively narrow stands of saltcedar. Two distinct locales, one at the center of the monument and another at the north-central monument boundary, appear to lie at the boundaries of the Lake Otero (Alkali Flat) gypsum deposits. Transportation along the Heart of the Sands Loop road is likely responsible for invasion into the main body of the active dunes, while Lost River is the source at the eastern margin, where saltcedar has colonized into the interdune areas where the river is truncated by the sands. Table 1. Saltcedar cover scale values at White Sands National Monument. Cover Code Cover Description Polygon Count Ha Minimum Ha Maximum Ha Average Ha Total % Total Saltcedar 1 Scattered Trees (1-10%) % 2 Sparse Stands (10-25%) % 3 Open Stands (25-60%) % 4 Closed Stands (>60%) % Saltcedar Total WHSA Study Area The products developed under this project will be placed onto a CD and delivered to the park and will include: digital copy of the report, an Excel spreadsheet of the plot data, and GIS layers in ArcGIS file geodatabase format. The GIS layers include the point locations of plots, incidental single tree locations, and the saltcedar polygon map. DISCUSSION The highest concentration of saltcedar occurs in lowland areas that are periodically saturated from accumulated water due to storm events. Typically, these were at the margins of Lake Lucero and the Lake Otero (Alkali Flat) in the southwest part of the monument, and in the Lost River drainage in the northeast part. Lost River appeared to have the highest concentrations and densities of invasive encroachment, followed by the northern boundary of the monument and WSMR along Range Road 10, which lies at the northeast margin of Lake Otero (Alkali Flat). Substantial resprouting after chemical treatments within the Lost River area is also occurring. Invasion into the active dune field and interdune regions may be the result of invasives inadvertently transported by vehicles using the Heart of the Sands Loop road, and possibly Range Road 10. Additionally, the close proximity of the dunes to Lost River may be a source for the eastern region of the dunes, although wind patterns throughout the year are predominantly easterly, away from dunes. We believe we could reasonably differentiate shrubs such as fourwing saltbush (Atriplex canescens) and rosemary mint (Poliomintha incana) from saltcedar. However, cottonwood (Populus deltoides), skunkbush sumac (Rhus trilobata), and honey mesquite (Prosopis glandulosa) were more problematic. Since honey mesquite was isolated to the western, more upland portion of the monument, we could discount what appeared to be saltcedar. However, within the drainages 9
10 entering the alkali flats along the western edge, there may be areas we identified as saltcedar that may be dominated by either honey mesquite or alkali sacaton (Sporobolus airoides). Areas that had been chemically treated were also problematic since we had no information as to when the treatment occurred, relative to the acquisition date of the aerial orthophotos. Much of the high vegetative response in chemically treated areas could also be due to spring ruderals colonizing the treated areas along with the regrowth of extant treated stands. Field data and photos were highly effective in driving attribution of density cover values. No formal accuracy assessment was conducted for the map. There was a period of informal testing mid-project by park personnel that served as proof-of-concept on the photo-interpretation rule base and line work for the map. The accuracy of the map will be formally tested when this saltcedar GIS is integrated into the comprehensive vegetation map for the monument currently being developed by NHNM. REFERENCES Bennett, J., and D. Wilder Physical resources foundation report, White Sands Monument. Natural Resource Report NPS/NRPC/NRR-2009/166. National Park Service, Fort Collins, Colorado. Muldavin, E., G. Harper, P. Neville, and Y. Chauvin. 2000a. The vegetation of White Sands Missile Range, New Mexico: Volume II: Vegetation Map. Natural Heritage New Mexico Publ. No. 00- GTR-299. Natural Heritage New Mexico, University of New Mexico, Albuquerque, NM. 100 p. Muldavin, E., Y. Chauvin, and G. Harper. 2000b. The vegetation of White Sands Missile Range, New Mexico: Volume I: Handbook of vegetation communities. Natural Heritage New Mexico Publication No. 00-GTR-298. Natural Heritage New Mexico, University of New Mexico, Albuquerque, NM. 236 p. Natural Heritage New Mexico An online database of New Mexico s sensitive species and ecological communities [web application]. University of New Mexico, Albuquerque, NM. Online: Accessed on March 29, Stromberg, J.C., M.K. Chew, P.L. Nagler, and E.P. Glenn Changing perceptions of change: The role of scientists in Tamarix and river management. Restoration Ecology Vol. 17(2):
REMOTE SENSING ACTIVITIES. Caiti Steele
 REMOTE SENSING ACTIVITIES Caiti Steele REMOTE SENSING ACTIVITIES Remote sensing of biomass: Field Validation of Biomass Retrieved from Landsat for Rangeland Assessment and Monitoring (Browning et al.,
Appendix J Vegetation Change Analysis Methodology
 Appendix J Vegetation Change Analysis Methodology Regional Groundwater Storage and Recovery Project Draft EIR Appendix-J April 2013 APPENDIX J- LAKE MERCED VEGETATION CHANGE ANALYSIS METHODOLOGY Building
LANDSCAPE CHANGE IN THE SOUTHWEST: Historical changes in selected ecosystems of the southwestern United States
 LANDSCAPE CHANGE IN THE SOUTHWEST: Historical changes in selected ecosystems of the southwestern United States Robert H. Webb U.S. Geological Survey 520 N. Park Avenue Tucson, AZ 85719 rhwebb@usgs.gov
Elevation (ft) Slope ( ) County CONDITION CATEGORY. Parameter Natural Condition Slightly impacted Moderately Impacted Heavily Impacted
 Slope ( ) County CONDITION CATEGORY. Parameter Natural Condition Slightly impacted Moderately Impacted Heavily Impacted") Version: 8/25/14 Meadow Name Date : / / MM DD YYYY GPS Location:. N. W GPS Datum (e.g., WGS 84, NAD 27) Elevation (ft) Slope ( ) County Watershed (HUC8) Landowner USGS Quad Name Observers: 7.5 or 15 (circle
Version: 8/25/14 Meadow Name Date : / / MM DD YYYY GPS Location:. N. W GPS Datum (e.g., WGS 84, NAD 27) Elevation (ft) Slope ( ) County Watershed (HUC8) Landowner USGS Quad Name Observers: 7.5 or 15 (circle
Laboratory Exercise #4 Geologic Surface Processes in Dry Lands
 Page - 1 Laboratory Exercise #4 Geologic Surface Processes in Dry Lands Section A Overview of Lands with Dry Climates The definition of a dry climate is tied to an understanding of the hydrologic cycle
A Comprehensive Inventory of the Number of Modified Stream Channels in the State of Minnesota. Data, Information and Knowledge Management.
 A Comprehensive Inventory of the Number of Modified Stream Channels in the State of Minnesota Data, Information and Knowledge Management Glenn Skuta Environmental Analysis and Outcomes Division Minnesota
U.S. DEPARTMENT OF THE INTERIOR U.S. GEOLOGICAL SURVEY MEASUREMENTS OF SAND THICKNESSES IN GRAND CANYON,
 U.S. DEPARTMENT OF THE INTERIOR U.S. GEOLOGICAL SURVEY MEASUREMENTS OF SAND THICKNESSES IN GRAND CANYON, ARIZONA, AND A CONCEPTUAL MODEL FOR CHARACTERIZING CHANGES IN SAND-BAR VOLUME THROUGH TIME AND SPACE
Appendix I Feasibility Study for Vernal Pool and Swale Complex Mapping
 Feasibility Study for Vernal Pool and Swale Complex Mapping This page intentionally left blank. 0 0 0 FEASIBILITY STUDY BY GIC AND SAIC FOR MAPPING VERNAL SWALE COMPLEX AND VERNAL POOLS AND THE RESOLUTION
Wetland Mapping. Wetland Mapping in the United States. State Wetland Losses 53% in Lower US. Matthew J. Gray University of Tennessee
 Wetland Mapping Caribbean Matthew J. Gray University of Tennessee Wetland Mapping in the United States Shaw and Fredine (1956) National Wetlands Inventory U.S. Fish and Wildlife Service is the principle
Third Annual Monitoring Report Tidal Wetland Restoration 159 Long Neck Point Road, Darien, CT NAE
 1) Project Overview Third Annual Monitoring Report Tidal Wetland Restoration 159 Long Neck Point Road, Darien, CT NAE-2007-1130 December 15, 2014 This is the third year of a five year monitoring program
Date of Report: EPA agreement number: Center Name and Institution of Ctr. Director: Identifier used by Center for Project: Title of Project:
 Date of Report: March 31, 2003 EPA agreement number: R829515C003 Center Name and Institution of Ctr. Director: Rocky Mountain Regional Hazardous Substance Research Center, Colorado State University, Fort
Resolving habitat classification and structure using aerial photography. Michael Wilson Center for Conservation Biology College of William and Mary
 Resolving habitat classification and structure using aerial photography Michael Wilson Center for Conservation Biology College of William and Mary Aerial Photo-interpretation Digitizing features of aerial
Invasive Plant Management at Joshua Tree National Park
 Invasive Plant Management at Joshua Tree National Park Neil Frakes Vegetation Branch Chief Joshua Tree National Park, Division of Science and Resource Stewardship neil_frakes@nps.gov Joshua Tree National
USING HYPERSPECTRAL IMAGERY
 USING HYPERSPECTRAL IMAGERY AND LIDAR DATA TO DETECT PLANT INVASIONS 2016 ESRI CANADA SCHOLARSHIP APPLICATION CURTIS CHANCE M.SC. CANDIDATE FACULTY OF FORESTRY UNIVERSITY OF BRITISH COLUMBIA CURTIS.CHANCE@ALUMNI.UBC.CA
Improvement of the National Hydrography Dataset for Parts of the Lower Colorado Region and Additional Areas of Importance to the DLCC
 Improvement of the National Hydrography Dataset for Parts of the Lower Colorado Region and Additional Areas of Importance to the DLCC Carlos Reyes-Andrade California State University, Northridge September
TSEGI WASH 50% DESIGN REPORT
 TSEGI WASH 50% DESIGN REPORT 2/28/2014 Daniel Larson, Leticia Delgado, Jessica Carnes I Table of Contents Acknowledgements... IV 1.0 Project Description... 1 1.1 Purpose... 1 Figure 1. Erosion of a Headcut...
ADDITIONAL PHASE IA ARCHAEOLOGICAL SURVEY FOR THE UMORE PARK SAND AND GRAVEL MINING ENVIRONMENTAL REVIEW SERVICES, DAKOTA COUNTY, MINNESOTA
 ADDITIONAL PHASE IA ARCHAEOLOGICAL SURVEY FOR THE UMORE PARK SAND AND GRAVEL MINING ENVIRONMENTAL REVIEW SERVICES, DAKOTA COUNTY, MINNESOTA ADDENDUM I Submitted to: Short Elliot Hendrickson, Inc. Submitted
Investigation IV: Seasonal Precipitation and Seasonal Surface Runoff in the US
 Investigation IV: Seasonal Precipitation and Seasonal Surface Runoff in the US Purpose Students will consider the seasonality of precipitation and surface runoff and think about how the time of year can
Use of Thematic Mapper Satellite Imagery, Hemispherical Canopy Photography, and Digital Stream Lines to Predict Stream Shading
 Use of Thematic Mapper Satellite Imagery, Hemispherical Canopy Photography, and Digital Stream Lines to Predict Stream Shading David Nagel GIS Analyst Charlie Luce Research Hydrologist Bárbara Gutiérrez
Second Annual Monitoring Report Tidal Wetland Restoration 159 Long Neck Point Road, Darien, CT NAE
 1) Project Overview Second Annual Monitoring Report Tidal Wetland Restoration 159 Long Neck Point Road, Darien, CT NAE-2007-1130 December 13, 2013 This is the second year of a five year monitoring program
Pierce Cedar Creek Institute GIS Development Final Report. Grand Valley State University
 Pierce Cedar Creek Institute GIS Development Final Report Grand Valley State University Major Goals of Project The two primary goals of the project were to provide Matt VanPortfliet, GVSU student, the
NATIVE PLANT CONSERVATION ON THE PINAL CENTRAL TO TORTOLITA 500 KV TRANSMISSION LINE PROJECT
 NATIVE PLANT CONSERVATION ON THE PINAL CENTRAL TO TORTOLITA 500 KV TRANSMISSION LINE PROJECT Diana Shiel Leslie Carpenter PART 1: SAGUARO CONFLICT ASSESSMENT TRANSMISSION LINE (CONDUCTORS) & PREDICTED
Classification of Erosion Susceptibility
 GEO327G: GIS & GPS Applications in Earth Sciences Classification of Erosion Susceptibility Denali National Park, Alaska Zehao Xue 12 3 2015 2 TABLE OF CONTENTS 1 Abstract... 3 2 Introduction... 3 2.1 Universal
NIDIS Intermountain West Drought Early Warning System December 18, 2018
 NIDIS Intermountain West Drought Early Warning System December 18, 2018 Precipitation The images above use daily precipitation statistics from NWS COOP, CoCoRaHS, and CoAgMet stations. From top to bottom,
Lecture 9: Reference Maps & Aerial Photography
 Lecture 9: Reference Maps & Aerial Photography I. Overview of Reference and Topographic Maps There are two basic types of maps? Reference Maps - General purpose maps & Thematic Maps - maps made for a specific
GIS Project: Groundwater analysis for the Rhodes property (Socorro, NM).
.") GIS Project: Groundwater analysis for the Rhodes property (Socorro, NM). Vanessa Garayburu-Caruso CE 547 May 2016 Contents Motivation and background... 3 Objectives... 3 Methods... 5 Data sources... 5
GIS Project: Groundwater analysis for the Rhodes property (Socorro, NM). Vanessa Garayburu-Caruso CE 547 May 2016 Contents Motivation and background... 3 Objectives... 3 Methods... 5 Data sources... 5
MAINTENANCE DREDGE BENTHIC ASSESSMENT SUNSET POINT FARM LLC LONG POINT KEY MONROE COUNTY, FLORIDA. Prepared by:
 MAINTENANCE DREDGE BENTHIC ASSESSMENT SUNSET POINT FARM LLC LONG POINT KEY MONROE COUNTY, FLORIDA Prepared by: December 11, 2016 INTRODUCTION The owners of the Sunset Point Farms LLC, located on the northern
Wetland and Riparian Mapping: An Overview of the Montana Program
 Wetland and Riparian Mapping: An Overview of the Montana Program Meghan Burns, Catherine McIntyre, Karen Newlon Ecology Program Montana Natural Heritage Program Helena, MT Montana Natural Heritage Program
The elevations on the interior plateau generally vary between 300 and 650 meters with
 11 2. HYDROLOGICAL SETTING 2.1 Physical Features and Relief Labrador is bounded in the east by the Labrador Sea (Atlantic Ocean), in the west by the watershed divide, and in the south, for the most part,
It is relatively simple to comprehend the characteristics and effects of an individual id fire. However, it is much more difficult to do the same for
 Interactive Effects of Plant Invasions and Fire in the Hot Deserts of North America Matt Brooks U.S. Geological Survey Western Ecological Research Center Yosemite Field Station, El Portal CA Presentation
MONITORING BLACK-TAILED PRAIRIE DOG TOWNS IN EASTERN NEW MEXICO USING REMOTE SENSING
 MONITORING BLACK-TAILED PRAIRIE DOG TOWNS IN EASTERN NEW MEXICO USING REMOTE SENSING 2010 FINAL REPORT Kristine Johnson, Teri Neville, Brian Kramer, and Bryant Flores Natural Heritage New Mexico Museum
Which map shows the stream drainage pattern that most likely formed on the surface of this volcano? A) B)
 B)") 1. When snow cover on the land melts, the water will most likely become surface runoff if the land surface is A) frozen B) porous C) grass covered D) unconsolidated gravel Base your answers to questions
1. When snow cover on the land melts, the water will most likely become surface runoff if the land surface is A) frozen B) porous C) grass covered D) unconsolidated gravel Base your answers to questions
GRAPEVINE LAKE MODELING & WATERSHED CHARACTERISTICS
 GRAPEVINE LAKE MODELING & WATERSHED CHARACTERISTICS Photo Credit: Lake Grapevine Boat Ramps Nash Mock GIS in Water Resources Fall 2016 Table of Contents Figures and Tables... 2 Introduction... 3 Objectives...
NIDIS Intermountain West Drought Early Warning System February 6, 2018
 NIDIS Intermountain West Drought Early Warning System February 6, 2018 Precipitation The images above use daily precipitation statistics from NWS COOP, CoCoRaHS, and CoAgMet stations. From top to bottom,
Lab 9: Eolian and Arid Region Landforms
 Name: Lab 9: Eolian and Arid Region Landforms The objective of this lab is to familiarize yourself with a few basic desert and eolian landforms. Answer the following problems completely. You may need to
Vermont Stream Geomorphic Assessment. Appendix E. River Corridor Delineation Process. VT Agency of Natural Resources. April, E0 - April, 2004
 Vermont Stream Geomorphic Assessment Appendix E River Corridor Delineation Process Vermont Agency of Natural Resources - E0 - River Corridor Delineation Process Purpose A stream and river corridor delineation
EOLIAN PROCESSES & LANDFORMS
 EOLIAN PROCESSES & LANDFORMS Wind can be an effective geomorphic agent under conditions of sparse vegetation & abundant unconsolidated sediment egs. hot & cold deserts, beaches & coastal regions, glacial
7.1 INTRODUCTION 7.2 OBJECTIVE
 7 LAND USE AND LAND COVER 7.1 INTRODUCTION The knowledge of land use and land cover is important for many planning and management activities as it is considered as an essential element for modeling and
MEMORANDUM FOR SWG
 MEMORANDUM FOR SWG-2007-1623 Subject: Jurisdictional Determination (JD) for SWG-2007-1623 on Interdunal Wetlands Adjacent to Traditional Navigable Waters (TNWs) Summary The U.S. Environmental Protection
NIDIS Intermountain West Drought Early Warning System April 18, 2017
 1 of 11 4/18/2017 3:42 PM Precipitation NIDIS Intermountain West Drought Early Warning System April 18, 2017 The images above use daily precipitation statistics from NWS COOP, CoCoRaHS, and CoAgMet stations.
NIDIS Intermountain West Drought Early Warning System January 15, 2019
 NIDIS Drought and Water Assessment NIDIS Intermountain West Drought Early Warning System January 15, 2019 Precipitation The images above use daily precipitation statistics from NWS COOP, CoCoRaHS, and
Mapping Earth. How are Earth s surface features measured and modeled?
 Name Mapping Earth How are Earth s surface features measured and modeled? Before You Read Before you read the chapter, think about what you know about maps Record your thoughts in the first column Pair
Case Study: Ecological Integrity of Grasslands in the Apache Highlands Ecoregion
 Standard 9: Screen all target/biodiversity element occurrences for viability or ecological integrity. Case Study: Ecological Integrity of Grasslands in the Apache Highlands Ecoregion Summarized from: Marshall,
Application of Remote Sensing and Global Positioning Technology for Survey and Monitoring of Plant Pests
 Application of Remote Sensing and Global Positioning Technology for Survey and Monitoring of Plant Pests David Bartels, Ph.D. USDA APHIS PPQ CPHST Mission Texas Laboratory Spatial Technology and Plant
Analysis of Road Sediment Accumulation to Monumental Creek using the GRAIP Method
 Analysis of Road Sediment Accumulation to Monumental Creek using the GRAIP Method Introduction (from http://www.neng.usu.edu/cee/faculty/dtarb/graip/#over): The Geomorphologic Road Analysis and Inventory
GIS Techniques for Avalanche Path Mapping and Snow Science Observations. By Douglas D. Scott AVALANCHE MAPPING/IDEA INTEGRATION
 GIS Techniques for Avalanche Path Mapping and Snow Science Observations GIS Techniques for Avalanche Path Mapping and Snow Science Observations. By Douglas D. Scott AVALANCHE MAPPING/IDEA INTEGRATION For
Land cover/land use mapping and cha Mongolian plateau using remote sens. Title. Author(s) Bagan, Hasi; Yamagata, Yoshiki. Citation Japan.
 Bagan, Hasi; Yamagata, Yoshiki. Citation Japan.") Title Land cover/land use mapping and cha Mongolian plateau using remote sens Author(s) Bagan, Hasi; Yamagata, Yoshiki International Symposium on "The Imp Citation Region Specific Systems". 6 Nove Japan.
Title Land cover/land use mapping and cha Mongolian plateau using remote sens Author(s) Bagan, Hasi; Yamagata, Yoshiki International Symposium on "The Imp Citation Region Specific Systems". 6 Nove Japan.
Shoreline Evolution: City of Hampton, Virginia Chesapeake Bay, Back River, and Hampton River Shorelines
 Shoreline Evolution: City of Hampton, Virginia Chesapeake Bay, Back River, and Hampton River Shorelines Virginia Insitute of Marine Science College of William & Mary Gloucester Point, Virginia September
Valley-Fill Sandstones in the Kootenai Formation on the Crow Indian Reservation, South-Central Montana
 DE-FG22-96BC14996--08 Valley-Fill Sandstones in the Kootenai Formation on the Crow Indian Reservation, South-Central Montana Quarterly Report April 1 - June 30, 1998 By David A. Lopez Work Performed Under
Characterization of an arid groundwater flow system using satellite imagery
 Characterization of an arid groundwater flow system using satellite imagery A. Barud-Zubillaga & D. Schulze-Makuch The University of Texas at El Paso, El Paso, United States of America ABSTRACT: This research
MAPPS 2012 Geospatial Products and Services Excellence Awards Awards Entry Form
 MAPPS 2012 Geospatial Products and Services Excellence Awards 2012 Awards Entry Form Please include a copy of this document with the project/product submission Entry Information Submission Number: 1741558
Physiographic Provinces (West, Ch. 13)
") Geology 229 Engineering Geology Lecture 13 Physiographic Provinces (West, Ch. 13) The definition of the term Physiography Physiography (n.) The science which treats of the earth's exterior physical features,
Geology 229 Engineering Geology Lecture 13 Physiographic Provinces (West, Ch. 13) The definition of the term Physiography Physiography (n.) The science which treats of the earth's exterior physical features,
Observations on Surface Water in the Seminary Fen in Spring, Prepared 6/4/13 by Sam Wetterlin; updated 7/28/13
 Observations on Surface Water in the Seminary Fen in Spring, 2013 Prepared 6/4/13 by Sam Wetterlin; updated 7/28/13 Ordinarily, a calcareous fen is primarily dependent on upwelling mineral-rich, oxygen-poor
Making Accurate Field Spectral Reflectance Measurements By Dr. Alexander F. H. Goetz, Co-founder ASD Inc., Boulder, Colorado, 80301, USA October 2012
 Making Accurate Field Spectral Reflectance Measurements By Dr. Alexander F. H. Goetz, Co-founder ASD Inc., Boulder, Colorado, 80301, USA October 2012 Introduction Accurate field spectral reflectance measurements
CHAPTER 7 PRODUCT USE AND AVAILABILITY
 CHAPTER 7 PRODUCT USE AND AVAILABILITY Julie Prior-Magee Photo from SWReGAP Training Site Image Library Recommended Citation Prior-Magee, J.S. 2007. Product use and availability. Chapter 7 in J.S. Prior-Magee,
Steve Pye LA /22/16 Final Report: Determining regional locations of reference sites based on slope and soil type. Client: Sonoma Land Trust
 Steve Pye LA 221 04/22/16 Final Report: Determining regional locations of reference sites based on slope and soil type. Client: Sonoma Land Trust Deliverables: Results and working model that determine
RESEARCH METHODOLOGY
 III. RESEARCH METHODOLOGY 3.1. Time and Research Area The field work was taken place in primary forest around Toro village in Lore Lindu National Park, Indonesia. The study area located in 120 o 2 53 120
The Road to Data in Baltimore
 Creating a parcel level database from high resolution imagery By Austin Troy and Weiqi Zhou University of Vermont, Rubenstein School of Natural Resources State and local planning agencies are increasingly
CAUSES FOR CHANGE IN STREAM-CHANNEL MORPHOLOGY
 CAUSES FOR CHANGE IN STREAM-CHANNEL MORPHOLOGY Chad A. Whaley, Department of Earth Sciences, University of South Alabama, MobileAL, 36688. E-MAIL: caw408@jaguar1.usouthal.edu The ultimate goal of this
Archaeological Predictive Modeling within the context of Paleo-river Terraces in the City of Prince George
 Archaeological Predictive Modeling within the context of Paleo-river Terraces in the City of Prince George Background The documented pre-contact archaeological record of the Interior Plateau of B.C. is
Lesson Plan for Santa Rita Experimental Range Vegetation Monitoring Martha Gebhardt, Outreach Coordinator
 Lesson Plan for Santa Rita Experimental Range Vegetation Monitoring Martha Gebhardt, Outreach Coordinator Objectives: Part 1: Students will learn about common plant species on SRER through vegetation monitoring
Describing Greater sage-grouse (Centrocercus urophasianus) Nesting Habitat at Multiple Spatial Scales in Southeastern Oregon
 Nesting Habitat at Multiple Spatial Scales in Southeastern Oregon") Describing Greater sage-grouse (Centrocercus urophasianus) Nesting Habitat at Multiple Spatial Scales in Southeastern Oregon Steven Petersen, Richard Miller, Andrew Yost, and Michael Gregg SUMMARY Plant
Describing Greater sage-grouse (Centrocercus urophasianus) Nesting Habitat at Multiple Spatial Scales in Southeastern Oregon Steven Petersen, Richard Miller, Andrew Yost, and Michael Gregg SUMMARY Plant
Sand Transport Paths in the Mojave Desert
 Sand Transport Paths in the Mojave Desert Lack of Monitoring Stations, Soil Analyses, and the Outdated Rule 403.2 Put Communities and the Environment at Risk Lucerne Valley MAC July 20, 2017 Pat Flanagan
1. PURPOSE 2. PERIOD OF PERFORMANCE
 Statement of Work Herbarium Voucher Collection Land Management Section, Environmental Security Department Marine Corps Installations West Marine Corps Base Camp Pendleton, California 1. PURPOSE The purpose
Purple Loosestrife Project Biocontrol Sites:
 Purple Loosestrife Project Biocontrol Sites: Interim results of a cooperative project between Michigan State University and Michigan Sea Grant Extension Photos, Maps and Layout by Jason K. Potter 2002
4.2 Tidal Wetlands. Phragmites Australis
 4.2 Tidal Wetlands Few topics elicit such strong emotions in Guilford as the current state of salt marshes. These marshes, more broadly known as tidal wetlands, are undergoing a transformation as sea level
USE OF RADIOMETRICS IN SOIL SURVEY
 USE OF RADIOMETRICS IN SOIL SURVEY Brian Tunstall 2003 Abstract The objectives and requirements with soil mapping are summarised. The capacities for different methods to address these objectives and requirements
Developing Spatial Awareness :-
 Developing Spatial Awareness :- We begin to exercise our geographic skill by examining he types of objects and features we encounter. Four different spatial objects in the real world: Point, Line, Areas
Poison vine (Derris elliptica)
") Poison vine (Derris elliptica) An Alien Plant Report Prepared by: Forest Starr, Kim Martz and Lloyd Loope United States Geological Survey Biological Resources Division In cooperation with: American Water
Poison vine (Derris elliptica) An Alien Plant Report Prepared by: Forest Starr, Kim Martz and Lloyd Loope United States Geological Survey Biological Resources Division In cooperation with: American Water
Detecting Landscape Changes in High Latitude Environments Using Landsat Trend Analysis: 2. Classification
 1 Detecting Landscape Changes in High Latitude Environments Using Landsat Trend Analysis: 2. Classification Ian Olthof and Robert H. Fraser Canada Centre for Mapping and Earth Observation Natural Resources
NIDIS Intermountain West Drought Early Warning System March 26, 2019
 NIDIS Intermountain West Drought Early Warning System March 26, 2019 The images above use daily precipitation statistics from NWS COOP, CoCoRaHS, and CoAgMet stations. From top to bottom, and left to right:
BASE MAPPING. Technical Approachs
 BASE MAPPING Technical Approachs STATEMENT OF THE PROBLEM A major stumbling block to the integration of remotely sensed data into existing GIS data base structures is the issue of positional accuracy of
Colorado Front Range Wildfires Situation Report #7 Monday, July 02, :15 AM (MDT)
") Colorado Front Range Wildfires Situation Report #7 Monday, July 02, 2012 10:15 AM (MDT) Mandatory evacuations for the Waldo Canyon fire have been reduced from 35,000 to 3,000. Remaining evacuations are
Colorado Front Range Wildfires Situation Report #7 Monday, July 02, 2012 10:15 AM (MDT) Mandatory evacuations for the Waldo Canyon fire have been reduced from 35,000 to 3,000. Remaining evacuations are
Climate Change Scenario Planning: A Tool for Managing Resources in an Era of Uncertainty
 Climate Change Scenario Planning: A Tool for Managing Resources in an Era of Uncertainty Leigh Welling Climate Change Coordinator National Park Service Natural Resource Stewardship & Science Mount Rainier
Waterbury Dam Disturbance Mike Fitzgerald Devin Rowland
 Waterbury Dam Disturbance Mike Fitzgerald Devin Rowland Abstract The Waterbury Dam was completed in October 1938 as a method of flood control in the Winooski Valley. The construction began in April1935
GIS Mapping for Hubbard Brook Experimental Forest A Service Learning Project for Plymouth Regional High School Environmental Science
 GIS Mapping for Hubbard Brook Experimental Forest A Service Learning Project for Plymouth Regional High School Environmental Science Hubbard Brook Experimental Forest [External Link], established in 1955
RANGE AND ANIMAL SCIENCES AND RESOURCES MANAGEMENT - Vol. II - Catchment Management A Framework for Managing Rangelands - Hugh Milner
 CATCHMENT MANAGEMENT A FRAMEWORK FOR MANAGING RANGELANDS Hugh Milner International Water Management Consultant, Australia Keywords: Rangeland management; catchments and watersheds; catchment management
P.R. SPRING AND HILL CREEK TAR SAND AREAS A RESOURCE ASSESSMENT (IN PROGRESS)
") P.R. SPRING AND HILL CREEK TAR SAND AREAS A RESOURCE ASSESSMENT (IN PROGRESS) presented by WALLY GWYNN - Utah Geological Survey at the Western U.S. Oil Sands Technology Transfer Meeting February 22, 2008
P.R. SPRING AND HILL CREEK TAR SAND AREAS A RESOURCE ASSESSMENT (IN PROGRESS) presented by WALLY GWYNN - Utah Geological Survey at the Western U.S. Oil Sands Technology Transfer Meeting February 22, 2008
To: Ross Martin, Lisa Stapleton From: Brad Lind Subject: Joint Funding Agreement with USGS for 2012 Imagery Date: March 14, 2012.
 To: Ross Martin, Lisa Stapleton From: Brad Lind Subject: Joint Funding Agreement with USGS for 2012 Imagery Date: March 14, 2012 Attached are two copies of the Joint Funding Agreement (JFA) between SanGIS
Placer Potential Map. Dawson L and U se P lan. Jeffrey Bond. Yukon Geological Survey
 Placer Potential Map Dawson L and U se P lan By Jeffrey Bond Yukon Geological Survey Dawson Land Use Plan Placer Potential Map 1.0 Introduction Placer mining has been an important economic driver within
A SURVEY OF HYDROCLIMATE, FLOODING, AND RUNOFF IN THE RED RIVER BASIN PRIOR TO 1870
 A SURVEY OF HYDROCLIMATE, FLOODING, AND RUNOFF IN THE RED RIVER BASIN PRIOR TO 1870 W. F. RANNIE (UNIVERSITY OF WINNIPEG) Prepared for the Geological Survey of Canada September, 1998 TABLE OF CONTENTS
CENSUS MAPPING WITH GIS IN NAMIBIA. BY Mrs. Ottilie Mwazi Central Bureau of Statistics Tel: October 2007
 CENSUS MAPPING WITH GIS IN NAMIBIA BY Mrs. Ottilie Mwazi Central Bureau of Statistics E-mail: omwazi@npc.gov.na Tel: + 264 61 283 4060 October 2007 Content of Presentation HISTORICAL BACKGROUND OF CENSUS
Lauren Jacob May 6, Tectonics of the Northern Menderes Massif: The Simav Detachment and its relationship to three granite plutons
 Lauren Jacob May 6, 2010 Tectonics of the Northern Menderes Massif: The Simav Detachment and its relationship to three granite plutons I. Introduction: Purpose: While reading through the literature regarding
2011 National Seasonal Assessment Workshop for the Eastern, Southern, & Southwest Geographic Areas
 2011 National Seasonal Assessment Workshop for the Eastern, Southern, & Southwest Geographic Areas On January 11-13, 2011, wildland fire, weather, and climate met virtually for the ninth annual National
USING GIS CARTOGRAPHIC MODELING TO ANALYSIS SPATIAL DISTRIBUTION OF LANDSLIDE SENSITIVE AREAS IN YANGMINGSHAN NATIONAL PARK, TAIWAN
 CO-145 USING GIS CARTOGRAPHIC MODELING TO ANALYSIS SPATIAL DISTRIBUTION OF LANDSLIDE SENSITIVE AREAS IN YANGMINGSHAN NATIONAL PARK, TAIWAN DING Y.C. Chinese Culture University., TAIPEI, TAIWAN, PROVINCE
every continent has an extensive dry region! " deserts are as much as 1/3 of Earth s surface!
 deserts! deserts! every continent has an extensive dry region! " deserts are as much as 1/3 of Earth s surface! Hollywood portrayal of vast stretches of sand dune! " Sahara has only 10% covered by sand!
Developed in Consultation with Florida Educators
 Developed in Consultation with Florida Educators Table of Contents Next Generation Sunshine State Standards Correlation Chart... 7 Benchmarks Chapter 1 The Practice of Science...................... 11
Technical Drafting, Geographic Information Systems and Computer- Based Cartography
 Technical Drafting, Geographic Information Systems and Computer- Based Cartography Project-Specific and Regional Resource Mapping Services Geographic Information Systems - Spatial Analysis Terrestrial
Landslide Computer Modeling Potential
 Landslide Computer Modeling Potential Michael D. Dixon, P.E. Civil Engineer Payette National Forest The Payette National Forest selected the Stability Index Mapping (SINMAP) model for use in identifying
APPENDIX B. NMFWRI Field Inventory Summary for Three L Canyon, pre-treatment (2008 and 2009) and post-treatment (2013)
 and post-treatment (2013)") SACRAMENTO MOUNTAINS WATERSHED STUDY APPENDIX B NMFWRI Field Inventory Summary for Three L Canyon, pre-treatment (2008 and 2009) and post-treatment (2013) These documents describe efforts and results from
SACRAMENTO MOUNTAINS WATERSHED STUDY APPENDIX B NMFWRI Field Inventory Summary for Three L Canyon, pre-treatment (2008 and 2009) and post-treatment (2013) These documents describe efforts and results from
Display data in a map-like format so that geographic patterns and interrelationships are visible
 Vilmaliz Rodríguez Guzmán M.S. Student, Department of Geology University of Puerto Rico at Mayagüez Remote Sensing and Geographic Information Systems (GIS) Reference: James B. Campbell. Introduction to
NR402 GIS Applications in Natural Resources. Lesson 9: Scale and Accuracy
 NR402 GIS Applications in Natural Resources Lesson 9: Scale and Accuracy 1 Map scale Map scale specifies the amount of reduction between the real world and the map The map scale specifies how much the
3 SHORELINE CLASSIFICATION METHODOLOGY
 3 SHORELINE CLASSIFICATION METHODOLOGY Introduction The ESI scale, as described in Section 2, categorizes coastal habitats in terms of their susceptibility to spilled oil, taking into consideration a number
Flowering Rush Hand Removal. Lake Minnetonka Pilot Program
 Flowering Rush Hand Lake Minnetonka Pilot Program Spring 2012 Survey Report Provided For the Minnehaha Creek Watershed District By Waterfront Restoration LLC & Blue Water Science May 31, Waterfront Restoration,
Trimble s ecognition Product Suite
 Trimble s ecognition Product Suite Dr. Waldemar Krebs October 2010 Trimble Geospatial in the Image Processing Chain Data Acquisition Pre-processing Manual/Pixel-based Object-/contextbased Interpretation
Lecture 5. GIS Data Capture & Editing. Tomislav Sapic GIS Technologist Faculty of Natural Resources Management Lakehead University
 Lecture 5 GIS Data Capture & Editing Tomislav Sapic GIS Technologist Faculty of Natural Resources Management Lakehead University GIS Data Input Surveying/GPS Data capture Facilitate data capture Final
ACTON COMMUNITY WIDE ARCHAEOLOGICAL RECONNAISSANCE SURVEY. Town of Acton and PAL, Inc.
 ACTON COMMUNITY WIDE ARCHAEOLOGICAL RECONNAISSANCE SURVEY Town of Acton and PAL, Inc. Objectives and Scope of Work Four phase study; (1. research, 2. draft report outline, resource protection bylaw, 3.
exposed has to the this soil lowest water salinity. However in the fall, following a lot of Underground
 How deep it collects from Background information for Data Analysis for Mass Audubon s Salt Marsh Science Project* We are measuring salinity at different depths to see what conditions Phragmites, and other
Plant Distribution in a Sonoran Desert City CAP LTER Data Explorations
 in a Sonoran Desert City CAP LTER Data Explorations Author: Ecology Explorers Team, adapted from data analysis by J. Walker and the CAP LTER 200 point survey Time: 15-30 minutes Grade Level: 9-12 Background:
Appendix E: Wetland Verification Exercise
 Appendix E: Wetland Verification Exercise Scientific Aquatic Services Applying science to the real world P.O. Box 751779 Gardenview 2047 Tel 011 616 7893 Fax 011 615 6240 www.sasenvironmental.co.za admin@sasenvironmental.co.za