Observations define abundance scale.
|
|
|
- Marcia McKenzie
- 6 years ago
- Views:
Transcription


1
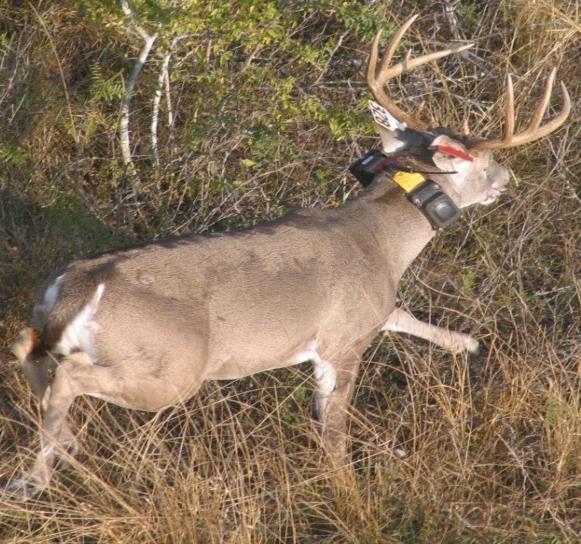
2 Observations define abundance scale. Burro Pasture Coyote Pasture Paisano Pasture
3

4 CREEM WS


5 Variance, Standard Error, Coefficient of Variation, Confidence Intervals

6 CREEM WS 6

7 CREEM WS 7

8 CREEM WS 8
9 CREEM WS 9

10 CREEM WS 10
11 CREEM WS 11

12 CREEM WS 12

13 CREEM WS 13

14 CREEM WS 14

15 CREEM WS 15

16 CREEM WS 16

17 CREEM WS 17

18 CREEM WS 18
19

20 CREEM WS 20
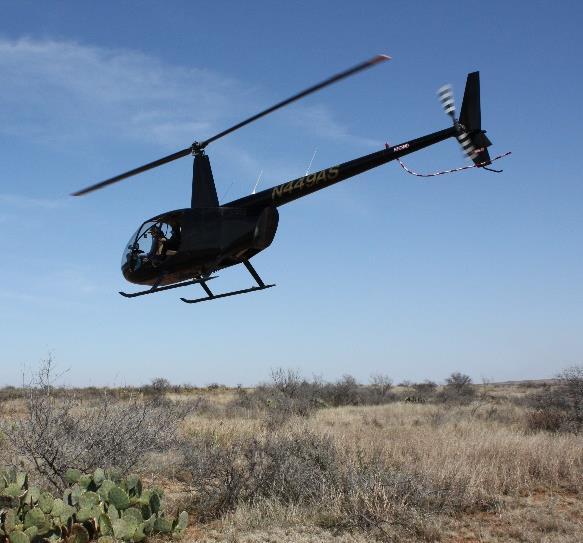
21 Survey Cost Estimated cost/acre based on transect spacing (yds.), speed (mph), and hourly operations cost. All estimated costs per acre include 10% for non-survey time (i.e., between transect flight, gas, etc.). Estimated Cost = $0.18/acre
22 CREEM WS 22
23 23 Burnham et al Estimating of density from line transect sampling of biological populations Wildlife Monographs. CREEM WS
24 CREEM WS 24
25 CREEM WS 25
26
27 Survey Design 1. Recommend at least observations per species 2. Recommend at least 20 transects 3. Determine % coverage (200 yds, 400 yds, 800 yds) 4. Systematically randomize lines within each sampling unit Trap Coyote Burro Paisano
28 Survey Design Obtaining reliable results from a distance sampling survey depends critically on good survey design. This relies upon the fundamental sampling principles of replication and randomization. Sufficient replicate lines or points ensure that variation in encounter rate can be adequately estimated. CREEM WS
29 Survey Design The lines or points should not be placed subjectively; rather a randomization scheme should be employed that gives all locations in the study region a known, non-zero probability of being covered by a transect (the coverage probability ). We recommend that a systematic survey design with a random start be used to afford better spatial coverage and lower variance. CREEM WS
30 Deer, Turkey, Nilgai Abundance Equations D = n 1 c Where: D = total deer n = # deer seen c = % coverage ((survey mi. * acres)/pasture acres) Unless stratified, the survey miles should include the good, the bad, and the ugly.
31 Survey Design Gradients
32 Survey Design Gradients
33 Survey Design Gradients
34 Survey Design Gradients
35 Survey Design Gradients
36 Survey Design Gradients
37 Survey Design Partial surveys are not recommended.
38 Survey Design Complete surveys are recommended. Current surveys should be able to answer future questions.

39 CREEM WS
40 CREEM WS 40
41 CREEM WS 41
42 CREEM WS 42
43 Stratification 43 CREEM WS
44 Stratification Global Survey season Division Ecoregion Stratum Pasture Sample Transect Observation Detection

45 What Is A Stratum Layer? A stratum layer is a distinct sampling unit that is uniquely named and surveyed separately. Stratum 1 Stratum 2 Stratum 3 Green Pasture 120 ac. Red Pasture 60 ac. Blue Pasture 80 ac.
46 What Is A Stratum Layer? Combine Small areas. Trap 20 ac. Combine Small areas Green 100 ac. Red 60 ac. Blue 80 ac. Green + Trap = 120 ac.
47 What Is A Global Layer? Multiple stratums that form a distinct sampling unit that is uniquely named and survey effort is combined. Stratum 1 Stratum 2 Black Pasture Yellow Pasture Global Layer = Green Pasture + Red Pasture + Blue Pasture + Black Pasture + Yellow Pasture Willacy County Stratum 3 Green Pasture Red Pasture Stratum 4 Stratum 5 Blue Pasture


48 Stratification

49 Stratification 4 Divisions 49

50 Stratification 38 Wildlife Management Units 50

51 Stratification 124 Pastures 51
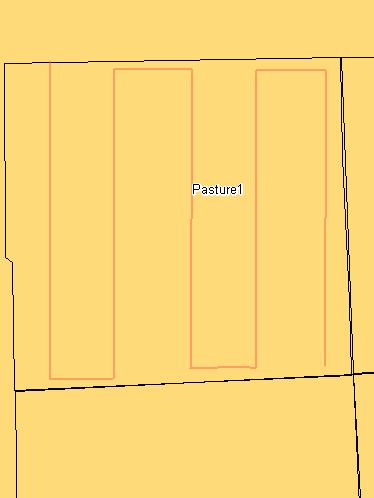
52 Post-Stratification Burro Pasture Coyote Pasture To decrease non-survey effort, survey property with one continuous transect and hover at each fenceline to end and start new transect. Paisano If comfortable with ArcGIS, collect single length transect, clip transects with Pasture intersect tool, calculate length, use join and relate tool to label sightings and transects.
53

54 Application of Survey Design GIS Facilitates In: Predetermining theoretical transect placement Systematically randomizing the transects (>20) Predetermining survey effort (60-70 observations) Enabling future surveys to be replicated Anticipating any problem segments It is critical that the lines be placed randomly with respect to the distribution of objects. Random line placement justifies the extrapolation of the sample statistics to the population of interest
 Use boundary to determine transect angle Use pasture boundary to clip excess effort Load transects on Garmin Numvi via")
55 Application of Survey Design Purchase XTools Package for ArcGIS Use Create Fishnet to design transect Use 400 yard transect spacing (50% coverage) Use boundary to determine transect angle Use pasture boundary to clip excess effort Load transects on Garmin Numvi via Mapwel
 to load Shapefiles onto Garmin GPS Use merge tool to load pasture boundary and transect shapefile Uniquely color each pasture and set zooming properties Set transect shapefile")
56 Application of Survey Design Use Mapwel ($100) to load Shapefiles onto Garmin GPS Use merge tool to load pasture boundary and transect shapefile Uniquely color each pasture and set zooming properties Set transect shapefile as major highway Load map to Garmin Nuvi. Print final survey map on 4x6 notecard and carry it with you during the survey. Mark off each transect as you complete them.

57 Equipment Arrangement Observer 1 Raw datasheet Observer 2 Pilot Navigator Database entry Garmin control Survey control 12V Outlet Important: Keep all lines clear of collective.
 to load Shapefiles onto Garmin GPS OR Step 1.")
58 Survey Design Step 1. Use GIS or CKWRI Database to design transects Step 2. Use Mapwel ($100) to load Shapefiles onto Garmin GPS OR Step 1. Ask pilot to fly the area in a uniform pattern


59 Design Field Map 59
Automated Survey Design
 Automated Survey Design Aim: Use geographic information system (GIS) within Distance to aid survey design and evaluate the properties of different designs See: Chapter 7 of Buckland et al. (2004) Advanced
Nested Frequency Plot Sample Design and Field Methods for Vegetation Monitoring
 1 Nested Frequency Plot Sample Design and Field Methods for Vegetation Monitoring Materials Plot frame Map of site showing boundaries and sampling point locations Compass GPS pre-loaded with sample points
2010 Wildlife Management Unit 347 moose
 2010 Wildlife Management Unit 347 moose Photo: Curtis Stambaugh Section Authors: Curtis Stambaugh and Corey Rasmussen Suggested Citation: Stambaugh, C., and C. Rasmussen. 2010. Wildlife Management Unit
Non-uniform coverage estimators for distance sampling
 Abstract Non-uniform coverage estimators for distance sampling CREEM Technical report 2007-01 Eric Rexstad Centre for Research into Ecological and Environmental Modelling Research Unit for Wildlife Population
2010 Wildlife Management Unit 347 moose
 2010 Wildlife Management Unit 347 moose Photo: Curtis Stambaugh Section Authors: Curtis Stambaugh and Corey Rasmussen Stambaugh, C., and C. Rasmussen. 2012. Wildlife Management Unit 347 moose. Pages 54-57.
2010 Wildlife Management Unit 358 moose
 2010 Wildlife Management Unit 358 moose Photo: Dave Stepnisky Section Authors: Dave Stepnisky and Robb Stavne Suggested Citation: Stepnisky, D., and R. Stavne. 2010. Wildlife Management Unit 358 moose.
Approach to Field Research Data Generation and Field Logistics Part 1. Road Map 8/26/2016
 Approach to Field Research Data Generation and Field Logistics Part 1 Lecture 3 AEC 460 Road Map How we do ecology Part 1 Recap Types of data Sampling abundance and density methods Part 2 Sampling design
Exercise 2: Working with Vector Data in ArcGIS 9.3
 Exercise 2: Working with Vector Data in ArcGIS 9.3 There are several tools in ArcGIS 9.3 used for GIS operations on vector data. In this exercise we will use: Analysis Tools in ArcToolbox Overlay Analysis
2013 Aerial Moose Survey Final Results
 2013 Aerial Moose Survey Final Results Glenn D. DelGiudice, Forest Wildlife Populations and Research Group Introduction Each year, we conduct an aerial survey in northeastern Minnesota in an effort to
Survey Protocols for Monitoring Status and Trends of Pollinators
 Survey Protocols for Monitoring Status and Trends of Pollinators This annex presents the bee monitoring protocols to be applied in the context of monitoring status and trends of pollinators in STEP sites.
Part 7: Glossary Overview
 Part 7: Glossary Overview In this Part This Part covers the following topic Topic See Page 7-1-1 Introduction This section provides an alphabetical list of all the terms used in a STEPS surveillance with
Yanbo Huang and Guy Fipps, P.E. 2. August 25, 2006
 Landsat Satellite Multi-Spectral Image Classification of Land Cover Change for GIS-Based Urbanization Analysis in Irrigation Districts: Evaluation in Low Rio Grande Valley 1 by Yanbo Huang and Guy Fipps,
VCS MODULE VMD0018 METHODS TO DETERMINE STRATIFICATION
 VMD0018: Version 1.0 VCS MODULE VMD0018 METHODS TO DETERMINE STRATIFICATION Version 1.0 16 November 2012 Document Prepared by: The Earth Partners LLC. Table of Contents 1 SOURCES... 2 2 SUMMARY DESCRIPTION
Vector Analysis: Farm Land Suitability Analysis in Groton, MA
 Vector Analysis: Farm Land Suitability Analysis in Groton, MA Written by Adrienne Goldsberry, revised by Carolyn Talmadge 10/9/2018 Introduction In this assignment, you will help to identify potentially
2010 Wildlife Management Unit 340 moose
 2010 Wildlife Management Unit 340 moose Photo: Shevenell Webb Section Authors: Dave Hobson, Kirby Smith, and Shevenell Webb Hobson, D., K. Smith, and S. Webb. 2012. Wildlife Management Unit 340 moose.
Invasive Species Geodatabase Presentation Central Florida Invasive Species Working Group (CFISWG)
") Invasive Species Geodatabase Presentation Central Florida Invasive Species Working Group (CFISWG) Information provided by: Orange County Environmental Protection Division Green PLACE Program HomeBud 27
Invasive Species Geodatabase Presentation Central Florida Invasive Species Working Group (CFISWG) Information provided by: Orange County Environmental Protection Division Green PLACE Program HomeBud 27
Evaluation of Three Surveys Assessing Prairie Dog Colonies in Northwest Kansas
 Evaluation of Three Surveys Assessing Prairie Dog Colonies in Northwest Kansas November, 2008 Matt Peek, Kansas Department of Wildlife and Parks, P.O. Box 1525, Emporia, KS 66801, (620) 342-0658, MattP@wp.state.ks.us
IMPLEMENTATION OF THE WHOOPING CRANE MONITORING PROTOCOL FALL/WINTER FINAL REPORT
 IMPLEMENTATION OF THE WHOOPING CRANE MONITORING PROTOCOL FALL/WINTER 2015 - FINAL REPORT Prepared by Dave Fehlhafer and Brian Peterson Ecological Solutions 203 W. Bartelt Ave Doniphan, NE 68832 February
GIS Tools and Techniques for Environmental Assessment of Pipeline Construction. Erik Danielson February 27, 2007
 GIS Tools and Techniques for Environmental Assessment of Pipeline Construction Erik Danielson February 27, 2007 Environmental Assessment Pipeline construction or replacement ESIA/FERC projects GIS & GPS
Sampling Methods and the Central Limit Theorem GOALS. Why Sample the Population? 9/25/17. Dr. Richard Jerz
 Sampling Methods and the Central Limit Theorem Dr. Richard Jerz 1 GOALS Explain why a sample is the only feasible way to learn about a population. Describe methods to select a sample. Define and construct
Source: Chapter 5: Errors in Chemical Analyses
 Source: Chapter 5: Errors in Chemical Analyses Measurements invariably involve errors and uncertainties. it is impossible to perform a chemical analysis that is totally free of errors or uncertainties
Exercise 2: Working with Vector Data in ArcGIS 9.3
 Exercise 2: Working with Vector Data in ArcGIS 9.3 There are several tools in ArcGIS 9.3 used for GIS operations on vector data. In this exercise we will use: Analysis Tools in ArcToolbox Overlay Analysis
LUCAS: A possible scheme for a master sampling frame. J. Gallego, MARS AGRI4CAST
 LUCAS: A possible scheme for a master sampling frame. J. Gallego, MARS AGRI4CAST Area frames of square segments Square segments on a classified image 2/16 Sampling farms through points farm a farm b farm
SUMMARY REPORT. 11 February Deer Distance Sampling Population Estimate. Town and Country, Missouri. White Buffalo, Inc.
 SUMMARY REPORT 11 February 2018 Deer Distance Sampling Population Estimate Town and Country, Missouri by White Buffalo, Inc. Introduction/Methods We used a population estimation method called Distance
GIS Workshop Data Collection Techniques
 GIS Workshop Data Collection Techniques NOFNEC Conference 2016 Presented by: Matawa First Nations Management Jennifer Duncan and Charlene Wagenaar, Geomatics Technicians, Four Rivers Department QA #: FRG
Integrating ArcGIS and Pictometry in the Classroom
 Integrating ArcGIS and Pictometry in the Classroom Scott Jeffrey, MS, GISP FAA Certified Remote suas Pilot Professor and Program Director Geospatial Applications Program and Surveying Program Community
Map My Property User Guide
 Map My Property User Guide Map My Property Table of Contents About Map My Property... 2 Accessing Map My Property... 2 Links... 3 Navigating the Map... 3 Navigating to a Specific Location... 3 Zooming
Flood Hazard Zone Modeling for Regulation Development
 Flood Hazard Zone Modeling for Regulation Development By Greg Lang and Jared Erickson Pierce County GIS June 2003 Abstract The desire to blend current digital information with government permitting procedures,
COMBINING ENUMERATION AREA MAPS AND SATELITE IMAGES (LAND COVER) FOR THE DEVELOPMENT OF AREA FRAME (MULTIPLE FRAMES) IN AN AFRICAN COUNTRY:
 FOR THE DEVELOPMENT OF AREA FRAME (MULTIPLE FRAMES) IN AN AFRICAN COUNTRY:") COMBINING ENUMERATION AREA MAPS AND SATELITE IMAGES (LAND COVER) FOR THE DEVELOPMENT OF AREA FRAME (MULTIPLE FRAMES) IN AN AFRICAN COUNTRY: PRELIMINARY LESSONS FROM THE EXPERIENCE OF ETHIOPIA BY ABERASH
COMBINING ENUMERATION AREA MAPS AND SATELITE IMAGES (LAND COVER) FOR THE DEVELOPMENT OF AREA FRAME (MULTIPLE FRAMES) IN AN AFRICAN COUNTRY: PRELIMINARY LESSONS FROM THE EXPERIENCE OF ETHIOPIA BY ABERASH
Review of Riparian Function Riparian Management Riparian Monitoring
 Review of Riparian Function Riparian Management Riparian Monitoring Water Shed Water Catchment Water catching creek Water shedding creek Properly functioning riparian area Properly Functioning Riparian
Assessing Large-Scale Spatial Distribution of Seagrasses in the Loxahatchee River
 Assessing Large-Scale Spatial Distribution of Seagrasses in the Loxahatchee River David Sabin & Albrey Arrington Wildpine Ecological Laboratory Loxahatchee River District Why Assess Seagrass? Seagrass
Instructions for using N-CAST ArcGIS Explorer
 Instructions for using N-CAST ArcGIS Explorer The N-CAST shapefiles can be used to map and analyze the data contained within the N-CAST database. N-CAST provides shapefiles for download in a file geodatabase
Mathematics 5 Worksheet 14 The Horizon
 Mathematics 5 Worksheet 14 The Horizon For the problems below, we will assume that the Earth is a sphere whose radius is 4,000 miles. Note that there are 5,280 feet in one mile. Problem 1. If a line intersects
SHOW ME THE DATA. FEMA Region 6 Community Assistance Visits Findings Collector
 SHOW ME THE DATA FEMA Region 6 Community Assistance Visits Findings Collector Roberto Ramirez, CFM / ASFPM June 4, 2015 Topics of Discussion Overview of CAV Findings Collection project Why a GIS Based
Sampling in Space and Time. Natural experiment? Analytical Surveys
 Sampling in Space and Time Overview of Sampling Approaches Sampling versus Experimental Design Experiments deliberately perturb a portion of population to determine effect objective is to compare the mean
High Speed / Commuter Rail Suitability Analysis For Central And Southern Arizona
 High Speed / Commuter Rail Suitability Analysis For Central And Southern Arizona Item Type Reports (Electronic) Authors Deveney, Matthew R. Publisher The University of Arizona. Rights Copyright is held
Applied Cartography and Introduction to GIS GEOG 2017 EL. Lecture-2 Chapters 3 and 4
 Applied Cartography and Introduction to GIS GEOG 2017 EL Lecture-2 Chapters 3 and 4 Vector Data Modeling To prepare spatial data for computer processing: Use x,y coordinates to represent spatial features
2009 WMU 525 Moose. Section Authors: Nathan Carruthers and Dave Moyles
 2009 WMU 525 Moose Section Authors: Nathan Carruthers and Dave Moyles Suggested Citation: Carruthers, N. and D. Moyles. WMU 525 Moose. Pages 78 83. In: N. Webb and R. Anderson. Delegated aerial ungulate
2 One-dimensional motion with constant acceleration
 2 One-dimensional motion with constant acceleration Experiment objectives: 1. Achieve a better understanding of how to solve position, velocity and acceleration problems in one-dimensional motion with
Designing line transect surveys for complex survey regions
 J. CETACEAN RES. MANAGE. 9(1):1 13, 2007 1 Designing line transect surveys for complex survey regions LEN THOMAS *, ROB WILLIAMS +# AND DOUG SANDILANDS ++ Contact e-mail: len@mcs.st-and.ac.uk ABSTRACT
Accessing and Using Indiana Traffic Data
 Accessing and Using Indiana Traffic Data Purdue Road School March 6, 2013 Presented by: Gregory Katter, PE Asset Planning Indiana Traffic Data 1. Overview of Traffic Data Collection Program 2. Accessing
Introduction to Geographic Information Systems (GIS): Environmental Science Focus
: Environmental Science Focus") Introduction to Geographic Information Systems (GIS): Environmental Science Focus September 9, 2013 We will begin at 9:10 AM. Login info: Username:!cnrguest Password: gocal_bears Instructor: Domain: CAMPUS
Introduction to Geographic Information Systems (GIS): Environmental Science Focus September 9, 2013 We will begin at 9:10 AM. Login info: Username:!cnrguest Password: gocal_bears Instructor: Domain: CAMPUS
Moose Stratified Block Census, Management Unit 8-5, Okanagan Region, February 2005
 Moose Stratified Block Census, Management Unit 8-5, Okanagan Region, February 2005 by Les W. Gyug, R.P.Bio. Okanagan Wildlife Consulting 3130 Ensign Way Westbank, B.C. V4T 1T9 Prepared for B.C. Ministry
Introduction to Survey Data Analysis
 Introduction to Survey Data Analysis JULY 2011 Afsaneh Yazdani Preface Learning from Data Four-step process by which we can learn from data: 1. Defining the Problem 2. Collecting the Data 3. Summarizing
BUILDING AN ASSET MANAGEMENT GEODATABASE FOR RANCHING. Matt Crawford, GISP
 BUILDING AN ASSET MANAGEMENT GEODATABASE FOR RANCHING Matt Crawford, GISP Introduction East Foundation Formed in 2007 Mission Research Education Outreach Properties Six ranches ~ 215,000 acres San Antonio
H IGHWAY 3 WILDLIFE MORTALITY
 Miistakis Institute for the Rockies H IGHWAY 3 WILDLIFE MORTALITY CONTENTS Introduction 1 Methods 2 Data Limitations 3 Results 3 Discussion 8 Special points of interest: The analysis includes mortality
These modules are covered with a brief information and practical in ArcGIS Software and open source software also like QGIS, ILWIS.
 Online GIS Training and training modules covered are: 1. ArcGIS, Analysis, Fundamentals and Implementation 2. ArcGIS Web Data Sharing 3. ArcGIS for Desktop 4. ArcGIS for Server These modules are covered
ANGLO-CHINESE JUNIOR COLLEGE MATHEMATICS DEPARTMENT. Paper 1 18 August 2016 JC 2 PRELIMINARY EXAMINATION Time allowed: 3 hours
 ANGLO-CHINESE JUNIOR COLLEGE MATHEMATICS DEPARTMENT MATHEMATICS Higher 1 8864 / 01 Paper 1 18 August 016 JC PRELIMINARY EXAMINATION Time allowed: 3 hours Additional Materials: List of Formulae (MF15) READ
Introduction to Uncertainty and Treatment of Data
 Introduction to Uncertainty and Treatment of Data Introduction The purpose of this experiment is to familiarize the student with some of the instruments used in making measurements in the physics laboratory,
User Guide: RADON POTENTIAL DATASET - England and Wales
 User Guide: RADON POTENTIAL DATASET - England and Wales This document provides information for users of the joint HPA-BGS RADON POTENTIAL DATASET for England and Wales. 1. Background to joint Health Protection
2018 Aerial Moose Survey
 2018 Aerial Moose Survey Glenn D. DelGiudice, Forest Wildlife Populations and Research Group Introduction Each year we conduct an aerial survey in northeastern Minnesota to estimate the moose (Alces americanus)
GIS 520 Data Cardinality. Joining Tabular Data to Spatial Data in ArcGIS
 GIS 520 Data Cardinality Joining Tabular Data to Spatial Data in ArcGIS Joining Tabular Data to Spatial Data in ArcGIS Outline Working with Zip Code Data Data Cardinality Issues Exploring Data Format Requirements
GIS APPLICATIONS IN SOIL SURVEY UPDATES
 GIS APPLICATIONS IN SOIL SURVEY UPDATES ABSTRACT Recent computer hardware and GIS software developments provide new methods that can be used to update existing digital soil surveys. Multi-perspective visualization
Modeling Urban Sprawl: from Raw TIGER Data with GIS
 Modeling Urban Sprawl: from Raw TIGER Data with GIS Brady Foust University of Wisconsin-Eau Claire Lisa Theo University of Wisconsin-Stevens Point Modeling Urban Sprawl 1 Problem How to model & predict
DUC 2017 Fieldwork Overview: Akaitcho Wetland Mapping Project
 DUC 2017 Fieldwork Overview: Akaitcho Wetland Mapping Project Prepared for MobileDemand Project Managers: Kevin Smith, Al Richard Lead Technical Analyst: *Michael Merchant Support Analysts: Becca Warren,
Lecturer: Dr. Adote Anum, Dept. of Psychology Contact Information:
 Lecturer: Dr. Adote Anum, Dept. of Psychology Contact Information: aanum@ug.edu.gh College of Education School of Continuing and Distance Education 2014/2015 2016/2017 Session Overview In this Session
Predictive Modelling of Ag, Au, U, and Hg Ore Deposits in West Texas Carl R. Stockmeyer. December 5, GEO 327G
 Predictive Modelling of Ag, Au, U, and Hg Ore Deposits in West Texas Carl R. Stockmeyer December 5, 2013 - GEO 327G Objectives and Motivations The goal of this project is to use ArcGIS to create models
What is sampling? shortcut whole population small part Why sample? not enough; time, energy, money, labour/man power, equipment, access measure
 What is sampling? A shortcut method for investigating a whole population Data is gathered on a small part of the whole parent population or sampling frame, and used to inform what the whole picture is
Analysis of Change in Land Use around Future Core Transit Corridors: Austin, TX, Eric Porter May 3, 2012
 Analysis of Change in Land Use around Future Core Transit Corridors: Austin, TX, 1990-2006 PROBLEM DEFINITION Eric Porter May 3, 2012 This study examines the change in land use from 1990 to 2006 in the
SoilView: Development of a Custom GIS Application for Publishing Soil Surveys
 SoilView: Development of a Custom GIS Application for Publishing Soil Surveys Allan Johnson and Mike Wigginton Abstract Currently, digital soils information can be obtained from many sources. Numerous
Field data acquisition
 Lesson : Primary sources Unit 3: Field data B-DC Lesson / Unit 3 Claude Collet D Department of Geosciences - Geography Content of Lesson Unit 1: Unit : Unit 3: Unit 4: Digital sources Remote sensing Field
Lecture 6 - Raster Data Model & GIS File Organization
 Lecture 6 - Raster Data Model & GIS File Organization I. Overview of Raster Data Model Raster data models define objects in a fixed manner see Figure 1. Each grid cell has fixed size (resolution). The
Safety in Numbers SKYWATCH 497. The affordable original.
 SKYWATCH 497 Safety in Numbers The affordable original. For over 10 years, pilots have trusted SkyWatch Collision Avoidance Systems to help them fly safely. SkyWatch was the first Active Collision Avoidance
Hydroacoustic survey and bathymetric map creation for Brant Lake, New York
 Hydroacoustic survey and bathymetric map creation for Brant Lake, New York Holly A. Waterfield CLM 1 INTRODUCTION Brant Lake is located in Warren County, New York, within the bounds of the Adirondack Park.
Landmark LRM. MM and RefPts can be same or different
 1 2 This project began in the fall of 2005. At the time CDOT had three different business units maintaining different LRS s. That is, the beginning and ending reference points and the measured length of
SEASONAL AGRICULTURE SURVEY (SAS) The Overview of the Multiple Frame Sample Survey in Rwanda
 The Overview of the Multiple Frame Sample Survey in Rwanda") SEASONAL AGRICULTURE SURVEY (SAS) The Overview of the Multiple Frame Sample Survey in Rwanda Sébastien MANZI Director of Economic Statistics December 16, 2013 National Institute of Statistics of Rwanda
SEASONAL AGRICULTURE SURVEY (SAS) The Overview of the Multiple Frame Sample Survey in Rwanda Sébastien MANZI Director of Economic Statistics December 16, 2013 National Institute of Statistics of Rwanda
Introduction. Project Summary In 2014 multiple local Otsego county agencies, Otsego County Soil and Water
 Introduction Project Summary In 2014 multiple local Otsego county agencies, Otsego County Soil and Water Conservation District (SWCD), the Otsego County Planning Department (OPD), and the Otsego County
ArcGIS Pro: Essential Workflows STUDENT EDITION
 ArcGIS Pro: Essential Workflows STUDENT EDITION Copyright 2018 Esri All rights reserved. Course version 6.0. Version release date August 2018. Printed in the United States of America. The information contained
Task 1: Start ArcMap and add the county boundary data from your downloaded dataset to the data frame.
 Exercise 6 Coordinate Systems and Map Projections The following steps describe the general process that you will follow to complete the exercise. Specific steps will be provided later in the step-by-step
This week s topics. Week 6. FE 257. GIS and Forest Engineering Applications. Week 6
 FE 257. GIS and Forest Engineering Applications Week 6 Week 6 Last week Chapter 8 Combining and splitting landscape features and merging GIS databases Chapter 11 Overlay processes Questions? Next week
ROAD SEDIMENT ASSESSMENT & MODELING: KOOTENAI-FISHER TMDL PLANNING AREA ROAD GIS LAYERS & SUMMARY STATISTICS
 ROAD SEDIMENT ASSESSMENT & MODELING: KOOTENAI-FISHER TMDL PLANNING AREA ROAD GIS LAYERS & SUMMARY STATISTICS Prepared by: ATKINS Water Resources Group 820 North Montana Avenue Helena, MT 59601 November
The Road to Data in Baltimore
 Creating a parcel level database from high resolution imagery By Austin Troy and Weiqi Zhou University of Vermont, Rubenstein School of Natural Resources State and local planning agencies are increasingly
Comparison of. Systematic Unal igned Sampling Designs. For Estimating Land Uses SITI ZABEDAH AMRI. A Research Paper. submitted to
 Comparison of Systematic Unal igned Sampling Designs For Estimating Land Uses by SITI ZABEDAH AMRI A Research Paper submitted to THE DEPARTMENT OF GEOGRAPHY in partial fulfillment of the requirements for
Final Group Project Paper. Where Should I Move: The Big Apple or The Lone Star State
 Final Group Project Paper Where Should I Move: The Big Apple or The Lone Star State By: Nathan Binder, Shannon Scolforo, Kristina Conste, Madison Quinones Main Goal: Determine whether New York or Texas
Applying GIS Data to Radar Video Maps Air Traffic Control Towers
 Applying GIS Data to Radar Video Maps Air Traffic Control Towers National Aeronautical Charting Group (NACG) Silver Spring, MD Introduction Background Functions, History, Facts/Stats Mapping Environment
High-Throughput Protein Quantitation Using Multiple Reaction Monitoring
 High-Throughput Protein Quantitation Using Multiple Reaction Monitoring Application Note Authors Ning Tang, Christine Miller, Joe Roark, Norton Kitagawa and Keith Waddell Agilent Technologies, Inc. Santa
Geodatabase Management Pathway
 Geodatabase Management Pathway Table of Contents ArcGIS Desktop II: Tools and Functionality 3 ArcGIS Desktop III: GIS Workflows and Analysis 6 Building Geodatabases 8 Data Management in the Multiuser Geodatabase
Louisiana Transportation Engineering Conference. Monday, February 12, 2007
 Louisiana Transportation Engineering Conference Monday, February 12, 2007 Agenda Project Background Goal of EIS Why Use GIS? What is GIS? How used on this Project Other site selection tools I-69 Corridor
Taking into account sampling design in DAD. Population SAMPLING DESIGN AND DAD
 Taking into account sampling design in DAD SAMPLING DESIGN AND DAD With version 4.2 and higher of DAD, the Sampling Design (SD) of the database can be specified in order to calculate the correct asymptotic
Module 4 Approaches to Sampling. Georgia Kayser, PhD The Water Institute
 Module 4 Approaches to Sampling Georgia Kayser, PhD 2014 The Water Institute Objectives To understand the reasons for sampling populations To understand the basic questions and issues in selecting a sample.
Visualization of Origin- Destination Commuter Flow Using CTPP Data and ArcGIS
 Visualization of Origin- Destination Commuter Flow Using CTPP Data and ArcGIS Research & Analysis Department Southern California Association of Governments 2015 ESRI User Conference l July 23, 2015 l San
LAKE SURVEY REPORT. Fisheries Management. DOW Number: Survey ID Date: 07/31/2017. Lake Identification. Lake Location. Legal Descriptions
 Fisheries Management LAKE SURVEY REPORT Lake Name: Kroon Survey Type: Targeted Survey DOW Number: 13-0013-00 Survey ID Date: 07/31/2017 Lake Identification Alternate Lake Name: N/A Primary Lake Class ID:
ESRM 304. Environmental and Resource Assessment. Final Exam Hints & Helps
 ESRM 304 Environmental and Resource Assessment Final Exam Hints & Helps ESRM 304 Final Exam Hints! The exam will contain up to 9 sections of : Short Answers, Calculations, Definitions, Multiple Choice,
NJDOT Pedestrian Safety Analysis Tool 2015 GIS T Conference
 NJDOT Pedestrian Safety Analysis Tool 2015 GIS T Conference NJDOT Pedestrian Safety Analysis Tool Justin Furch GIT Department Manager Michael Baker International Pedestrian Safety in NJ: Has the highest
One of the many strengths of a GIS is that you can stack several data layers on top of each other for visualization or analysis. For example, if you
 One of the many strengths of a GIS is that you can stack several data layers on top of each other for visualization or analysis. For example, if you overlay a map of the habitat for an endangered species
GIS CONCEPTS ARCGIS METHODS AND. 2 nd Edition, July David M. Theobald, Ph.D. Natural Resource Ecology Laboratory Colorado State University
 GIS CONCEPTS AND ARCGIS METHODS 2 nd Edition, July 2005 David M. Theobald, Ph.D. Natural Resource Ecology Laboratory Colorado State University Copyright Copyright 2005 by David M. Theobald. All rights
A Driving Simulation Based Study on the Effects of. Road Marking Luminance Contrast on Driving Safety. Yong Cao, Jyh-Hone Wang
 A Driving Simulation Based Study on the Effects of Road Marking Luminance Contrast on Driving Safety Yong Cao, Jyh-Hone Wang Department of Industrial and Manufacturing Engineering University of Rhode Island,
Part I. Sampling design. Overview. INFOWO Lecture M6: Sampling design and Experiments. Outline. Sampling design Experiments.
 Overview INFOWO Lecture M6: Sampling design and Experiments Peter de Waal Sampling design Experiments Department of Information and Computing Sciences Faculty of Science, Universiteit Utrecht Lecture 4:
NC Streambed Mapping Project Issue Paper
 ISSUE 1: The Western North Carolina Drainage Area Requirement Issue Several inquiries and discussions in regard to the determination of the 6-acre drainage area requirement as the upstream limit have been
The Pesticide Stewardship Alliance February 21-23, 23, Randy Hale NAAREF President Hale Dusting Service, Inc. Banquete, TX
 The Pesticide Stewardship Alliance February 21-23, 23, 2010 Randy Hale NAAREF President Hale Dusting Service, Inc. Banquete, TX Background President - National Agricultural Aviation Research and Education
Vortex G4 BDC Reticle
 MANUAL Vortex G4 BDC Reticle You have purchased a Vortex riflescope equipped with the G4 BDC reticle. This exclusive reticle has been designed to minimize the need for guessing bullet hold-over at long
The data for this lab comes from McDonald Forest. We will be working with spatial data representing the forest boundary, streams, roads, and stands.
 GIS LAB 6 Using the Projection Utility. Converting Data to Oregon s Approved Lambert Projection. Determining Stand Size, Stand Types, Road Length, and Stream Length. This lab will ask you to work with
Welcome to NR502 GIS Applications in Natural Resources. You can take this course for 1 or 2 credits. There is also an option for 3 credits.
 Welcome to NR502 GIS Applications in Natural Resources. You can take this course for 1 or 2 credits. There is also an option for 3 credits. The 1st credit consists of a series of readings, demonstration,
i-tree Eco Random Plots Workbook: Pre - Stratification Tips red green
 i-tree Eco Random Plots Workbook: Pre - Stratification These instructions help users of all skill levels create random, pre-stratified UFORE sample points and their associated UFORE-required data within
GIS Level 2. MIT GIS Services
 GIS Level 2 MIT GIS Services http://libraries.mit.edu/gis Email: gishelp@mit.edu TOOLS IN THIS WORKSHOP - Definition Queries - Create a new field in the attribute table - Field Calculator - Add XY Data
Sampling: What you don t know can hurt you. Juan Muñoz
 Sampling: What you don t know can hurt you Juan Muñoz Outline of presentation Basic concepts Scientific Sampling Simple Random Sampling Sampling Errors and Confidence Intervals Sampling error and sample
Creating a Pavement Management System Using GIS
 Christopher Castruita PPD 631 Prof. Barry Waite & Prof. Bonnie Shrewsbury Creating a Pavement Management System Using GIS Problem Definition As is the case with many cities, the city of La Cañada Flintridge
Laboratory Exercise X Most Dangerous Places to Live in the United States Based on Natural Disasters
 Brigham Young University BYU ScholarsArchive Engineering Applications of GIS - Laboratory Exercises Civil and Environmental Engineering 2016 Laboratory Exercise X Most Dangerous Places to Live in the United
GIS for Integrated Pest Management. Christina Hailey. Abstract:
 GIS for Integrated Pest Management Christina Hailey Abstract: At its formation in 1965, Harris County Mosquito Control (Houston, Texas) (HCMC) was primarily involved in the prevention and control of mosquito-borne
OECD QSAR Toolbox v.3.0
 OECD QSAR Toolbox v.3.0 Step-by-step example of how to categorize an inventory by mechanistic behaviour of the chemicals which it consists Background Objectives Specific Aims Trend analysis The exercise