High Speed / Commuter Rail Suitability Analysis For Central And Southern Arizona
|
|
|
- Martin McBride
- 5 years ago
- Views:
Transcription
1 High Speed / Commuter Rail Suitability Analysis For Central And Southern Arizona Item Type Reports (Electronic) Authors Deveney, Matthew R. Publisher The University of Arizona. Rights Copyright is held by the author. Digital access to this material is made possible by the University Libraries, University of Arizona. Further transmission, reproduction or presentation (such as public display or performance) of protected items is prohibited except with permission of the author. Download date 06/07/ :41:01 Link to Item
2 HIGH SPEED / COMMUTER RAIL SUITABILITY ANALYSIS FOR CENTRAL AND SOUTHERN ARIZONA By MATTHEW R. DEVENEY MASTER OF SCIENCE GEOGRAPHIC INFORMATION SYSTEMS TECHNOLOGY FINAL PROJECT THE UNIVERSITY OF ARIZONA 2015
3 ACKNOWLEDGMENTS I would like to thank all of my past employers and supervisors that gave me the opportunity to succeed as much as my own potential would allow, and more importantly, all of those employers that showed me the true meaning of hard work and the feeling of accomplishment. As I would not be writing this without their support, I would like to thank my parents for their love and support. 2
4 TABLE OF CONTENTS page ACKNOWLEDGMENTS... 2 ABSTRACT... 4 INTRODUCTION... 5 Background... 5 METHODS... 6 ANALYSIS... 9 Right-of-Way Identification... 9 Station Area Identification Route Identification RESULTS Right-of-Way Identification Station Area Identification Route Identification CONCLUSTIONS LIST OF REFERENCES
5 ABSTRACT Current transportation methods within the Central Arizona region revolve primarily around automobiles. In order for the region to become more economically resilient and environmentally sustainable, alternative transportation methods must be considered. One such alternative that has shown great promise in other regions of the United States is rail transport. Rail transport, including commuter rail or high speed rail, has proven to not only be an effective alternative to automobile transport, but also as a more environmentally sustainable transportation option. The I-11 Super Corridor study, a part of the University of Arizona s Sustainable City Project 2014, applied next generation urban planning design ideas to the planned Interstate 11 corridor, a major transportation artery that will connect Mexico and Canada. This study inspired this project s focus on the concept of identifying suitable routes for new transportation infrastructure within the central and southern Arizona regions. Through the incorporation of commuter or high speed rail within central and southern Arizona, a more resilient regional economy and environment can be created. The previous I-11 Super Corridor study presented the incorporation of different regional factors, including population density and economic statistics, to determine suitable routes for future transportation corridors. This project integrates the utilization of specific local and regional data and advanced GIS analysis to determine suitable routes for new rail transport corridors within Maricopa, Pinal and Pima Counties. 4
6 INTRODUCTION Background Current transportation methods within the Central Arizona region revolve primarily around automobiles. In order for the region to become more economically resilient and environmentally sustainable, alternative transportation methods must be considered. One such alternative that has shown great promise in other regions of the United States is rail transport. Rail transport, including commuter rail or high speed rail, has proven to not only be an effective alternative to automobile transport, but also as a more environmentally sustainable transportation option. The I-11 Super Corridor study, a part of the Sustainable City Project 2014, conducted by the University of Arizona was consulted for this project. The study focused on taking infrastructure to the next level, and applying next generation ideas to a real world test case, the planned Interstate 11 corridor, a major transportation artery that will connect Mexico and Canada. This study inspired this projects focus on the concept of identifying suitable routes for new transportation infrastructure within the central and southern Arizona regions. By incorporating commuter or high speed rail within central and southern Arizona, a more resilient regional economy and environment can be created. The I-11 Super Corridor study presented the incorporation of different regional factors, including population density and economic statistics, to determine suitable routes for future transportation corridors. Through the use of GIS, this project focuses on the utilization of specific local and regional data to determine suitable routes for new rail transport corridors within Maricopa, Pinal and Pima Counties. 5
7 METHODS To identify suitable areas for future transportation infrastructure, key factors were identified that would define what the term suitable would refer to. Within this project, suitability was determined for not only future rights-of-way, but also for effective station area locations. Suitability for possible rights-of-way was determined using the following factors: Noise pollution Noise pollution near residential areas was a primary concern within this project and was minimized by identifying a minimum Euclidean distance surrounding residential uses as unsuitable. Soils Suitable soils were identified as those with; a moderate or low corrosiveness to concrete, low or moderate corrosiveness to steel and drainage defined as somewhat excessively drained, somewhat well drained or well drained defined by the Natural Resources Conservation Service. Land uses All land uses that did not include Industrial were defined as being unsuitable. Conservation land All conservation land was isolated and defined as unsuitable for right-of-way development. Elevation and grades Elevation data was collected for the study area and grades of 5% or less would be considered suitable. Existing interstate rights-of-way Given the possibility for right-of-way improvement, existing Interstate rights-of-way are defined as suitable. 6
8 Existing railroad rights-of-way In a similar way, given the possibility for right-of-way improvement, existing railroad rights-of-way are defined as suitable. Similar to suitable areas for future rights-of-way, future station areas were defined by the following factors: Land uses All land uses that did not include Industrial were defined as being unsuitable. Population Density Areas with a high population density were favored over those with less. Existing interstate rights-of-way Given the possibility for right-of-way improvement, existing Interstate rights-of-way are defined as suitable. Existing railroad rights-of-way In a similar way, given the possibility for right-of-way improvement, existing railroad rights-of-way are defined as suitable. Transportation Connectivity Areas which include the possibility of connection to as many other forms of transportation as possible were defined as more suitable than those with less. Based on the factors listed above and the requirements of each, areas within the study area are determined as either suitable or non-suitable on a scale from 1 to 9. By isolating these specific criteria, one can begin to uncover suitable and unsuitable areas for infrastructure development. By isolating each defined factor and then overlaying each on top of each other, and by applying a weight to each, one can further define areas that meet all criteria for each infrastructure item, rights-of-way and station areas. 7
9 The extraction of only the highest values from these overlays was then used to identify suitable route and station location options. The data that make up the layers that are used in this analysis include; residential parcels, soil survey data, existing land use, areas of land conservation, elevation data, locations of interstates and locations of railroads. All of this data was collected for all of the three counties in the study area, Maricopa, Pinal and Pima. Given the extent of the study area, all data was converted to UTM Zone 12N. 8
10 ANALYSIS Analysis of data was done on an individual basis for each factor used to determine suitability for future rights of way and station areas. The results of these individual analyses are then combined utilizing a weighted analysis. Upon the completion of these overlays, the highest values were extracted and utilized to determine options for future routes. Noise pollution Right-Of-Way Identification In order to ensure that residential areas would not be affected by the possible noise created by a high speed rail or commuter rail right-of-way, residential parcels within the study area needed to be identified. To do this, parcel data was collected from the Maricopa Association of Governments, Pinal County and Pima County. Residential parcels for Maricopa and Pima Counties were separated using the Select by Attribute tool that identified all residential land use codes within each data set. Given the data available, specific parcel-level land use code identification was not available for Pinal County; however, the Select by Location tool was used with the existing generalized land use data to identify all residential parcels in Pinal County. Residential parcels for all three counties were then merged together using the Merge Tool into a single dataset that could be used in the regional analysis. The Euclidean Distance tool was used to create a raster defining distances from all residential parcels in the study area. The resulting distances were reclassified to define suitable and unsuitable distances from existing residential areas for future rights-of-way on a scale from 1-9, 9 representing the most suitable distance. 9
11 Soils In order to identify suitable soils for a future right-of-way, soils data (soil surveys) for the study area was collected from the USGS Natural Resources Conservation Service (NRCS). Twenty-four (24) individual shapefiles make up the soils for the study area. In order to utilize these files to identify corrosiveness and drainage, the component table containing several different attributes, provided by NRCS, was joined to these files. The files were then exported as new feature classes containing the joined data into a geodatabase. These files were then merged together using the Merge tool. As stated earlier, suitable soils were identified as those with; a moderate or low corrosiveness to concrete, low or moderate corrosiveness to steel and drainage defined as somewhat excessively drained, somewhat well drained or well drained defined by NRCS. A new attribute field was added to identify a suitability score. Using the select by attributes tool, only soils meeting all of the above conditions were selected and exported into a new feature class. All of these records were given a suitability score of 9, while all of the others received a 1. The Feature to Raster tool was then used to create a raster identifying suitable soils. The suitability score attribute was used as the Value field for this process. Land uses For the purposes of this project, industrial land uses were defined as being suitable for future rights-of-way. Existing land use data for the study area was collected from the Maricopa Association of Governments, Pinal County and Pima County. Utilizing select by attributes for each, industrial features were exported into individual shapefiles and combined using the Merge tool into a new feature class. In 10
12 order to identify areas outside of these industrial uses within the study area, this feature class was then combined with the study area using the Union tool. The feature to raster tool was then used to create a raster that identified industrial uses within the study area. The reclassify tool was then used to apply a value of 9 to industrial areas and a value of 1 to non industrial areas. Tribal Land In order to ensure that a future right-of-way does not encroach on tribal lands, these lands were identified. The boundaries of all tribal lands within the study area were collected from AZGEO, the Arizona State GIS Clearinghouse created by the Arizona State Cartographer s Office. The boundaries of all tribes within Arizona were included in the provided layer package. These were then clipped, using the Clip tool, to the study area, preserving only those tribal lands within the study area. The Union tool was then used to combine tribal lands and the study area in order to identify those lands that were not tribal. The Feature to Raster tool was then used to transform the new combined features into a raster that would identify tribal and non tribal lands. The Reclassify tool was then used to assign tribal lands a value of 1 and non tribal lands a value of 9. Conservation land To ensure the preservation of lands that has been set aside for conservation, these lands needed to be identified. These boundaries were gathered in a layer package format from AZGEO for the entire state of Arizona. The boundaries included in this layer package were then clipped to the study area using the Clip tool and combined with the study area using the Union tool so that 11
13 both conservation and non conservation land could be identified. The Feature to Raster tool was then used to transform the data into a raster that could then be classified. The Reclassify tool was then used to apply a value of 1 to conservation lands and a value of 9 to non conservation lands. Elevation and grades Any type of rail transportation is limited in the grade that can be traversed. For the purposes of this project, a grade of 7% is considered the absolute maximum that would be considered suitable. A digital elevation model (DEM) for the State of Arizona was collected from the University of Arizona and utilized for this process. Utilizing the extract by mask tool, the DEM was clipped to include only those elevations within the study area. The slope tool was then used to calculate the slope for all elevations using percent rise as the output measurement. This result was then reclassified using the reclassify tool in order to identify suitable and non suitable grades. Nine (9) classes were then created manually by inputting a grade of 1% for a value of 9, 2% for a value of 8, etc. The least suitable value of 1 contains grades of 8% and above. Existing interstate rights-of-way The purchase of lands for new rights-of-way can be highly expensive and therefore, the inclusion of existing rights-of-way within this analysis was highly important. Existing interstates for the State of Arizona were gathered from AZGEO in a layer package format. This layer was then clipped the study area, using the Clip tool. The Euclidean Distance tool was then used to define all areas within the study area a distance value from the existing right-of-way. Suitable values were then defined using the Reclassify 12
14 tool, creating 9 classes. Each class was defined in intervals of 50 feet, value 9 defined as 50ft, value 8 as 100ft, etc. Value 1 was defined as 450ft and above. Existing railroad rights-of-way Similarly, utilizing existing railroad rights-of-way can also be highly cost effective and therefore, have also been included in this analysis. Existing railroads were gathered from AZGEO as a layer package. These existing railroads were then clipped to the study area using the Clip tool. The Euclidean Distance tool was then used to define all areas within the study area a distance value from the existing right-of-way. Suitable values were then defined using the Reclassify tool, creating 9 classes. As with existing interstates, each class was defined in intervals of 50 feet, value 9 defined as 50ft, value 8 as 100ft, etc. Value 1 was defined as 450ft and above. Weighted Overlay The Weighted Overlay tool was then used, including all of the outputs above. The applied weights for each output were as follows: Residential: 15%, Soils: 15%, Elevation: 15%, Land Use: 5%, Tribal Land: 10%, Preserve Land: 10%, Existing Rail: 15%, Existing Interstate: 15%. The output was then symbolized to represent suitability based on the 1-9 value. Station Areas Identification All of the factors included within the right-of-way analysis were utilized to identify station areas. However, two additional factors were added to the analysis process to identify suitable areas for station areas. These factors include population density and transportation connectivity. Residential Density 13
15 In order to calculate residential density, residential parcels, previously created for the Noise Pollution sub objective, were utilized for this analysis. Utilizing the residential parcels feature class, the Feature to Point tool was utilized to transform each parcel into a single point. The Density tool was then used to calculate the residential parcels per square mile for the entire study area. The output raster was then reclassified using the Reclassify tool, dividing the density values into nine (9) classes. Transportation Connectivity Effective station areas are in close proximity to a diverse transportation network that offers as many options as possible. For this analysis, proximity to ground transport (roads, interstates, etc.) and airports were considered. Arizona roads and airport locations were gathered from AZGEO in a layer package format. Arizona roads included interstates, US highways, highways, highway loops, access ramps, arterials, streets, primitive roads and trails / alleys. For this analysis, primitive roads and trails / alleys were left out. The layer package was then clipped, using the Clip tool, to the study area. The result was then exported as a feature class to the working geodatabase. The Create Geometric Network tool was then used to create points for every intersection within the study area. An attribute field was added to this new point feature class called Rating. Within this field, each type of road was rated based on capacity, with the highest capacity receiving a value of 9 and the lowest a value of 1. The spatial join tool was then used to apply these ratings to the previously derived points. The Hot Spot Analysis tool was then used to identify hot and cold spots within these points, utilizing the Rating attribute as the input field. Within the result, all intersections identified as being within a hot spot and containing a value of 99% 14
16 confidence or higher were then exported. Utilizing the Density tool, a raster was then created for the study area representing hot spot intersections per square mile. Proximity to airports, another important transportation option, is also important for an effecting station location. For this analysis, only public airports were considered. Utilizing the select by attributes tool, public airports were selected and exported out of the layer package and stored in the working geodatabase as a new feature class. The Euclidean Distance tool was then used to define a distance around all public airports within the study area. The reclassify tool was then used to define suitable distances from airports. These were divided into values of 1, 2, 3, 4, 5, 6, 7, 14 and 28 miles. A value of 9 was defined as a distance of 1 mile and a value of 1 was defined as a value of 28 miles. Weighted Overlay The Weighted Overlay tool was then used, including all of the outputs from the right-of-way identification section as well as the residential density and transportation connectivity results identified above. The applied weights for each output were as follows: Residential: 10%, Soils: 10%, Elevation: 10%, Land Use: 5%, Tribal Land: 5%, Preserve Land: 10%, Existing Rail: 10%, Existing Interstate: 10%, Residential Density: 10%, Road Proximity: 10%, Airport Proximity: 10%. The output was then symbolized to represent suitability based on the 1-9 scale. Route Identification The weighted overlay result from the right-of-way identification section was utilized for the final identification of suitable routes. From the overlay result, the Raster to point tool was used to transform every pixel within the study area into a point. From 15
17 this point feature class, the highest values were selected and exported using the select by attribute tool within the Value field. The highest values were identified as 5, 6 and 7. The combination of Existing Interstates and Existing Railroads outlined all of these highest values and were each combined, using the Merge tool, into a new feature class. Utilizing the Spatial Join tool, the individual values from each point were then joined to every overlapping line segment. These segments were then symbolized to emphasize suitability based on these values. 16
18 RESULTS Figure 1 17
19 18 Figure 2
20 19 Figure 3
21 20 Figure 4
22 21 Figure 5
23 22 Figure 6

24 23 Figure 7
25 24 Figure 8

26 25 Figure 9
27 Within the result, Figure 9 above, there are a few things that clearly stand out. First, highways and railroad rights-of-way are being described as the most suitable areas for new rights-of-way. The majority of the study area has been defined as being on the lower end, 5 and below, of the suitability scale. Mountainous areas, preserves and tribal lands clearly stand out as unsuitable with values ranging from 2 to 4. 26
28 27 Figure 10
29 28 Figure 11

30 29 Figure 12
31 The population and transportation connectivity factors that were included in this overlay, noticeably made a large difference within our study area. Suitable areas are now clustered around populated areas with airports. The expected result was to see two clusters, one for the City of Phoenix and City of Tucson. In figure 12 above, that this is clearly not the case. There are several clusters of suitable locations spread throughout the study area. 30
32 31
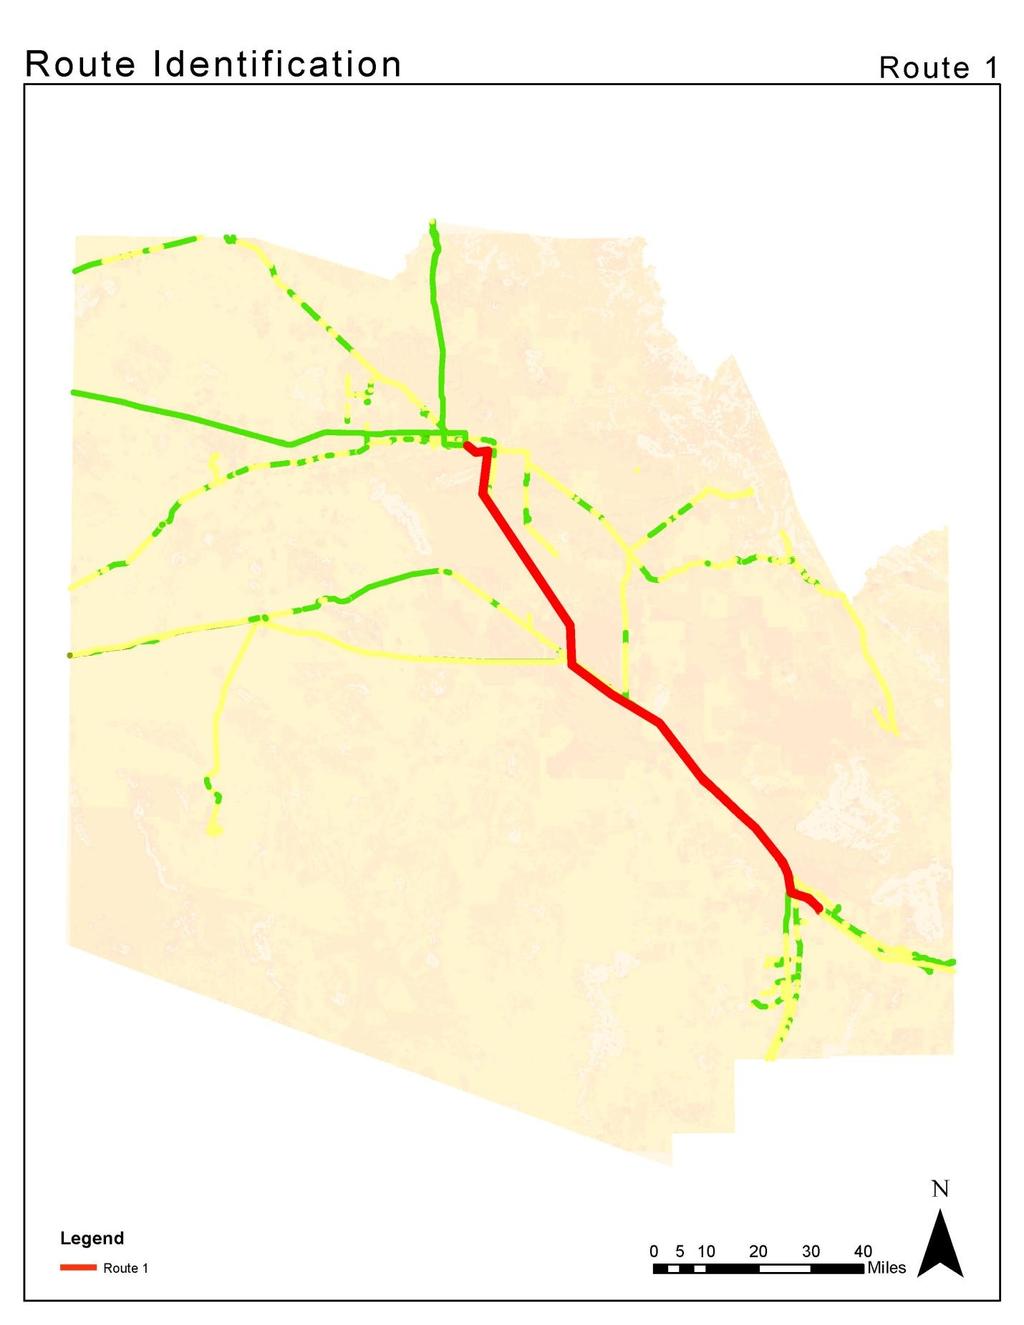
33 Route 1 had the largest collection of high suitability values, primarily 6 and 7. It clearly stands out as the most suitable location for right of way improvement and is located on Interstate 10 connecting Phoenix and Tucson. This route also connects the centralized City of Casa Grande with these two major Arizona cities. 32
34 33
35 Route 2 contained the second largest number of high suitability values, primarily 5 and 6. It avoids the Gila River Indian Community and connects Phoenix and Tucson through the City of Coolidge by an existing railroad right of way. 34
36 CONCLUSIONS Current transportation methods within the Central Arizona region revolve primarily around automobiles. In order for the region to become more economically resilient and environmentally sustainable, alternative transportation methods must be considered. The application of high speed or commuter rail to central and southern Arizona appears to have great promise in achieving both of these goals. Through this analysis, it has been determined that not only is there suitable land for such a project, but there are also multiple options and alternatives available. Suitability analysis can be used for an entire range of subjects from problem solving to market research. When applied to any type of industry, it has the potential to improve business practices by identifying and weighting each and every factor that makes up individual problems to be solved or markets to be researched. The adoption of new practices like these If the project could be done over again, more transportation rights-of-way, such as state highways, would be included. Also, within the nature of this project, there was a large emphasis on cost; in a second attempt, a model in which cost was not as important would have been included in order to show the distinction between low cost and high cost options. The hope is that this project has the potential to show that suitability analysis, in concert with other methods, can be used for a wide range of subjects. At the beginning of this project, suitability analysis was not even a consideration as a solution to this application. It was successfully applied as the central component of the project and can be successfully applied to many other unrelated projects. 35
37 LIST OF REFERENCES Urban Planning Studio "My Site." I-11 Super Corridor. University of Arizona Sustainable Cities Project, Web. 14 May Arizona Department of Transportation. "Studies and Programs."Passenger Rail Study Tucson To Phoenix. Arizona Department of Transportation, n.d. Web. 14 Aug United States. The United States Conference of Mayors. The Economic Impacts of High Speed Rail on Cities and Their Metropolitan Areas. By Economic Development Research Group. N.p.: n.p., n.d. Print. The Railway Association of Canada, and Federation of Canadian Municipalities. Guidelines for New Development in Proximity to Railway Operations. Rep. N.p.: n.p., n.d. Print. 36
A More Comprehensive Vulnerability Assessment: Flood Damage in Virginia Beach
 A More Comprehensive Vulnerability Assessment: Flood Damage in Virginia Beach By Raj Shah GIS in Water Resources Fall 2017 Introduction One of the most obvious effects of flooding events is death. Humans
Chapter 6. Fundamentals of GIS-Based Data Analysis for Decision Support. Table 6.1. Spatial Data Transformations by Geospatial Data Types
 Chapter 6 Fundamentals of GIS-Based Data Analysis for Decision Support FROM: Points Lines Polygons Fields Table 6.1. Spatial Data Transformations by Geospatial Data Types TO: Points Lines Polygons Fields
Abstract: Contents. Literature review. 2 Methodology.. 2 Applications, results and discussion.. 2 Conclusions 12. Introduction
 Abstract: Landfill is one of the primary methods for municipal solid waste disposal. In order to reduce the environmental damage and to protect the public health and welfare, choosing the site for landfill
Suitability Analysis on Second Home Areas Selection in Smithers British Columbia
 GEOG 613 Term Project Suitability Analysis on Second Home Areas Selection in Smithers British Columbia Zhengzhe He November 2005 Abstract Introduction / background Data Source Data Manipulation Spatial
Urbanization factors in the Gilleland Creek watershed, Travis County, Texas. Michael Kanarek GEO386G Final Project Dec. 2, 2011
 Urbanization factors in the Gilleland Creek watershed, Travis County, Texas Michael Kanarek GEO386G Final Project Dec. 2, 2011 1 Introduction The watershed of Gilleland Creek, which flows through eastern
Natalie Cabrera GSP 370 Assignment 5.5 March 1, 2018
 Network Analysis: Modeling Overland Paths Using a Least-cost Path Model to Track Migrations of the Wolpertinger of Bavarian Folklore in Redwood National Park, Northern California Natalie Cabrera GSP 370
presents challenges related to utility infrastructure planning. Many of these challenges
 1 Introduction: - a. Purpose According to U.S. Census Bureau the population of stark county was 367,585 in 1990, and in 2000 it was increase to 378,098. Thus County is experiencing a growth that presents
Louisiana Transportation Engineering Conference. Monday, February 12, 2007
 Louisiana Transportation Engineering Conference Monday, February 12, 2007 Agenda Project Background Goal of EIS Why Use GIS? What is GIS? How used on this Project Other site selection tools I-69 Corridor
Spatial Analysis with ArcGIS Pro STUDENT EDITION
 Spatial Analysis with ArcGIS Pro STUDENT EDITION Copyright 2018 Esri All rights reserved. Course version 2.0. Version release date November 2018. Printed in the United States of America. The information
Neighborhood Locations and Amenities
 University of Maryland School of Architecture, Planning and Preservation Fall, 2014 Neighborhood Locations and Amenities Authors: Cole Greene Jacob Johnson Maha Tariq Under the Supervision of: Dr. Chao
Alaska, USA. Sam Robbins
 Using ArcGIS to determine erosion susceptibility within Denali National Park, Alaska, USA Sam Robbins Introduction Denali National Park is six million acres of wild land with only one road and one road
A GIS TOUR OF DES MOINES PRESENTED BY ANNA WHIPPLE, GIS MANAGER APRIL 20, 2015
 A GIS TOUR OF DES MOINES PRESENTED BY ANNA WHIPPLE, GIS MANAGER APRIL 20, 2015 Welcome to Des Moines! Capital of Iowa Among 100 largest metropolitan areas Insurance, biotech, healthcare, and entertainment
SF House Site Suitability
 SF House Site Suitability Rick Waterman Geog621-13 12/9/04 For my final project I chose to create a site suitability model for a house in San Francisco. Being a new resident to San Francisco, I was interested
Summary Description Municipality of Anchorage. Anchorage Coastal Resource Atlas Project
 Summary Description Municipality of Anchorage Anchorage Coastal Resource Atlas Project By: Thede Tobish, MOA Planner; and Charlie Barnwell, MOA GIS Manager Introduction Local governments often struggle
In this exercise we will learn how to use the analysis tools in ArcGIS with vector and raster data to further examine potential building sites.
 GIS Level 2 In the Introduction to GIS workshop we filtered data and visually examined it to determine where to potentially build a new mixed use facility. In order to get a low interest loan, the building
ARCGIS PRO COURSE, APPLIED TO ENVIROMENTAL MANAGEMENT GIS. Course. Training. .com
 ARC PRO COURSE, APPLIED TO ENVIROMENTAL MANAGEMENT TYC Training Course.com TRAINING OVERVIEW This Arc Pro online course will provide a great deal of information about the link between earth s ecosystems
Delineation of high landslide risk areas as a result of land cover, slope, and geology in San Mateo County, California
 Delineation of high landslide risk areas as a result of land cover, slope, and geology in San Mateo County, California Introduction Problem Overview This project attempts to delineate the high-risk areas
Technical Memorandum #2 Future Conditions
 Technical Memorandum #2 Future Conditions To: Dan Farnsworth Transportation Planner Fargo-Moorhead Metro Council of Governments From: Rick Gunderson, PE Josh Hinds PE, PTOE Houston Engineering, Inc. Subject:
Laboratory Exercise - Temple-View Least- Cost Mountain Bike Trail
 Brigham Young University BYU ScholarsArchive Engineering Applications of GIS - Laboratory Exercises Civil and Environmental Engineering 2017 Laboratory Exercise - Temple-View Least- Cost Mountain Bike
GIS-T 2010 Building a Successful Geospatial Data Sharing Framework: A Ohio DOT Success Story
 GIS-T 2010 Building a Successful Geospatial Data Sharing Framework: A Ohio DOT Success Story ODOT District 2 GIS John Puente District 1 GIS Coordinator\ Planning Administrator 2 Interoperability 3 District
ArcGIS Pro: Essential Workflows STUDENT EDITION
 ArcGIS Pro: Essential Workflows STUDENT EDITION Copyright 2018 Esri All rights reserved. Course version 6.0. Version release date August 2018. Printed in the United States of America. The information contained
IMPERIAL COUNTY PLANNING AND DEVELOPMENT
 IMPERIAL COUNTY PLANNING AND DEVELOPMENT GEODATABASE USER MANUAL FOR COUNTY BUSINESS DEVELOPMENT GIS June 2010 Prepared for: Prepared by: County of Imperial Planning and Development 801 Main Street El
Introduction. Project Summary In 2014 multiple local Otsego county agencies, Otsego County Soil and Water
 Introduction Project Summary In 2014 multiple local Otsego county agencies, Otsego County Soil and Water Conservation District (SWCD), the Otsego County Planning Department (OPD), and the Otsego County
GIS ANALYSIS METHODOLOGY
 GIS ANALYSIS METHODOLOGY No longer the exclusive domain of cartographers, computer-assisted drawing technicians, mainframes, and workstations, geographic information system (GIS) mapping has migrated to
Identifying Wildfire Risk Areas in Western Washington State
 Identifying Wildfire Risk Areas in Western Washington State Matthew Seto University of Washington Tacoma GIS Certification Program URISA 2015 Undergraduate Geospatial Skills Competition Introduction 2014
GIS Level 2. MIT GIS Services
 GIS Level 2 MIT GIS Services http://libraries.mit.edu/gis Email: gishelp@mit.edu TOOLS IN THIS WORKSHOP - Definition Queries - Create a new field in the attribute table - Field Calculator - Add XY Data
Designing GIS Databases to Support Mapping and Map Production Charlie Frye, ESRI Redlands Aileen Buckley, ESRI Redlands
 Designing GIS Databases to Support Mapping and Map Production Charlie Frye, ESRI Redlands Aileen Buckley, ESRI Redlands 1 Designing GIS Databases to Support Mapping and Map Production Charlie Frye, ESRI
A Method for Mapping Settlement Area Boundaries in the Greater Golden Horseshoe
 A Method for Mapping Settlement Area Boundaries in the Greater Golden Horseshoe Purpose This paper describes a method for mapping and measuring the lands designated for growth and urban expansion in the
Classification of Erosion Susceptibility
 GEO327G: GIS & GPS Applications in Earth Sciences Classification of Erosion Susceptibility Denali National Park, Alaska Zehao Xue 12 3 2015 2 TABLE OF CONTENTS 1 Abstract... 3 2 Introduction... 3 2.1 Universal
Welcome to NR502 GIS Applications in Natural Resources. You can take this course for 1 or 2 credits. There is also an option for 3 credits.
 Welcome to NR502 GIS Applications in Natural Resources. You can take this course for 1 or 2 credits. There is also an option for 3 credits. The 1st credit consists of a series of readings, demonstration,
Outcrop suitability analysis of blueschists within the Dry Lakes region of the Condrey Mountain Window, North-central Klamaths, Northern California
 Outcrop suitability analysis of blueschists within the Dry Lakes region of the Condrey Mountain Window, North-central Klamaths, Northern California (1) Introduction: This project proposes to assess the
ALBANIA IN THE GLOBAL MAP. Milot LUBISHTANI, Bashkim IDRIZI
 ALBANIA IN THE GLOBAL MAP Milot LUBISHTANI, Bashkim IDRIZI Overview: Introduction GSDI Global Mapping Introduction Standards Participating Utilization Data structure Albanian Global Map Dataset Process
Native species (Forbes and Graminoids) Less than 5% woody plant species. Inclusions of vernal pools. High plant diversity
 Less than 5% woody plant species. Inclusions of vernal pools. High plant diversity") WILLAMETTE VALLEY WET-PRAIRIE RESTORATION MODEL WHAT IS A WILLAMETTE VALLEY WET-PRAIRIE Hot Spot s Native species (Forbes and Graminoids) Rare plant species Less than 5% woody plant species Often dominated
WILLAMETTE VALLEY WET-PRAIRIE RESTORATION MODEL WHAT IS A WILLAMETTE VALLEY WET-PRAIRIE Hot Spot s Native species (Forbes and Graminoids) Rare plant species Less than 5% woody plant species Often dominated
Iowa Department of Transportation Office of Transportation Data GIS / CAD Integration
 Iowa Department of Transportation Office of Transportation Data GIS / CAD Integration From GIS data to CAD graphics - Iowa DOT's workflow utilizing GeoMedia and MicroStation to develop map products. Mark
Economic Activity Economic A ctivity
 5 Economic Economic Activity Activity ECONOMIC ACTIVITY 5.1 EMPLOYMENT... 5-7 5.1.1 OBJECTIVE... 5-7 5.1.2 POLICIES... 5-7 5.2 PROTECTING THE AREA OF EMPLOYMENT... 5-9 5.2.1 OBJECTIVE... 5-9 5.2.2 POLICIES...
BASIC SPATIAL ANALYSIS TOOLS IN A GIS. data set queries basic statistics buffering overlay reclassification
 BASIC SPATIAL ANALYSIS TOOLS IN A GIS data set queries basic statistics buffering overlay reclassification GIS ANALYSIS TOOLS GIS ANALYSIS TOOLS Database tools: query and summarize (similar to spreadsheet
Applied Cartography and Introduction to GIS GEOG 2017 EL. Lecture-1 Chapters 1 and 2
 Applied Cartography and Introduction to GIS GEOG 2017 EL Lecture-1 Chapters 1 and 2 What is GIS? A Geographic Information System (GIS) is a computer system for capturing, storing, querying, analyzing and
Spatial Analysis using Vector GIS THE GOAL: PREPARATION:
 PLAN 512 GIS FOR PLANNERS Department of Urban and Environmental Planning University of Virginia Fall 2006 Prof. David L. Phillips Spatial Analysis using Vector GIS THE GOAL: This tutorial explores some
Display data in a map-like format so that geographic patterns and interrelationships are visible
 Vilmaliz Rodríguez Guzmán M.S. Student, Department of Geology University of Puerto Rico at Mayagüez Remote Sensing and Geographic Information Systems (GIS) Reference: James B. Campbell. Introduction to
INDOT Office of Traffic Safety
 Intro to GIS Spatial Analysis INDOT Office of Traffic Safety Intro to GIS Spatial Analysis INDOT Office of Traffic Safety Kevin Knoke Section 130 Program Manager Highway Engineer II Registered Professional
Digitization in a Census
 Topics Connectivity of Geographic Data Sketch Maps Data Organization and Geodatabases Managing a Digitization Project Quality and Control Topology Metadata 1 Topics (continued) Interactive Selection Snapping
Hennepin GIS. Tree Planting Priority Areas - Analysis Methodology. GIS Services April 2018 GOAL:
 Hennepin GIS GIS Services April 2018 Tree Planting Priority Areas - Analysis Methodology GOAL: To create a GIS data layer that will aid Hennepin County Environment & Energy staff in determining where to
Wright County, MN. Overview. Legend
 Wright County, MN Overview 461 ft Legend Roads CSAHCL CTYCL MUNICL PRIVATECL TWPCL Highways Interstate State Hwy US Hwy City/Township Limits c t Subdivisions Parcels Water 2' Contours 842; 844; 846; 848;
Information for File MVP RMM
 Information for File MVP-2013-03320-RMM Applicant: City of St. Cloud Corps Contact: Ryan Malterud Address: 180 Fifth Street East, Suite 700, St. Paul, MN 55101 E-Mail: Ryan.M.Malterud@usace.army.mil Phone:
Spatial Organization of Data and Data Extraction from Maptitude
 Spatial Organization of Data and Data Extraction from Maptitude N. P. Taliceo Geospatial Information Sciences The University of Texas at Dallas UT Dallas GIS Workshop Richardson, TX March 30 31, 2018 1/
Office of Geographic Information Systems
 Office of Geographic Information Systems Print this Page Winter 2009 - Desktop GIS: The National Grid Wants You! By Todd Lusk In case of a disaster would you want emergency responders to be able to easily
Site Suitability Analysis for Local Airport Using Geographic Information System
 Cloud Publications International Journal of Advanced Remote Sensing and GIS 2018, Volume 7, Issue 1, pp. 2719-2727 ISSN 2320 0243, Crossref: 10.23953/cloud.ijarsg.368 Research Article Site Suitability
Geodatabase for Sustainable Urban Development. Presented By Rhonda Maronn Maurice Johns Daniel Ashney Jack Anliker
 Geodatabase for Sustainable Urban Development Presented By Rhonda Maronn Maurice Johns Daniel Ashney Jack Anliker Objective Build a Geodatabase that will enable urban planners to create and assess the
NCTCOG GIS File Locations
 Boundaries Area Codes k:\bnd\region\area_codes.shp Area Type k:\bnd\region\areatype.shp Ciry Centroids (World) k:\bnd\usa_world\cities.shp City Centroids (NCTCOG Region) k:\bnd\region\city_point.shp vector.vector.bnd_city_point
Oklahoma GIS for GeoCIP
 GeoCIP Program Partners Oklahoma GIS for GeoCIP A Center for Spatial Analysis Report to Oklahoma GI Council 6 November 2009 The CSA team Kathy Hines Tran Trung Semiha Caliskan Peter Camili Scott March
Acknowledgments xiii Preface xv. GIS Tutorial 1 Introducing GIS and health applications 1. What is GIS? 2
 Acknowledgments xiii Preface xv GIS Tutorial 1 Introducing GIS and health applications 1 What is GIS? 2 Spatial data 2 Digital map infrastructure 4 Unique capabilities of GIS 5 Installing ArcView and the
GIS Technology and Tools for Long Range Transportation Planning in the National Park Service
 GIS Technology and Tools for Long Range Transportation Planning in the National Park Service Geospatial Information Systems for Transportation Symposium Loveland, Colorado April 16, 2012 Nell Blodgett
1.1 What is Site Fingerprinting?
 Site Fingerprinting Utilizing GIS/GPS Technology 1.1 What is Site Fingerprinting? Site fingerprinting is a planning tool used to design communities where protection of natural resources is the primary
Identifying Megaregions in the US: Implications for Infrastructure Investment
 7. 10. 2 0 08 Identifying Megaregions in the US: Implications for Infrastructure Investment Dr. Myungje Woo Dr. Catherine L. Ross Jason Barringer Harry West Jessica Lynn Harbour Doyle Center for Quality
NC Streambed Mapping Project Issue Paper
 ISSUE 1: The Western North Carolina Drainage Area Requirement Issue Several inquiries and discussions in regard to the determination of the 6-acre drainage area requirement as the upstream limit have been
Public Transportation Infrastructure Study (PTIS) - 2 nd Technical Advisory Committee Meeting
 - 2 nd Technical Advisory Committee Meeting") Public Transportation Infrastructure Study (PTIS) - 2 nd Technical Advisory Committee Meeting Presentation to: Technical Advisory Committee (TAC) Presented by: and Team July 8th, 2009 Public Transportation
Public Transportation Infrastructure Study (PTIS) - 2 nd Technical Advisory Committee Meeting Presentation to: Technical Advisory Committee (TAC) Presented by: and Team July 8th, 2009 Public Transportation
Great California Delta Trail Blueprint for Contra Costa and Solano Counties GIS AND MAPPING MEMORANDUM JULY 2010
 Great California Delta Trail Blueprint for Contra Costa and Solano Counties GIS AND MAPPING MEMORANDUM JULY 2010 {DRAFT} July 2010 Introduction Geographic Information Systems (GIS) are computer-based
Geog 469 GIS Workshop. Data Analysis
 Geog 469 GIS Workshop Data Analysis Outline 1. What kinds of need-to-know questions can be addressed using GIS data analysis? 2. What is a typology of GIS operations? 3. What kinds of operations are useful
Applications of GIS in Electrical Power System
 Applications of GIS in Electrical Power System Abdulrahman M. AL-Sakkaf 201102310 CRP 514 May 2013 Dr. Baqer M. AL-Ramadan Abstract GIS has been widely used in various areas and disciplines. This paper
Allo Fiber City Checklist
 Allo Fiber City Checklist Experience Fiber Internet + TV + Phone Like Never Before. Gigabit Internet speeds have the power to move communities forward by contributing to economic development and heightening
How GIS Can Help With Tribal Safety Planning
 How GIS Can Help With Tribal Safety Planning Thomas A. Horan, PhD Brian Hilton, PhD Arman Majidi, MAIS Center for Information Systems and Technology Claremont Graduate University Goals & Objectives This
Introduction-Overview. Why use a GIS? What can a GIS do? Spatial (coordinate) data model Relational (tabular) data model
 data model Relational (tabular) data model") Introduction-Overview Why use a GIS? What can a GIS do? How does a GIS work? GIS definitions Spatial (coordinate) data model Relational (tabular) data model intro_gis.ppt 1 Why use a GIS? An extension
Introduction-Overview Why use a GIS? What can a GIS do? How does a GIS work? GIS definitions Spatial (coordinate) data model Relational (tabular) data model intro_gis.ppt 1 Why use a GIS? An extension
GIS Lecture 5: Spatial Data
 GIS Lecture 5: Spatial Data GIS 1 Outline Vector Data Formats Raster Data Formats Map Projections Coordinate Systems US Census geographic files US Census data files GIS Data Sources GIS 2 Vector Data Formats
Huron Creek Watershed 2005 Land Use Map
 Huron Creek Watershed 2005 Land Use Map Created By: Linda Kersten, 12/20/06 Created For: MTU Introduction to GIS Class (FW 5550) The Huron Creek Watershed Advisory Committee Michigan Technological University,
Web Soil Survey National Cooperative Soil Survey
 121 52' 18'' W Irrigated Capability Class Sutter County, California () 121 51' 49'' W 597600 597700 597800 597900 598000 598100 598200 39 6' 27'' N 39 6' 27'' N 39 5' 57'' N 4328400 4328500 4328600 4328700
GIS and Forest Engineering Applications FE 257 Lecture and laboratory, 3 credits
 GIS and Forest Engineering Applications FE 257 Lecture and laboratory, 3 credits Instructor: Michael Wing Associate Professor Forest Engineering, Resources, and Management Oregon State University Crop
Joint Planning Advisory Council July 19, 2011
 Joint Planning Advisory Council July 19, 2011 Global Cities Program Objectives Helping advance strategic thinking in a variety of critical areas. Facilitating informed decisionmaking on the part of public
Geospatial Analysis and Optimization Techniques to Select Site for New Business: The Case Study of Washtenaw County, Michigan, USA
 International Journal of Sciences: Basic and Applied Research (IJSBAR) ISSN 2307-4531 (Print & Online) http://gssrr.org/index.php?journal=journalofbasicandapplied ---------------------------------------------------------------------------------------------------------------------------
MAPS AND THEIR CLASSIFICATION
 MAPPING MAPS AND THEIR CLASSIFICATION WHAT IS A MAP? A map is representation of the Earth's surface, showing how things are related to each other by distance, direction, and size. Maps are a way of showing
Creating a Pavement Management System Using GIS
 Christopher Castruita PPD 631 Prof. Barry Waite & Prof. Bonnie Shrewsbury Creating a Pavement Management System Using GIS Problem Definition As is the case with many cities, the city of La Cañada Flintridge
GIS for ChEs Introduction to Geographic Information Systems
 GIS for ChEs Introduction to Geographic Information Systems AIChE Webinar John Cirucci 1 GIS for ChEs Introduction to Geographic Information Systems What is GIS? Tools and Methods Applications Examples
GIS based high speed railway between Calgary-Red Deer-Edmonton
 Capstone Project BGIS Bachel o r of A p p l i ed Technology in G eographic I n f o r m a tion S y s tems GIS based high speed railway between Calgary-Red Deer-Edmonton Sisay Bayafers Arshdeep Virk Jordan
NAVAJO NATION PROFILE
 NAVAJO NATION PROFILE Largest land based area and federally recognized tribe in the United States Over 27,000 square miles (or 17.2 million acres with a population of over 300,000 people. Covers Arizona,
Where to Invest Affordable Housing Dollars in Polk County?: A Spatial Analysis of Opportunity Areas
 Resilient Neighborhoods Technical Reports and White Papers Resilient Neighborhoods Initiative 6-2014 Where to Invest Affordable Housing Dollars in Polk County?: A Spatial Analysis of Opportunity Areas
Protocol for Prioritizing Conservation Opportunity Areas in Centre County and Clinton County
 Protocol for Prioritizing Conservation Opportunity Areas in Centre County and Clinton County Chesapeake Conservancy has developed this methodology to prioritize conservation opportunity areas in Centre
Soil Map Boulder County Area, Colorado (Planet Blue Grass) Web Soil Survey National Cooperative Soil Survey
 Web Soil Survey National Cooperative Soil Survey") 475910 476000 476090 476180 476270 476360 105 16' 21'' W 476450 476540 476630 476720 476810 4453350 4453440 4453260 4453350 4453170 4453260 4453080 4453170 4453080 475820 475910 4452990 476000 476090 476180
475910 476000 476090 476180 476270 476360 105 16' 21'' W 476450 476540 476630 476720 476810 4453350 4453440 4453260 4453350 4453170 4453260 4453080 4453170 4453080 475820 475910 4452990 476000 476090 476180
Geospatial Preservation: State of the Landscape. A Quick Overview. Steve Morris NCSU Libraries
 Geospatial Preservation: State of the Landscape A Quick Overview Steve Morris NCSU Libraries SAA 2011 August 26, 2011 14 Brief Overview of the Problem 15 Variety of Geospatial Data Types Variety of producers
Appendixx C Travel Demand Model Development and Forecasting Lubbock Outer Route Study June 2014
 Appendix C Travel Demand Model Development and Forecasting Lubbock Outer Route Study June 2014 CONTENTS List of Figures-... 3 List of Tables... 4 Introduction... 1 Application of the Lubbock Travel Demand
Committee Meeting November 6, 2018
 Committee Meeting November 6, 2018 Agenda Where we are in the process Land Use Plan Transportation Element Housing & Neighborhoods Elements Next Steps Schedule November 6: Plan Elements December: Plan
Lesson 9 and 10: Final Project. by Diana Jo Lau
 Lesson 9 and 10: Final Project by Diana Jo Lau Introduction Acme Conservation Unlimited conducted a site selection analysis of conservation areas meeting specific criteria. The results of our analysis
WHAT MAKES A GOOD GIS LAB EXERCISE? Robert N. Martin
 WHAT MAKES A GOOD GIS LAB EXERCISE? Robert N. Martin ABSTRACT Having taught GIS for over fifteen years in a lecture/laboratory format, I have developed a series of laboratory exercise that provide a good
SIE 509 Principles of GIS Exercise 5 An Introduction to Spatial Analysis
 SIE 509 Principles of GIS Exercise 5 An Introduction to Spatial Analysis Due: Oct. 31, 2017 Total Points: 50 Introduction: The Governor of Maine is asking communities to look at regionalization for major
Date: June 19, 2013 Meeting Date: July 5, Consideration of the City of Vancouver s Regional Context Statement
 Section E 1.5 To: From: Regional Planning and Agriculture Committee Lee-Ann Garnett, Senior Regional Planner Planning, Policy and Environment Department Date: June 19, 2013 Meeting Date: July 5, 2013 Subject:
Analysis of Change in Land Use around Future Core Transit Corridors: Austin, TX, Eric Porter May 3, 2012
 Analysis of Change in Land Use around Future Core Transit Corridors: Austin, TX, 1990-2006 PROBLEM DEFINITION Eric Porter May 3, 2012 This study examines the change in land use from 1990 to 2006 in the
A Comprehensive Inventory of the Number of Modified Stream Channels in the State of Minnesota. Data, Information and Knowledge Management.
 A Comprehensive Inventory of the Number of Modified Stream Channels in the State of Minnesota Data, Information and Knowledge Management Glenn Skuta Environmental Analysis and Outcomes Division Minnesota
Expanding Canada s Rail Network to Meet the Challenges of the Future
 Expanding Canada s Rail Network to Meet the Challenges of the Future Lesson Overview Rail may become a more popular mode of transportation in the future due to increased population, higher energy costs,
Applying Hazard Maps to Urban Planning
 Applying Hazard Maps to Urban Planning September 10th, 2014 SAKAI Yuko Disaster Management Expert JICA Study Team for the Metro Cebu Roadmap Study on the Sustainable Urban Development 1 Contents 1. Outline
Planning for Sea Level Rise in the Matanzas Basin
 Planning for Sea Level Rise in the Matanzas Basin Appendix E: Matanzas Future Development Scenarios June, 2015 Prepared by: Dr. Paul Zwick University of Florida Department of Urban and Regional Planning
Frequently Asked Questions about MnDOT s Railroad Map Conversion Project
 Frequently Asked Questions about MnDOT s Railroad Map Conversion Project What were the main objectives of the project? What are the results and end products? What can these railroad maps be used for? Who
Exercise 2: Working with Vector Data in ArcGIS 9.3
 Exercise 2: Working with Vector Data in ArcGIS 9.3 There are several tools in ArcGIS 9.3 used for GIS operations on vector data. In this exercise we will use: Analysis Tools in ArcToolbox Overlay Analysis
Expanding the GSATS Model Area into
 Appendix A Expanding the GSATS Model Area into North Carolina Jluy, 2011 Table of Contents LONG-RANGE TRANSPORTATION PLAN UPDATE 1. Introduction... 1 1.1 Background... 1 1.2 Existing Northern Extent of
Midterm Exam : Answer
 Midterm Exam : Answer Create a double-spaced document with answers to the questions below. File Name: LASTNAME_Midterm.pdf Make sure to include your Name, UWNetID, course number, quarter and year, and
Location Suitability Analysis
 2010 Fall 406 Final Project Location Suitability Analysis New Burger stores in San Fernando Valley Presenter: Rich Lee I. Introduction In-N-Out Burger is famous in South West America. Established in 1948
The Use of Geographic Information Systems (GIS) by Local Governments. Giving municipal decision-makers the power to make better decisions
 by Local Governments. Giving municipal decision-makers the power to make better decisions") The Use of Geographic Information Systems (GIS) by Local Governments Giving municipal decision-makers the power to make better decisions Case Study: Examples of GIS Usage by Local Governments in North
The Use of Geographic Information Systems (GIS) by Local Governments Giving municipal decision-makers the power to make better decisions Case Study: Examples of GIS Usage by Local Governments in North
III. FORECASTED GROWTH
 III. FORECASTED GROWTH In order to properly identify potential improvement projects that will be required for the transportation system in Milliken, it is important to first understand the nature and volume
SRJC Applied Technology 54A Introduction to GIS
 SRJC Applied Technology 54A Introduction to GIS Overview Lecture of Geographic Information Systems Fall 2004 Santa Rosa Junior College Presented By: Tim Pudoff, GIS Coordinator, County of Sonoma, Information
CLAREMONT MASTER PLAN 2017: LAND USE COMMUNITY INPUT
 Planning and Development Department 14 North Street Claremont, New Hampshire 03743 Ph: (603) 542-7008 Fax: (603) 542-7033 Email: cityplanner@claremontnh.com www.claremontnh.com CLAREMONT MASTER PLAN 2017:
NR402 GIS Applications in Natural Resources
 NR402 GIS Applications in Natural Resources Lesson 1 Introduction to GIS Eva Strand, University of Idaho Map of the Pacific Northwest from http://www.or.blm.gov/gis/ Welcome to NR402 GIS Applications in
Pierce Cedar Creek Institute GIS Development Final Report. Grand Valley State University
 Pierce Cedar Creek Institute GIS Development Final Report Grand Valley State University Major Goals of Project The two primary goals of the project were to provide Matt VanPortfliet, GVSU student, the
Spatial Data Analysis with ArcGIS Desktop: From Basic to Advance
 Spatial Data Analysis with ArcGIS Desktop: From Basic to Advance 1. Course overview Modern environmental, energy as well as resource modeling and planning require huge amount of geographically located