Session 3: Spatial Diagnosis of Mobility and Accessibility in Urban Mobility Systems
|
|
|
- Abigail Skinner
- 6 years ago
- Views:
Transcription
1 MESTRADO EM ENGENHARIA CIVIL MESTRADO EM URBANISMO E ORDENAMENTO DO TERRITÓRIO MESTRADO EM PLANEAMENTO E OPERAÇÃO DE TRANSPORTES Urban Mobility Management Main lecturer: Prof. Rosário Macário Assistent: Engª Camila Garcia Theory Lectures Session 3: Spatial Diagnosis of Mobility and Accessibility in 1

2 Mobility Plans Mobility Plans political instruments integrated into Master Plan containing guidelines, projects, actions and measures aimed at providing broad and democratic access to the city opportunities and to enable appropriate conditions to the population mobility and the logistic distribution of goods and services. Key concept for Mobility Plans formulations: Mobility: personal ability to use multiple modes without considering the opportunities to be achieved. Accessibility: degree of easiness to reach locations using a given mode without considering the actual personal ability of use this mode. Equity: provide same accessibility and mobility opportunities to the entire population (vertical and horizontal) Sustentability: ability to travel in order to perform the basic citizens rights, with the lowest possible energy consumption and hence lower environmental impact, making the travels environmentally sustainable. 2
3 UMS Characterization and Diagnosis Spatial Diagnosis of Mobility and Accessibility in Planning Process Surveys Characterization and Diagnosis Solutions Proposition Solution Assessment Diagnose: determine the existence of an illness (problem) by the observation of its symptoms (characteristics) and the analysis of several tests (allocation, spatial analysis, etc.) Characterization preceeds the diagnosis and comprises the description of the parameters related to both supply and demand system and can be enriched by the parameters assessment in relation to standards values. Diagnosis uses characterization results and has the objective of identify the cause and effect relationships of the problems related to UMS. The use of indicators and modeling tools is essential at this stage to allow a better understanding and validation of the current panorama of the UMS analyzed. 3

 Information: is the result of the indicators and indices analysis and is the base for a sound decision-making.")
4 Disaggregation Spatial Diagnosis of Mobility and Accessibility in Indicators Main elements of information in the process and provide knowledge about the various themes addressed by decision makers Concepts definitions: Data: is the most basic component of an indicator and represents the values of the attributes related to an object or entity Indicator: is a representative parameter derived from data and are used to illustrate in a concise and easy to interpret way the main characteristic of an object Index: is a combination of two or more indicators and is commonly used at more aggregated levels of analysis (strategic level) Information: is the result of the indicators and indices analysis and is the base for a sound decision-making. Indices Indicators Anayzed data Primary data Information 4
5 Indicators Different types of indicators should be considered according to the different needs of information and the various types of analysis: Operational: are normally disaggregated data about a particular object that are used to support the day-to-day decisions (output indicators) Tactical: are results of the analysis of various operational indicators that allow to have an overview on a particular topic and are used at intermediate levels of decision (outcome indicators) Strategic: allow an overall assessment of objectives and are used at the highest levels of decision (impact indicators) To fulfill their function of providing information is necessary to define: type of analyses: base-line, threshold, target and comparison form of presentation: text, graphics and maps 5


 Hierarchy: heterogeneity in terms")
6 The Urban Mobility Network Networks are the representation of the structure and flows of transport systems. nodes represent the access or crossing points links represents the connection between those nodes lines are also included to represent routes in case of public transport networks Networks primary characteristics: reflects the structure of the network Topology: arrangement and connectivity of links and nodes Geometry: spacing, shape, orientation, density and geometric patterns of the network Linear Mesh Star (hub-and-spoke) Hierarchy: heterogeneity in terms of functional and operational differentiation of roads/lines 6
7 The Urban Mobility Network The network structure can be measured through indicators developed based on graph theory Topological measures: try to capture the degree of connectivity and the patterns of connections in the network Geometry measures: describe the regularity of networks, their shape and fragmentation evaluate the impact of the network structure on the system performance and on land use and urban form provide common standard to compare networks and evaluate its evolution over time Hierarchy measures: quantify the network heterogeneity in terms of functional and operational differentiation of roads/lines provide benchmark for a more balanced design of network and also a good indicator for a better traffic flow management 7
8 The Urban Mobility Network Characterizing metro networks (Derrible and Kennedy, 2010) State: measures the complexity of a network identifying three phases in the development of transit networks, with mature systems being 66% completely connected Complexity: ratio between number of links and number of nodes Connectivity: ratio between the actual # of links and the potential # of links Form: investigates the link between metro systems and the built environment, distinguishing networks oriented towards regional accessibility, local coverage or regional coverage Average line length: long lengths regionally oriented Inter-station space: large inter-station space regionally oriented Structure: examines the intrinsic properties of current networks and classifies then as directness-oriented, connectivity-oriented, integrated-oriented Connectivity: the affluence and importance of connections (i.e., transfers) Directness: ratio between the total # of lines and the max. # of transfers 8
 Local coverage: servicing the city core (metro as a prime travel mode) Regional coverage: the city core is generally will served, while still connecting the surrounding regions Setting a")
9 The Urban Mobility Network Characterizing metro networks (Derrible and Kennedy, 2010) Regional accessibility: connecting people living in the outer layers of the city to the city core (regional rail system) Local coverage: servicing the city core (metro as a prime travel mode) Regional coverage: the city core is generally will served, while still connecting the surrounding regions Setting a vision, defining new targets and making decision between various scenarios Compare existing systems. 9
10 The Urban Mobility Network Network secondary characteristics: express its interactions with others urban elements such as the land use system Accessibility: reflects the degree of easiness or difficulty (impedance) imposed by the network for users to reach their destinations Impedance: distance (connectivity), time and cost (network performance) Attractiveness: number of opportunities at destinations (#jobs, #school places, bus frequency, etc.) Reliability: is related to the probability of the proper functioning of the nodes and links For users it is important to know the degree of confidence that they can have on the network reliability reflects the stability of the quality of service offered through the network. Vulnerability: refers to the degree of susceptibility of these nodes and links to failures and the consideration of the impacts of such failures. For managers and operators it is important to know what are the consequences of failure in network operation improve network performance 10
11 Accessibility Microaccessibility access to the urban mobility system Spatial: proximity netween stations and access and egress points; routes distribution (spatial coverage). Temporal: service frequency and average wait time Macroaccessibility acess to the urban activities Network configuration: impedancies measured b y distance, cost and time (inside vehicles, access, wait and transfers) Land use: spatial distribution of activities, offer of potential users and competition for activities Time: constraints that individuals experience in their activities and the availability of opportunities throughout the day, week or year Individual: reflects the needs, abilities and opportunities of each individual Types of accessibility measures Aggregate measures (place-based): associated with the physical space consumed by the transport infrastructure and spatial distribution of activities. Disaggregated measures (person-based): based on detailed observations of individual activities and space-time constraints 11
12 Accessibility Aggregated Measures Network measures: refer to the presence and number of links in the network interposing two nodes without considerer the distance between them Spatial separation measures: consider only the impedance between two locations, omitting any consideration about attractiveness Contour measures: incorporate both land use and transport restrictions and determining the number of opportunities that can be reached in a given travel time Gravity measures: balance the opportunities of a destination by an impedance function related to the generalized cost of travel between zones Competition measures: incorporate capacity constraints related to both activities and users Disaggregated Measures Time-space measures: consider accessibility as the product of an activity system that includes all possible ways in which individuals, households, institutions and firms interact in time and space Utility measures:consider the cost related to the maximum expected utility associated with a set of mode choices for a given individual as a measure of accessibility 12
13 Mobility Mobility indicators: Trips produced: reflects the number of daily trips and can be measured by Trip length, trip time and number of trips/person Trip Easiness: reflects easiness provided by the system and is based on the user behaviour and no in the potential they have to travel Volume/capacity ratio (individual transport modes) Passenger x speed (public transport modes) Trip potential: measures the individual or groups capacity to travel, considering the modes and the time availability Accessibility indicators (time-space and utility measures) 13
14 Spatial Analysis Spatial Analysis: understand how spatial data are organized in space and what are the relationships between them. Levels of analysis: points, areas, surfaces, networks Analysis tools: Selection: visualization, zoom, search, selection, etc. Manipulation: aggregation, disaggregation, buffers, overlay, etc. Exploratory analysis: spatial distribution and global and local spatial association Confirmatory analysis: spatial regression and spatial prediction Spatial Statistics: understand, control, describe and predict spatial phenomenum 1 st Law of geography: everything is related to everything else, but near things are more related than distant things Spatial Dependency Spatial autocorrelation Exploratory Spatial Data Analysis (ESDA): identify sptaial patterns, critical areas and growth trends 14


15 ESDA funtions Exploratory Spatial Data Analysis by Areas Visualization of spatial distributions: thematics maps Equal classes Percentage Standard Deviation Determination of neighborhood relations: spatial weights matrix Matrix W (n x n) wij represents a measure of proximity between Oi and Oj A B C D E A B C D E A B C D E


16 ESDA funtions Exploratory Spatial Data Analysis by Areas Identification of spatial trends: weighted average zi: difference between the value of zone i and the average of all zones; wij: weights according to the spatial weights matrix Estimation of spatial dependebcy: I Moran Global Statistic n: numer of zones zi: difference between the value of zone i and the average of all zones zj: difference between the value of zone i neighbours and the average of all zones wij: weights according to the spatial weights matrix 16


 zi: difference between the")

17 ESDA funtions Exploratory Spatial Data Analysis by Areas Identification of spatial patterns of association and outliers: Moran scatterplot and I Moran Local Statistic (Box Map, Lisa Map e Moran Map) zi: difference between the value of zone i and the average of all zones wij: weights according to the spatial weights matrix + = 17
18 Diagnosis Methodology Mobility: Main parameter of evaluation in Strong dependet of the network configuration and the spatial distribution of socioeconomic variables The construction of a GIS database should precede the implementation of the methodology A. Supply and Demand Characterization A.1. System supply characterization A.3. Adequacy of the network to the users displacement needs B. Accessibility and Mobility analysis A.2. System demanda characterization B.1. Accessibility analysis B.2. Mobility analysis 18
19 Etapa A.1 - Caracterização da Oferta e da Procura do Sistema A. Supply and Demand Characterization A.1. Supply Characterization A.2. Demand Characterization Infrastructure Network Characterization Location and distribution of corridors and public transport lines, bus stops and stations Determination of the catchment coverage of stations Selection and Manipulation Tools Trip flows Characterization Intensity of system use (trips production and attraction regions) Displacement patterns (desire lines) Purpose and modes used in the trips Trips Assignment A.3. Adequacy of the network to the users displacement needs Average time and distances Number of transfers Passengers loading on critical links 19

20 Fortaleza Area: ~ 313 km Population: ~ 2,4 million inhabitant Mobility offer: bus, minivans and taxi 20

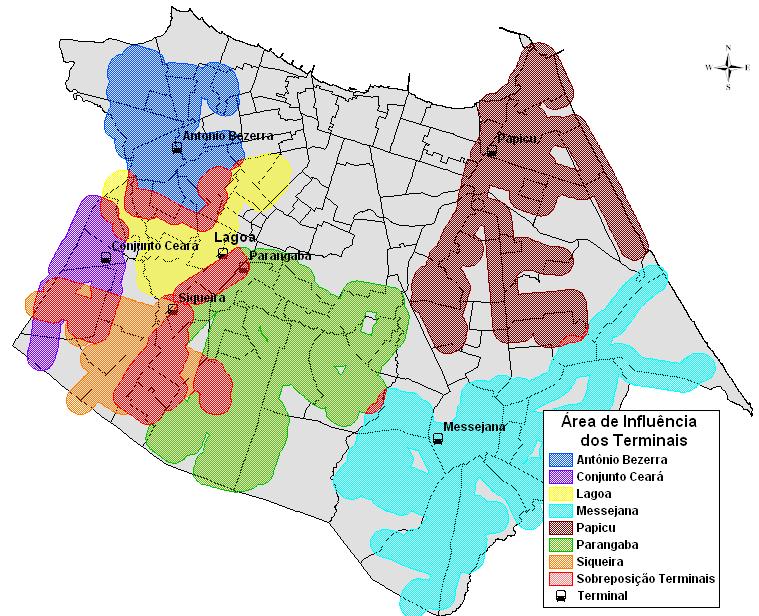


21 Etapa A.1 Supply and Demanda Characterization Network characterization Trips characterization Network load Infrastructure characterization Demand flows characterization Number of transfer 21
22 Etapa B.1 Accessibility Analysis Accessibility Characterization Microacessibility Macroacessibility Spatial Temporal Station catchemt area overlay Accessibility to CBD Selection and Manipulation Tools System coverage Walking distance Avearge wait time ESDA Tools Spatial patterns and critical areas Growth trends Spatial autocorrelation Overlay tools, spatial proximity (buffers) and thematic maps Weighted average maps and I Moran Global and Local Statistics (Boxmap, Lisa map and Moranmap) 22

23 Etapa B.1 Microaccessibility Spatial Accessibility Temporal Accessibility 23

 j Ai accessibility in zone i; Sj attractiviness in zone j; Cij")
24 Etapa B.1 Macroaccessibility Accessibility to the CBD Principal zona de emprego Hansen measure (gravitational): land use and network characteristics A = i S j f ( c ij ) j Ai accessibility in zone i; Sj attractiviness in zone j; Cij cost between zones i and j; f(cij) impedanc function between zones i and j. 24
 Growth")
25 Etapa B.1 Macroaccessibility Accessibility to the CBD Spatial association patterns (Box maps) Growth trends (weighted average) Outliers and clusters (Box maps and Moran maps) ESDA tools 25
26 Etapa B.2 Mobility Analysis Mobility Characterization Mobility rate Mobility Analysis ESDA tools Independent variables characterization Income and accessibility 26
27 Obrigada pela atenção! Camila Garcia PhD Candidate at Instituto Superior Técnico Dep. de Eng. Civil e Arquitectura (sala 4.24) Av. Rovisco Pais, Lisboa / (fax) camilagarcia@civil.ist.utl.pt 27
transportation research in policy making for addressing mobility problems, infrastructure and functionality issues in urban areas. This study explored
 ABSTRACT: Demand supply system are the three core clusters of transportation research in policy making for addressing mobility problems, infrastructure and functionality issues in urban areas. This study
Transit Time Shed Analyzing Accessibility to Employment and Services
 Transit Time Shed Analyzing Accessibility to Employment and Services presented by Ammar Naji, Liz Thompson and Abdulnaser Arafat Shimberg Center for Housing Studies at the University of Florida www.shimberg.ufl.edu
The 3V Approach. Transforming the Urban Space through Transit Oriented Development. Gerald Ollivier Transport Cluster Leader World Bank Hub Singapore
 Transforming the Urban Space through Transit Oriented Development The 3V Approach Gerald Ollivier Transport Cluster Leader World Bank Hub Singapore MDTF on Sustainable Urbanization The China-World Bank
Traffic Demand Forecast
 Chapter 5 Traffic Demand Forecast One of the important objectives of traffic demand forecast in a transportation master plan study is to examine the concepts and policies in proposed plans by numerically
Data Collection. Lecture Notes in Transportation Systems Engineering. Prof. Tom V. Mathew. 1 Overview 1
 Data Collection Lecture Notes in Transportation Systems Engineering Prof. Tom V. Mathew Contents 1 Overview 1 2 Survey design 2 2.1 Information needed................................. 2 2.2 Study area.....................................
Typical information required from the data collection can be grouped into four categories, enumerated as below.
 Chapter 6 Data Collection 6.1 Overview The four-stage modeling, an important tool for forecasting future demand and performance of a transportation system, was developed for evaluating large-scale infrastructure
Trip Distribution Modeling Milos N. Mladenovic Assistant Professor Department of Built Environment
 Trip Distribution Modeling Milos N. Mladenovic Assistant Professor Department of Built Environment 25.04.2017 Course Outline Forecasting overview and data management Trip generation modeling Trip distribution
Travel Time Calculation With GIS in Rail Station Location Optimization
 Travel Time Calculation With GIS in Rail Station Location Optimization Topic Scope: Transit II: Bus and Rail Stop Information and Analysis Paper: # UC8 by Sutapa Samanta Doctoral Student Department of
Figure 8.2a Variation of suburban character, transit access and pedestrian accessibility by TAZ label in the study area
 Figure 8.2a Variation of suburban character, transit access and pedestrian accessibility by TAZ label in the study area Figure 8.2b Variation of suburban character, commercial residential balance and mix
Note on Transportation and Urban Spatial Structure
 Note on Transportation and Urban Spatial Structure 1 By Alain Bertaud, Washington, ABCDE conference, April 2002 Email: duatreb@msn.com Web site: http://alain-bertaud.com/ http://alainbertaud.com/ The physical
Forecasts from the Strategy Planning Model
 Forecasts from the Strategy Planning Model Appendix A A12.1 As reported in Chapter 4, we used the Greater Manchester Strategy Planning Model (SPM) to test our long-term transport strategy. A12.2 The origins
Development of modal split modeling for Chennai
 IJMTES International Journal of Modern Trends in Engineering and Science ISSN: 8- Development of modal split modeling for Chennai Mr.S.Loganayagan Dr.G.Umadevi (Department of Civil Engineering, Bannari
CIV3703 Transport Engineering. Module 2 Transport Modelling
 CIV3703 Transport Engineering Module Transport Modelling Objectives Upon successful completion of this module you should be able to: carry out trip generation calculations using linear regression and category
Application of GIS in Public Transportation Case-study: Almada, Portugal
 Case-study: Almada, Portugal Doutor Jorge Ferreira 1 FSCH/UNL Av Berna 26 C 1069-061 Lisboa, Portugal +351 21 7908300 jr.ferreira@fcsh.unl.pt 2 FSCH/UNL Dra. FCSH/UNL +351 914693843, leite.ines@gmail.com
Regional Performance Measures
 G Performance Measures Regional Performance Measures Introduction This appendix highlights the performance of the MTP/SCS for 2035. The performance of the Revenue Constrained network also is compared to
Regional Performance Measures
 G Performance Measures Regional Performance Measures Introduction This appendix highlights the performance of the MTP/SCS for 2035. The performance of the Revenue Constrained network also is compared to
The Model Research of Urban Land Planning and Traffic Integration. Lang Wang
 International Conference on Materials, Environmental and Biological Engineering (MEBE 2015) The Model Research of Urban Land Planning and Traffic Integration Lang Wang Zhejiang Gongshang University, Hangzhou
COMBINATION OF MACROSCOPIC AND MICROSCOPIC TRANSPORT SIMULATION MODELS: USE CASE IN CYPRUS
 International Journal for Traffic and Transport Engineering, 2014, 4(2): 220-233 DOI: http://dx.doi.org/10.7708/ijtte.2014.4(2).08 UDC: 656:519.87(564.3) COMBINATION OF MACROSCOPIC AND MICROSCOPIC TRANSPORT
URBAN TRANSPORTATION SYSTEM (ASSIGNMENT)
") BRANCH : CIVIL ENGINEERING SEMESTER : 6th Assignment-1 CHAPTER-1 URBANIZATION 1. What is Urbanization? Explain by drawing Urbanization cycle. 2. What is urban agglomeration? 3. Explain Urban Class Groups.
BRANCH : CIVIL ENGINEERING SEMESTER : 6th Assignment-1 CHAPTER-1 URBANIZATION 1. What is Urbanization? Explain by drawing Urbanization cycle. 2. What is urban agglomeration? 3. Explain Urban Class Groups.
APPENDIX IV MODELLING
 APPENDIX IV MODELLING Kingston Transportation Master Plan Final Report, July 2004 Appendix IV: Modelling i TABLE OF CONTENTS Page 1.0 INTRODUCTION... 1 2.0 OBJECTIVE... 1 3.0 URBAN TRANSPORTATION MODELLING
Accessibility Instruments in Planning Practice Spatial Network Analysis for Multi-Modal Transport Systems (SNAMUTS): Adelaide
: Adelaide") Accessibility Instruments in Planning Practice Spatial Network Analysis for Multi-Modal Transport Systems (SNAMUTS): Adelaide Prof Carey Curtis, Dr Jan Scheurer, Roger Mellor, Oscar Thomson Curtin University,
Accessibility Instruments in Planning Practice Spatial Network Analysis for Multi-Modal Transport Systems (SNAMUTS): Adelaide Prof Carey Curtis, Dr Jan Scheurer, Roger Mellor, Oscar Thomson Curtin University,
Tomás Eiró Luis Miguel Martínez José Manuel Viegas
 Acknowledgm ents Tomás Eiró Luis Miguel Martínez José Manuel Viegas Instituto Superior Técnico, Lisboa WSTLUR 2011 Whistler, 29 July 2011 Introduction Background q Spatial interactions models are a key
Visitor Flows Model for Queensland a new approach
 Visitor Flows Model for Queensland a new approach Jason. van Paassen 1, Mark. Olsen 2 1 Parsons Brinckerhoff Australia Pty Ltd, Brisbane, QLD, Australia 2 Tourism Queensland, Brisbane, QLD, Australia 1
Mapping Accessibility Over Time
 Journal of Maps, 2006, 76-87 Mapping Accessibility Over Time AHMED EL-GENEIDY and DAVID LEVINSON University of Minnesota, 500 Pillsbury Drive S.E., Minneapolis, MN 55455, USA; geneidy@umn.edu (Received
How the science of cities can help European policy makers: new analysis and perspectives
 How the science of cities can help European policy makers: new analysis and perspectives By Lewis Dijkstra, PhD Deputy Head of the Economic Analysis Unit, DG Regional and European Commission Overview Data
Forecasts for the Reston/Dulles Rail Corridor and Route 28 Corridor 2010 to 2050
 George Mason University Center for Regional Analysis Forecasts for the Reston/Dulles Rail Corridor and Route 28 Corridor 21 to 25 Prepared for the Fairfax County Department of Planning and Zoning Lisa
Changes in the Spatial Distribution of Mobile Source Emissions due to the Interactions between Land-use and Regional Transportation Systems
 Changes in the Spatial Distribution of Mobile Source Emissions due to the Interactions between Land-use and Regional Transportation Systems A Framework for Analysis Urban Transportation Center University
A Simplified Travel Demand Modeling Framework: in the Context of a Developing Country City
 A Simplified Travel Demand Modeling Framework: in the Context of a Developing Country City Samiul Hasan Ph.D. student, Department of Civil and Environmental Engineering, Massachusetts Institute of Technology,
MOR CO Analysis of future residential and mobility costs for private households in Munich Region
 MOR CO Analysis of future residential and mobility costs for private households in Munich Region The amount of the household budget spent on mobility is rising dramatically. While residential costs can
Accessibility as an Instrument in Planning Practice. Derek Halden DHC 2 Dean Path, Edinburgh EH4 3BA
 Accessibility as an Instrument in Planning Practice Derek Halden DHC 2 Dean Path, Edinburgh EH4 3BA derek.halden@dhc1.co.uk www.dhc1.co.uk Theory to practice a starting point Shared goals for access to
accessibility instruments in planning practice
 accessibility instruments in planning practice Spatial Network Analysis for Multi-Modal Transport Systems (SNAMUTS): Helsinki Prof Carey Curtis, Dr Jan Scheurer, Curtin University, Perth - RMIT University,
City sustainability: a transport perspective a journey continues
 Sustainable Development, Vol. 2 833 City sustainability: a transport perspective a journey continues K. Doust1,2, C. Wang1 & T. Doust2 1 Research Centre for Integrated Transport Innovation (rciti), University
Basics of GIS. by Basudeb Bhatta. Computer Aided Design Centre Department of Computer Science and Engineering Jadavpur University
 Basics of GIS by Basudeb Bhatta Computer Aided Design Centre Department of Computer Science and Engineering Jadavpur University e-governance Training Programme Conducted by National Institute of Electronics
Analyzing the Market Share of Commuter Rail Stations using LEHD Data
 Analyzing the Market Share of Commuter Rail Stations using LEHD Data Using Census Data for Transportation Applications Conference, Irvine, CA October 26, 2011 1. What is the size of Metrolink s commute
City monitoring with travel demand momentum vector fields: theoretical and empirical findings
 City monitoring with travel demand momentum vector fields: theoretical and empirical findings Xintao Liu 1, Joseph Y.J. Chow 2 1 Department of Civil Engineering, Ryerson University, Canada 2 Tandon School
A/Prof. Mark Zuidgeest ACCESSIBILITY EFFECTS OF RELOCATION AND HOUSING PROJECT FOR THE URBAN POOR IN AHMEDABAD, INDIA
 A/Prof. Mark Zuidgeest ACCESSIBILITY EFFECTS OF RELOCATION AND HOUSING PROJECT FOR THE URBAN POOR IN AHMEDABAD, INDIA South African Cities Network/University of Pretoria, 09 April 2018 MOBILITY Ability
Joint-accessibility Design (JAD) Thomas Straatemeier
 Thomas Straatemeier") Joint-accessibility Design (JAD) Thomas Straatemeier To cite this report: Thomas Straatemeier (2012) Joint-accessibility Design (JAD), in Angela Hull, Cecília Silva and Luca Bertolini (Eds.) Accessibility
Joint-accessibility Design (JAD) Thomas Straatemeier To cite this report: Thomas Straatemeier (2012) Joint-accessibility Design (JAD), in Angela Hull, Cecília Silva and Luca Bertolini (Eds.) Accessibility
ANALYSING ROUTE CHOICE DECISIONS ON METRO NETWORKS
 ANALYSING ROUTE CHOICE DECISIONS ON METRO NETWORKS ABSTRACT Sebastián Raveau Department of Transport Engineering and Logistics Pontificia Universidad Católica de Chile Avenida Vicuña Mackenna 4860, Santiago,
Using GIS to Identify Pedestrian- Vehicle Crash Hot Spots and Unsafe Bus Stops
 Using GIS to Identify Pedestrian-Vehicle Crash Hot Spots and Unsafe Bus Stops Using GIS to Identify Pedestrian- Vehicle Crash Hot Spots and Unsafe Bus Stops Long Tien Truong and Sekhar V. C. Somenahalli
Policy Note 6. Measuring Unemployment by Location and Transport: StepSA s Access Envelope Technologies
 6 Measuring Unemployment by Location and Transport: StepSA s Access Envelope Technologies Introduction Increasing emphasis is coming onto spatial planning as government in South Africa moves to address
Beyond Mobility - Understanding and comparing urban accessibility in European Cities. Guy Hitchcock, Knowledge Leader
 Beyond Mobility - Understanding and comparing urban accessibility in European Cities Guy Hitchcock, Knowledge Leader 2 Study on improving the understanding of urban accessibility and road congestion in
California Urban Infill Trip Generation Study. Jim Daisa, P.E.
 California Urban Infill Trip Generation Study Jim Daisa, P.E. What We Did in the Study Develop trip generation rates for land uses in urban areas of California Establish a California urban land use trip
Indicator : Proportion of population that has convenient access to public transport, by sex, age and persons with disabilities
 Goal 11: Make cities and human settlements inclusive, safe, resilient and sustainable Target 11.2: By 2030, provide access to safe, affordable, accessible and sustainable transport systems for all, improving
Metrolinx Transit Accessibility/Connectivity Toolkit
 Metrolinx Transit Accessibility/Connectivity Toolkit Christopher Livett, MSc Transportation Planning Analyst Research and Planning Analytics Tweet about this presentation #TransitGIS OUTLINE 1. Who is
Transport Planning in Large Scale Housing Developments. David Knight
 Transport Planning in Large Scale Housing Developments David Knight Large Scale Housing Developments No longer creating great urban spaces in the UK (Hall 2014) Transport Planning Transport planning processes
Introduction to Spatial Statistics and Modeling for Regional Analysis
 Introduction to Spatial Statistics and Modeling for Regional Analysis Dr. Xinyue Ye, Assistant Professor Center for Regional Development (Department of Commerce EDA University Center) & School of Earth,
Estimating Transportation Demand, Part 2
 Transportation Decision-making Principles of Project Evaluation and Programming Estimating Transportation Demand, Part 2 K. C. Sinha and S. Labi Purdue University School of Civil Engineering 1 Estimating
Leveraging Urban Mobility Strategies to Improve Accessibility and Productivity of Cities
 Leveraging Urban Mobility Strategies to Improve Accessibility and Productivity of Cities Aiga Stokenberga World Bank GPSC African Regional Workshop May 15, 2018 Roadmap 1. Africa s urbanization and its
Regional Growth Strategy Work Session Growth Management Policy Board
 Regional Growth Strategy Work Session Growth Management Policy Board September 6, 2018 1 Overview Recap June GMPB work session Objectives and outcomes Regional geographies Growth scenarios Breakout Discussion:
MOBILITIES AND LONG TERM LOCATION CHOICES IN BELGIUM MOBLOC
 MOBILITIES AND LONG TERM LOCATION CHOICES IN BELGIUM MOBLOC A. BAHRI, T. EGGERICKX, S. CARPENTIER, S. KLEIN, PH. GERBER X. PAULY, F. WALLE, PH. TOINT, E. CORNELIS SCIENCE FOR A SUSTAINABLE DEVELOPMENT
Compact guides GISCO. Geographic information system of the Commission
 Compact guides GISCO Geographic information system of the Commission What is GISCO? GISCO, the Geographic Information System of the COmmission, is a permanent service of Eurostat that fulfils the requirements
KAAF- GE_Notes GIS APPLICATIONS LECTURE 3
 GIS APPLICATIONS LECTURE 3 SPATIAL AUTOCORRELATION. First law of geography: everything is related to everything else, but near things are more related than distant things Waldo Tobler Check who is sitting
OPTIMISING SETTLEMENT LOCATIONS: LAND-USE/TRANSPORT MODELLING IN CAPE TOWN
 OPTIMISING SETTLEMENT LOCATIONS: LAND-USE/TRANSPORT MODELLING IN CAPE TOWN Molai, L. and Vanderschuren, M.J.W.A. Civil Engineering, Faculty of Engineering and the Built Environment, University of Cape
A Joint Tour-Based Model of Vehicle Type Choice and Tour Length
 A Joint Tour-Based Model of Vehicle Type Choice and Tour Length Ram M. Pendyala School of Sustainable Engineering & the Built Environment Arizona State University Tempe, AZ Northwestern University, Evanston,
A BASE SYSTEM FOR MICRO TRAFFIC SIMULATION USING THE GEOGRAPHICAL INFORMATION DATABASE
 A BASE SYSTEM FOR MICRO TRAFFIC SIMULATION USING THE GEOGRAPHICAL INFORMATION DATABASE Yan LI Ritsumeikan Asia Pacific University E-mail: yanli@apu.ac.jp 1 INTRODUCTION In the recent years, with the rapid
Encapsulating Urban Traffic Rhythms into Road Networks
 Encapsulating Urban Traffic Rhythms into Road Networks Junjie Wang +, Dong Wei +, Kun He, Hang Gong, Pu Wang * School of Traffic and Transportation Engineering, Central South University, Changsha, Hunan,
Exploring Human Mobility with Multi-Source Data at Extremely Large Metropolitan Scales. ACM MobiCom 2014, Maui, HI
 Exploring Human Mobility with Multi-Source Data at Extremely Large Metropolitan Scales Desheng Zhang & Tian He University of Minnesota, USA Jun Huang, Ye Li, Fan Zhang, Chengzhong Xu Shenzhen Institute
Simulating Mobility in Cities: A System Dynamics Approach to Explore Feedback Structures in Transportation Modelling
 Simulating Mobility in Cities: A System Dynamics Approach to Explore Feedback Structures in Transportation Modelling Dipl.-Ing. Alexander Moser [amoser@student.tugraz.at] IVT Tagung 2013 - Kloster Kappel
Economic consequences of floods: impacts in urban areas
 Economic consequences of floods: impacts in urban areas SWITCH Paris Conference Paris, 24 th 26 th January 2011 Economic consequences of floods: impacts in urban areas Institutions: Authors Vanessa Cançado
The Built Environment, Car Ownership, and Travel Behavior in Seoul
 The Built Environment, Car Ownership, and Travel Behavior in Seoul Sang-Kyu Cho, Ph D. Candidate So-Ra Baek, Master Course Student Seoul National University Abstract Although the idea of integrating land
Introduction and Project Overview
 Greater New Orleans Regional Land Use Modeling GIS Techniques in a P olitical C ontext Louisiana Remote Sensing and GIS Workshop Wednesday, April 24, 2013 Working Towards a Shared Regional Vision Introduction
From transport to accessibility: the new lease of life of an old concept
 Paris 07 /01/ 2015 From transport to accessibility: the new lease of life of an old concept Pr. Yves Crozet Laboratory of Transport Economics (LET) University of Lyon (IEP) - France yves.crozet@let.ish-lyon.cnrs.fr
Existing road transport network of the National Capital Region was examined for the existing connectivity, mobility and accessibility in the study.
 2 Road Network 2.1 Existing Road Network The existing transport network in National Capital Region is radial in nature. It comprises of expressways, national highways, state highways, major district and
Accessibility Instruments in Planning Practice Spatial Network Analysis for Multi-Modal Transport Systems (SNAMUTS): Adelaide
: Adelaide") Accessibility Instruments in Planning Practice Spatial Network Analysis for Multi-Modal Transport Systems (SNAMUTS): Adelaide Prof Carey Curtis, Dr Jan Scheurer, Roger Mellor, Oscar Thomson Curtin University,
Accessibility Instruments in Planning Practice Spatial Network Analysis for Multi-Modal Transport Systems (SNAMUTS): Adelaide Prof Carey Curtis, Dr Jan Scheurer, Roger Mellor, Oscar Thomson Curtin University,
STILLORGAN QBC LEVEL OF SERVICE ANALYSIS
 4-5th September, STILLORGAN QBC LEVEL OF SERVICE ANALYSIS Mr David O Connor Lecturer Dublin Institute of Technology Mr Philip Kavanagh Graduate Planner Dublin Institute of Technology Abstract Previous
Public Transport Versus Private Car: GIS-Based Estimation of Accessibility Applied to the Tel Aviv Metropolitan Area
 Public Transport Versus Private Car: GIS-Based Estimation of Accessibility Applied to the Tel Aviv Metropolitan Area Itzhak Benenson 1, Karel Martens 3, Yodan Rofe 2, Ariela Kwartler 1 1 Dept of Geography
Assessing the Employment Agglomeration and Social Accessibility Impacts of High Speed Rail in Eastern Australia: Sydney-Canberra-Melbourne Corridor
 Assessing the Employment Agglomeration and Social Accessibility Impacts of High Speed Rail in Eastern Australia: Sydney-Canberra-Melbourne Corridor Professor David A. Hensher FASSA Founding Director Institute
CIE4801 Transportation and spatial modelling Modal split
 CIE4801 Transportation and spatial modelling Modal split Rob van Nes, Transport & Planning 31-08-18 Delft University of Technology Challenge the future Content Nested logit part 2 Modelling component 3:
The design of Demand-Adaptive public transportation Systems: Meta-Schedules
 The design of Demand-Adaptive public transportation Systems: Meta-Schedules Gabriel Teodor Crainic Fausto Errico ESG, UQAM and CIRRELT, Montreal Federico Malucelli DEI, Politecnico di Milano Maddalena
Financing Urban Transport. UNESCAP-SUTI Event
 Financing Urban Transport UNESCAP-SUTI Event October 2017 Urban Transport in Context 2 The spiky urban economy of global cities 3 Mass transit networks converge towards a characteristic structure with
City of Jerez Urban Core Densification proposal; An Agent Based Spatio-temporal model
 Modelling urban population allocation City of Jerez Urban Core Densification proposal; An Agent Based Spatio-temporal model Elke Sauter Julia Úbeda Who we are & why we are here Masters programme: Geographical
INSPIRE in the context of EC Directive 2002/49/EC on Environmental Noise
 INSPIRE in the context of EC Directive 2002/49/EC on Environmental Noise Simon Shilton Acustica Ltd, United Kingdom Nigel Jones Extrium Ltd, United Kingdom About the Authors www.acustica.co.uk Acoustics
Geographic/Demographic Accessibility of Transport Infrastructure (GDATI)
") Geographic/Demographic Accessibility of Transport Infrastructure (GDATI) Lidia Zakowska, Wieslaw Starowicz, Sabina Pulawska To cite this report: Lidia Zakowska, Wieslaw Starowicz and Sabina Pulawska (2012)
Geographic/Demographic Accessibility of Transport Infrastructure (GDATI) Lidia Zakowska, Wieslaw Starowicz, Sabina Pulawska To cite this report: Lidia Zakowska, Wieslaw Starowicz and Sabina Pulawska (2012)
Transit Service Gap Technical Documentation
 Transit Service Gap Technical Documentation Introduction This document is an accompaniment to the AllTransit TM transit gap methods document. It is a detailed explanation of the process used to develop
THE FUTURE OF FORECASTING AT METROPOLITAN COUNCIL. CTS Research Conference May 23, 2012
 THE FUTURE OF FORECASTING AT METROPOLITAN COUNCIL CTS Research Conference May 23, 2012 Metropolitan Council forecasts Regional planning agency and MPO for Twin Cities metropolitan area Operates regional
New Frameworks for Urban Sustainability Assessments: Linking Complexity, Information and Policy
 New Frameworks for Urban Sustainability Assessments: Linking Complexity, Information and Policy Moira L. Zellner 1, Thomas L. Theis 2 1 University of Illinois at Chicago, Urban Planning and Policy Program
Subject: Note on spatial issues in Urban South Africa From: Alain Bertaud Date: Oct 7, A. Spatial issues
 Page 1 of 6 Subject: Note on spatial issues in Urban South Africa From: Alain Bertaud Date: Oct 7, 2009 A. Spatial issues 1. Spatial issues and the South African economy Spatial concentration of economic
Lecture 3: Exploratory Spatial Data Analysis (ESDA) Prof. Eduardo A. Haddad
 Prof. Eduardo A. Haddad") Lecture 3: Exploratory Spatial Data Analysis (ESDA) Prof. Eduardo A. Haddad Key message Spatial dependence First Law of Geography (Waldo Tobler): Everything is related to everything else, but near things
Lecture 3: Exploratory Spatial Data Analysis (ESDA) Prof. Eduardo A. Haddad Key message Spatial dependence First Law of Geography (Waldo Tobler): Everything is related to everything else, but near things
A Micro-Analysis of Accessibility and Travel Behavior of a Small Sized Indian City: A Case Study of Agartala
 A Micro-Analysis of Accessibility and Travel Behavior of a Small Sized Indian City: A Case Study of Agartala Moumita Saha #1, ParthaPratim Sarkar #2,Joyanta Pal #3 #1 Ex-Post graduate student, Department
Identifying Megaregions in the US: Implications for Infrastructure Investment
 7. 10. 2 0 08 Identifying Megaregions in the US: Implications for Infrastructure Investment Dr. Myungje Woo Dr. Catherine L. Ross Jason Barringer Harry West Jessica Lynn Harbour Doyle Center for Quality
Urban GIS for Health Metrics
 Urban GIS for Health Metrics Dajun Dai Department of Geosciences, Georgia State University Atlanta, Georgia, United States Presented at International Conference on Urban Health, March 5 th, 2014 People,
GIS Analysis of Crenshaw/LAX Line
 PDD 631 Geographic Information Systems for Public Policy, Planning & Development GIS Analysis of Crenshaw/LAX Line Biying Zhao 6679361256 Professor Barry Waite and Bonnie Shrewsbury May 12 th, 2015 Introduction
Urban Spatial Scenario Design Modelling (USSDM) in Dar es Salaam: Background Information
 in Dar es Salaam: Background Information") Urban Spatial Scenario Design Modelling (USSDM) in Dar es Salaam: Background Information Modelling urban settlement dynamics in Dar es Salaam Revision: 2 (July 2013) Prepared by: Katja Buchta TUM team
Urban Spatial Scenario Design Modelling (USSDM) in Dar es Salaam: Background Information Modelling urban settlement dynamics in Dar es Salaam Revision: 2 (July 2013) Prepared by: Katja Buchta TUM team
True Smart and Green City? 8th Conference of the International Forum on Urbanism
 ,, doi:10.3390/ifou-. True Smart and Green City? 8th Conference of the International Forum on Urbanism Conference Proceedings Paper Comparable Measures of Accessibility to Public Transport by the General
INTRODUCTION TO TRANSPORTATION SYSTEMS
 INTRODUCTION TO TRANSPORTATION SYSTEMS Lectures 5/6: Modeling/Equilibrium/Demand 1 OUTLINE 1. Conceptual view of TSA 2. Models: different roles and different types 3. Equilibrium 4. Demand Modeling References:
The Spatial Structure of Cities: International Examples of the Interaction of Government, Topography and Markets
 Module 2: Spatial Analysis and Urban Land Planning The Spatial Structure of Cities: International Examples of the Interaction of Government, Topography and Markets Alain Bertaud Urbanist Summary What are
Accessibility: an academic perspective
 Accessibility: an academic perspective Karst Geurs, Associate Professor, Centre for Transport Studies, University of Twente, the Netherlands 28-2-2011 Presentatietitel: aanpassen via Beeld, Koptekst en
GIS = Geographic Information Systems;
 What is GIS GIS = Geographic Information Systems; What Information are we talking about? Information about anything that has a place (e.g. locations of features, address of people) on Earth s surface,
Assessing spatial distribution and variability of destinations in inner-city Sydney from travel diary and smartphone location data
 Assessing spatial distribution and variability of destinations in inner-city Sydney from travel diary and smartphone location data Richard B. Ellison 1, Adrian B. Ellison 1 and Stephen P. Greaves 1 1 Institute
Place Syntax Tool (PST)
") Place Syntax Tool (PST) Alexander Ståhle To cite this report: Alexander Ståhle (2012) Place Syntax Tool (PST), in Angela Hull, Cecília Silva and Luca Bertolini (Eds.) Accessibility Instruments for Planning
Place Syntax Tool (PST) Alexander Ståhle To cite this report: Alexander Ståhle (2012) Place Syntax Tool (PST), in Angela Hull, Cecília Silva and Luca Bertolini (Eds.) Accessibility Instruments for Planning
2040 MTP and CTP Socioeconomic Data
 SE Data 6-1 24 MTP and CTP Socioeconomic Data Purpose of Socioeconomic Data The socioeconomic data (SE Data) shows the location of the population and employment, median household income and other demographic
VALIDATING THE RELATIONSHIP BETWEEN URBAN FORM AND TRAVEL BEHAVIOR WITH VEHICLE MILES TRAVELLED. A Thesis RAJANESH KAKUMANI
 VALIDATING THE RELATIONSHIP BETWEEN URBAN FORM AND TRAVEL BEHAVIOR WITH VEHICLE MILES TRAVELLED A Thesis by RAJANESH KAKUMANI Submitted to the Office of Graduate Studies of Texas A&M University in partial
Identifying Inaccessible Areas with Potential to Enhance Transit Market
 Identifying Inaccessible Areas with Potential to Enhance Transit Market Srinivas S. Pulugurtha, Venkata Ramana Duddu, Rakesh Mora The University of North Carolina at Charlotte Abstract The focus of this
Geographic Information Systems (GIS) in Environmental Studies ENVS Winter 2003 Session III
 in Environmental Studies ENVS Winter 2003 Session III") Geographic Information Systems (GIS) in Environmental Studies ENVS 6189 3.0 Winter 2003 Session III John Sorrell York University sorrell@yorku.ca Session Purpose: To discuss the various concepts of space,
Geographic Information Systems (GIS) in Environmental Studies ENVS 6189 3.0 Winter 2003 Session III John Sorrell York University sorrell@yorku.ca Session Purpose: To discuss the various concepts of space,
Nature of Spatial Data. Outline. Spatial Is Special
 Nature of Spatial Data Outline Spatial is special Bad news: the pitfalls of spatial data Good news: the potentials of spatial data Spatial Is Special Are spatial data special? Why spatial data require
Estimation of Travel demand from the city commuter region of Muvattupuzha municipal area Mini.M.I 1 Dr.Soosan George.T 2 Rema Devi.M.
 Estimation of Travel demand from the city commuter region of Muvattupuzha municipal area Mini.M.I 1 Dr.Soosan George.T 2 Rema Devi.M. 3 Professor, Department of Civil Engg., M.A.College of Engg, Kothamangalam,
Geographical Information Systems Energy Database Report. WP1 T1.3- Deliverable 1.9
 Geographical Information Systems Energy Database Report WP1 T1.3- Deliverable 1.9 March 2015 1 314164 (ENER/FP7/314164) Project acronym: InSMART Project full title: Integrative Smart City Planning Coordination
Application of GIS in urban planning. Iran Experiences of land use planning and air pollution
 Application of GIS in urban planning Iran Experiences of land use planning and air pollution Index Introducing the case study Geographical characteristics Demographical characteristics Urban Development
Luc Anselin Spatial Analysis Laboratory Dept. Agricultural and Consumer Economics University of Illinois, Urbana-Champaign
 GIS and Spatial Analysis Luc Anselin Spatial Analysis Laboratory Dept. Agricultural and Consumer Economics University of Illinois, Urbana-Champaign http://sal.agecon.uiuc.edu Outline GIS and Spatial Analysis
How Geography Affects Consumer Behaviour The automobile example
 How Geography Affects Consumer Behaviour The automobile example Murtaza Haider, PhD Chuck Chakrapani, Ph.D. We all know that where a consumer lives influences his or her consumption patterns and behaviours.