Drehid MBT Facility- Waste Licence EIS
|
|
|
- Tobias Stokes
- 5 years ago
- Views:
Transcription
 Facility will have on the surrounding")
1 11 TRAFFIC 11.1 INTRODUCTION This Chapter assesses the potential impact that both the construction and operational phases of the proposed Mechanical Biological Treatment (MBT) Facility will have on the surrounding road network. This assessment will calculate the expected volume of traffic that will be generated by the proposed development, outline proposed haul routes that vehicles associated with the MBT Facility will follow and assess the potential impact that the generated traffic flows will have on the road network Methodology In preparing this Chapter, TOBIN Consulting Engineers have made reference to: The NRA Traffic and Transport Assessment Guidelines ; The NRA Project Appraisal Guidelines ; The NRA Design Manual for Roads and Bridges (NRA DMRB) UK DMRB TA 46/97 Traffic Flow Ranges for Use in the Assessment of New Rural Roads Kildare County Development Plan ; and NRA Traffic Counter Data available on Traffic surveys were carried out at the entrance to the landholding and at 10 locations on the surrounding road network. These flows were then adjusted to take account of seasonal variation and yearly traffic growth to determine the background traffic flows for each year analysed. Estimates for the amount of heavy goods vehicle (HGV) traffic to be generated by the construction phase of the proposed development are based on the likely number of deliveries of construction materials to the site. Estimates for the amount of HGV traffic to be generated by the operational phase of the proposed development are based on the quantities of waste and outputs that will be delivered to and from the MBT Facility. The arrival and departure of workers/staff during the construction stage and the operational stage have also been considered in this assessment. The generated traffic was then distributed onto the road network where it was combined with the background traffic flows and subsequently analysed. As outlined in Section 11.3 herein, three traffic scenarios have been considered, two representing different operational phases of the MBT Facility and one representing the construction phase of the MBT Facility. The existing entrance from the R403 Regional Road will also provide access to the proposed MBT Facility. This existing entrance is a priority junction and, as such, has been analysed using the Transport Research Laboratory (TRL) computer program PICADY, which is widely used for the analysis of priority junctions. Page No. 339 EPA Export :23:47:01
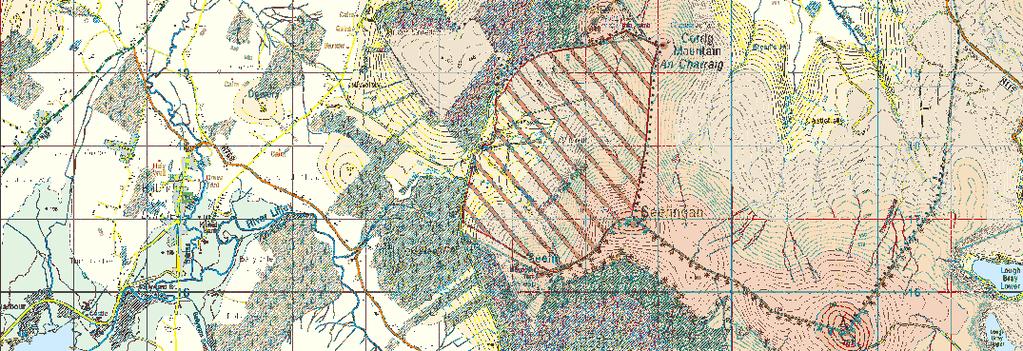
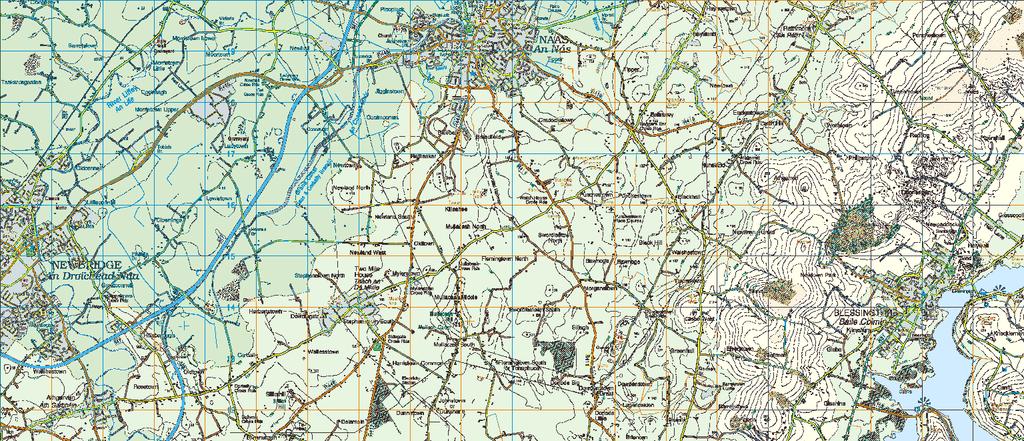
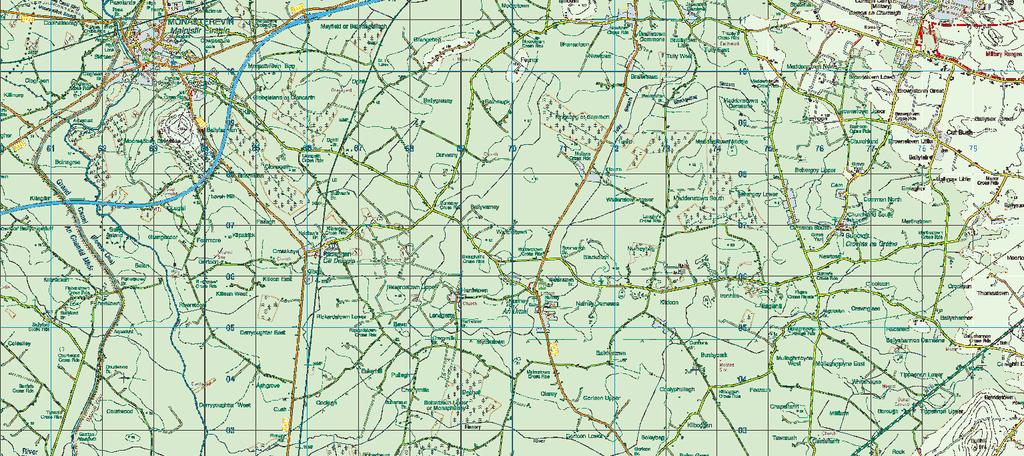
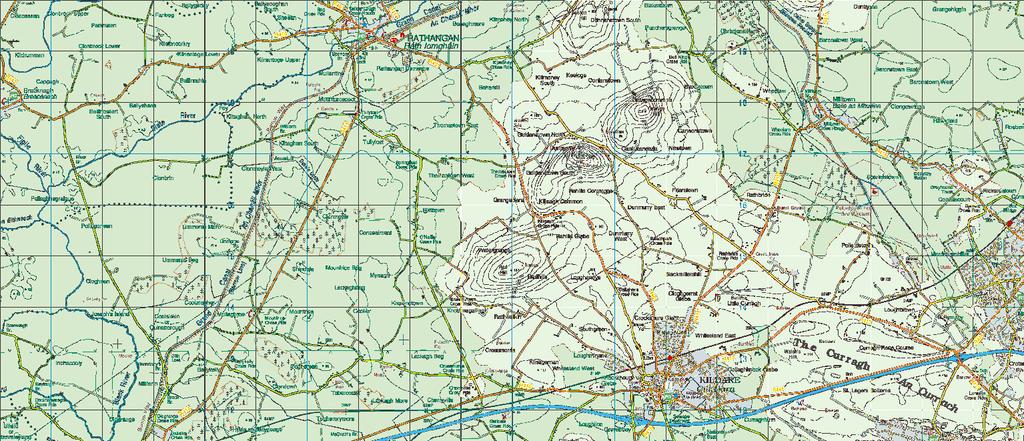
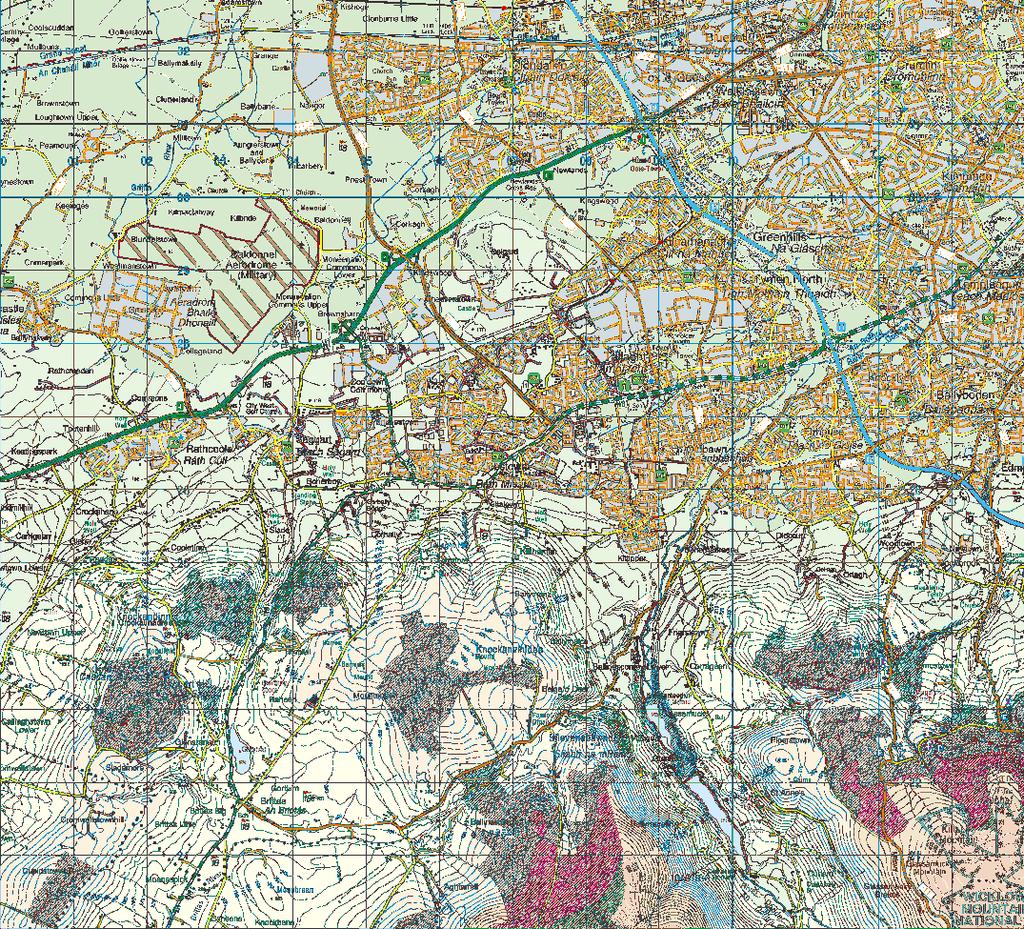
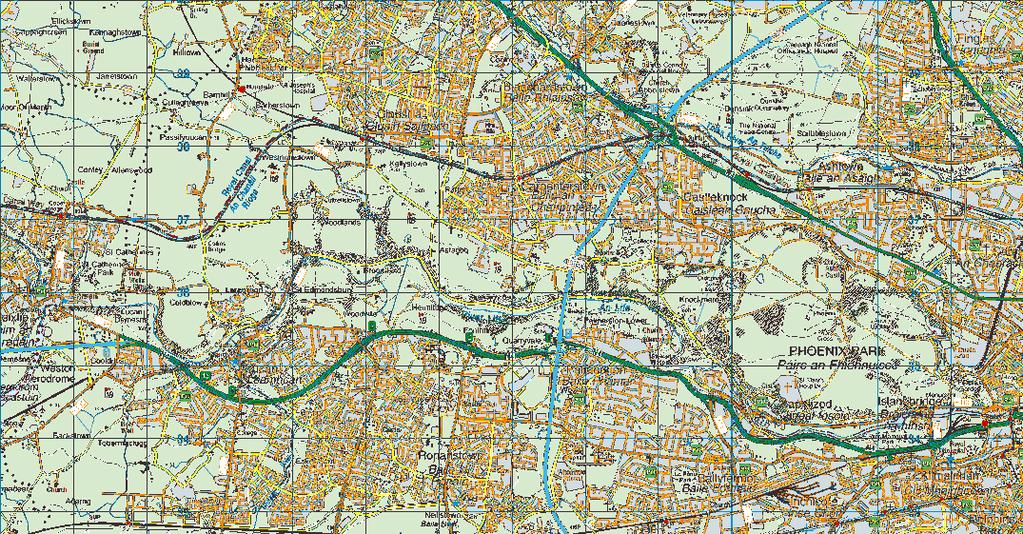
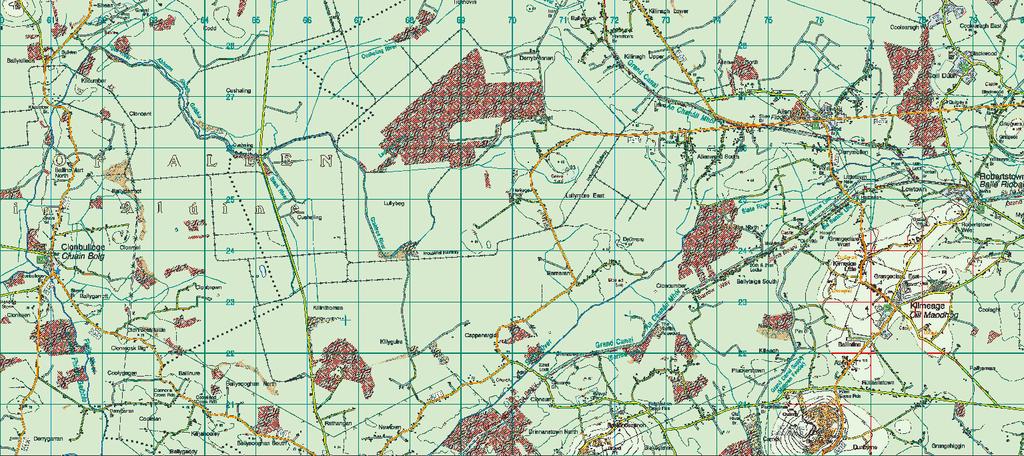
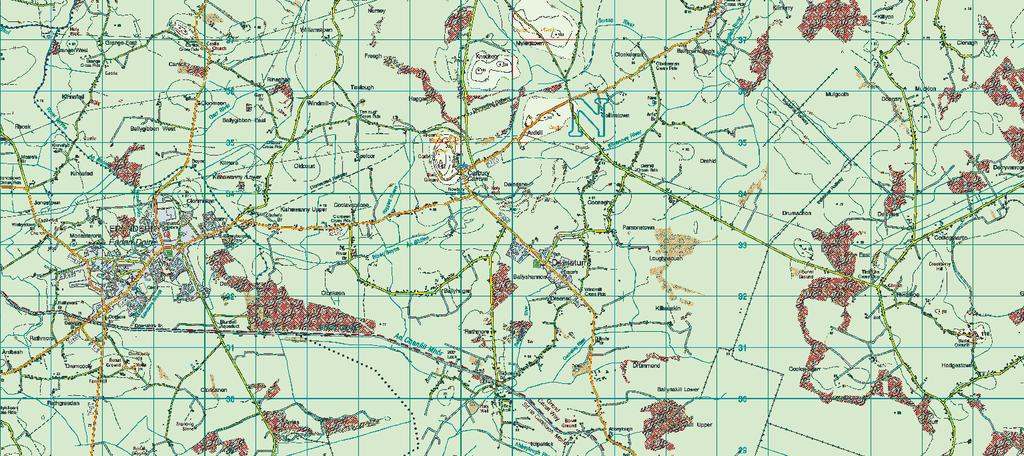
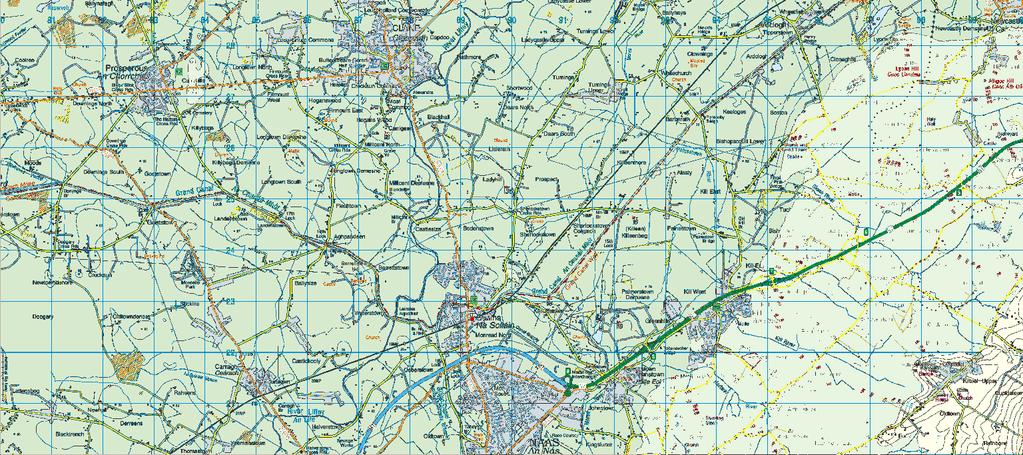
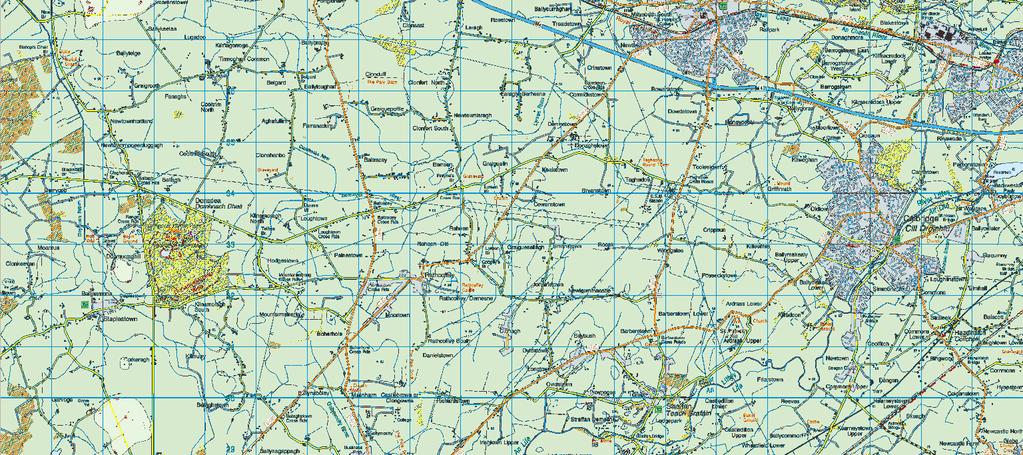
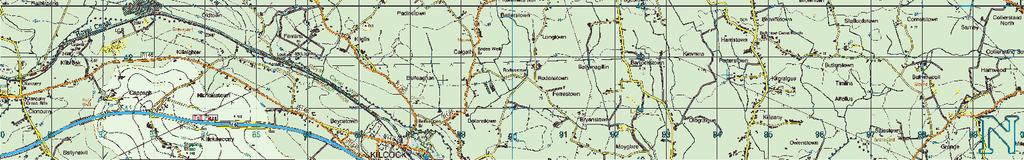
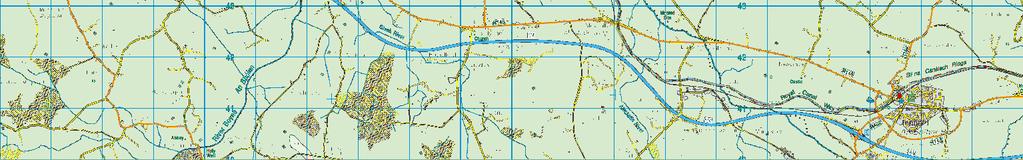
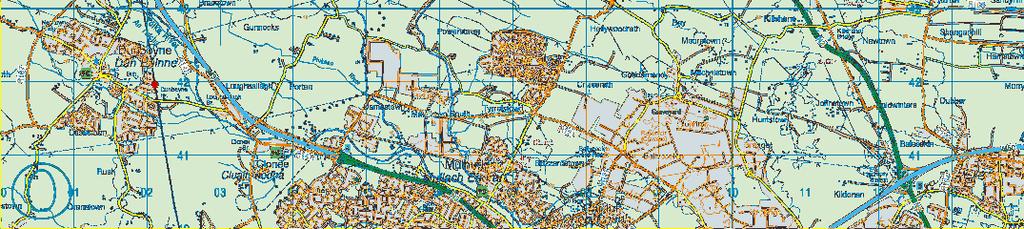
2 11.2 EXISTING ENVIRONMENT Traffic Survey Traffic surveys were carried out on the surrounding road network in order to determine background traffic flows on the haul routes that will be used by MBT Facility traffic. These counts were carried out by Abacus Transportation Surveys Limited, the type, location and date of which are listed below: Manual Classified Traffic Survey, existing site entrance on R403, Tuesday 31 st January 2012 between 07:00 and 19:00 Automated Traffic Counter, R402 East of Carbury, Saturday 28 th January to Saturday 4 th February 2012 Automated Traffic Counter, R402 West of Carbury, Saturday 28 th January to Saturday 4 th February 2012 Automated Traffic Counter, R403 South of Carbury, Saturday 28 th January to Saturday 4 th February 2012 Automated Traffic Counter, R403 North of Canal, Saturday 28 th January to Saturday 4 th February 2012 Automated Traffic Counter, R414 West of Canal, Saturday 28 th January to Saturday 4 th February 2012 Automated Traffic Counter, R415 South of Allenwood, Saturday 28 th January to Saturday 4 th February 2012 Automated Traffic Counter, R403 East of Allenwood, Saturday 28 th January to Saturday 4 th February 2012 Automated Traffic Counter, R409 North of Goatstown, Saturday 28 th January to Saturday 4 th February 2012 Automated Traffic Counter, R403 East of Prosperous, Saturday 28 th January to Saturday 4 th February 2012 Automated Traffic Counter, R407 South of Clane, Saturday 28 th January to Saturday 4 th February 2012 The surveys distinguished between cars / light goods vehicles, buses and heavy goods vehicles. Details of the results of these surveys are provided in Appendix 11.1 of this Report. The locations of the traffic counts undertaken are shown in Figure In addition to the traffic surveys listed above, further traffic data has been sourced from Kildare County Council and the National Roads Authority Road Network The proposed development is located within the townlands of Coolcorrigan, and Drummond, Carbury, Co. Kildare within an overall landholding which is under the ownership of. The site is accessible via a network of regional routes which in turn link with the National Primary Road / Motorway network. Access to the site will be provided by an existing entrance on the R403. The R403 lies south, southwest and west of the site and joins the R402 at Carbury to the northwest of the site. The permitted and operational Drehid Waste Management Facility is located within this landholding approximately 1km north of the proposed site for the MBT Facility. Page No. 340 EPA Export :23:47:01
3 The haul routes to be followed by traffic associated with the proposed development are presented in Figure 11.1 and it is proposed that traffic will be dispersed over these routes. Each of these routes is via regional roads or a combination of regional roads and national primary routes. All construction contractors, and all contractors delivering waste to the proposed MBT Facility, will be issued with a map of permitted haul routes such that all materials imported into the proposed development or exported from the proposed development are transported via one of the identified haul routes. The significant majority of the roads making up the haul routes are sufficiently wide to accommodate two way HGV movement along them. Where there are narrow sections along a haul route, these sections are short in nature with ample opportunities for vehicles to pass. Access has been provided into the previously permitted Drehid Waste Management Facility from the R403 via a previously permitted entrance and a dedicated 4.8km private access road. The existing entrance on the R403 is located within an 80km/h speed zone. The R403 has an approximate carriageway width of 6.0m in the vicinity of the site entrance. A ghost island junction with 3m wide through lanes and a 3m wide right turning lane has been provided at the existing entrance with visibility splays of 3.0 x 160m in accordance with NRA DMRB TD The site is accessed from the north via the R402 and R403. The R402 is a Regional Road and provides access from the M4 Motorway to the site via the R403, where the existing entrance junction is located. The R402 varies in width from between approximately 5.3m and 8.8m. There are road markings and signage along this route. The junction between the R402 and R403 is a simple priority junction with adequate visibility. The site is accessed from the south by the R407, R409 or R415/R416, which lead to the R403. The R407 is a Regional Road, which runs from the M7 to the R403 in Clane. The carriageway width of the R407 varies between approximately 6.0m and 7.0m. The junction between the R407 and the R403 is located in Clane. It is a traffic signal controlled junction with adequate visibility. The R409 Regional Road provides access from the M7 Naas Bypass to the R403. It is a single carriageway and varies in width from approximately 5.2m to 6.4m. The junction between the R409 and the R403 is a priority crossroads with the fourth arm being a local road. Visibility at this location is restricted for cars by the horizontal and vertical geometry of the R403, however visibility is available for HGV traffic. The R415/R416 Regional Road provides access to the R403 from the M9 Motorway. There are 2 bridges along this route at which the road width is restricted to approximately 5.3m Proposed Road Network Improvements The R402 Enfield to Edenderry Improvement Scheme is currently under construction. A section of the R402 (from Carbury to the M4 Motorway) is currently an approved haul route for the permitted and operational Drehid Waste Management Facility and is a proposed haul route for the proposed MBT Facility. The proposed works will comprise: Page No. 341 EPA Export :23:47:01
4 The construction of approximately 10.2 km of a two-way single carriageway road; The construction and realignment of affected side roads along with associated junctions; The construction of a roundabout junction where the proposed road crosses the existing R402 south of Carbury; and Associated earthworks and appropriate landscape works POTENTIAL IMPACTS Both Configuration A (MBT with Composting) and Configuration B (MBT with Dry Anaerobic Digestion and Composting) will have the same footprint and will accept similar volumes of waste. It is expected that the volume of outputs produced by Configuration B (MBT with Dry Anaerobic Digestion and Composting), that will require an outward destination, will be marginally greater than the volume of outputs produced by Configuration A (MBT with Composting). As such, and as a worst case scenario, the Configuration B traffic volumes are used in this assessment Existing and Proposed Development (Scenarios) The existing Drehid Waste Management Facility located within the landholding consists of a landfill operation and a composting facility. The landfill is currently permitted to accept 360,000 tonnes of waste per annum until 1 st December Thereafter the existing landfill will be permitted to accept 120,000 tonnes of waste per annum until Given that approximately 69,617 tonnes of outputs from the proposed MBT Facility will be accepted at the existing landfill for the remainder of its operational life, there will be a corresponding reduction in the amount of waste accepted directly at the existing landfill from external sources. Following the commencement of operations at the proposed MBT Facility, it is envisaged that the existing landfill will accept approximately 50,383 (i.e. 120,000 69,617) tonnes per annum directly from external sources. The operation of the proposed MBT Facility during the remaining life of the existing landfill is referred to in subsequent sections as Scenario 1. This scenario is relevant from 2015 (envisaged year of commencement of operations at the MBT Facility) until 2028 (year that the existing landfill s current planning permission is due to expire). As the existing landfill s current planning permission to accept waste is due to expire in 2028, a further scenario (Scenario 2) is considered whereby all MBT outputs are exported out of the landholding to alternative destinations. This scenario is relevant from 2028 onwards. A planning search of the areas surrounding the proposed development has been carried out. Committed development recorded consists of domestic structures. These are assumed to be accounted for within annual growth factors applied to the traffic survey data. Page No. 342 EPA Export :23:47:01
5 Traffic Generation The volume of HGV traffic that is expected to be generated by deliveries of waste to the proposed Drehid MBT Facility, upon commencement of the operational phase of the proposed MBT Facility has been estimated, as presented in Table Given that the envisaged year of commencement of the operational phase of the proposed MBT Facility is 2015, it should be noted that the existing landfill will have reverted from a permitted waste acceptance of 360,000 tonnes per annum to a permitted waste acceptance of 120,000 tonnes per annum at that point. Table 11.1 below provides a breakdown of the estimated HGV traffic generated by waste deliveries to the proposed MBT Facility for both Scenario 1 (where certain MBT outputs are accepted at the existing landfill) and Scenario 2 (where all MBT outputs (excluding biogas) are transported out of the landholding on to the surrounding road network). Due to the acceptance of certain MBT outputs at the existing landfill, the volume of HGV traffic delivering material directly to the existing landfill from external sources will be reduced. To account for this reduction, the landfill HGV traffic generation has been considered in Scenario 1. Table 11-1 Estimated Deliveries to the existing landfill and the MBT Facility from 2015 Estimated Deliveries to the existing Landfill and the proposed MBT Facility from 2015 Scenario 1: Facility Deliveries to Landfill Volume (tonnes per annum) Deliveries per year 1 Deliveries per day 2 Deliveries per hour 3 Direct to Landfill 50,383 2, Deliveries to Proposed MBT Facility: MBT Plant 250,000 12, Scenario 1 Total 300,383 15, Scenario 2: Deliveries to Proposed MBT Facility: MBT Plant 250,000 12, Scenario 2 Total 250,000 12, Notes (1) Bulk Haulage Vehicles 20 tonne payloads assumed (2) 312 working days assumed based on 52 weeks per year and 6 days per week (3) 10 hour working day assumed (4) Numbers of trips have been rounded up to nearest whole number. In the hourly figures presented, this may result in some overestimating of the number of vehicles Page No. 343 EPA Export :23:47:01
6 As previously outlined, the proposed MBT Facility will produce outputs that require an onward destination. Table 11.2 below provides an estimate of the volume of HGV traffic that will be generated by the departure of outputs from the proposed MBT Facility, on to the surrounding road network, upon commencement of operations at the proposed MBT Facility during both Scenario 1 and Scenario 2. As with the deliveries in Table 11.1, the existing landfill is considered in Scenario 1. Table 11-2 Estimated HGV Traffic Departing the existing landfill and the MBT Facility from 2015 Estimated HGV Traffic Departing the existing Landfill and the proposed MBT Facility from 2015 Scenario 1: Facility Departures from Landfill Volume (tonnes per annum) Total Departures per year 1 Departures per day 2 Departures per hour 3 Landfill Leachate 6 10, Departures from Proposed MBT Facility: Recovered Recyclables 37,397 1, SRF Produced 78,159 3, Waste Water 5 3, Sub Total 118,841 6, Scenario 1 Total 129,609 6, Scenario 2: Departures from Proposed MBT Facility: Recovered Recyclables 37,397 1, SRF Produced 78,159 3, Biostabilised Waste 50, Rejects 19, Waste Water 5 3, Scenario 2 Total 188,458 9, Notes (1) Bulk Haulage Vehicles - 20 tonne payloads assumed (2) 312 working days assumed based on 52 weeks per year and 6 days per week (3) 10 hour working day assumed (4) Numbers of trips have been rounded up to nearest whole number. In the hourly figures presented, this may result in some overestimating of the number of vehicles (5) Waste water will be produced by Configuration B (MBT with Dry Anaerobic Digestion and Composting) only..it is assumed the tanker used to transport this waste water off site will be capable of carrying 10m 3 (6) Landfill leachate is transported off site using 23m 3 tankers and collected on 5 days per week Page No. 344 EPA Export :23:47:01
7 When the baseline traffic counts were undertaken in early 2012, the traffic generated by the existing landfill was on the basis of a permitted waste acceptance of 360,000 tonnes of material per annum. Due to the interaction between the proposed MBT Facility and the existing landfill in Scenario 1, this Chapter has taken into consideration the HGV traffic associated with the existing landfill in addition to the proposed MBT Facility traffic. The net increase in HGV traffic due to the proposed MBT Facility during Scenario 1 will, therefore, be the volumes of HGV traffic presented in Tables 11.1 and 11.2 above, less the existing HGV traffic generated by the operation of the landfill. As the existing landfill will have ceased to operate during Scenario 2, the net increase in HGV traffic for this scenario will be the volumes of traffic presented in Tables 11.1 and 11.2 above, less the existing HGV traffic generated by the operation of the landfill. The volumes of HGV traffic generated by the existing landfill operating at a waste acceptance of 360,000 tonnes per annum are shown in Table 11.3 below. Table 11-3 Estimated HGV Traffic Generated by the existing landfill operating at 360,000 tonnes per annum Estimated HGV Traffic Generated by the existing Landfill Operating at 360,000 tonnes per Annum Facility Volume (tonnes per annum) Total Trips per year 1 Trips per day 2 Trips per hour 3 Landfill 360,000 18, Landfill Leachate 5 10, Total 370,768 18, Notes (1) Bulk Haulage Vehicles - 20 tonne payloads assumed (2) 312 working days assumed based on 52 weeks per year and 6 days per week (3) 10 hour working day assumed (4) Numbers of trips have been rounded up to nearest whole number. In the hourly figures presented, this may result in some overestimating of the number of vehicles (5) Landfill leachate is transported off site using 23m 3 tankers and collected on 5 days per week Page No. 345
8 A summary of the increase in daily HGV traffic as a result of the proposed MBT Facility is shown in Table 11.4 below for both Scenario 1 and Scenario 2: Table 11-4 Estimated Net Increase in Daily HGV Traffic Due to Proposed MBT Facility Estimated Net Increase in Daily HGV Traffic Due to Proposed MBT Facility Scenario 1: Facility Combined Daily Deliveries and Departures Total Daily Increase 5 (HGV Movements) Drehid MBT Facility Net Change in Landfill 2 Operations (50) (100) Scenario 1 Total Scenario 2: Drehid MBT Facility Net Change in Landfill 4 Operations (60) (120) Scenario 2 Total Notes (1) Combined deliveries and departures for the proposed MBT during Scenario 1. Values taken from tables 11.1 and 11.2 (i.e. 40 deliveries + 20 departures daily) (2) Net change in landfill HGV traffic resulting from interaction between the proposed MBT Facility and the existing landfill during Scenario 1. Values taken from tables 11.1, 11.2 and 11.3 (i.e. 8 deliveries + 2 departures 60 (daily HGV traffic generated by the existing landfill operating at 360,000 tonnes per annum)) (3) Combined deliveries and departures for the proposed MBT in Scenario 2. Values taken from tables 11.1 and 11.2 (i.e. 40 deliveries + 32 departures daily) (4) Net change in landfill HGV traffic resulting from cessation of landfill operations during Scenario 2. Values taken from tables 11.3 only as the existing landfill will have ceased to operate in Scenario 2 (daily HGV traffic will reduce by the HGV traffic generated by the existing landfill operating at 360,000 tonnes per annum) (5) It is assumed that each delivery to and departure from the Landholding will result in a corresponding empty vehicle departing or arriving at the site respectively. This is considered a worst case scenario. The MBT is expected to employ a total of 74 operational staff. The mechanical treatment process at the Drehid MBT Facility will operate 6 days per week (Monday to Saturday inclusive) and for 16 hours per day (on a two shift basis). The SRF drying process and the biological treatment process will operate on a continuous basis (24 hours per day and 7 days per week) and will be fully automated. It is envisaged that there will be two operators required at the MBT Facility, between the hours of and 08.00, to supervise the SRF drying process. Staff numbers will be broken down per shift as follows: 40 staff in the day (includes 8 admin staff) (08.00 to 17.00) 32 staff in the evening (17.00 to 02.00) 2 staff during the night (02.00 to 08.00) Page No. 346
9 A summary of the hourly traffic (HGV and LGV) that will be arriving at and departing from the proposed MBT Facility upon commencement of operations of the MBT Facility is shown in Table 11.5 below for both Scenario 1 and Scenario 2. Due to the interaction of the proposed MBT Facility and the existing landfill during Scenario 1, the traffic associated with the landfill is included for this scenario. Table 11-5 Estimated Increase in Hourly Traffic Generation Operational Phase Estimated Increase in Hourly Traffic Generated by the Proposed MBT Facility Operational Phase Scenario 1: AM Peak: HGVs Facility Vehicles In Vehicles Out Cars/LGVs Vehicles In Vehicles Out Drehid MBT Facility Net Change in Landfill Operations 4,5,7 (5) (5) 0 0 Sub - Total PM Peak: Drehid MBT Facility Net Change in Landfill Operations 4,5,7 (5) (5) 0 0 Sub - Total Scenario 2: AM Peak: Drehid MBT Facility Net Change in Landfill Operations 4,9,10 (7) (7) (20) (3) Sub - Total (1) PM Peak: Drehid MBT Facility Net Change in Landfill Operations 4,9,10 (7) (7) (1) (20) Sub - Total Notes (1) 10 hour working day assumed (2) Numbers of trips have been rounded up to nearest whole number (3) For the operational phase, as a worst case scenario, it is assumed that vehicles delivering waste to the proposed MBT facility will subsequently depart empty and vehicles departing with outputs will have previously arrived empty. This is considered a worst case scenario. As such, numbers taken from Tables 11.1 & 11.2 have been included in both incoming and outgoing figures (4) Light vehicles associated with the existing landfill have been taken from traffic count data. (5) Light vehicles volumes associated with the landfill will not change during Scenario 1 (6) Combined deliveries and departures for the proposed MBT during Scenario 1. Values taken from tables 11.1 and 11.2 (i.e. 4 deliveries + 4 departures hourly) Page No. 347
10 (7) Net change in traffic resulting from interaction between the proposed MBT and the existing landfill during Scenario 1.Values taken from tables 11.1, 11.2 and 11.3 (i.e. 1 deliveries + 1 departures 7 (hourly traffic generated by the existing landfill operating at 360,000 tonnes per annum)) (8) Combined deliveries and departures for the proposed MBT in Scenario 2. Values taken from tables 11.1 and 11.2 (i.e. 4 deliveries + 6 departures hourly) (9) Net change in traffic resulting from cessation of landfill operations during Scenario 2. Values taken from tables 11.3 only as the existing landfill will have ceased to operate in Scenario 2 (i.e. hourly traffic will reduce by the traffic generated by the existing landfill operating at 360,000 tonnes per annum) (10) As the existing landfill will cease to operate in Scenario 2, light vehicles volumes associated with the existing landfill will not be generated during Scenario 2 The primary source of construction HGV traffic for the MBT Facility will be generated in the first year of construction. This will predominantly be related to earthworks as areas of peat will have to be removed and subsequently replaced with suitable fill. The peat will be reused for landscaping within the site so the main HGV traffic impact will be due to the importing of granular fill material. This is estimated to be approximately 184,000 tonnes of material. Assuming that this material is imported over 1 year (i.e. 286 working days based on a 5.5 day working week over 52 weeks) and in 20 tonne truck loads, this will result in approximately 33 trucks arriving at the site per day. Allowing for 10% additional trucks for other building materials that may be imported over this period results in approximately 37 trucks arriving at the site daily. Trucks that arrive will subsequently depart so there will be a total of 74 HGV movements (i.e. 37 vehicles arriving and 37 vehicles departing) generated by the construction of the proposed MBT Facility. In addition to the HGV movements generated, it is estimated that 175 construction site staff will be required. It is assumed these will arrive during the AM peak and depart during the PM peak. A summary of the volumes of traffic that will be generated by the construction phase of the proposed MBT Facility during the AM and PM peak hours is shown in Table 11.6 below. Table 11-6 AM Peak: Estimated Hourly Traffic Generation Construction Phase Estimated Hourly Traffic Generation - MBT Facility Construction Phase HGVs Facility Vehicles In Vehicles Out Cars/LGVs Vehicles In Vehicles Out MBT Construction Sub - Total PM Peak: MBT Construction Sub - Total Notes (1) 10 hour working day assumed (2) Numbers of trips have been rounded up to nearest whole number Page No. 348
11 Seasonal Adjustment In order to undertake an analysis of any road network, it may be necessary to apply a correction factor to convert the surveyed traffic flows (as described in Section 11.2) into seasonally adjusted traffic flows to take account of the seasonal variation that is experienced with traffic surveys. This seasonally adjusted conversion factor was calculated using data taken from a fixed automatic traffic counter located on a regional road, R148, at Clonard, Co. Meath over two 12-month periods in 2009 and It was found that traffic volumes in January are approximately 26% lower than average. This would be accounted for by the holiday period. When compared to the average, flows in February vary, being slightly higher in 2010 and approximately 10% lower in As the counts have been undertaken across the divide of both months the 10% lower than average value is considered to be appropriate. Therefore a seasonal adjustment factor of 1.1 has been applied to the surveyed traffic volumes Traffic Growth In respect of the proposed MBT Facility, this traffic assessment assumes an opening year of 2015 and a design year of 2035 (opening year + 20 years). The background traffic growths used in the analysis in this Chapter are those provided in the NRA document, Project Appraisal Document Unit 5.5 Link-Based Traffic Growth Forecasting (Published January 2011). The growth factors used are the low growth factors for region 3. Low growth rates were chosen to reflect the fact that traffic counts undertaken in 2008 indicate that traffic flows on these roads have not increased significantly in the period between then and 2012 when the more recent counts were undertaken. As traffic count data was obtained in differing years, several growth factors have been used. Factors applied are as follows: Cars: growth factor from 2007 to growth factor from 2007 to growth factor from 2007 to growth factor from 2007 to growth factor from 2007 to growth factor from 2008 to growth factor from 2008 to growth factor from 2008 to growth factor from 2008 to growth factor from 2008 to growth factor from 2010 to growth factor from 2010 to growth factor from 2010 to growth factor from 2010 to growth factor from 2010 to growth factor from 2008 to growth factor from 2012 to growth factor from 2012 to growth factor from 2012 to growth factor from 2012 to 2035 Page No. 349
12 HGVs: growth factor from 2007 to Trip Distribution growth factor from 2007 to growth factor from 2007 to growth factor from 2007 to growth factor from 2007 to growth factor from 2008 to growth factor from 2008 to growth factor from 2008 to growth factor from 2008 to growth factor from 2008 to growth factor from 2010 to growth factor from 2010 to growth factor from 2010 to growth factor from 2010 to growth factor from 2010 to growth factor from 2012 to growth factor from 2012 to growth factor from 2012 to growth factor from 2012 to growth factor from 2012 to 2035 In order to analyse the effect that the proposed MBT Facility will have on the surrounding road network, a number of different distribution scenarios were tested. These were used in order to observe the expected percentage increase in traffic on the R403 and surrounding road network. The haul routes to be followed are presented in Figure No and it is proposed that traffic will be spread over these routes. The exact distribution pattern of traffic generated by the MBT Facility is not known so a series of stress tests have been applied to the haul routes using differing distribution patterns in an attempt to illustrate both the highly unlikely scenario, where all traffic travels to and from the development in the same direction, and the more likely scenarios where generated traffic is split in some proportion. The stress tests considered in this Report are as follows: 1 100% north & 0% south 2 67% north & 33% south 3 50% north & 50% south 4 33% north & 67% south 5 0% north and 100% south The results of the stress tests are presented in Tables These tables show the percentage increases in both total traffic and HGV traffic for operational Scenario 1 (years 2015 and 2028 considered), operational Scenario 2 (2029 and 2035 Page No. 350
13 considered) and the construction phase (2014 considered) for each road forming part of the proposed haul routes. The percentage increases in total traffic along each road forming part of the haul routes are below 10% for all operational scenarios. The NRA Traffic and Transport Assessment Guidelines uses a 10% increase in traffic resulting from a development as a threshold for undertaking a capacity assessment of non-congested roads and a threshold of a 5% increase in traffic from a development in locations with the potential to become congested. The roads forming the haul routes are not considered to be congested and as the net percentage increase in traffic during the operational scenarios is significantly below the 10% threshold (with the maximum net percentage increase recorded as 4.51%), the impact vehicles associated with the MBT Facility will have in terms of traffic flows and potential congestion will be minor. The maximum percentage increases in total traffic along each road forming part of the haul routes are below 12% for the construction phase, the majority of which is made up of LGV traffic. This impact will be greater than that of the operational phase but this is only a temporary impact. It is worth noting that, in actuality, the percentage increase in total vehicles will be less than 12% on the basis that traffic arriving from or departing to the south will be dispersed over the R415, R409 and R407. All the stress tests, involving traffic arriving from or departing to the south, consider the highly unlikely scenario of all traffic travelling along the R415, R409 and R407. Page No. 351
14 Table Percentage Traffic Increase (100% traffic travels to/from the north) Trip Generation Net %Total Increase Net Increase Trip Generation Net %Total Increase Net Increase Trip Generation Location Counted Seasonally Adjusted Light Vehicles Heavy Vehicles Light Vehicles Heavy Vehicles Light Vehicles Heavy Vehicles M M ATC ATC Site Entrance Site Entrance ATC ATC ATC ATC ATC ATC KCC KCC M M Notes: Traffic counts ATC1, ATC3, ATC4, ATC6, ATC7, ATC8, ATC9 and ATC10 were carried out in Jan/Feb 2012 Traffic countsm04-33, M04-34, M07-35 and M07-36 are taken from the NRA National Roads and Traffic Flows, 2010 Traffic count KCC2 (undertaken in 2007) were sourced from Kildare Co. Co. Traffic count KCC4 (undertaken in 2008) were sourced from Kildare Co. Co. Scenario 1 Scenario 2 Construction % Total Increase Increase
15 Table Percentage Traffic Increase (67% traffic travels to/from the north, 33% traffic travels to/from the south) Trip Generation Net %Total Increase Net Increase Trip Generation Net %Total Increase Net Increase Trip Generation Location Counted Seasonally Adjusted Light Vehicles Heavy Vehicles Light Vehicles Heavy Vehicles Light Vehicles Heavy Vehicles M M ATC ATC Site Entrance Site Entrance ATC ATC ATC ATC ATC ATC KCC KCC M M Notes: Traffic counts ATC1, ATC3, ATC4, ATC6, ATC7, ATC8, ATC9 and ATC10 were carried out in Jan/Feb 2012 Traffic countsm04-33, M04-34, M07-35 and M07-36 are taken from the NRA National Roads and Traffic Flows, 2010 Traffic count KCC2 (undertaken in 2007) were sourced from Kildare Co. Co. Traffic count KCC4 (undertaken in 2008) were sourced from Kildare Co. Co. Scenario 1 Scenario 2 Construction %Total Increase Increase
16 Table Percentage Traffic Increase (50% traffic travels to/from the north, 50% traffic travels to/from the south) Trip Generation Net %Total Increase Net Increase Trip Generation Net %Total Increase Net Increase Trip Generation Location Counted Seasonally Adjusted Light Vehicles Heavy Vehicles Light Vehicles Heavy Vehicles Light Vehicles Heavy Vehicles M M ATC ATC Site Entrance Site Entrance ATC ATC ATC ATC ATC ATC KCC KCC M M Notes: Traffic counts ATC1, ATC3, ATC4, ATC6, ATC7, ATC8, ATC9 and ATC10 were carried out in Jan/Feb 2012 Traffic countsm04-33, M04-34, M07-35 and M07-36 are taken from the NRA National Roads and Traffic Flows, 2010 Traffic count KCC2 (undertaken in 2007) were sourced from Kildare Co. Co. Traffic count KCC4 (undertaken in 2008) were sourced from Kildare Co. Co. Scenario 1 Scenario 2 Construction %Total Increase Increase
17 Table Percentage Traffic Increase (33% traffic travels to/from the north, 67% traffic travels to/from the south) Trip Generation Net %Total Increase Net Increase Trip Generation Net %Total Increase Net Increase Trip Generation Location Counted Seasonally Adjusted Light Vehicles Heavy Vehicles Light Vehicles Heavy Vehicles Light Vehicles Heavy Vehicles M M ATC ATC Site Entrance Site Entrance ATC ATC ATC ATC ATC ATC KCC KCC M M Notes: Traffic counts ATC1, ATC3, ATC4, ATC6, ATC7, ATC8, ATC9 and ATC10 were carried out in Jan/Feb 2012 Traffic countsm04-33, M04-34, M07-35 and M07-36 are taken from the NRA National Roads and Traffic Flows, 2010 Traffic count KCC2 (undertaken in 2007) were sourced from Kildare Co. Co. Traffic count KCC4 (undertaken in 2008) were sourced from Kildare Co. Co. Scenario 1 Scenario 2 Construction %Total Increase Increase
18 Table Percentage Traffic Increase (100% traffic travels to/from the south) Trip Generation Net %Total Increase Net Increase Trip Generation Net %Total Increase Net Increase Trip Generation Location Counted Seasonally Adjusted Light Vehicles Heavy Vehicles Light Vehicles Heavy Vehicles Light Vehicles Heavy Vehicles M M ATC ATC Site Entrance Site Entrance ATC ATC ATC ATC ATC ATC KCC KCC M M Notes: Traffic counts ATC1, ATC3, ATC4, ATC6, ATC7, ATC8, ATC9 and ATC10 were carried out in Jan/Feb 2012 Traffic countsm04-33, M04-34, M07-35 and M07-36 are taken from the NRA National Roads and Traffic Flows, 2010 Traffic count KCC2 (undertaken in 2007) were sourced from Kildare Co. Co. Traffic count KCC4 (undertaken in 2008) were sourced from Kildare Co. Co. Scenario 1 Scenario 2 Construction %Total Increase Increase
19 Junction Analysis As described in Section 11.1, the analysis of the existing site entrance has been carried out using PICADY. The key parameters examined in the results of the analysis are the Ratio of Flow to Capacity Value (RFC value desirable value should be no greater than 0.85 for junctions assessed using PICADY, values over 1.00 indicate the approach arm is over capacity), the maximum queue length on any approach to the junction and the average delay for each vehicle passing through the junction during the modelled period. PICADY requires the following input data: Basic modelling parameters (usually peak hour traffic counts synthesised over a 90 minute model period) Geometric parameters (including lane numbers & widths, visibility, storage provision etc) Traffic demand data (usually peak hour origin/destination table with composition of heavy goods vehicles input). Junction analysis of the site entrance has been carried out for the critical AM and PM peak hours (the hours of peak flow experienced at the site entrance junction during the baseline traffic survey at the junction) which were identified as 07:45 to 08:45 in the AM and 16:45 to 17:45 in the PM. The analysis has been undertaken for the opening year and design year for each scenario considered in the operational phase. Junction analysis of the site entrance has also been carried out for the AM and PM peaks for 2014 with the addition of the MBT Facility construction phase traffic. The analysis results for the existing site access junction on the R403 for the AM and PM peak hours during the operational phase Traffic Scenario 1 are summarised below in Table The origin/destination traffic demand tables for all the different distribution scenarios tested for the analysed junction are provided in Appendix Full outputs are provided in Appendix Page No. 357
20 Table Analysis Results: Existing Site Entrance AM & PM Peak Hours operational Phase Traffic Scenario 1 ANALYSIS RESULTS: Existing Site Entrance AM & PM Peak Hours Operational Phase Traffic Scenario 1 Year & Time Arm A R403 North (unrestricted) RFC Value Max Queue Length (vehicles) Arm B Existing Access Junction RFC Value Max Queue Length (vehicles) Arm C - R403 South RFC Value Max Queue Length (vehicles) Delay AM PM AM PM AM PM AM PM AM PM Page No. 358
21 ANALYSIS RESULTS: Existing Site Entrance AM & PM Peak Hours Operational Phase Traffic Scenario 1 Year & Time Arm A R403 North (unrestricted) RFC Value Max Queue Length (vehicles) Arm B Existing Access Junction RFC Value Max Queue Length (vehicles) Arm C - R403 South RFC Value Max Queue Length (vehicles) Delay AM PM AM PM AM PM AM PM AM PM Page No. 359
22 The above results indicate that the existing site access junction will operate below the desired 0.85 RFC for all years of operation with the inclusion of development-generated traffic expected for Scenario 1. The maximum queue expected at the site access junction is less than 1 vehicle. There is a ghost island with right turning lane junction at the existing site access junction which will be able to accommodate any vehicles queuing on the R403 when arriving from the South. The analysis results for the existing site access junction on the R403 for the AM and PM peak hours during the operational phase Traffic Scenario 2 are summarised below in Table The origin/destination traffic demand tables for all the different scenarios tested for the analysed junction are provided in Appendix Full outputs are provided in Appendix Page No. 360
23 Table Analysis Results: Existing Site Entrance AM & PM Peak Hours operational Phase Traffic Scenario 2 ANALYSIS RESULTS: Existing Site Entrance AM & PM Peak Hours Operational Phase Traffic Scenario 2 Year & Time Arm A R403 North (unrestricted) RFC Value Max Queue Length (vehicles) Arm B Existing Access Junction RFC Value Max Queue Length (vehicles) Arm C - R403 South RFC Value Max Queue Length (vehicles) Delay AM PM AM PM AM PM AM PM AM PM Page No. 361
24 ANALYSIS RESULTS: Existing Site Entrance AM & PM Peak Hours Operational Phase Traffic Scenario 2 Year & Time Arm A R403 North (unrestricted) RFC Value Max Queue Length (vehicles) Arm B Existing Access Junction RFC Value Max Queue Length (vehicles) Arm C - R403 South RFC Value Max Queue Length (vehicles) Delay AM PM AM PM AM PM AM PM AM PM Page No. 362
25 The above results indicate that the existing site access junction will operate below the desired 0.85 RFC for all years of operation with the inclusion of development-generated traffic expected for Scenario 2. The maximum queue expected at the site access junction is less than 1 vehicle. There is a ghost island with right turning lane junction at the existing site access junction which will be able to accommodate any vehicles queuing on the R403 when arriving from the South. The analysis results for the existing site access junction on the R403 for the AM and PM peak hours during the construction phase of the proposed MBT Facility are summarised below in Table The origin/destination traffic demand tables for all the different scenarios tested for the analysed junctions are provided in Appendix Full outputs are provided in Appendix Page No. 363
26 Table Analysis Results: Existing Access Junction AM & PM Peak Hours Existing Traffic and MBT Construction Phase ANALYSIS RESULTS: Existing Access AM & PM Peak Hours Existing Traffic and MBT Construction Traffic Year & Time Arm A R403 North (unrestricted) RFC Value Max Queue Length (vehicles) Arm B Existing Access Junction RFC Value Max Queue Length (vehicles) Arm C - R403 South RFC Value Max Queue Length (vehicles) Delay AM PM AM PM AM PM AM PM AM PM Page No. 364
27 The above results indicate that the existing site access junction will operate below the desired 0.85 RFC during the construction phase. The maximum queue expected at the site access junction is less than 1 vehicle. There is a ghost island with right turning lane junction at the existing site access junction which will be able to accommodate any vehicles queuing on the R403 when arriving from the South Link Capacity A link capacity assessment was undertaken with reference to the UK DMRB TA 46/97. Using this document, the two way hourly capacities of the regional roads identified as haul routes were calculated. In order to undertake an investigation into link capacity of the haul routes, it was necessary first to convert the raw traffic survey data, which consisted of cars and heavy vehicles, into a common index known as passenger car units (PCU s). This was undertaken by applying a factor to all surveyed traffic movements to take account of the composition of the different types of vehicle. This factoring calculation assumes 1 car / light vehicle = 1 PCU, 1 heavy vehicle = 2.3 PCU s and 1 bus = 2 PCU s. The link capacities were calculated for Due to the growth of background traffic, and the higher volumes of traffic generated by operational Scenario 2, 2035 represents the year that will experience maximum traffic flows. These tables also assume that 100% of trips relating to the operations of the proposed MBT Facility travel along each road considered. This is a worst case scenario as, in actuality, these trips would distribute across the network. The link capacities are outlined below in Table Table Link Capacity of Regional Road Network 2035 Regional Road Number Available Capacity (pcu/hr) Link Capacity 2035 Max Peak Hour Flow (pcu/hr) Spare Capacity R % R % R % R % R % As can be seen from the table above, the regional roads in the vicinity of the proposed development will operate within capacity in 2035, the year considered that will experience the maximum traffic flows Road Safety The speed limit on the R403 at the site entrance junction is 80 km/h. The entrance is a ghost island junction constructed to the standards set out in NRA DMRB TD41/95 which was the Page No. 365
28 current standard when it was being constructed. NRA DMRB TD41/95 has now been superseded by NRA DMRB TD41-42 which sets out a requirement for visibility splays of 3.0 x 160 metres. This is a less onerous standard than the previous standard and as such the existing junction remains fully compliant. A ghost island junction has been provided at the existing site entrance with a right turning lane. The through lanes on either side are 3.0m wide and the right turning lane is 3.0m wide. The length of the ghost island junction for the Drehid Waste Management Facility provides adequate deceleration length and turning length for a design speed of 85 kph in accordance with DMRB TD 42/95. Queuing length of 5m is also provided. As indicated in tables to 11.12, the maximum queue length at this junction is predicted to be below 1 vehicle meaning queuing will not be an issue. There will be some adverse impact on the pavements of the regional roads to the extent that any weak sections of the existing pavement will be subject to increased loading and may require strengthening. This will arise from the net increase in HGVs, as pavement deterioration is linked to axle loading. In some of the more extreme stress tests considered in Section , some sections of the haul routes during the operational scenarios would experience a net percentage increase in HGV traffic of approximately 16% compared to predicted background HGV traffic volumes. In actuality it is more likely that one of the more balanced distributions will prevail and would result in a maximum net percentage increase in HGVs during the operational scenarios of approximately 10.5% compared to predicted background HGV traffic volumes. It is again worth noting that, in actuality, the percentage increase in HGVs will be less than 10.5% on the basis that traffic arriving from or departing to the south will be dispersed over the R415, R409 and R407. All the stress tests, involving traffic arriving from or departing to the south, consider the highly unlikely scenario of all traffic travelling along the R415, R409 and R407. Compared with predicted background HGV traffic flows on the haul routes, the net increase resulting from the MBT Facility may have a minimal impact on the pavement condition of the haul routes. During a site visit, it was found that, for the most part the pavements of the haul routes appear to be in good condition. Some localised pavement deterioration was noted however, but the scale of this is such that it can be dealt with by the Roads Authority under normal road maintenance programs. A 7.5m access road has been provided with junction radii of 20m off the R403 to the development. A recessed gate has been provided at a setback of 80m from the existing entrance. The access road narrows to 6m wide on the approach to the facility. This is adequate width to allow two HGVs to pass one another with a clearance of 1.0m. Warning signs and advance direction signs indicating the presence of the entrance to the Bord na Móna landholding and road markings are provided in the vicinity of the site entrance junction. As part of the construction of the initial stage of the permitted Drehid Waste Management Facility, a road safety audit has been carried out in accordance with the relevant sections of the National Roads Authority standard (HD 19/04 and HA42/04) on the constructed site Page No. 366 EPA Export :23:47:03
29 entrance. The road safety audit was subsequently submitted to Kildare County Council who approved the existing site entrance Pedestrians and Cyclists Due to the location and nature of the development, pedestrians and cyclists are not expected to be frequent users of the facility and as such no provision has been made to accommodate either Car Parking Car parking at the MBT is provided for 101 cars, 2 delivery vans and 2 coaches adjacent to the Administration and Welfare Building. Specific guidelines for car parking at facilities such as the proposed MBT Facility are not set out in the Kildare County Council Development Plan, but considering the number of employees, the volume of parking provided is sufficient to provide adequate parking for both staff and visitors. In addition to car parking spaces, there are 18 spaces provided for HGV parking. This is considered sufficient to cater for the number of large vehicles that will be accessing the facility at any given time Public Transport There is no regular public transport service in operation in the immediate vicinity of the Facility; however there are public bus services that run from Allenwood to Dublin, Edenderry and Birr. Allenwood is located approximately 3.5 km from the MBT Facility. It is not expected that the number of users of this bus service will be increased by the development MITIGATION MEASURES As the potential traffic impacts for both Configuration A (MBT with Composting) and Configuration B (MBT with Dry Anaerobic Digestion and Composting) are almost equivalent, the mitigation measures for Configuration A and Configuration B will be the same. The following are measures that will be implemented to mitigate the impact associated with the development: Photographic survey of haul roads prior to commencement of construction; Continuous monitoring of haul roads throughout both the construction and operational phase; All contractors, delivering waste to the facility and removing outputs from the facility, and all construction contractors will be issued with a map of the permitted haul routes such that all materials imported into the site and exported out of the site are transported via one of the identified haul routes. A penalty system will be operated by to ensure haulage operators comply with these requirements; Wheel wash facilities at the MBT Facility during both the construction and operational phase; Maintenance of warning signage on the approach to the entrance; Page No. 367 EPA Export :23:47:03
30 Monitoring of car parking requirements during the operational phase with additional spaces to be provided if required; Maintenance of site entrance ensuring visibility splays remain intact; and, Monitoring of haul routes for problems such as congestion and refining the routes where required CONCLUSION The conclusions of this assessment are as follows: The volumes of traffic that will be generated by the proposed Drehid MBT Facility will have no significant impact on traffic flows on the haul routes with reference to the terms outlined in the NRA Traffic and Transport Assessment Guidelines ; Stress tests carried out at junctions on the R403 and adjoining road network indicate that the proposed MBT Facility will generate a maximum additional 4.5% traffic on the proposed Haul Routes during the operational scenarios, even in the most unlikely event that all the traffic comes from either the south or north; The impact of development traffic on the haulage road network both in terms of link and junction capacity will be slight with reference to the terms outlined in the NRA Traffic and Transport Assessment Guidelines ; All contractors, delivering waste to the facility and removing outputs from the facility, and all construction contractors will be issued with a map of the permitted haul routes such that all materials imported into the site and exported out of the site are transported via one of the identified haul routes. A penalty system will be operated by to ensure haulage operators comply with these requirements; The maximum percentage increases in total traffic along each road forming part of the haul routes are below 12% for the construction phase, the majority of which is made up of LGV traffic. While this impact will be greater than that of the operational phase it is only a temporary impact; For the purpose of robustness, the traffic analysis for both the operational and construction phases assumes that all of the generated traffic is confined to each of the haul routes running from the M7 to the facility. In reality, the dispersion of the facility generated traffic between the route options (from M7 to the facility) will also proportionally reduce the traffic loading on any one route; Page No. 368 EPA Export :23:47:03
31 It is considered that the existing road network is capable of accommodating the net increase in generated traffic associated with the proposed MBT Facility; The R402 Road Improvement Scheme will further improve the haul route for vehicles accessing the proposed MBT Facility from the north; The existing site entrance will operate below the desired 0.85 RFC up to and including the design year of 2035, with the inclusion of MBT Facility generated traffic; The regional road network comprising the haul routes will operate below capacity up to and including the design year of 2035; There will be a negligible net increase in HGV traffic as a result of the proposed MBT Facility which may have minimal impact on the pavement condition along the haul routes; Adequate visibility splays of 3.0 x 160m have been provided at the existing site entrance junction in accordance with NRA DMRB TD 41-42/11; and, A ghost island junction with a right turning lane has been provided at the existing site entrance which is capable of accommodating the increased traffic associated with the proposed MBT Facility. Page No. 369 EPA Export :23:47:03


32 EPA Export :23:47:03 to f c Fo op r i yr ns ig pe ht ct ow ion ne pu r r rp eq os ui es re o d nl fo y. ra ny ns en Co se ru he ot.
Appendix B. Traffic Analysis Report
 Appendix B Traffic Analysis Report Report No. 14369/TR/WN02 August 2007 SALLINS BYPASS BYPASS OPTIONEERING ANALYSIS - TRAFFIC REPORT Kildare County Council Áras Chill Dara, Devoy Park, Naas, Co Kildare
5.1 Introduction. 5.2 Data Collection
 Chapter 5 Traffic Analysis 5.1 Introduction This chapter of the EIS assesses the traffic impacts of the proposed N5 Westport to Turlough Road Project (the proposed scheme). The proposed scheme will provide
NATHAN HALE HIGH SCHOOL PARKING AND TRAFFIC ANALYSIS. Table of Contents
 Parking and Traffic Analysis Seattle, WA Prepared for: URS Corporation 1501 4th Avenue, Suite 1400 Seattle, WA 98101-1616 Prepared by: Mirai Transportation Planning & Engineering 11410 NE 122nd Way, Suite
Project Appraisal Guidelines
 Project Appraisal Guidelines Unit 16.2 Expansion Factors for Short Period Traffic Counts August 2012 Project Appraisal Guidelines Unit 16.2 Expansion Factors for Short Period Traffic Counts Version Date
COUNCIL POLICY MANUAL
 COUNCIL POLICY MANUAL SECTION: PUBLIC WORKS SUBJECT: SNOW & ICE CONTROL POLICY 2012/2013 GOAL: Pages: 1 of 10 Approval Date: Dec. 3, 2012 Res. # 1001/2012 To annually identify the winter maintenance costs
South Bristol Link Forecasting Report
 South Bristol Link April 2013 Atkins 5098941 AVTM Forecasting v2 PI (Draft 120331) Draft 31 March 2012 1 Notice This document and its contents have been prepared and are intended solely for West of England
Appendix C Traffic Study
 Final Environmental Impact Statement Appendix C Traffic Study Schofield Generating Station Project, Hawaii October 2015 C-1 Final Environmental Impact Statement This page intentionally left blank. Schofield
Introduction / Background
 TECHNICAL NOTE 4 Proposed Redevelopment of the Former Leyland Test Track Site, Leyland Planning Application Reference 07/2017/3361/ORM CT/15043/TN04 Rev B 11 October 2018 Introduction / Background 1. A
INTRODUCTION PURPOSE DATA COLLECTION
 DETERMINATION OF VEHICLE OCCUPANCY ON THE KATY AND NORTHWEST FREEWAY MAIN LANES AND FRONTAGE ROADS Mark Ojah and Mark Burris Houston Value Pricing Project, March 2004 INTRODUCTION In the late 1990s, an
PW 001 SNOW REMOVAL AND SANDING FOR ROADWAYS AND SIDEWALKS October 6, 2014 (#223-14) Original October 19, 2015; October 15, 2018 Public Works
 Original October 19, 2015; October 15, 2018 Public Works") Policy Statement: The Village of Kitscoty will provide snow and ice control on municipal streets and sidewalks according to determined priorities. Purpose: To provide direction and information to employees
Policy Statement: The Village of Kitscoty will provide snow and ice control on municipal streets and sidewalks according to determined priorities. Purpose: To provide direction and information to employees
Proposed restaurant with drive-through facility and residential development on land at Peniel Green Road, Birchgrove, Swansea TRANSPORT ASSESSMENT
 SRT Development Ltd Proposed restaurant with drive-through facility and residential development on land at Peniel Green Road, Birchgrove, Swansea TRANSPORT ASSESSMENT October 2017 Applicant: SRT Development
FARM 1065 PORTION 1, ATLANTIS TRAFFIC IMPACT ASSESSMENT
 FARM 1065 PORTION 1, ATLANTIS TRAFFIC IMPACT ASSESSMENT February 2018 FIRST ISSUE Prepared by: JG AFRIKA (PTY) LTD Branch: Cape Town PO Box 38561 Postal code: 7430 Telephone: 021 530 1800 Email: wink@
Cherry Avenue Park, Kildare Town. Traffic & Transportation Assessment
 Cherry Avenue Park, Kildare Town Traffic & Transportation Assessment June 2017 Cherry Avenue Park Traffic & Transportation Assessment Document Control Document Number 171179-TTA-PL0 Revision Date Prepared
Palmerston North Area Traffic Model
 Palmerston North Area Traffic Model Presentation to IPWEA 7 November 2014 PNATM Presentation Overview Model Scope and type Data collected The model Forecasting inputs Applications PNCC Aims and Objectives
TRAFFIC IMPACT STUDY. Platte Canyon Villas Arapahoe County, Colorado (Arapahoe County Case Number: Z16-001) For
 For") TRAFFIC IMPACT STUDY For Platte Canyon Villas Arapahoe County, Colorado (Arapahoe County Case Number: Z16-001) February 2015 Revised: August 2015 April 2016 July 2016 September 2016 Prepared for: KB Home
TRAFFIC IMPACT STUDY For Platte Canyon Villas Arapahoe County, Colorado (Arapahoe County Case Number: Z16-001) February 2015 Revised: August 2015 April 2016 July 2016 September 2016 Prepared for: KB Home
Appendixx C Travel Demand Model Development and Forecasting Lubbock Outer Route Study June 2014
 Appendix C Travel Demand Model Development and Forecasting Lubbock Outer Route Study June 2014 CONTENTS List of Figures-... 3 List of Tables... 4 Introduction... 1 Application of the Lubbock Travel Demand
MEMORANDUM. The study area of the analysis was discussed with City staff and includes the following intersections:
 MEMORANDUM DATE: JULY 6, 2012 TO: FROM: RE: CC: MELANIE KNIGHT BRAD BYVELDS/ JENNIFER LUONG 1050 SOMERSET STREET PRELIMINARY TRAFFIC ANALYSIS OUR FILE NO. 111152 NEIL MALHOTRA The purpose of this memo
3.0 ANALYSIS OF FUTURE TRANSPORTATION NEEDS
 3.0 ANALYSIS OF FUTURE TRANSPORTATION NEEDS In order to better determine future roadway expansion and connectivity needs, future population growth and land development patterns were analyzed as part of
WEBER ROAD RESIDENTIAL DEVELOPMENT Single Family Residential Project
 WEBER ROAD RESIDENTIAL DEVELOPMENT Single Family Residential Project WEBER ROAD RESIDENTIAL DEVELOPMENT TRAFFIC IMPACT STUDY TABLE OF CONTENTS 1.0 Executive Summary Page 2.0 Introduction 2.1 DEVELOPMENT
CHAPTER 3. CAPACITY OF SIGNALIZED INTERSECTIONS
 CHAPTER 3. CAPACITY OF SIGNALIZED INTERSECTIONS 1. Overview In this chapter we explore the models on which the HCM capacity analysis method for signalized intersections are based. While the method has
APPENDIX IV MODELLING
 APPENDIX IV MODELLING Kingston Transportation Master Plan Final Report, July 2004 Appendix IV: Modelling i TABLE OF CONTENTS Page 1.0 INTRODUCTION... 1 2.0 OBJECTIVE... 1 3.0 URBAN TRANSPORTATION MODELLING
CVS Derwood. Local Area Transportation Review
 CVS Derwood Montgomery County, Maryland May 27, 2016 Local Area Transportation Review Prepared for: JC Bar Properties, Inc. Steve Fleming, PE 415 Fallowfield Road, Suite 301 Camp Hill, Pennsylvania 17011
SNOW CONTROL OPERATIONS
 SNOW CONTROL OPERATIONS PUBLIC WORKS TEAM STREET MAINTENANCE DIVISION SNOW CONTROL OPERATIONS Standard Operating Procedures for Snow Removal Operations. 1. Plowing operations will be initiated when snow
HALFF 16196? TRAFFIC MANAGEMENT PLAN. Richardson ISD Aikin Elementary School Dallas, Texas North Bowser Road Richardson, Texas 75081
 30280 16196? TRAFFIC MANAGEMENT PLAN Exhibit 572B Aikin Elementary School Planned Development District No. 572 Approved City Plan Commission October20, 2016 July 12, 2016 Prepared for HALFF AVO 31586 PHO1
I. M. Schoeman North West University, South Africa. Abstract
 Urban Transport XX 607 Land use and transportation integration within the greater area of the North West University (Potchefstroom Campus), South Africa: problems, prospects and solutions I. M. Schoeman
QUANTIFICATION OF THE NATURAL VARIATION IN TRAFFIC FLOW ON SELECTED NATIONAL ROADS IN SOUTH AFRICA
 QUANTIFICATION OF THE NATURAL VARIATION IN TRAFFIC FLOW ON SELECTED NATIONAL ROADS IN SOUTH AFRICA F DE JONGH and M BRUWER* AECOM, Waterside Place, Tygerwaterfront, Carl Cronje Drive, Cape Town, South
JEP John E. Jack Pflum, P.E. Consulting Engineering 7541 Hosbrook Road, Cincinnati, OH Telephone:
 JEP John E. Jack Pflum, P.E. Consulting Engineering 7541 Hosbrook Road, Cincinnati, OH 45243 Email: jackpflum1@gmail.com Telephone: 513.919.7814 MEMORANDUM REPORT Traffic Impact Analysis Proposed Soccer
Richborough Estates Ltd. Land South of Monmouth Road, Raglan. Transport Assessment
 Richborough Estates Ltd Land South of Monmouth Road, Raglan Transport Assessment PTB Transport Planning Ltd Radclyffe House 66/68 Hagley Road Edgbaston Birmingham West Midlands B16 8PF T/F. 0121 454 5530
Traffic Impact Study
 Traffic Impact Study Statham DRI One University Parkway Prepared for: Barrow County Prepared by: October 2012 Table of Contents Executive Summary i Section 1. Introduction 1 Project Description 1 Methodology
WROTHAM PARISH COUNCIL, BOROUGH GREEN PARISH COUNCIL, PLATT PARISH COUNCIL & IGHTHAM PARISH COUNCIL
 WROTHAM PARISH COUNCIL, BOROUGH GREEN PARISH COUNCIL, PLATT PARISH COUNCIL & IGHTHAM PARISH COUNCIL OBJECTION TO PROPOSED REDEVELOPMENT OF EXISTING AND FORMER QUARRY SITES TO PROVIDE A LARGE SCALE RESIDENTIAL
Parking Regulations Dundas Street West, from Bathurst Street to Dovercourt Road
 STAFF REPORT ACTION REQUIRED Parking Regulations Dundas Street West, from Bathurst Street to Dovercourt Road Date: October 28, 2008 To: From: Toronto and East York Community Council Director, Transportation
CITY OF MINOT SNOW REMOVAL PLAN October 2018
 CITY OF MINOT SNOW REMOVAL PLAN October 2018 1.0 GENERAL This plan has been written to provide information regarding snow removal procedures and policies. The plan provides guidance, while maintaining
Subject: Desert Palisades Specific Plan - Tram Way Access Sight Distance
 Endo Engineering Traffic Engineering Air Quality Studies Noise Assessments July 13, 2015 Mr. Ed Freeman Pinnacle View, LLC P.O. Box 1754 Lake Oswego, OR 97035-0579 Subject: Desert Palisades Specific Plan
Forecasts from the Strategy Planning Model
 Forecasts from the Strategy Planning Model Appendix A A12.1 As reported in Chapter 4, we used the Greater Manchester Strategy Planning Model (SPM) to test our long-term transport strategy. A12.2 The origins
Speed Limit Review. Montague Road, West End. Prepared for Brisbane City Council CEB06842 CEB06842
 Speed Limit Review Montague Road, West End CEB06842 CEB06842 Prepared for Brisbane City Council 2 November 2016 Speed Limit Review Montague Road, West End Document Information Prepared for Brisbane City
Appendix I: Traffic Study
 City of Fontana Sierra Lakes Commerce Center Draft EIR Appendix I: Traffic Study FirstCarbon Solutions H:\Client (PN JN)\0144\01440050\EIR\1 ADEIR\01440050 Sec99 99 Appendix Dividers.doc THIS PAGE INTENTIONALLY
Appendix BAL Baltimore, Maryland 2003 Annual Report on Freeway Mobility and Reliability
 (http://mobility.tamu.edu/mmp) Office of Operations, Federal Highway Administration Appendix BAL Baltimore, Maryland 2003 Annual Report on Freeway Mobility and Reliability This report is a supplement to:
CITY OF BEAVER DAM SNOW & ICE REMOVAL POLICY
 CITY OF BEAVER DAM SNOW & ICE REMOVAL POLICY Revised January, 2016 Approved by Operations Committee: February 1, 2016 This snow and ice removal policy guides Public Works personnel with deicing, plowing,
930 Old Northern Rd & 4 Post Office Rd, Glenorie
 Proposed Mixed Use Development 930 Old Northern & 4, Glenorie TRAFFIC AND PARKING ASSESSMENT REPORT 13 December 2016 Ref 16264 Suite 6, 20 Young Street, Neutral Bay NSW 2089 - PO Box 1868, Neutral Bay
MEMORANDUM. Trip Generation Analysis
 MEMORANDUM To: RMC Architects From: Matthew Palmer, PE Subject: Trip Generation, Parking Analysis & Level of Service Project: Port of Everett, GTC #13-053 Date: August 25, 2014 The trip generation and
Bristol Clean Air Plan
 Document Ti tle Bristol Clean Air Plan January 2019 Project Name Project No: 673846.ER.20 Document Title: : 673846.ER.20.OBC-25 Revision: Revision B Date: January 2019 Client Name: Bristol City Council
City of Camrose Winter Road Maintenance Policy
 City of Camrose Winter Road Maintenance Policy The purpose of this policy is to outline the level of service that the City of Camrose delivers regarding the maintenance of roads in winter conditions. 1.
April 10, Mr. Curt Van De Walle, City Manager City of Castle Hills 209 Lemonwood Drive Castle Hills, Texas 78213
 Mr. Curt Van De Walle, City Manager City of Castle Hills 209 Lemonwood Drive Castle Hills, Texas 78213 Subject: Revised Castle Hills BASIS Charter School Traffic Impact Analysis Review City of Castle Hills,
Predicting highly-resolved traffic noise
 Predicting highly-resolved traffic noise (using data available as a by-product of Urban Traffic Management and Control systems) Dr Shadman Marouf, Professor Margaret C. Bell, CBE Future Mobility Group,
VHD Daily Totals. Population 14.5% change. VMT Daily Totals Suffolk 24-hour VMT. 49.3% change. 14.4% change VMT
 6.9 Suffolk 6-54 VMT Population and Travel Characteristics Population 14.5% change 2014 1,529,202 VHD Daily Totals 2014 251,060 49.3% change 2040 1,788,175 2040 374,850 VMT Daily Totals 2014 39,731,990
CITY OF MINOT SNOW REMOVAL PLAN November 2017
 CITY OF MINOT SNOW REMOVAL PLAN November 2017 1.0 GENERAL This plan has been written to provide information regarding snow removal procedures and policies. The plan provides guidance, while maintaining
Emergency Traffic Management In the Case of Severe Winter Conditioins
 Emergency Traffic Management In the Case of Severe Winter Conditioins Presentation on the Project Workshop Organizing Emergency Management Strategies for the Transport Sector with the Use of innovative
CIV3703 Transport Engineering. Module 2 Transport Modelling
 CIV3703 Transport Engineering Module Transport Modelling Objectives Upon successful completion of this module you should be able to: carry out trip generation calculations using linear regression and category
III. FORECASTED GROWTH
 III. FORECASTED GROWTH In order to properly identify potential improvement projects that will be required for the transportation system in Milliken, it is important to first understand the nature and volume
Existing road transport network of the National Capital Region was examined for the existing connectivity, mobility and accessibility in the study.
 2 Road Network 2.1 Existing Road Network The existing transport network in National Capital Region is radial in nature. It comprises of expressways, national highways, state highways, major district and
PLAZA MEXICO RESIDENCES
 PLAZA MEXICO RESIDENCES TRAFFIC STUDY PREPARED FOR: 3000 E. IMPERIAL, LLC. 6940 Beach Boulevard, D-501 Buena Park, California 90621 PREPARED BY: OCTOBER 5, 2017 translutions the transportatio n solutions
South Western Region Travel Time Monitoring Program Congestion Management Process Spring 2008 Report
 South Western Region Travel Monitoring Program Congestion Management Process Spring 2008 Report Prepared by: South Western Regional Planning Agency 888 Washington Boulevard Stamford, CT 06901 Telephone:
Snow and Ice Control POLICY NO. P-01/2015. CITY OF AIRDRIE Snow and Ice Control Policy
 Page 1 CITY OF AIRDRIE Snow and Ice Control Effective Date: Approved By: Approved On: March 17, 2015 City Council March 16, 2015 Revision Date: Resolution #: ------ PURPOSE: The City of Airdrie is responsible
Acquisition of Multi-Function Equipment at DIA: Conditions, Factors, Considerations & Integration. Presented by Mike Carlson September 20, 2012
 Acquisition of Multi-Function Equipment at DIA: Conditions, Factors, Considerations & Integration Presented by Mike Carlson September 20, 2012 1 Denver International Airport 5 Runways 12,000 /. (3,658m)
Paine Field Airport Existing and Future Environmental Assessment, Initiation of Commercial Service Noise Analysis
 Paine Field Airport Existing and Future Environmental Assessment, Initiation of Commercial Service Noise Analysis July 2012 Prepared by: BridgeNet International 3151 Airway Avenue Building I-2 Costa Mesa,
Kildare County Council
 Comhairle Contae Chill Dara Kildare County Council Kildare County Council WINTER SERVICE PLAN FOR ROADS 2018 / 2019 Page 1 of 21 1 Purpose and Scope...3 2 Policy...4 3 Map of the Service Plan Area...6
Appendix C Final Methods and Assumptions for Forecasting Traffic Volumes
 Fairview Ave. and Main St. Improvements and Local Streets Plan Appendices Ada County Highway District Appendix C Final Methods and Assumptions for Forecasting Traffic Volumes January 3, 207 Appendices
Parking Study MAIN ST
 Parking Study This parking study was initiated to help understand parking supply and parking demand within Oneida City Center. The parking study was performed and analyzed by the Madison County Planning
Data Collection. Lecture Notes in Transportation Systems Engineering. Prof. Tom V. Mathew. 1 Overview 1
 Data Collection Lecture Notes in Transportation Systems Engineering Prof. Tom V. Mathew Contents 1 Overview 1 2 Survey design 2 2.1 Information needed................................. 2 2.2 Study area.....................................
Typical information required from the data collection can be grouped into four categories, enumerated as below.
 Chapter 6 Data Collection 6.1 Overview The four-stage modeling, an important tool for forecasting future demand and performance of a transportation system, was developed for evaluating large-scale infrastructure
Appendix B. Durham Region Travel Demand Model Calibration
 Appendix B Durham Region Travel Demand Model Calibration AECOM 300 Water Street 905 668 9363 tel Whitby, ON, Canada L1N 9J2 905 668 0221 fax www.aecom.com To Ron Albright, Municipality of Clarington Page
Long-Term Evaluation of the Operational Performance of Fixed Time Ramp Metering Control Strategy: A Freeway Corridor Study
 Canadian Journal of Civil Engineering Long-Term Evaluation of the Operational Performance of Fixed Time Ramp Metering Control Strategy: A Freeway Corridor Study Journal: Canadian Journal of Civil Engineering
SNOW REMOVAL - REQUEST FOR PROPOSAL. Snow Removal/Clearing and Sanding/Salting for Winter Fundy Ocean Research Center for Energy
 Fundy Ocean Research Center for Energy SNOW REMOVAL - REQUEST FOR PROPOSAL Snow Removal/Clearing and Sanding/Salting for Winter 2016-17 Sites 1. FORCE Sub-Station Driveway (portion of Old Black Rock Road),
Heathrow Community Noise and Track-keeping Report: Chertsey
 Heathrow Community Noise and Track-keeping Report: Chertsey This document reports on an 98-day period of continuous noise monitoring from 9 June 211 to 14 September 211 using a Larson Davies LD 87 sound
Trip and Parking Generation Study of Orem Fitness Center-Abstract
 Trip and Parking Generation Study of Orem Fitness Center-Abstract The Brigham Young University Institute of Transportation Engineers student chapter (BYU ITE) completed a trip and parking generation study
MnDOT Method for Calculating Measures of Effectiveness (MOE) From CORSIM Model Output
 From CORSIM Model Output") MnDOT Method for Calculating Measures of Effectiveness (MOE) From CORSIM Model Output Rev. April 29, 2005 MnDOT Method for Calculating Measures of Effectiveness (MOE) From CORSIM Model Output Table of
MnDOT Method for Calculating Measures of Effectiveness (MOE) From CORSIM Model Output Rev. April 29, 2005 MnDOT Method for Calculating Measures of Effectiveness (MOE) From CORSIM Model Output Table of
Moor Hall Primary School Transport Statement Acivico Ltd. 3 February 2017
 Moor Hall Primary School Transport Statement Acivico Ltd 3 February 2017 Moor Hall Primary School Transport Statement Notice This document and its contents have been prepared and are intended solely for
Empirical Relation between Stochastic Capacities and Capacities Obtained from the Speed-Flow Diagram
 Empirical Relation between Stochastic Capacities and Capacities Obtained from the Speed-Flow Diagram Dr.-Ing. Justin Geistefeldt Institute for Transportation and Traffic Engineering Ruhr-University Bochum
KAISER SOUTH NORTHERN VIRGINIA HUB TRAFFIC IMPACT STUDY PRINCE WILLIAM COUNTY, VIRGINIA TABLE OF CONTENTS. Section 2 BACKGROUND INFORMATION 12
 KAISER SOUTH NORTHERN VIRGINIA HUB TRAFFIC IMPACT STUDY PRINCE WILLIAM COUNTY, VIRGINIA TABLE OF CONTENTS Page EXECUTIVE SUMMARY 1 Purpose of Report and Study Objectives... 1 Site Location and Study Area...
6 th Line Municipal Class Environmental Assessment
 6 th Line Municipal Class Environmental Assessment County Road 27 to St John s Road Town of Innisfil, ON September 6, 2016 APPENDIX L: TRAVEL DEMAND FORECASTING MEMORANDUM Accessible formats are available
YONGE STREET AT WELLINGTON STREET LEFT TURN PROHIBITION PRE-PLANNING MEETING
 YONGE STREET AT WELLINGTON STREET LEFT TURN PROHIBITION PRE-PLANNING MEETING Wednesday 1 p.m. 2 p.m. Boardroom 10030, 90 Bales Drive Meeting Called By: Attendees: Regrets: Paul Ham Paul Ham, Richard Hui,
Town of Bowden Province of Alberta Policy Document ( ) SNOW REMOVAL POLICY
 SNOW REMOVAL POLICY") Town of Bowden Box 338, 2101 20 th Ave Bowden, Alberta, T0M 0K0 Town of Bowden Province of Alberta Policy Document (2019-01) SNOW REMOVAL POLICY 1 INTRODUCTION The purpose of this policy is to establish
Town of Bowden Box 338, 2101 20 th Ave Bowden, Alberta, T0M 0K0 Town of Bowden Province of Alberta Policy Document (2019-01) SNOW REMOVAL POLICY 1 INTRODUCTION The purpose of this policy is to establish
Accessibility analysis of multimodal transport systems using advanced GIS techniques
 Urban Transport XIII: Urban Transport and the Environment in the 21st Century 655 Accessibility analysis of multimodal transport systems using advanced GIS techniques T. Vorraa Citilabs Regional Director,
A Cellular Automaton Model for Heterogeneous and Incosistent Driver Behavior in Urban Traffic
 Commun. Theor. Phys. 58 (202) 744 748 Vol. 58, No. 5, November 5, 202 A Cellular Automaton Model for Heterogeneous and Incosistent Driver Behavior in Urban Traffic LIU Ming-Zhe ( ), ZHAO Shi-Bo ( ô ),,
Dublin Chamber submission on Dublin City Development Plan : Outdoor Advertising Strategy
 Dublin Chamber submission on Dublin City Development Plan 2011 2017: Outdoor Advertising Strategy January 2012 Key Points: Sustainable and appropriate advertising can play an important positive role in
Traffic Flow Theory & Simulation
 Traffic Flow Theory & Simulation S.P. Hoogendoorn Lecture 4 Shockwave theory Shockwave theory I: Introduction Applications of the Fundamental Diagram February 14, 2010 1 Vermelding onderdeel organisatie
Traffic Demand Forecast
 Chapter 5 Traffic Demand Forecast One of the important objectives of traffic demand forecast in a transportation master plan study is to examine the concepts and policies in proposed plans by numerically
Border Crossing Freight Delay Data Collection and Analysis World Trade Bridge Laredo International Bridge 4 Laredo, Texas
 Border Crossing Freight Delay Data Collection and Analysis World Trade Bridge Laredo International Bridge 4 Laredo, Texas The border crossing freight delay data collection and analysis project was conducted
Metro SafeTrack Impact on Individual Travel Behavior & Regional Traffic Conditions. 1. Introduction. 2. Focus of this Volume & Issue
 Metro SafeTrack Impact on Individual Travel Behavior & Regional Traffic Conditions Volume 1 Issue 1 June 10, 16 1. Introduction The National Transportation Center (NTC@Maryland) at the University of Maryland
The Sunland Park flyover ramp is set to close the week of March 19 until early summer
 March 2, 2018 The Sunland Park flyover ramp is set to close the week of March 19 until early summer GO 10 is targeting the week of March 19 to close the Sunland Park Drive flyover entrance ramp to I 10
Traffic Flow Management (TFM) Weather Rerouting Decision Support. Stephen Zobell, Celesta Ball, and Joseph Sherry MITRE/CAASD, McLean, Virginia
 Weather Rerouting Decision Support. Stephen Zobell, Celesta Ball, and Joseph Sherry MITRE/CAASD, McLean, Virginia") Traffic Flow Management (TFM) Weather Rerouting Decision Support Stephen Zobell, Celesta Ball, and Joseph Sherry MITRE/CAASD, McLean, Virginia Stephen Zobell, Celesta Ball, and Joseph Sherry are Technical
Traffic Flow Management (TFM) Weather Rerouting Decision Support Stephen Zobell, Celesta Ball, and Joseph Sherry MITRE/CAASD, McLean, Virginia Stephen Zobell, Celesta Ball, and Joseph Sherry are Technical
Organized Chain-Up and VSL
 Organized Chain-Up and VSL Jim Mahugh, PE WSDOT SC Region Traffic Engineer North/West Passage VSL Peer Exchange January 28, 2015 Snoqualmie Pass 2 Limits of VSL EB: MP 48.12 to 66.56 WB: MP 46.69 to 66.90
Administrative Procedures Handbook
 PROJECT LEVEL TRAFFIC FORECASTING Administrative Procedures Handbook PREPARED BY: Transportation Planning Branch North Carolina Department of Transportation Purpose of Handbook There are two specific purposes
Market Street PDP. Nassau County, Florida. Transportation Impact Analysis. VHB/Vanasse Hangen Brustlin, Inc. Nassau County Growth Management
 Transportation Impact Analysis Market Street PDP Nassau County, Florida Submitted to Nassau County Growth Management Prepared for TerraPointe Services, Inc. Prepared by VHB/Vanasse Hangen Brustlin, Inc.
PhysicsAndMathsTutor.com
 PhysicsAndMathsTutor.com June 2005 3. The random variable X is the number of misprints per page in the first draft of a novel. (a) State two conditions under which a Poisson distribution is a suitable
Kilkenny County Council. Winter Service Plan
 Kilkenny County Council Winter Service Plan 05-06 October 05 Telephone: 056 779 4000 Fax: 056 779 4004 Email : info@kilkennycoco.ie Web: www.kilkennycoco.ie Kilkenny County Council Winter Service Plan
WRTM and Active Transportation and Demand Management
 The Future of Transportation - 2010 APWA Annual Congress and Exposition WRTM and Active Transportation and Demand Management Weather Responsive Traffic Management Workshop October 7, 2011 Jim Hunt F d
WOKING LOCAL PLAN. Woking Town Centre Modelling Assessment
 S WOKING LOCAL PLAN Project Title: Woking Local Plan Document Title: Client Reference: Date: 02 May 2017 Prepared By: Abigail Hardie Authorised By: William Bryans Amendment List Iss. / Rev. Iss. / Rev
Transit Time Shed Analyzing Accessibility to Employment and Services
 Transit Time Shed Analyzing Accessibility to Employment and Services presented by Ammar Naji, Liz Thompson and Abdulnaser Arafat Shimberg Center for Housing Studies at the University of Florida www.shimberg.ufl.edu
3301 East 120 th Avenue Assited Living & Memory Care
 UTILITY REPORT FOR 3301 East 120 th Avenue Assited Living & Memory Care 1 st Submittal January 23, 2016 2 nd Submittal March 04, 2016 Prepared for: 3301 E. 120 th Ave, LLC. 8200 E. Maplewood Ave., Suite
DAILY QUESTIONS 28 TH JUNE 18 REASONING - CALENDAR
 DAILY QUESTIONS 28 TH JUNE 18 REASONING - CALENDAR LEAP AND NON-LEAP YEAR *A non-leap year has 365 days whereas a leap year has 366 days. (as February has 29 days). *Every year which is divisible by 4
TRAVEL DEMAND MODEL. Chapter 6
 Chapter 6 TRAVEL DEMAND MODEL As a component of the Teller County Transportation Plan development, a computerized travel demand model was developed. The model was utilized for development of the Transportation
CONGESTION REPORT 1 st Quarter 2016
 CONGESTION REPORT 1 st Quarter 2016 A quarterly update of the National Capital Region s traffic congestion, travel time reliability, top-10 bottlenecks and featured spotlight April 20, 2016 ABOUT TPB Transportation
Appendix O. Sediment Transport Modelling Technical Memorandum
 Appendix O Sediment Transport Modelling Technical Memorandum w w w. b a i r d. c o m Baird o c e a n s engineering l a k e s design r i v e r s science w a t e r s h e d s construction Final Report Don
Trip Generation Calculations
 Trip Generation Calculations A HORIZON AIR ALLEGIANT AI R EMPLOYEES Daily Trip Generation Daily Trip Generation Daily Trip Generation Directional Flights (per day): 20 Directional Flights (per day): 2.8
1 Client The request to draft this report was made by DELTA Light & Optics, Venlighedsvej 4, DK-2970 Hørsholm, Denmark.
 Berlin, 6 th of december 2011 Test Certificate No. 0913-2011-02 on the suitability of the LTL-M dynamic retroreflectometer for the dynamic measurement of the coefficient of retroreflected luminance R L
TRANSPORTATION AND TRAFFIC ANALYSIS REPORT
 Square One Drive Extension Municipal Class Environmental Assessment Environmental Study Report Appendix B Transportation and Traffic Analysis Report TRANSPORTATION AND TRAFFIC ANALYSIS REPORT FINAL DRAFT
1 Summary Monetary Component Public Purpose Land Provision Introduction Document Structure...
 1 Summary... 1 1.1 Monetary Component... 1 1.2 Public Purpose Land Provision... 1 2 Introduction... 5 2.1 Document Structure... 5 2.2 Planning & Environment Act 1987... 5 2.3 Strategic Planning & Justification...
FHWA Peer Exchange Meeting on Transportation Systems Management during Inclement Weather
 Travel Demand Modeling & Simulation at GBNRTC Matt Grabau Kimberly Smith Mike Davis Why Model? Travel modeling is a tool for transportation planners and policy makers, to observe impacts of a transportation
FINAL Traffic Report for the Proposed Golden Valley Road and Newhall Ranch Road Projects in the City of Santa Clarita, California May 5, 2005
 FINAL Traffic Report for the Proposed Golden Valley Road and Newhall Ranch Road Projects in the City of Santa Clarita, California May 5, 2005 Prepared For: EDAW, Inc. 1420 Kettner Boulevard, Suite 620