The use of GIS tools for analyzing eye- movement data
|
|
|
- Stephany Darlene Austin
- 5 years ago
- Views:
Transcription


1 The use of GIS tools for analyzing eye- movement data Tomasz Opach Jan Ke>l Rød
2 some facts In recent years an eye- tracking approach has become a common technique for collec>ng data in empirical user studies in cartography Its popularity within this discipline has grown out of two basic convic>ons that it provides informa>on about user s visual behavior and it does so in an unobtrusive manner As a mager of fact these are advantages which dis>nguish eye- tracking from other empirical techniques known from usability studies
3 challenges and needs Eye- tracking produces an enormous amount of data which is challenging for the analysis and which to some extent impedes the use of this technique In order to analyze eye- movement data we might use dedicated sojware packages, however, they some>mes do not offer the func>onality that one needs Then, common GIS applica>ons might be helpful for the analysis of the output from eye- trackers which usually can be exported as fixa>on points data
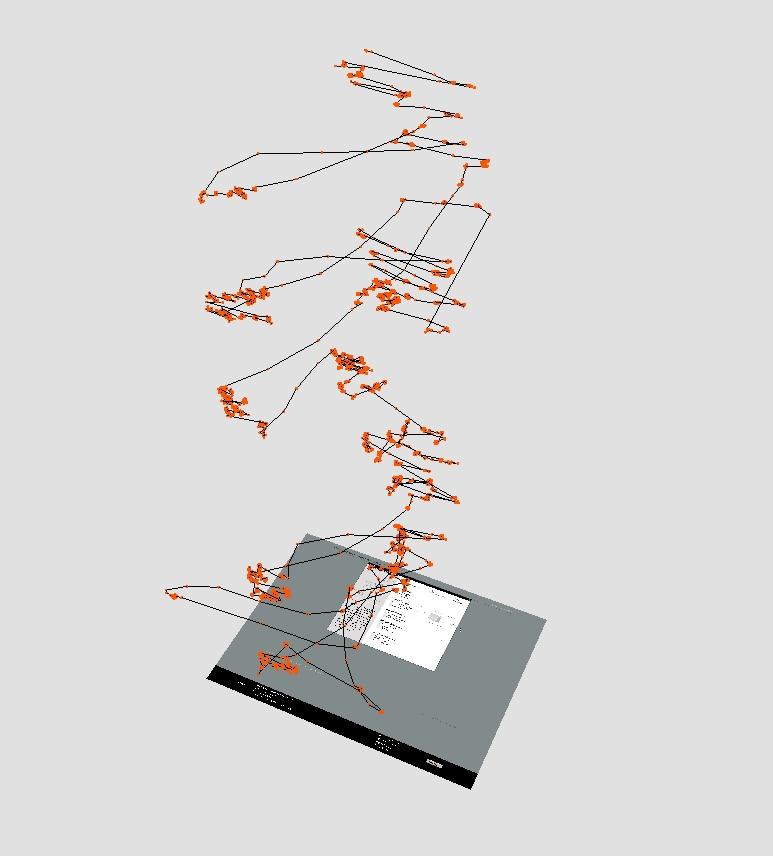
4 what do GIS tools offer? GIS tools may provide users with new insights which are difficult to derive while using default eye- tracking sojware Fixa>on points* can be exported to any GIS applica>on *points to which a human has directed his/her visual a4en5on and gathered as an output from eye- tracker Since we may consider the screen as defining a Cartesian coordinate system, these fixa>on points are spa>al data and of course we could use a tool- rich GIS to visualize and analyze eye- movement data

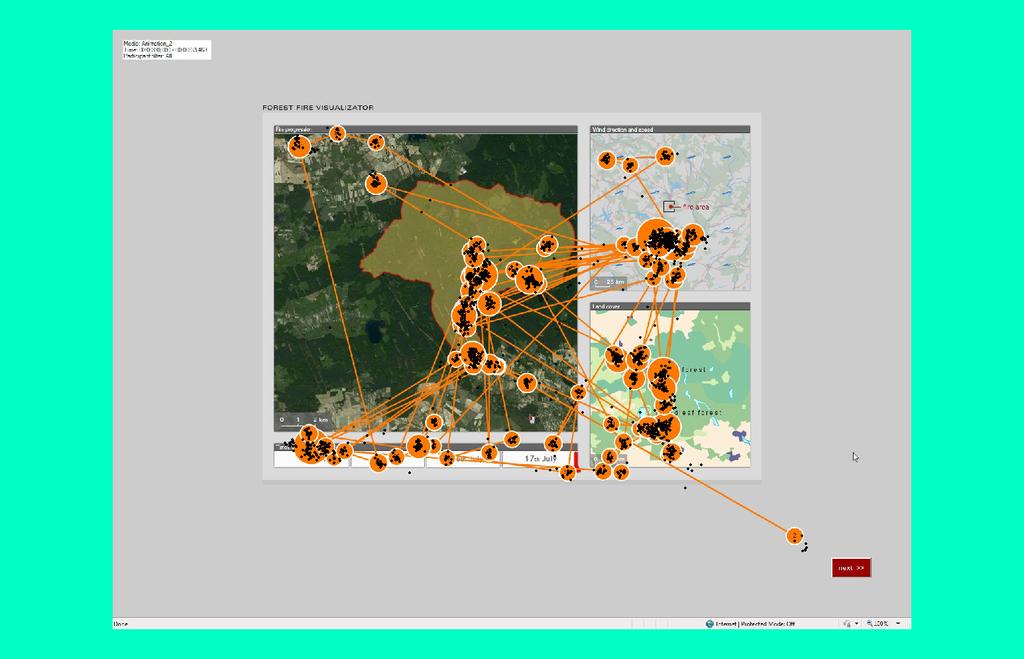
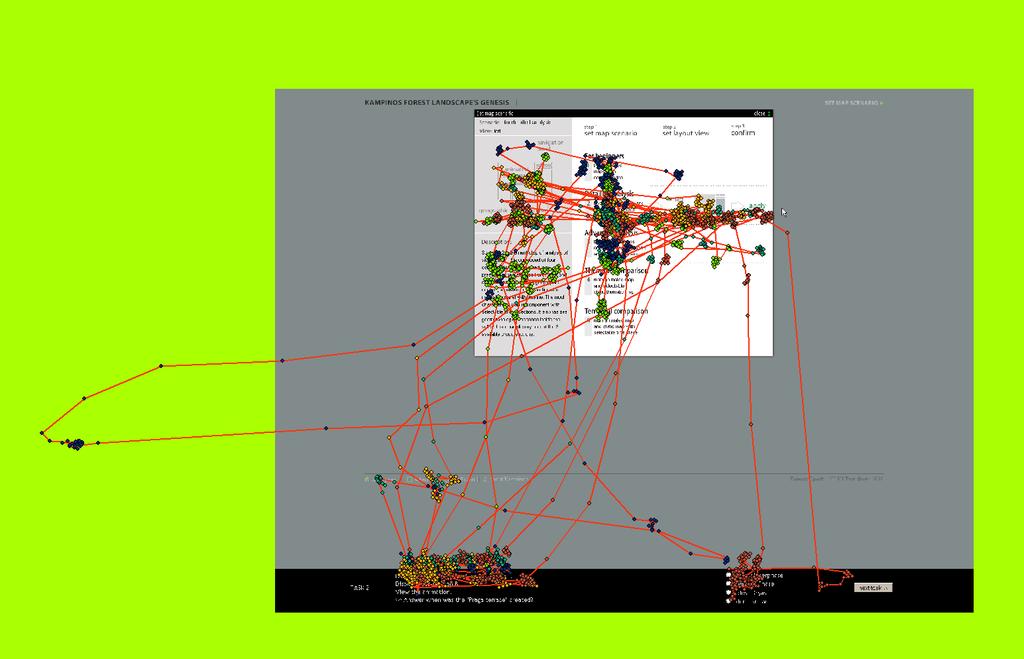
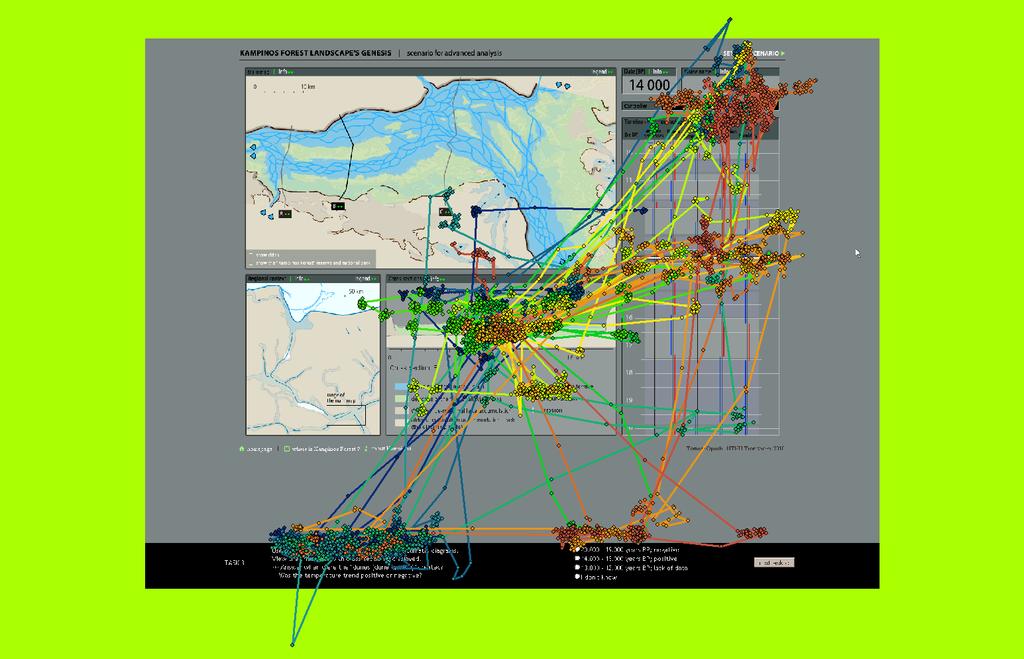
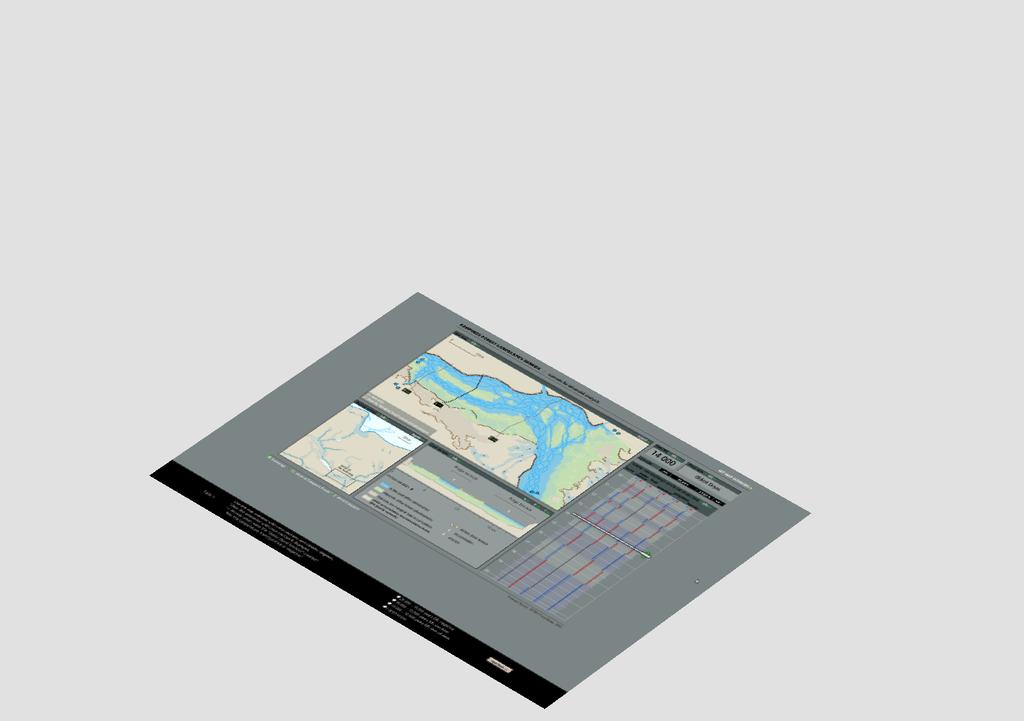
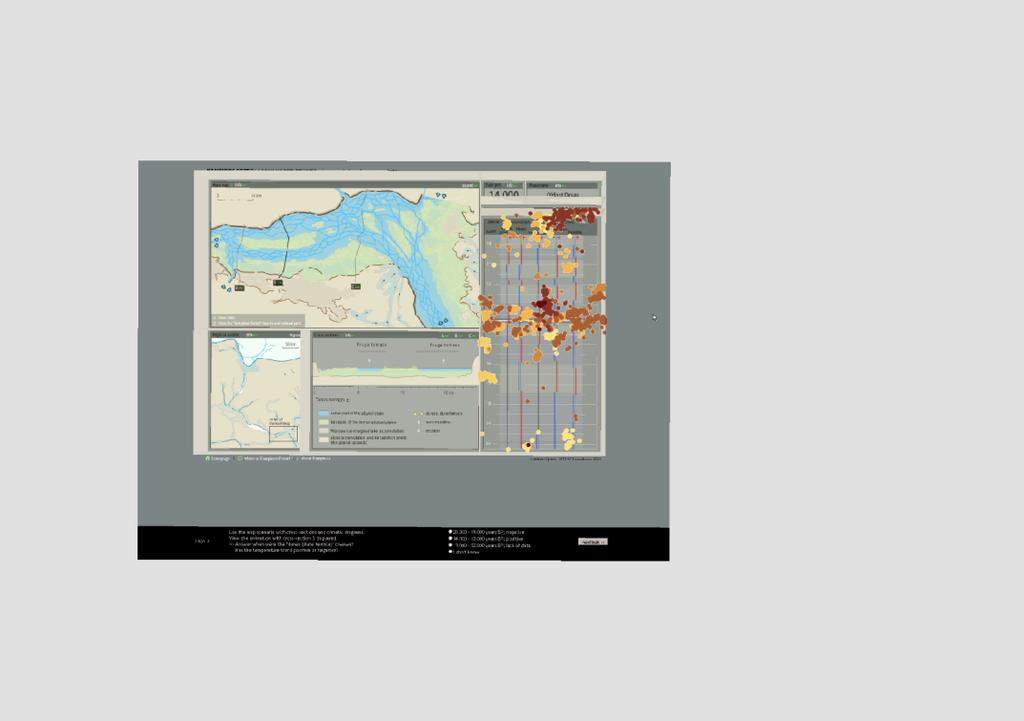
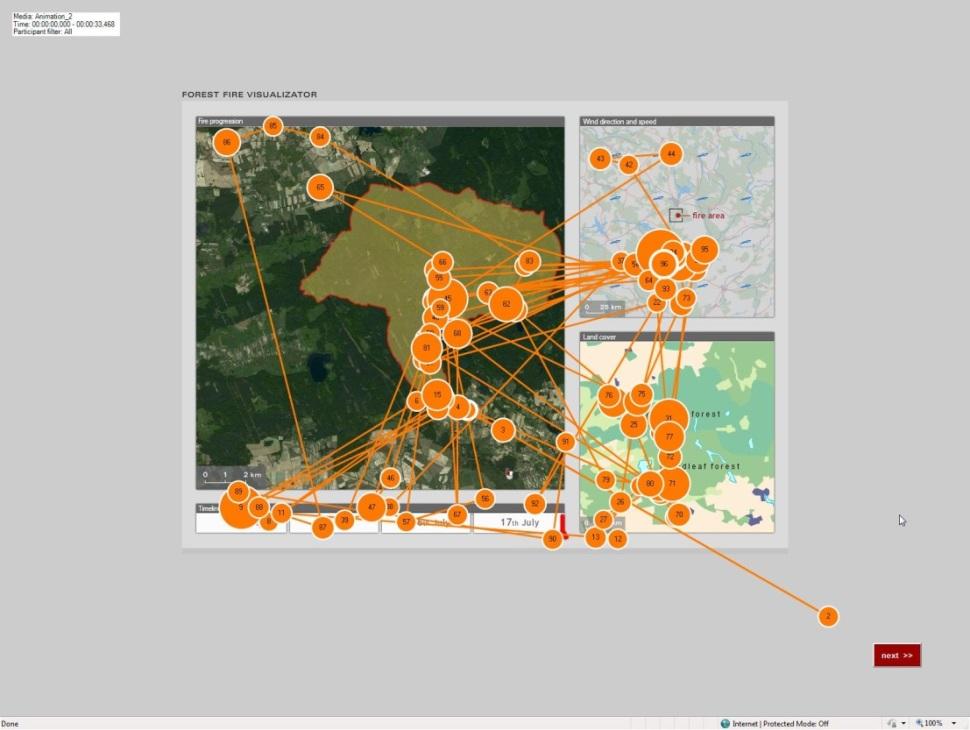
5 where were they used? Project 1 Evalua>on of the mul>- component and mul>- scenario animated map of the Kampinos Forest s landscape genesis Project 2 How do people view mul>- component animated maps?
6 fixa>on filter threshold GIS applica>ons may facilitate op>miza>on of the fixa>on filter threshold Fixa>on points set ajer filtering (aggrega>ng) can be easily compared with the raw data so users are able to evaluate whether raw fixa>on points have been aggregated in accordance with their observa>ons or expecta>ons
7
8
9
10
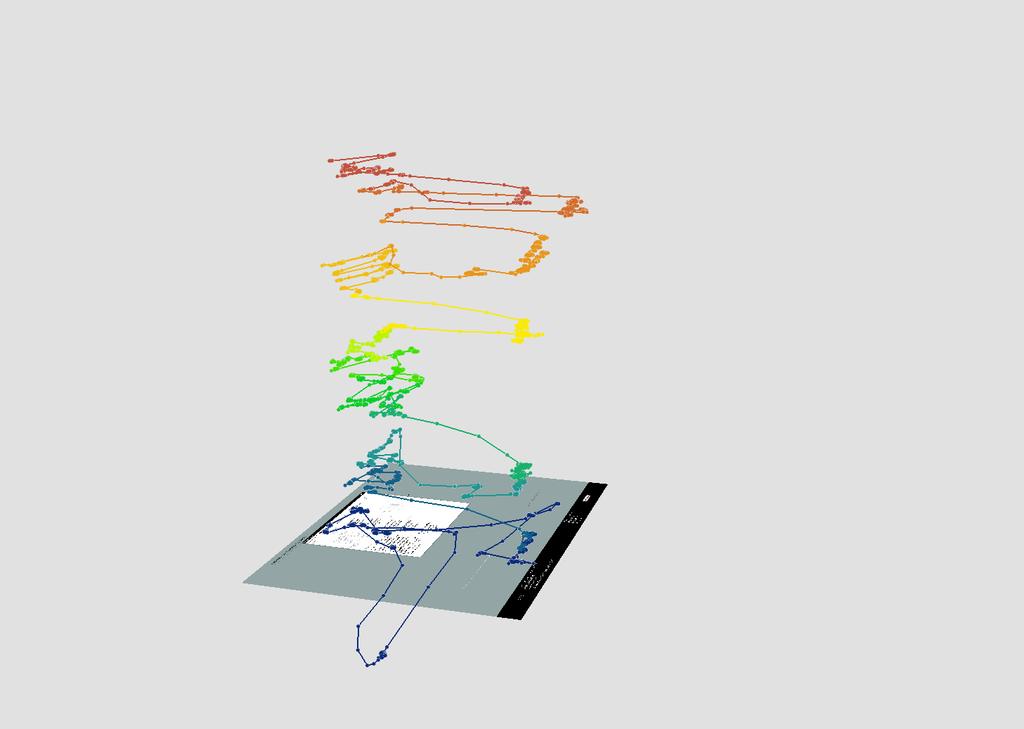
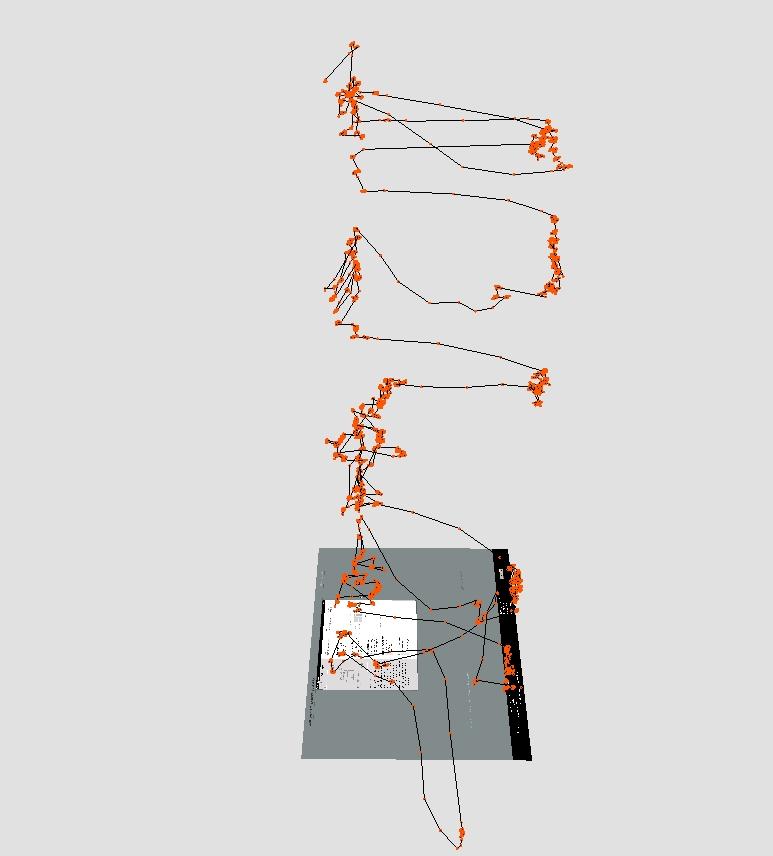
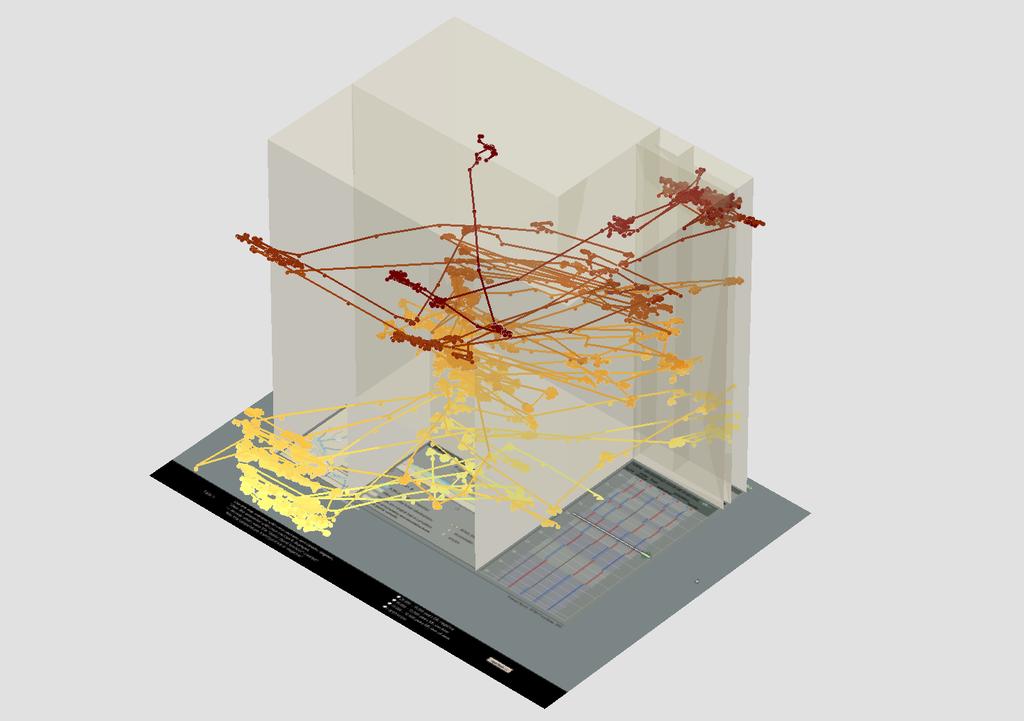
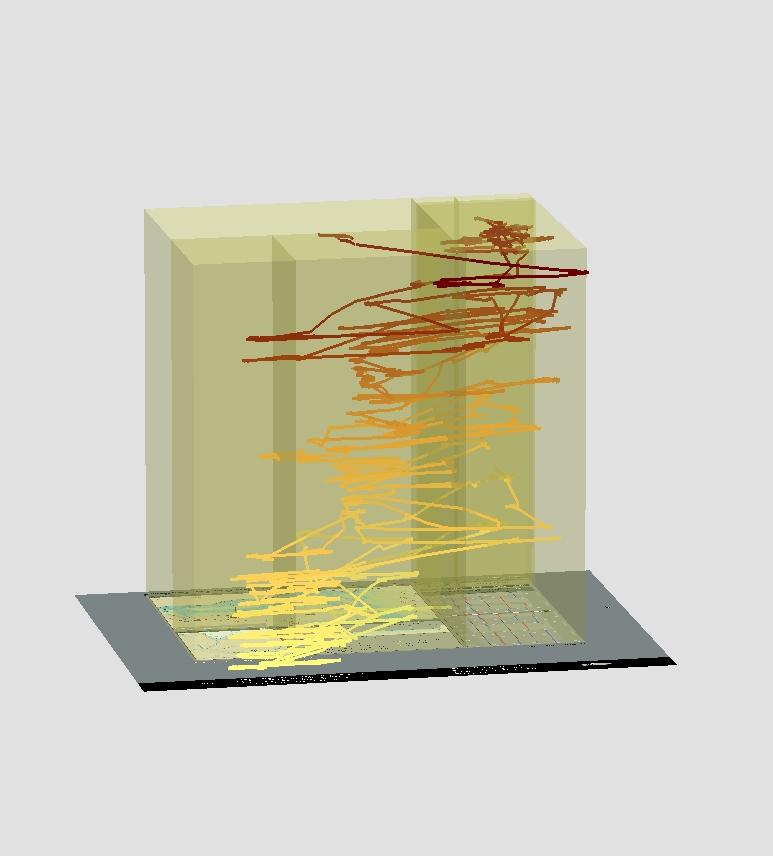
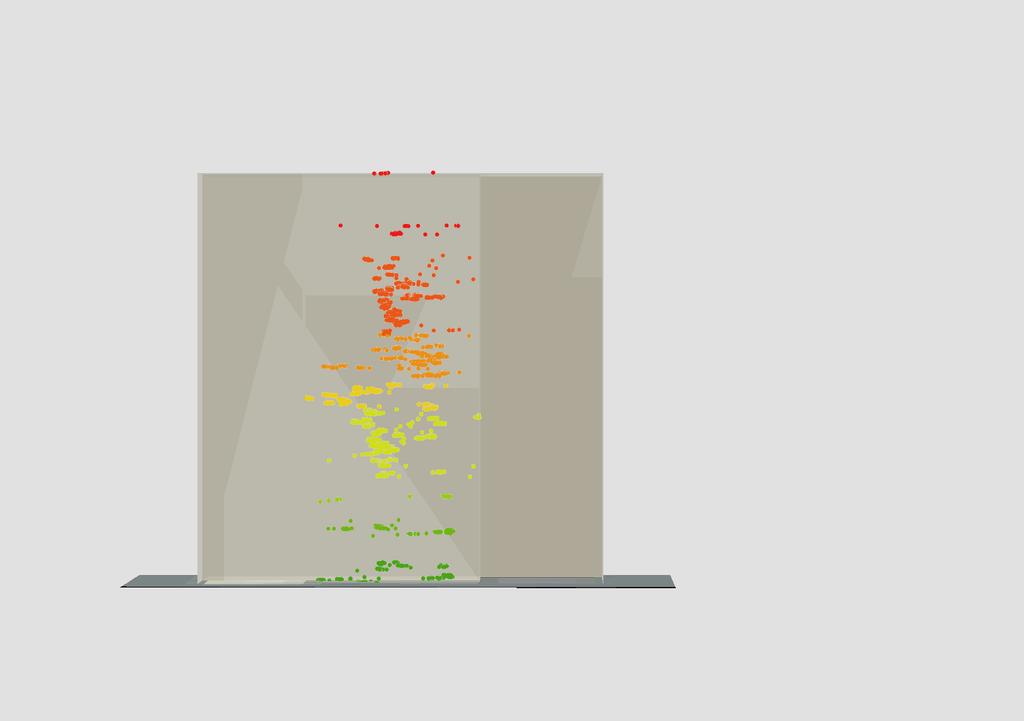
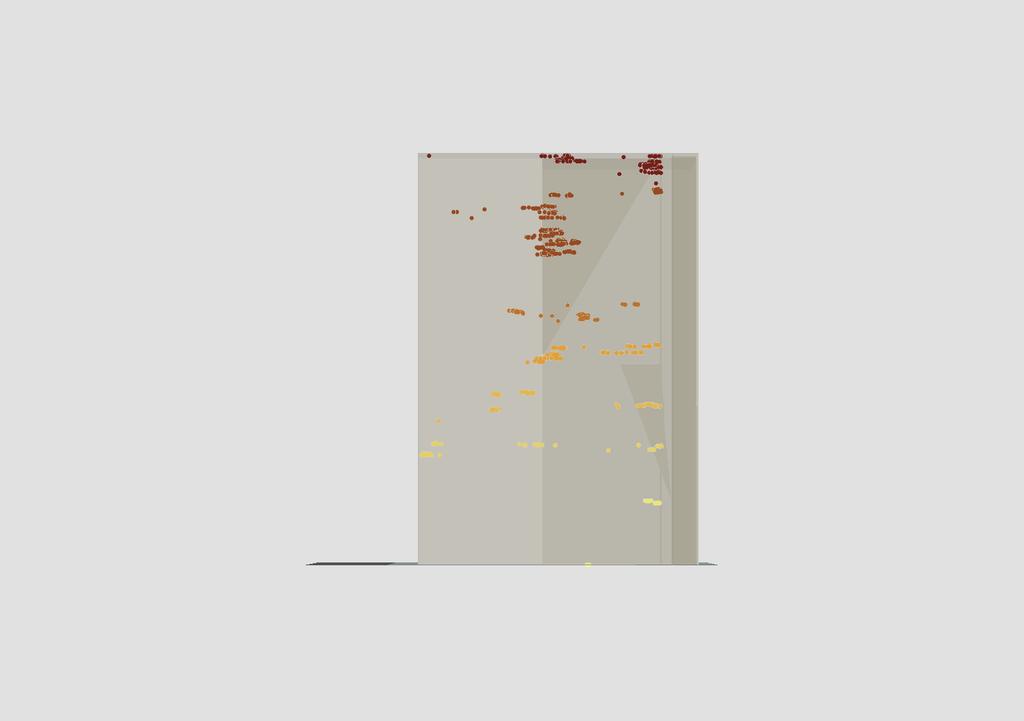
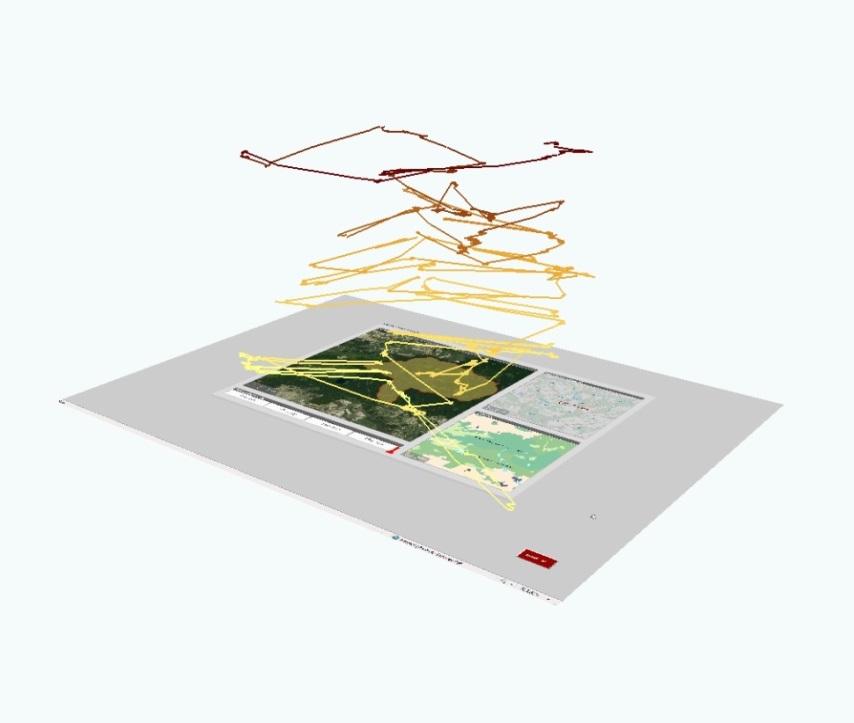
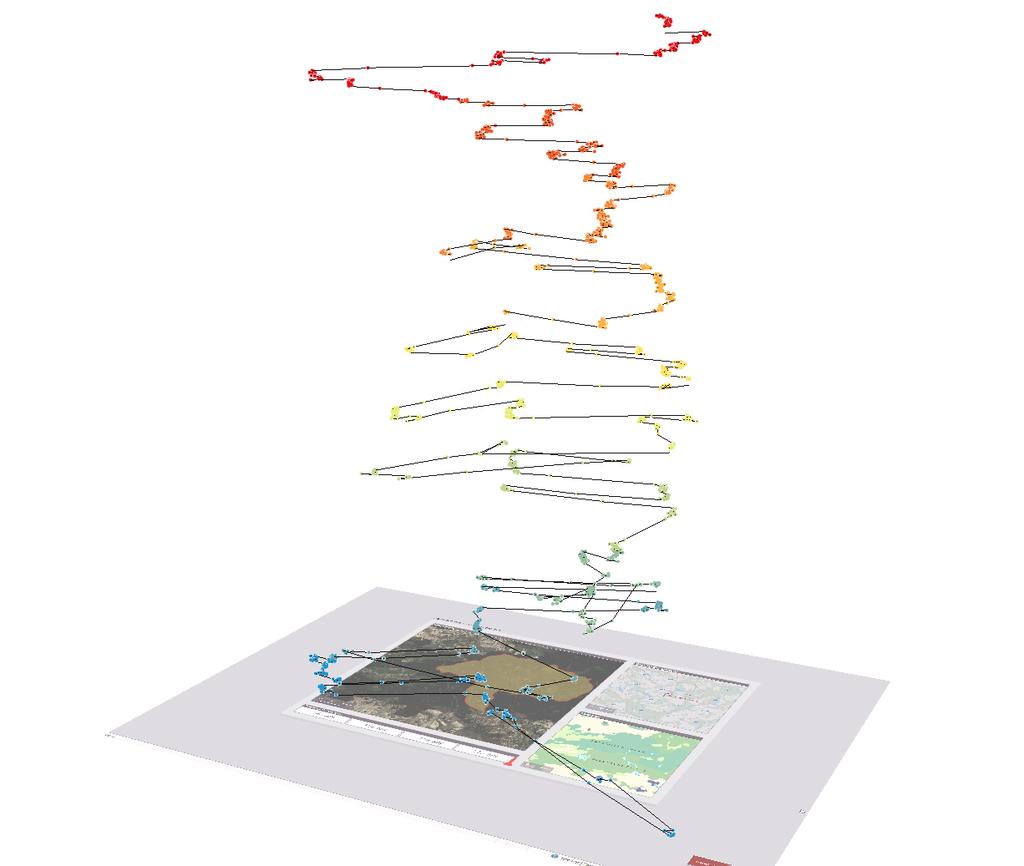
11 changes over >me Users may want to view fixa>ons and saccades in a form of the space- >me- cube for easier analysis of eye movement data Tradi>onal approaches conceal space- >me varia>on due to aggrega>on. Space- >me- cube visualiza>on facilitates the user to discover pagerns Even if the 3D visualiza>on of eye- movement data is not enough for revealing pagerns across par>cipants it can help to drive the research into the appropriate direc>on and to formulate further hypotheses
12 space- >me cube in GIS When using GIS applica>ons users may easily customize space- >me cube seangs, for instance, both fixa>on points and saccades can be symbolized depending on their temporal agributes Furthermore blocks built on the basis of the area- of- interest zones can be addi>onally visualized in the scene to support visual analysis
13
14

15
16
17
18
19
20
21
22
23
24
25
26
27

28
29
30

31 First viewing Second viewing
32
33 conclusion The examples are quite straighborward. Nevertheless, they demonstrate the poten>al for GIS applied to eye- movement data analysis For cartographers already acquainted with GIS tools it is quite easy to use such applica>ons to handle eye movements data There are of course much more possibili>es of use, but their applicability depends on the goals which are addressed
34
Maintaining and using spa1al data from a qualita1ve perspec1ve
 Maintaining and using spa1al data from a qualita1ve perspec1ve Anders Larsson Department for Human and Economic Geography, School of Business, Economics and Law, Göteborg University Lecture aim Discuss
Specifying of Requirements for Spatio-Temporal Data in Map by Eye-Tracking and Space-Time-Cube
 Specifying of Requirements for Spatio-Temporal Data in Map by Eye-Tracking and Space-Time-Cube Stanislav Popelka, Vít Voženílek Palacký University, Olomouc, Czech Republic ABSTRACT One of the most objective
Exploring the Influence of Color Distance on the Map Legibility
 Exploring the Influence of Color Distance on the Map Legibility Alžběta Brychtová, Stanislav Popelka Department of Geoinformatics, Faculty of Science, Palacký University in Olomouc, Czech Republic Abstract.
Online visualization of multi-dimensional spatiotemporal
 Online visualization of multi-dimensional spatiotemporal data Visualization of weather data of Germany in a large time scale Keni Han Final presentation Supervisor: Dr.-Ing. Mathias Jahnke Univ.Prof. Mag.rer.nat.
CSCI 360 Introduc/on to Ar/ficial Intelligence Week 2: Problem Solving and Op/miza/on
 CSCI 360 Introduc/on to Ar/ficial Intelligence Week 2: Problem Solving and Op/miza/on Professor Wei-Min Shen Week 13.1 and 13.2 1 Status Check Extra credits? Announcement Evalua/on process will start soon
Gradient Descent for High Dimensional Systems
 Gradient Descent for High Dimensional Systems Lab versus Lab 2 D Geometry Op>miza>on Poten>al Energy Methods: Implemented Equa3ons for op3mizer 3 2 4 Bond length High Dimensional Op>miza>on Applica3ons:
Implementing Visual Analytics Methods for Massive Collections of Movement Data
 Implementing Visual Analytics Methods for Massive Collections of Movement Data G. Andrienko, N. Andrienko Fraunhofer Institute Intelligent Analysis and Information Systems Schloss Birlinghoven, D-53754
CONCEPTUAL DEVELOPMENT OF AN ASSISTANT FOR CHANGE DETECTION AND ANALYSIS BASED ON REMOTELY SENSED SCENES
 CONCEPTUAL DEVELOPMENT OF AN ASSISTANT FOR CHANGE DETECTION AND ANALYSIS BASED ON REMOTELY SENSED SCENES J. Schiewe University of Osnabrück, Institute for Geoinformatics and Remote Sensing, Seminarstr.
Geographical Information System (GIS) Prof. A. K. Gosain
 Prof. A. K. Gosain") Geographical Information System (GIS) Prof. A. K. Gosain gosain@civil.iitd.ernet.in Definition of GIS GIS - Geographic Information System or a particular information system applied to geographical data
Geographical Information System (GIS) Prof. A. K. Gosain gosain@civil.iitd.ernet.in Definition of GIS GIS - Geographic Information System or a particular information system applied to geographical data
Lecture 13: Tracking mo3on features op3cal flow
 Lecture 13: Tracking mo3on features op3cal flow Professor Fei- Fei Li Stanford Vision Lab Lecture 14-1! What we will learn today? Introduc3on Op3cal flow Feature tracking Applica3ons Reading: [Szeliski]
Exploring the map reading process with eye movement analysis
 Exploring the map reading process with eye movement analysis Vassilios Krassanakis School of Rural & Surveying Engineering, National Technical University of Athens 9, Heroon Polytechniou Str., Zographos,
Outreach is about Access
 Outreach is about Access August Muench Harvard- Smithsonian Center for Astrophysics Sources/mo*vators/collaborators: Seamless Astronomy (A. Goodman); Chandra EPO (K. Arcand, M. Watke); CfA Science Ed (M.
A Review: Geographic Information Systems & ArcGIS Basics
 A Review: Geographic Information Systems & ArcGIS Basics Geographic Information Systems Geographic Information Science Why is GIS important and what drives it? Applications of GIS ESRI s ArcGIS: A Review
General linear model: basic
 General linear model: basic Introducing General Linear Model (GLM): Start with an example Proper>es of the BOLD signal Linear Time Invariant (LTI) system The hemodynamic response func>on (Briefly) Evalua>ng
VISUAL ANALYTICS APPROACH FOR CONSIDERING UNCERTAINTY INFORMATION IN CHANGE ANALYSIS PROCESSES
 VISUAL ANALYTICS APPROACH FOR CONSIDERING UNCERTAINTY INFORMATION IN CHANGE ANALYSIS PROCESSES J. Schiewe HafenCity University Hamburg, Lab for Geoinformatics and Geovisualization, Hebebrandstr. 1, 22297
UNIT 4: USING ArcGIS. Instructor: Emmanuel K. Appiah-Adjei (PhD) Department of Geological Engineering KNUST, Kumasi
 Department of Geological Engineering KNUST, Kumasi") UNIT 4: USING ArcGIS Instructor: Emmanuel K. Appiah-Adjei (PhD) Department of Geological Engineering KNUST, Kumasi Getting to Know ArcGIS ArcGIS is an integrated collection of GIS software products ArcGIS
UNIT 4: USING ArcGIS Instructor: Emmanuel K. Appiah-Adjei (PhD) Department of Geological Engineering KNUST, Kumasi Getting to Know ArcGIS ArcGIS is an integrated collection of GIS software products ArcGIS
Measuring locations of critical points along cartographic lines with eye movements
 Measuring locations of critical points along cartographic lines with eye movements Theodora Bargiota, Vasilis Mitropoulos, Vassilios Krassanakis, Byron Nakos School of Rural & Surveying Engineering, National
Evaluating Physical, Chemical, and Biological Impacts from the Savannah Harbor Expansion Project Cooperative Agreement Number W912HZ
 Evaluating Physical, Chemical, and Biological Impacts from the Savannah Harbor Expansion Project Cooperative Agreement Number W912HZ-13-2-0013 Annual Report FY 2018 Submitted by Sergio Bernardes and Marguerite
Efficient Delivery of Forecasts to a Nau/cal Sports Mobile Applica/on with Seman/c Data Services
 From Knowledge Genera/on To Science-based Innova/on Efficient Delivery of Forecasts to a Nau/cal Sports Mobile Applica/on with Seman/c Data Services Authors: Ricardo Amorim (1), Artur Rocha (2), Marco
Geo-Visualization. GRS09/10 Ron van Lammeren
 Geo-Visualization GRS09/10 Ron van Lammeren 2/30 Theory Semiologie Graphique http://www.flickr.com/photos/kbean/491051226/ 3/30 How to present my geo data? Visualization definitions Map making Cartographic
Geo-Visualization. GRS1011 Ron van Lammeren
 Geo-Visualization GRS1011 Ron van Lammeren Theory Semiologie Graphique http://www.flickr.com/photos/kbean/491051226/ 2/30 How to present my geo data? Visualization definitions Map making Cartographic process
ArcGIS & Extensions - Synergy of GIS tools. Synergy. Analyze & Visualize
 Using ArcGIS Extensions to Analyze and Visualize data Colin Childs 1 Topics Objectives Synergy Analysis & Visualization ArcGIS Analysis environments Geoprocessing tools Extensions ArcMap The analysis Process
ArcGIS is Advancing. Both Contributing and Integrating many new Innovations. IoT. Smart Mapping. Smart Devices Advanced Analytics
 ArcGIS is Advancing IoT Smart Devices Advanced Analytics Smart Mapping Real-Time Faster Computing Web Services Crowdsourcing Sensor Networks Both Contributing and Integrating many new Innovations ArcGIS
Design and implementation of a new meteorology geographic information system
 Design and implementation of a new meteorology geographic information system WeiJiang Zheng, Bing. Luo, Zhengguang. Hu, Zhongliang. Lv National Meteorological Center, China Meteorological Administration,
Geographic Informa0on Retrieval: Are we making progress? Ross Purves, University of Zurich
 Geographic Informa0on Retrieval: Are we making progress? Ross Purves, University of Zurich Outline Where I m coming from: defini0ons, experiences and requirements for GIR Brief lis>ng of one (of many possible)
ArcGIS GeoAnalytics Server: An Introduction. Sarah Ambrose and Ravi Narayanan
 ArcGIS GeoAnalytics Server: An Introduction Sarah Ambrose and Ravi Narayanan Overview Introduction Demos Analysis Concepts using GeoAnalytics Server GeoAnalytics Data Sources GeoAnalytics Server Administration
Modeling radiocarbon in the Earth System. Radiocarbon summer school 2012
 Modeling radiocarbon in the Earth System Radiocarbon summer school 2012 Outline Brief introduc9on to mathema9cal modeling Single pool models Mul9ple pool models Model implementa9on Parameter es9ma9on What
ADAPTABLE DASHBOARD FOR VISUALIZATION OF ORIGIN-DESTINATION DATA PATTERNS
 ADAPTABLE DASHBOARD FOR VISUALIZATION OF ORIGIN-DESTINATION DATA PATTERNS Ieva Dobrāja, PhD Candidate Prof. Dr. Menno-Jan Kraak Dr. Yuri Engelhardt NCG Symposium 2017 ADAPTABLE DASHBOARD FOR VISUALIZATION
ADAPTABLE DASHBOARD FOR VISUALIZATION OF ORIGIN-DESTINATION DATA PATTERNS
 ADAPTABLE DASHBOARD FOR VISUALIZATION OF ORIGIN-DESTINATION DATA PATTERNS Ieva Dobrāja, PhD Candidate Prof. Dr. Menno-Jan Kraak Dr. Yuri Engelhardt NCG Symposium 2017 ADAPTABLE DASHBOARD FOR VISUALIZATION
Data Aggregation with InfraWorks and ArcGIS for Visualization, Analysis, and Planning
 CI125230 Data Aggregation with InfraWorks and ArcGIS for Visualization, Analysis, and Planning Stephen Brockwell Brockwell IT Consulting Inc. Sean Kinahan Brockwell IT Consulting Inc. Learning Objectives
ArcGIS for Desktop. ArcGIS for Desktop is the primary authoring tool for the ArcGIS platform.
 ArcGIS for Desktop ArcGIS for Desktop ArcGIS for Desktop is the primary authoring tool for the ArcGIS platform. Beyond showing your data as points on a map, ArcGIS for Desktop gives you the power to manage
Using OGC standards to improve the common
 Using OGC standards to improve the common operational picture Abstract A "Common Operational Picture", or a, is a single identical display of relevant operational information shared by many users. The
Reduced Models for Process Simula2on and Op2miza2on
 Reduced Models for Process Simulaon and Opmizaon Yidong Lang, Lorenz T. Biegler and David Miller ESI annual meeng March, 0 Models are mapping Equaon set or Module simulators Input space Reduced model Surrogate
SCIENCE CHINA Earth Sciences. Using eye tracking to evaluate the usability of animated maps
 SCIENCE CHINA Earth Sciences RESEARCH PAPER March 2014 Vol.57 No.3: 512 522 doi: 10.1007/s11430-013-4685-3 Using eye tracking to evaluate the usability of animated maps DONG WeiHua *, LIAO Hua, XU Fang,
GIS and Information Management. Steve Cooper Chief Communications Officer PPDM Association
 GIS and Information Management Steve Cooper Chief Communications Officer PPDM Association GIS and Information Management The traditional role of GIS in the oil and gas industry GIS as part of the Information
From Professional to People s Software Tracing the Development of 3D GIS Software at ESRI
 From Professional to People s Software Tracing the Development of 3D GIS Software at ESRI Jinwi MA, ESRI Environmental Systems Research Institute, USA 1 Abstract 3D Analyst is ESRI s commercial 3D GIS
Short introduc,on to the
 OXFORD NEUROIMAGING PRIMERS Short introduc,on to the An General Introduction Linear Model to Neuroimaging for Neuroimaging Analysis Mark Jenkinson Mark Jenkinson Janine Michael Bijsterbosch Chappell Michael
Studying the attentive behavior of novice and expert map users. using eye tracking. {Kristien.Ooms;
 Published as: Ooms, K., De Maeyer, P., Fack, V., 2014, Study of the attentive behavior of novice and expert map users using eye tracking. Cartography and Geographic Information Science, 41 (1), p. 37-54
The Acequia Model Local Knowledge and Sociocultural Adaptation In the Northern Rio Grande Watershed Commons
 José Rivera, PhD. Professor CNH Group UNM José de Urru+a Map of Santa Fe ca. 1767 Presa at Rio Pecos ca. 1917 Museum of New Mexico Photo Aerial of Velarde Orchards 1986 Photo by Paul Logsdon Ditch Cleaning
Exploring Climate Patterns Embedded in Global Climate Change Datasets
 Exploring Climate Patterns Embedded in Global Climate Change Datasets James Bothwell, May Yuan Department of Geography University of Oklahoma Norman, OK 73019 jamesdbothwell@yahoo.com, myuan@ou.edu Exploring
DATA SOURCES AND INPUT IN GIS. By Prof. A. Balasubramanian Centre for Advanced Studies in Earth Science, University of Mysore, Mysore
 DATA SOURCES AND INPUT IN GIS By Prof. A. Balasubramanian Centre for Advanced Studies in Earth Science, University of Mysore, Mysore 1 1. GIS stands for 'Geographic Information System'. It is a computer-based
Welcome! Power BI User Group (PUG) Copenhagen
 Copenhagen") Welcome! Power BI User Group (PUG) Copenhagen Making Maps in Power BI Andrea Martorana Tusa BI Specialist Welcome to Making maps in Power BI Who am I? First name: Andrea. Last name: Martorana Tusa. Italian,
Welcome! Power BI User Group (PUG) Copenhagen Making Maps in Power BI Andrea Martorana Tusa BI Specialist Welcome to Making maps in Power BI Who am I? First name: Andrea. Last name: Martorana Tusa. Italian,
Synergy between GNSS and GIS Application for Monitoring Land use Production An Integrated Approach
 Synergy between GNSS and GIS Application for Monitoring Land use Production An Integrated Approach Muhammad Umar Iqbal Manager/ Sec4on Head GIS Space Technology Applica4ons Directorate Pakistan Space and
Overview. GIS Data Output Methods
 Overview GIS Output Formats ENV208/ENV508 Applied GIS Week 2: Making maps, data visualisation, and GIS output GIS Output Map Making Types of Maps Key Elements Table Graph Statistics Maps Map Making Maps
ENV208/ENV508 Applied GIS. Week 2: Making maps, data visualisation, and GIS output
 ENV208/ENV508 Applied GIS Week 2: Making maps, data visualisation, and GIS output Overview GIS Output Map Making Types of Maps Key Elements GIS Output Formats Table Graph Statistics Maps Map Making Maps
Universiteit Leiden Opleiding Informatica
 2010-09 August 2010 Universiteit Leiden Opleiding Informatica Ben Kwint BACHELOR THESIS Leiden Institute of Advanced Computer Science (LIACS) Leiden University Niels Bohrweg 1 2333 CA Leiden The Netherlands
CSE P 501 Compilers. Value Numbering & Op;miza;ons Hal Perkins Winter UW CSE P 501 Winter 2016 S-1
 CSE P 501 Compilers Value Numbering & Op;miza;ons Hal Perkins Winter 2016 UW CSE P 501 Winter 2016 S-1 Agenda Op;miza;on (Review) Goals Scope: local, superlocal, regional, global (intraprocedural), interprocedural
Computer Vision. Pa0ern Recogni4on Concepts Part I. Luis F. Teixeira MAP- i 2012/13
 Computer Vision Pa0ern Recogni4on Concepts Part I Luis F. Teixeira MAP- i 2012/13 What is it? Pa0ern Recogni4on Many defini4ons in the literature The assignment of a physical object or event to one of
INDUSTRIAL PARK EVALUATION BASED ON GEOGRAPHICAL INFORMATION SYSTEM TEHNOLOGY AND 3D MODELLING
 Abstract INDUSTRIAL PARK EVALUATION BASED ON GEOGRAPHICAL INFORMATION SYSTEM TEHNOLOGY AND 3D MODELLING Andreea CALUGARU University of Agronomic Sciences and Veterinary Medicine of Bucharest, Romania Corresponding
What are the five components of a GIS? A typically GIS consists of five elements: - Hardware, Software, Data, People and Procedures (Work Flows)
") LECTURE 1 - INTRODUCTION TO GIS Section I - GIS versus GPS What is a geographic information system (GIS)? GIS can be defined as a computerized application that combines an interactive map with a database
LECTURE 1 - INTRODUCTION TO GIS Section I - GIS versus GPS What is a geographic information system (GIS)? GIS can be defined as a computerized application that combines an interactive map with a database
Spatial Analysis with Web GIS. Rachel Weeden
 Spatial Analysis with Web GIS Rachel Weeden Agenda Subhead goes here Introducing ArcGIS Online Spatial Analysis Workflows Scenarios Other Options Resources ArcGIS is a Platform Making mapping and analytics
COMP 562: Introduction to Machine Learning
 COMP 562: Introduction to Machine Learning Lecture 20 : Support Vector Machines, Kernels Mahmoud Mostapha 1 Department of Computer Science University of North Carolina at Chapel Hill mahmoudm@cs.unc.edu
Visual A)en,on and Emo,on: Measurement to Insight
en,on and Emo,on: Measurement to Insight") Visual A)en,on and Emo,on: Measurement to Insight Dr. Colin Swindells SENG 411 21 June 2011 colinedw@cs.uvic.ca User Behaviour: Visual AGenHon 2 User Behaviour: Visual EmoHon hgp://selectstart.tv/gamer
Visual A)en,on and Emo,on: Measurement to Insight Dr. Colin Swindells SENG 411 21 June 2011 colinedw@cs.uvic.ca User Behaviour: Visual AGenHon 2 User Behaviour: Visual EmoHon hgp://selectstart.tv/gamer
USER PREFERENCES IN IMAGE MAP USING
 USER PREFERENCES IN IMAGE MAP USING A. Vondráková *, V. Vozenilek Department of Geoinformatics, Faculty of Science, Palacký University Olomouc, 17. listopadu 50, 771 46 Olomouc, Czech Republic alena.vondrakova@upol.cz,
a system for input, storage, manipulation, and output of geographic information. GIS combines software with hardware,
 Introduction to GIS Dr. Pranjit Kr. Sarma Assistant Professor Department of Geography Mangaldi College Mobile: +91 94357 04398 What is a GIS a system for input, storage, manipulation, and output of geographic
When Map Quality Matters
 When Map Quality Matters 50% 25% Powerful geospatial mapping tools for Adobe Creative Cloud and offline map solutions for mobile devices 20% When Map Quality Matters 10% We re focused on creating powerful
DP Project Development Pvt. Ltd.
 Dear Sir/Madam, Greetings!!! Thanks for contacting DP Project Development for your training requirement. DP Project Development is leading professional training provider in GIS technologies and GIS application
Informa(onal Subs(tutes and Complements for Predic(on
 Informa(onal Subs(tutes and Complements for Predic(on Yiling Chen Harvard University November 19, 2015 Joint work with Bo Waggoner Roadmap Informa(on, predic(on and predic(on markets Subs(tutes and complements
Combining Geospatial and Statistical Data for Analysis & Dissemination
 Combining Geospatial and Statistical Data for Analysis & Dissemination (with Special Reference to Qatar Census 2010) Presentation by Mansoor Al Malki, Director of IT Department Qatar Statistics Authority
STUDY GUIDE. Exploring Geography. Chapter 1, Section 1. Terms to Know DRAWING FROM EXPERIENCE ORGANIZING YOUR THOUGHTS
 For use with textbook pages 19 22. Exploring Geography Terms to Know location A specific place on the earth (page 20) absolute location The exact spot at which a place is found on the globe (page 20) hemisphere
Combing Open-Source Programming Languages with GIS for Spatial Data Science. Maja Kalinic Master s Thesis
 Combing Open-Source Programming Languages with GIS for Spatial Data Science Maja Kalinic Master s Thesis International Master of Science in Cartography 14.09.2017 Outline Introduction and Motivation Research
GIS-BASED VISUALIZATION FOR ESTIMATING LEVEL OF SERVICE Gozde BAKIOGLU 1 and Asli DOGRU 2
 Presented at the FIG Congress 2018, May 6-11, 2018 in Istanbul, Turkey GIS-BASED VISUALIZATION FOR ESTIMATING LEVEL OF SERVICE Gozde BAKIOGLU 1 and Asli DOGRU 2 1 Department of Transportation Engineering,
USAGE OF OLD MAPS AND THEIR DISTRIBUTION WITHIN THE FRAME OF WEB MAP SERVICES
 USAGE OF OLD MAPS AND THEIR DISTRIBUTION WITHIN THE FRAME OF WEB MAP SERVICES Jiri Cajthaml, Jiri Krejci Czech Technical University in Prague, Faculty of Civil Engineering, Department of Mapping and Cartography,
Chapter 1, Section 1 Exploring Geography
 Chapter 1, Section 1 Exploring Geography (Pages 19 22) Setting a Purpose for Reading Think about these questions as you read: What are the physical and human features geographers study? How do geographers
Unit 1, Lesson 3 What Tools and Technologies Do Geographers Use?
 Unit 1, Lesson 3 What Tools and Technologies Do Geographers Use? Geographers use a variety of tools and technologies in investigating geographic questions. Maps and globes both represent the earth, but
Be#er Generaliza,on with Forecasts. Tom Schaul Mark Ring
 Be#er Generaliza,on with Forecasts Tom Schaul Mark Ring Which Representa,ons? Type: Feature- based representa,ons (state = feature vector) Quality 1: Usefulness for linear policies Quality 2: Generaliza,on
FUNDAMENTALS OF GEOINFORMATICS PART-II (CLASS: FYBSc SEM- II)
") FUNDAMENTALS OF GEOINFORMATICS PART-II (CLASS: FYBSc SEM- II) UNIT:-I: INTRODUCTION TO GIS 1.1.Definition, Potential of GIS, Concept of Space and Time 1.2.Components of GIS, Evolution/Origin and Objectives
FUNDAMENTALS OF GEOINFORMATICS PART-II (CLASS: FYBSc SEM- II) UNIT:-I: INTRODUCTION TO GIS 1.1.Definition, Potential of GIS, Concept of Space and Time 1.2.Components of GIS, Evolution/Origin and Objectives
EYE-TRACKING TESTING OF GIS INTERFACES
 Geoinformatics EYE-TRACKING TESTING OF GIS INTERFACES Bc. Vaclav Kudelka Ing. Zdena Dobesova, Ph.D. Department of Geoinformatics, Palacký University, Olomouc, Czech Republic ABSTRACT Eye-tracking is currently
Interes'ng- Phrase Mining for Ad- Hoc Text Analy'cs
 Interes'ng- Phrase Mining for Ad- Hoc Text Analy'cs Klaus Berberich (kberberi@mpi- inf.mpg.de) Joint work with: Srikanta Bedathur, Jens DiIrich, Nikos Mamoulis, and Gerhard Weikum (originally presented
Examining the Evidence: Using data to pose and answer ques8ons about Earth s changing climate! Free Polar Explorer: Sea Level app and ac8vi8es
 Examining the Evidence: Using data to pose and answer ques8ons about Earth s changing climate! Free Polar Explorer: Sea Level app and ac8vi8es www.polarexplorer.org Margie Turrin & Dave Porter What are
Ensemble 4DVAR and observa3on impact study with the GSIbased hybrid ensemble varia3onal data assimila3on system. for the GFS
 Ensemble 4DVAR and observa3on impact study with the GSIbased hybrid ensemble varia3onal data assimila3on system for the GFS Xuguang Wang University of Oklahoma, Norman, OK xuguang.wang@ou.edu Ting Lei,
Animating Maps: Visual Analytics meets Geoweb 2.0
 Animating Maps: Visual Analytics meets Geoweb 2.0 Piyush Yadav 1, Shailesh Deshpande 1, Raja Sengupta 2 1 Tata Research Development and Design Centre, Pune (India) Email: {piyush.yadav1, shailesh.deshpande}@tcs.com
Spatial Data Science. Soumya K Ghosh
 Workshop on Data Science and Machine Learning (DSML 17) ISI Kolkata, March 28-31, 2017 Spatial Data Science Soumya K Ghosh Professor Department of Computer Science and Engineering Indian Institute of Technology,
Cell-based Model For GIS Generalization
 Cell-based Model For GIS Generalization Bo Li, Graeme G. Wilkinson & Souheil Khaddaj School of Computing & Information Systems Kingston University Penrhyn Road, Kingston upon Thames Surrey, KT1 2EE UK
Visual Analytics ofmovement
 Gennady Andrienko. Natalia Andrienko Peter Bak Daniel Keim Stefan Wrobel Visual Analytics ofmovement ~ Springer Contents 1 Introduction... 1 1.1 A Single Trajectory.....................................
Cosmic Ray Electrons with CTA. R.D. Parsons
 Cosmic Ray Electrons with CTA R.D. Parsons Cosmic Ray Electrons In addi:on to the well known hadronic component of cosmic rays there is a more poorly understood electronic component Has a lower flux than
Forest Service. Geospatial Management. Presented by: Carl Zulick, USFS Geospatial Information Officer. April 1, 2014
 Forest Service Geospatial Management Presented by: Carl Zulick, USFS Geospatial Information Officer April 1, 2014 USFS Mission "Caring for the Land and Serving People" The mission of the USDA Forest Service
Predic've Analy'cs for Energy Systems State Es'ma'on
 1 Predic've Analy'cs for Energy Systems State Es'ma'on Presenter: Team: Yingchen (YC) Zhang Na/onal Renewable Energy Laboratory (NREL) Andrey Bernstein, Rui Yang, Yu Xie, Anthony Florita, Changfu Li, ScoD
ArcGIS Data Models: Multiscale Topographic Maps. Charlie Frye Aileen Buckley
 ArcGIS Data Models: Multiscale Topographic Maps Charlie Frye Aileen Buckley Other cartography sessions ArcGIS ArcMap: Introduction to ArcMap Wed 1:30 PM, 6F ArcGIS Cartography: Map Design and Page Layout
Esri Defense Mapping: Cartographic Production. Bo King
 Esri Defense Mapping: Cartographic Production Bo King Agenda Esri Defense Mapping: Cartographic Production Solution Overview Desktop Cartographic Production Workflow - Create Rapid Graphic Product On Demand
Global es)mates of evapotranspira)on for climate studies using mul)- sensor remote sensing data: Evalua)on of three process- based
mates of evapotranspira)on for climate studies using mul)- sensor remote sensing data: Evalua)on of three process- based") Global es)mates of evapotranspira)on for climate studies using mul)- sensor remote sensing data: Evalua)on of three process- based approaches Vinukollu, R.K., Wood, E.F., Ferguson, C.R., Fisher, J.B.:
Global es)mates of evapotranspira)on for climate studies using mul)- sensor remote sensing data: Evalua)on of three process- based approaches Vinukollu, R.K., Wood, E.F., Ferguson, C.R., Fisher, J.B.:
Canadian Historical GIS Partnership Development: Taking Steps for Historical Mapping in Canada
 Canadian Historical GIS Partnership Development: Taking Steps for Historical Mapping in Canada Byron Moldofsky Manager, GIS and Cartography Office Department of Geography and Planning University of Toronto
Web 2.0, map production & publishing and geospatial information dissemenation
 Web 2.0, map production & publishing and geospatial information dissemenation Professor William Cartwright President, International Cartographic Association William Cartwright 18th UNRCC for Asia and the
Least Mean Squares Regression. Machine Learning Fall 2017
 Least Mean Squares Regression Machine Learning Fall 2017 1 Lecture Overview Linear classifiers What func?ons do linear classifiers express? Least Squares Method for Regression 2 Where are we? Linear classifiers
Instructor: Amol Deshpande
 Instructor: Amol Deshpande amol@cs.umd.edu } New topics to discuss More constructs in E/R modeling Conver@ng from E/R to rela@onal schema Crea@ng some E/R models Ruby on Rails } Other things Grading of
ArcGIS Enterprise: What s New. Philip Heede Shannon Kalisky Melanie Summers Sam Williamson
 ArcGIS Enterprise: What s New Philip Heede Shannon Kalisky Melanie Summers Sam Williamson ArcGIS Enterprise is the new name for ArcGIS for Server What is ArcGIS Enterprise ArcGIS Enterprise is powerful
Renewable Energy Development and Airborne Wildlife Conservation
 Whitepaper ECHOTRACK TM RADAR ACOUSTIC TM SURVEILLANCE SYSTEM Renewable Energy Development and Airborne Wildlife Conservation Renewable energy developers must meet regulatory requirements to mitigate for
Visual Studies Exercise, Assignment 07 (Architectural Paleontology) Geographic Information Systems (GIS), Part II
 Geographic Information Systems (GIS), Part II") ARCH1291 Visual Studies II Week 8, Spring 2013 Assignment 7 GIS I Prof. Alihan Polat Visual Studies Exercise, Assignment 07 (Architectural Paleontology) Geographic Information Systems (GIS), Part II Medium:
ARCH1291 Visual Studies II Week 8, Spring 2013 Assignment 7 GIS I Prof. Alihan Polat Visual Studies Exercise, Assignment 07 (Architectural Paleontology) Geographic Information Systems (GIS), Part II Medium:
From the general perspec0ve
 Tensor field visualiza0on My view on the field January 2016 Geilo winter School Scien0fic Visualiza0on Linköping University From the general perspec0ve 2 to digging in the sand 3 Tensor field visualiza0on
CS 6140: Machine Learning Spring What We Learned Last Week 2/26/16
 Logis@cs CS 6140: Machine Learning Spring 2016 Instructor: Lu Wang College of Computer and Informa@on Science Northeastern University Webpage: www.ccs.neu.edu/home/luwang Email: luwang@ccs.neu.edu Sign
Unit 1, Lesson 2. What is geographic inquiry?
 What is geographic inquiry? Unit 1, Lesson 2 Understanding the way in which social scientists investigate problems will help you conduct your own investigations about problems or issues facing your community
Streaming - 2. Bloom Filters, Distinct Item counting, Computing moments. credits:www.mmds.org.
 Streaming - 2 Bloom Filters, Distinct Item counting, Computing moments credits:www.mmds.org http://www.mmds.org Outline More algorithms for streams: 2 Outline More algorithms for streams: (1) Filtering
Update and Modernization of Sales Tax Rate Lookup Tool for Public and Agency Users. David Wrigh
 Update and Modernization of Sales Tax Rate Lookup Tool for Public and Agency Users David Wrigh GIS at the Agency Introduction Who we are! George Alvarado, David Wright, Marty Parsons and Bob Bulgrien make
Aileen Buckley, Ph.D. and Charlie Frye
 An Information Model for Maps: Towards Production from GIS Databases Aileen Buckley, Ph.D. and Charlie Frye Researchers, ESRI GIS vs. cart GIS Outline of the presentation Introduction Differences between
Crop Production Using Variable Rate Technology for P&K in the United States Midwest: Evaluation of Profitability
 First Draft: August, 2003; Second Draft: May, 2004; Current Version: May, 2006. Crop Producon Using Variable Rate Technology for P&K in the United States Midwest: Evaluaon of Profitability Yuliya Bolotova
Fi#h Mee(ng of the Inter-agency and Expert Group on Sustainable Development Goals Indicators O"awa, Canada March 2017
 Fi#h Mee(ng of the Inter-agency and Expert Group on Sustainable Development Goals Indicators O"awa, Canada 28 31 March 2017 Report of the IAEG-SDGs Working Group on Geospa(al Informa(on co-chairs: Ms Marie
Laboratory on Geoinformatics and Cartography
 Research on usability testing and cognitive issues of cartographic visualizations in the context of different groups of users Milan Konečný Čeněk Šašinka, Zbyněk Štěrba Masaryk University, Brno, CZ 19.
Spectral Algorithms for Graph Mining and Analysis. Yiannis Kou:s. University of Puerto Rico - Rio Piedras NSF CAREER CCF
 Spectral Algorithms for Graph Mining and Analysis Yiannis Kou:s University of Puerto Rico - Rio Piedras NSF CAREER CCF-1149048 The Spectral Lens A graph drawing using Laplacian eigenvectors Outline Basic
Gene Regulatory Networks II Computa.onal Genomics Seyoung Kim
 Gene Regulatory Networks II 02-710 Computa.onal Genomics Seyoung Kim Goal: Discover Structure and Func;on of Complex systems in the Cell Identify the different regulators and their target genes that are
Lecture 5. Representing Spatial Phenomena. GIS Coordinates Multiple Map Layers. Maps and GIS. Why Use Maps? Putting Maps in GIS
 Lecture 5 Putting Maps in GIS GIS responds to three fundamental questions by automating spatial data: What is where? Why is it there? GIS reveals linkages unevenly distributed social, economic and environmental