Improvement and Sensitivity Analysis of the Atmospheric Chemistry Module for Modeling TICs in SCIPUFF
|
|
|
- Oswin Stokes
- 5 years ago
- Views:
Transcription
1 Improvement and Sensitivity Analysis of the Atmospheric Chemistry Module for Modeling TICs in SCIPUFF Douglas S Burns, Veeradej Chynwat, William Moore, Jeffrey J Piotrowski, and Floyd Wiseman ENSCO, Inc. Science and Technology for Chem-Bio Information Systems (S&T CBIS) January 11, 2007
2 Background Phase I 9/03 9/05 Atmospheric Chemistry Module for TICs Mike Henley, AFRL/MLQ Tyndall AFB, FL Phase II 9/06 current Modeling the Atmospheric Chemistry of Toxic Industrial Chemicals
3 Outline Background Project Goals Phase I Status Methodology Integration in SCIPUFF Derivation of k eff (example: 1-butene) Parameter Space Results Improved regression on k eff Model output Summary
4 Project Goals Develop initial atmospheric chemistry capability Develop Atmospheric Chemistry Algorithm Algorithm MUST run rapidly. Develop generic algorithm so that a detailed chemical kinetics approach is not required. Algorithm must account for all (most) modeling scenarios (e.g., CC, T, ambient conditions). Algorithm must be robust enough to account for diurnal changes to degradation rates. Algorithm should account for the potential generation of intermediate toxic compounds. Develop Chemical data for the Chemistry Algorithm Review existing chemistry data for nine alkenes (and H 2 S) Develop mechanisms used to generate chemistry algorithm. Couple Algorithm to SCIPUFF Work with Dr. Sykes to create interface with SCIPUFF Launch Chemistry Module from HPAC
5 Phase I Atmospheric Chemistry Modeling Capabilities Alpha code Delivered Feb 2005 Ability to model reactant decomposition product formation Butene + Propanal (R and P) Beta code Delivered Sep TICs (9 Alkene s + H 2 S) No impact on wall-clock run time
6 Methodology: Minor Modification to SCIPUFF SCIPUFF Dispersion (max) (min) = k = max( k sin( φ), k ) A A A = k A = k eff = f ( φ,[ amb], T, cc, humidity, etc.)
7 Method: Create Degrade Dynamic Link Library Algorithm is transparent to the User Details in the Software Development Plan API Interface Functions Code always calls chemistry Project Manager File Manager Plot Manager SCIPUFF Function Library Plottool DEGRADE DLL Dispersion File Readers Plot Generator Meteorology Generator Utility Functions Effects Manager Effect Module Effect Module MC- SCIPUFF SWIFT
8 Methodology: Chemistry of 1-butene CH 2 =CHCH 2 CH 3 + OH 0.94 C 2 H 5 CHO + Other products CH 2 =CHCH 2 CH 3 + NO C 2 H 5 CHO C 3 H 5 O-CH-O-NO 2 + Other products CH 2 =CHCH 2 CH 3 + O C 2 H 5 CHO OH + Other products Rate = -(k OH [OH] + k NO3 [NO 3 ] + k O3 [O 3 ]) [1-butene] Rate = -k eff [1-butene]
9 Methodology: Chemistry of 1-butene k rxn as f(t) Determine ID Rxn s, E A, k(t) (w/ OH, NO 3, H 2 O, O 3, etc.) Implement in Detailed Mechanism k NO3 and k O3 [ppm -1 min -1 ] ko3 * 10^3 kno3 koh k OH [ppm -1 min -1 ] Run PBM as f(met parm s) Temperature [K] Obtain c TIC (t) as f(met parm s) Derive Empirical k eff (met parm s) Populate SCIPUFF data tables w/ k eff for TICs
10 Methodology: Detailed Mechanism Determine ID Rxn s, E A, k(t) (w/ OH, NO 3, H 2 O, O 3, etc.) Implement in Detailed Mechanism Run PBM as f(met parm s) Carbon Bond Mechanism Mass consistent atmospheric chemistry mechanism. EPA Model (Adelman, 1999). Used to model the ambient conditions. [OH], [NO 3 ], [O 3 ], NO X, VOCs, etc. Append chemistry for TIC Data provided for 9 alkenes and H 2 S Obtain c TIC (t) as f(met parm s) Derive Empirical k eff (met parm s) Populate SCIPUFF data tables w/ k eff for TICs
11 Methodology: Run Detailed Chemistry Implement in Detailed Mechanism Run PBM as f(met parm s) CO H2O NOX VOC s O3 or ZA = f(lat, Lon, DOY, Time of day) Temperature Location (lat,long) k eff is a function of solar elevation, cloud cover, air quality, temperature, humidity, etc Obtain c TIC (t) as f(met parm s) Derive Empirical k eff (met parm s) Populate SCIPUFF data tables w/ k eff for TICs
12 Methodology: Parameter Space Parameter Units SCIPUFF Solar Zenith Angle 0 90 Deg X Location (lat, lon) 0 70 Deg X Time of Day 1440 min X Day of Year 3/21, 6/20, 12/20 X Photochemistry (Cloud Cover) 0 8 Eighths X Temperature K X Water Concentration PPM Moisture Mixing ratio X Air Quality [NO X ], VOC, O 3, Land Use Urban, ocean, forest, X
13 Methodology: Surrogate for Air Quality Land Use 1=Developed 2=Dry Cropland & pasture 3=Irrigated Cropland 5=Cropland/Grassland 6=Cropland/Woodland 7=Grassland 8=Shrubland 9=Shrubland/Grassland 10=Savanna 11=Deciduous Broadleaf 12=Deciduous Needleleaf 13=Evergreen Broadleaf 14=Evergreen Needleleaf 15=Mixed Forest 16=Water 17=Herbaceous Wetland 18=Wooded Wetland 19=Barren 20=Herbaceous Tundra 21=Wooded Tundra 22=Mixed Tundra 23=Bare Tundra 24=Snow or Ice 25=Partly Developed 1001=Urban Superclass 1002=Grassland Superclass 1003=Forest Superclass 1004=Desert Superclass 1005=Water Superclass
14 Methodology: Surrogate for Air Quality NOx vs VOC (vary by Latitude) (Mar, Jun, Dec, 2000, T = 280K, CC = 0, Lat 0-60) 1.00E+00 Urban 1.00E-01 Default Desert 1.00E-02 Forest NOx (ppm) 1.00E E-04 Grassland Water 1.00E E Propene-Eq (ppm-c)
15 Methodology: Refined Parameter Space (T, H 2 O) Surface Stations Nov 2003 Sep Global 0.5 km LU Data Set 1. Extracted data using 3 hr interval instead of 30 sec data. (both day and night) 2. Removed extreme data points (i.e., T<-60 C or T<Dew point). 3. Matched weather station data with LU data before analysis (5 categories). Latitude Temperature (K) [H 2 O] (x10 3 ) ppm) Min Max Min Max
16 r i Methodology: Run Detailed Chemistry c [ OH ][ c ] k [ NO ][ c ] k [ O ][ c ] k[ c ]... i = = koh i NO3 3 i O3 3 i i t Chemistry Implement in Detailed Mechanism Run PBM as f(met parm s) dc dt i k eff chemistry = = k dc dt [] c eff [ c ] i Obtain c TIC (t) as f(met parm s) Derive Empirical k eff (met parm s) Populate SCIPUFF data tables w/ k eff for TICs
17 k eff Methodology: Obtain C TIC as f(t) = dc dt [] c Implement in Detailed Mechanism Run PBM as f(met parm s) [Butene] [PPM] T = 290 K, Land Use = Urban [ ] 20º 50º [Butene] as f(time) Latitude = 20 50º N Time of Day (min from midnight) Obtain c TIC (t) as f(met parm s) Derive Empirical k eff (met parm s) Populate SCIPUFF data tables w/ k eff for TICs
18 k eff Methodology: Obtain k eff as f(met parms) = dc dt [] c Implement in Detailed Mechanism Run PBM as f(met parm s) k eff [min -1 ] T = 290 K, Land Use = Urban k eff as f(time) 50º 25º Time of Day (min from midnight) Obtain c TIC (t) as f(met parm s) Derive Empirical k eff (met parm s) Populate SCIPUFF data tables w/ k eff for TICs
19 Phase I Methodology: Derive Empirical k eff Generate k eff for various combinations of meteorological parameters for each land use Transform data to center on all parameters Perform statistical regression - correlation Review Equation Review Statistical Parameters (e.g., r 2 ) Weigh fit vs number of parameters Derive an empirical k eff = f(se, T, lat, tod, CC, [H 2 O]) Compare the k eff (empirical model) with the PBM derived k eff. Obtain c TIC (t) as f(met parm s) Derive Empirical k eff (met parm s) Populate SCIPUFF data tables w/ k eff for TICs
20 Results: k eff (polynomial) vs k eff (PBM) for butene k eff [min -1 ] from Polynomial Model: 10 Parameters r 2 = 0.80 Land Use = Urban Day > 500,000 points Night k eff [min -1 ] from PBM
21 Results: k eff (polynomial) vs k eff (PBM) for butene k eff [min -1 ] from Polynomial Land Use = Water Model: 10 Parameters r 2 = 0.97 Day > 500,000 points Night k eff [min -1 ] from PBM
22 Results: k eff (polynomial) vs k eff (PBM) for butene k eff [min -1 ] from Polynomial Model: 10 Parameters r 2 = 0.77 Land Use = Forest Day k eff [min -1 ] from PBM > 500,000 points Night
23 Current Effort Improve Regression Analysis Goal: Obtain better correlation with fewer fitting parameters for k eff. Method: Daytime (SE > 5 ) Fit polynomial spline for the 4104 unique combinations of latitude, temperature, cloud cover, and humidity 7 parameter estimates for each combination used to estimate k eff for a given time. Nighttime (SE < 5 ) Data for each time span before sunrise and after sunset were divided into quartiles. Average k eff calculated for each of the eight quartile. F90 code written to ingest lat, T, CC, Humidity, and Time. Interpolate k eff values that lie between parameter values. Will become the new degrade.dll code once completely tested. Must verify run-time performance
24 Results: k eff (spline) vs Time of Day for butene Land Use = Urban Lat 0, Temp 311 K, Cloud Cover 0/8, [H 2 O] = ppm, k eff [min -1 ] Time of Day [min after midnight]
25 Results: k eff (spline) vs k eff (PBM) for butene k eff [min -1 ] from Spline Fit Model: Spline r 2 = Land Use = Water r 2 = 0.99 Day > 500,000 points Night k eff [min -1 ] from PBM
26 Results: k eff (spline) vs k eff (PBM) for butene k eff [min -1 ] from Spline Fit Model: Spline r 2 = 0.98 Land Use = Forest r 2 = 0.99 Day > 500,000 points Night k eff [min -1 ] from PBM
27 Results: k eff (spline) vs k eff (PBM) for butene k eff [min -1 ] from Spline Fit Model: Spline r 2 = Land Use = Urban r 2 = 0.98 Day k eff [min -1 ] from PBM > 500,000 points Night
28 Summary: Improved Regression Land Use Phase I: 7 10 parameter polynomial Phase II: Spline Fit Comparison & Summary of r 2 values Day (SE > 5) Night (SE < 5) Phase I Phase II Phase I Phase II Water NA* 0.99 Urban NA 0.98 Grass NA Forest NA 0.99 Desert NA 0.99 Default NA 0.99 * Phase I k eff (night) was set to a constant.
29 Results: Nine Alkenes Priority I 1-Butene Products (Propanal, Nitroxybutanone). Ethene Propene Methylpropene 1,3-Butadiene Priority II Styrene Priority III cis-2-butene trans-2-butene Isoprene
30 Why Chemistry is Important in AT&D Modeling
")

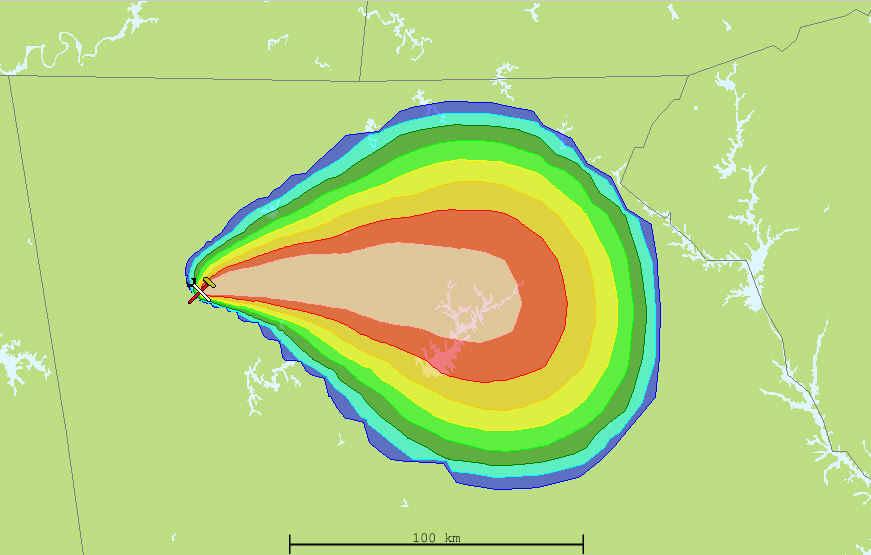
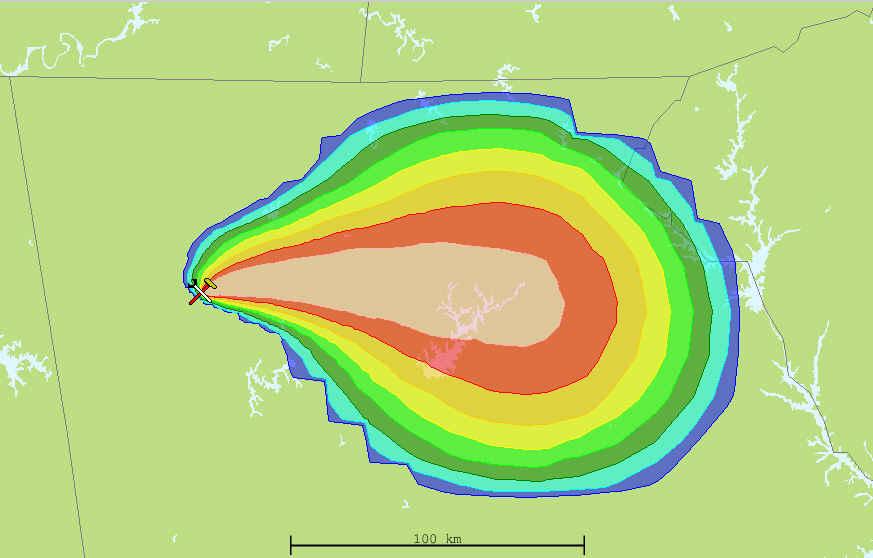
31 Results: T&D Compared to T&D + Chemistry (Butene) T&D Only T&D + Chemistry SCIPUFF Tracer 1-Butene


32 Results: Methylpropene 8 hr continuous release starting at 8 am local time No Chemistry AM PM Local Time Chemistry


33 Results: Calculated Plume is TIC Dependent Ethene Propene 3-Methyl Propene 1,3-Butadiene

34 Results: TIC Decay and Product Formation 1-Butene Propanal At 4 hrs and 8 hrs after release 2 hr continuous release starting at noon local time
35 Summary & Future Work Phase I model No slow down in SCIPUFF Ability to model product formation Phase II Model Improved daytime k eff R to for the various land uses Phase II Model Significantly improved nighttime k eff No longer an assumed constant value Future Work Complete testing of spline model in SCIPUFF / HPAC Verify no slow down in SCIPUFF Develop spline models for balance of TICs Continue Sensitivity Analysis studies Develop k eff s for other priority TICs Chamber Expt s being Designed (Chemistry Validation)
36 End of slides
An Atmospheric Chemistry Module for Modeling Toxic Industrial Chemicals (TICs) in SCIPUFF
 in SCIPUFF") An Atmospheric Chemistry Module for Modeling Toxic Industrial Chemicals (TICs) in SCIPUFF Douglas S Burns, Veeradej Chynwat, Jeffrey J Piotrowski, Kia Tavares, and Floyd Wiseman ENSCO, Inc. Science and
An Atmospheric Chemistry Module for Modeling Toxic Industrial Chemicals (TICs) in SCIPUFF Douglas S Burns, Veeradej Chynwat, Jeffrey J Piotrowski, Kia Tavares, and Floyd Wiseman ENSCO, Inc. Science and
Development and Implementation of a Model for Predicting the Aerosolization of Agents in a Stack
 Development and Implementation of a Model for Predicting the Aerosolization of Agents in a Stack Teri J Robertson, Douglas S Burns, Jeffrey J Piotrowski, Dustin B Phelps, Veeradej Chynwat and Eileen P
Comparison of NASA AIRS and MODIS Land Surface Temperature and Infrared Emissivity Measurements from the EOS AQUA platform
 Comparison of NASA AIRS and MODIS Land Surface Temperature and Infrared Emissivity Measurements from the EOS AQUA platform Robert Knuteson, Hank Revercomb, Dave Tobin University of Wisconsin-Madison 16
Comparison of NASA AIRS and MODIS Land Surface Temperature and Infrared Emissivity Measurements from the EOS AQUA platform
 Comparison of NASA AIRS and MODIS Land Surface Temperature and Infrared Emissivity Measurements from the EOS AQUA platform Robert Knuteson, Steve Ackerman, Hank Revercomb, Dave Tobin University of Wisconsin-Madison
First steps toward a comparison of modelled thermal comfort during a heatwave in Melbourne, Australia
 First steps toward a comparison of modelled thermal comfort during a heatwave in Melbourne, Australia Stephanie Jacobs PhD supervisors: Ailie Gallant and Nigel Tapper Outline of talk Motivation for research
CHM 5423 Atmospheric Chemistry Notes on reactions of organics in the troposphere (Chapter 5)
") CHM 5423 Atmospheric Chemistry Notes on reactions of organics in the troposphere (Chapter 5) 5.1 Introduction In general, the lifetime of a molecule in the troposphere is governed by a variet of processes.
CHM 5423 Atmospheric Chemistry Notes on reactions of organics in the troposphere (Chapter 5) 5.1 Introduction In general, the lifetime of a molecule in the troposphere is governed by a variet of processes.
Cross-Sensor Continuity Science Algorithm
 Cross-Sensor Continuity Science Algorithm - Long Term Vegetation Index and Phenology Workshop - Javzan Tsend-Ayush and Tomoaki Miura Department of Natural Resources and Environmental Management University
Using VIIRS Land Surface Temperature to Evaluate NCEP North American Mesoscale Model (NAM) Forecast
 Forecast") Using VIIRS Land Surface Temperature to Evaluate NCEP North American Mesoscale Model (NAM) Forecast Zhuo Wang (University of Maryland) Yunyue Yu (NOAA/NESDIS/STAR) Peng Yu (University of Maryland) Yuling
Using VIIRS Land Surface Temperature to Evaluate NCEP North American Mesoscale Model (NAM) Forecast Zhuo Wang (University of Maryland) Yunyue Yu (NOAA/NESDIS/STAR) Peng Yu (University of Maryland) Yuling
CH. 3: Climate and Vegetation
 CH. 3: Climate and Vegetation GROUP WORK RUBRIC Score of 50 (5): Superior - 100% A 5 is superior work, and has completed all requirements of the assignments, it is in order and its presentation is almost
The Effects of Improved Land Use on the Meteorological Modeling in Klang Valley Region Malaysia
 EnvironmentAsia The international journal published by the Thai Society of Higher Education Institutes on Environment Available online at www.tshe.org/ea EnvironmentAsia 3(special issue) (2010) 117-123
Tropospheric OH chemistry
 Tropospheric OH chemistry CO Oxidation mechanism: CO + OH CO 2 + H, H + O 2 + M HO 2 + M, HO 2 + NO OH + NO 2 NO 2 + hν (+O 2 ) NO + O 3 Initiation step Propagation Net: CO + 2 O 2 CO 2 + O 3 HO 2 + HO
Cloud Analysis Image: Product Guide
 Cloud Analysis Image: Product Guide Doc.No. : EUM/TSS/MAN/15/795729 EUMETSAT Eumetsat-Allee 1, D-64295 Darmstadt, Germany Tel: +49 6151 807-7 Issue : v1c Fax: +49 6151 807 555 Date : 19 February 2015 http://www.eumetsat.int
Average Weather In March For Fukuoka, Japan
 Average Weather In March For Fukuoka, Japan Location This report describes the typical weather at the Fukuoka Airport (Fukuoka, Japan) weather station over the course of an average March. It is based on
AGOG 485/585 /APLN 533 Spring Lecture 5: MODIS land cover product (MCD12Q1). Additional sources of MODIS data
. Additional sources of MODIS data") AGOG 485/585 /APLN 533 Spring 2019 Lecture 5: MODIS land cover product (MCD12Q1). Additional sources of MODIS data Outline Current status of land cover products Overview of the MCD12Q1 algorithm Mapping
AGOG 485/585 /APLN 533 Spring 2019 Lecture 5: MODIS land cover product (MCD12Q1). Additional sources of MODIS data Outline Current status of land cover products Overview of the MCD12Q1 algorithm Mapping
Seasonal & Diurnal Temp Variations. Earth-Sun Distance. Eccentricity 2/2/2010. ATS351 Lecture 3
 Seasonal & Diurnal Temp Variations ATS351 Lecture 3 Earth-Sun Distance Change in distance has only a minimal effect on seasonal temperature. Note that during the N. hemisphere winter, we are CLOSER to
Sensitivity of AERSURFACE Results to Study Area and Location. Paper 2009-A-127-AWMA
 Sensitivity of AERSURFACE Results to Study Area and Location Paper 2009-A-127-AWMA Prepared by: Anthony J. Schroeder, CCM Senior Consultant George J. Schewe, CCM, QEP Principal Consultant Trinity Consultants
Implementation of the NCEP operational GLDAS for the CFS land initialization
 Implementation of the NCEP operational GLDAS for the CFS land initialization Jesse Meng, Mickael Ek, Rongqian Yang NOAA/NCEP/EMC July 2012 1 Improving the Global Land Surface Climatology via improved Global
Estimation of speciated and total mercury dry deposition at monitoring
 SUPPORTING INFORMATION Estimation of speciated and total mercury dry deposition at monitoring locations in eastern and central North America L. Zhang, P. Blanchard, D.A. Gay, E.M. Prestbo, M.R. Risch,
3 Temperate and Polar Zones
 CHAPTER 3 3 Temperate and Polar Zones SECTION Climate BEFORE YOU READ After you read this section, you should be able to answer these questions: What biomes are found in the temperate zone? What biomes
Chapter 7 Part III: Biomes
 Chapter 7 Part III: Biomes Biomes Biome: the major types of terrestrial ecosystems determined primarily by climate 2 main factors: Temperature and precipitation Depends on latitude or altitude; proximity
AERMOD Sensitivity to AERSURFACE Moisture Conditions and Temporal Resolution. Paper No Prepared By:
 AERMOD Sensitivity to AERSURFACE Moisture Conditions and Temporal Resolution Paper No. 33252 Prepared By: Anthony J Schroeder, CCM Managing Consultant TRINITY CONSULTANTS 7330 Woodland Drive Suite 225
MxVision WeatherSentry Web Services Content Guide
 MxVision WeatherSentry Web Services Content Guide July 2014 DTN 11400 Rupp Drive Minneapolis, MN 55337 00.1.952.890.0609 This document and the software it describes are copyrighted with all rights reserved.
DEVELOPMENT OF GPS PHOTOS DATABASE FOR LAND USE AND LAND COVER APPLICATIONS
 DEVELOPMENT OF GPS PHOTOS DATABASE FOR LAND USE AND LAND COVER APPLICATIONS An Ngoc VAN and Wataru TAKEUCHI Institute of Industrial Science University of Tokyo 4-6-1 Komaba, Meguro-ku, Tokyo 153-8505 Japan
CWRF Downscaling to Improve U.S. Seasonal- Interannual Climate Predic>on
 CWRF Downscaling to Improve U.S. Seasonal- Interannual Climate Predic>on Xin-Zhong Liang 1,2, Ligang Chen 2, Shenjian Su 2, Julian X.L. Wang 3 1 Department of Atmosphere & Ocean Science 2011 December 7
Where is the tropical zone? What are three biomes found in the tropical zone?
 Name CHAPTER 3 Class Date Climate 2 The Tropics SECTION BEFORE YOU READ After you read this section, you should be able to answer these questions: Where is the tropical zone? What are three biomes found
Supplement of Observation of isoprene hydroxynitrates in the southeastern United States and implications for the fate of NO x
 Supplement of Atmos. Chem. Phys., 15, 11257 11272, 2015 http://www.atmos-chem-phys.net/15/11257/2015/ doi:10.5194/acp-15-11257-2015-supplement Author(s) 2015. CC Attribution 3.0 License. Supplement of
The Next Generation of Chamber Control Software
 CARIBBEAN TROPICS KENYAN WETLANDS SAHARA DESERT NORWEGIAN TUNDRA The Next Generation of Chamber Control Software Helping researchers address climate changes CARIBBEAN TROPICS Revolutionary WeatherEze is
Unit 1. Sustaining Earth s Ecosystem
 Unit 1 Sustaining Earth s Ecosystem 1. Identify distinctive plants, animals, and climatic characteristics of Canadian biomes (tundra, boreal forest, temperate deciduous forest, temperate rainforest, grasslands)
CHEM 109A Organic Chemistry
 CHEM 109A Organic Chemistry https://labs.chem.ucsb.edu/zakarian/armen/courses.html Chapter 5 Alkene: Introduction Thermodynamics and Kinetics Midterm 2... Grades will be posted on Tuesday, Feb. 27 th.
ATMOSPHERIC CHEMISTRY OF SELECTED HYDROXYCARBONYLS. Sara M. Aschmann, Janet Arey and Roger Atkinson
 ATMOSPHERIC CHEMISTRY OF SELECTED HYDROXYCARBONYLS Sara M. Aschmann, Janet Arey and Roger Atkinson Air Pollution Research Center University of California Riverside, CA 92521, U.S.A. Introduction Volatile
Direct Normal Radiation from Global Radiation for Indian Stations
 RESEARCH ARTICLE OPEN ACCESS Direct Normal Radiation from Global Radiation for Indian Stations Jaideep Rohilla 1, Amit Kumar 2, Amit Tiwari 3 1(Department of Mechanical Engineering, Somany Institute of
Organic Compounds - Formation Fate and Impact on Troposphere
 Organic Compounds - Formation Fate and Impact on Troposphere i.gensch@fz-juelich.de 2 / 20 Organic Compounds - Formation Fate and Impact on Troposphere i.gensch@fz-juelich.de 2 / 20 Definitions VOC: organic
Earth Science Physical Setting Relationship Review Sketch all graphs in pencil For a uniform material. Density. Average Temperature
 except water Water For a uniform material Volume For a uniform material Volume (cm3) 0 4 10 Volume (cm3) ( C) 0 4 5 90 0 4 5 90 Distance Between Isolines Latitude ( N) Latitude ( N) Number of Isolines
EVALUATION OF ATMOSPHERIC PROCESSES FOR OZONE FORMATION FROM VEHICLE EMISSIONS
 EVALUATION OF ATMOSPHERIC PROCESSES FOR OZONE FORMATION FROM VEHICLE EMISSIONS by WILLIAM P. L. CARTER STATEWIDE AIR POLLUTION RESEARCH CENTER, and COLLEGE OF ENGINEERING CENTER FOR ENVIRONMENTAL RESEARCH
CURRENT STATUS OF THE DEVELOPMENT AND EVALUATION OF AN UPDATED DETAILED MECHANISM FOR VOC OXIDATION
 CURRENT STATUS OF THE DEVELOPMENT AND EVALUATION OF AN UPDATED DETAILED MECHANISM FOR VOC OXIDATION William P. L. Carter Statewide Air Pollution Research Center and College of Engineering, Center for Environmental
Worldwide Data Quality Effects on PBL Short-Range Regulatory Air Dispersion Models
 Worldwide Data Quality Effects on PBL Short-Range Regulatory Air Dispersion Models Jesse L. Thé 1, Russell Lee 2, Roger W. Brode 3 1 Lakes Environmental Software, -2 Philip St, Waterloo, ON, N2L 5J2, Canada
Earth Science Physical Setting Relationship Review Sketch all graphs in pencil. Density. Average Temperature. Gravitational Force.
 except water Water For a uniform material For a uniform material Volume (cm3) 0 4 10 Volume (cm3) ( C) Altitude of Polaris Average Gradient 0 4 5 90 0 4 5 90 Distance Between Isolines Latitude ( N) Latitude
Earth s Major Terrerstrial Biomes. *Wetlands (found all over Earth)
") Biomes Biome: the major types of terrestrial ecosystems determined primarily by climate 2 main factors: Depends on ; proximity to ocean; and air and ocean circulation patterns Similar traits of plants
Biomes Biome: the major types of terrestrial ecosystems determined primarily by climate 2 main factors: Depends on ; proximity to ocean; and air and ocean circulation patterns Similar traits of plants
UWM Field Station meteorological data
 University of Wisconsin Milwaukee UWM Digital Commons Field Station Bulletins UWM Field Station Spring 992 UWM Field Station meteorological data James W. Popp University of Wisconsin - Milwaukee Follow
VIC Hydrology Model Training Workshop Part II: Building a model
 VIC Hydrology Model Training Workshop Part II: Building a model 11-12 Oct 2011 Centro de Cambio Global Pontificia Universidad Católica de Chile Ed Maurer Civil Engineering Department Santa Clara University
Yan Chen, Sunny Sun-Mack, and Robert F. Arduini Science Application International Corporation, Hampton, VA USA 23666
 5.6 CLEAR-SKY AND SURFACE NARROWBAND ALBEDO VARIATIONS DERIVED FROM VIRS AND MODIS DATA Yan Chen, Sunny Sun-Mack, and Robert F. Arduini Science Application International Corporation, Hampton, VA USA 23666
ENHANCING THE GEOGRAPHICAL AND TIME RESOLUTION OF NASA SSE TIME SERIES USING MICROSTRUCTURE PATTERNING
 ENHANCING THE GEOGRAPHICAL AND TIME RESOLUTION OF NASA TIME SERIES USING MICROSTRUCTURE PATTERNING Richard Perez and Marek Kmiecik, Atmospheric Sciences Research Center 251 Fuller Rd Albany, NY, 1223 Perez@asrc.cestm.albany,edu
GLAS Atmospheric Products User Guide November, 2008
 GLAS Atmospheric Products User Guide November, 2008 Overview The GLAS atmospheric measurements utilize a dual wavelength (532 nm and 1064 nm) transmitting laser to obtain backscattering information on
SUPPORTING INFORMATION
 SUPPORTING INFORMATION An MCM modeling study of nitryl chloride (ClNO 2 ) impacts on oxidation, ozone production and nitrogen oxide partitioning in polluted continental outflow Theran P. Riedel 1,2, Glenn
Where is the tropical zone? What are three biomes found in the tropical zone?
 Name CHAPTER 17 Class Date SECTION 2 The Tropics BEFORE YOU READ After you read this section, you should be able to answer these questions: Where is the tropical zone? What are three biomes found in the
GLAS Atmospheric HDF5 Products User Guide July, 2012
 GLAS Atmospheric HDF5 Products User Guide July, 2012 General The final GLAS data products (rel33) exist in two formats; the original binary format and HDF5 (Hierarchical Data Format). The HDF5 products
Global Patterns Gaston, K.J Nature 405. Benefit Diversity. Threats to Biodiversity
 Biodiversity Definitions the variability among living organisms from all sources, including, 'inter alia', terrestrial, marine, and other aquatic ecosystems, and the ecological complexes of which they
World Geography 3202 Practice Multiple Choice Unit 3 Ecosystems. Outcomes:
 Outcomes: SCO 3.1: The student will be expected to demonstrate an understanding that an ecosystem consists of a complex network of organisms, including the following delineations: 3.1.1 Define the term
SAFNWC/MSG SEVIRI CLOUD PRODUCTS
 SAFNWC/MSG SEVIRI CLOUD PRODUCTS M. Derrien and H. Le Gléau Météo-France / DP / Centre de Météorologie Spatiale BP 147 22302 Lannion. France ABSTRACT Within the SAF in support to Nowcasting and Very Short
2005 UPDATES TO THE CARBON BOND MECHANISM: CB05
 2005 UPDATES TO THE CARBON BOND MECHANISM: CB05 Gary Z. Whitten, Smog Reyes Greg Yarwood, ENVIRON smogreyes@yahoo.com International Conference on Chemical Mechanisms December 6, 2006 Ackowledgements EPA:
Earth is tilted (oblique) on its Axis!
 on its Axis!") MONDAY AM Radiation, Atmospheric Greenhouse Effect Earth's orbit around the Sun is slightly elliptical (not circular) Seasons & Days Why do we have seasons? Why aren't seasonal temperatures highest at
MONDAY AM Radiation, Atmospheric Greenhouse Effect Earth's orbit around the Sun is slightly elliptical (not circular) Seasons & Days Why do we have seasons? Why aren't seasonal temperatures highest at
Diesel soot aging in urban plumes within hours under cold dark and humid conditions
 Supporting information for Diesel soot aging in urban plumes within hours under cold dark and humid conditions A. C. Eriksson 1,2*, C. Wittbom 1, P. Roldin 1,3, M. Sporre 4, E. Öström 1,5, P. Nilsson 2,
Climate Change and Arizona s Rangelands: Management Challenges and Opportunities
 Climate Change and Arizona s Rangelands: Management Challenges and Opportunities Mike Crimmins Climate Science Extension Specialist Dept. of Soil, Water, & Env. Science & Arizona Cooperative Extension
AVHRR Polar Winds Derivation at EUMETSAT: Current Status and Future Developments
 AVHRR Polar Winds Derivation at EUMETSAT: Current Status and Future Developments Gregory Dew and Régis Borde With assistance from: Marie Doutriaux-Boucher, Manuel Carranza Contents 1. Background 2. Status
WATER AND ENERGY BALANCE ESTIMATION IN PUERTO RICO USING SATELLITE REMOTE SENSING
 WATER AND ENERGY BALANCE ESTIMATION IN PUERTO RICO USING SATELLITE REMOTE SENSING Eric. W. Harmsen, Ariel Mercado Vargas, Pedro Tosado Cruz, Jonellys M Maldonado Morales and Angel O. Ortiz Lozada OCTAVA
11/2/18. SIO15-18: Lecture15: The Atmosphere and Climate. SIO15-18: Lecture15: The Atmosphere and Climate. source: wikipedia
 source: wikipedia 1 2 climate: average long-term condition; controlled by location regional to global weather: short-term condition; controlled by atmospheric anomalies local to regional climate: I live
forest tropical jungle swamp marsh prairie savanna pampas Different Ecosystems (rainforest)
") Different Ecosystems forest A region of land that is covered with many trees and shrubs. tropical jungle (rainforest) swamp A region with dense trees and a variety of plant life. It has a tropical climate.
Different Ecosystems forest A region of land that is covered with many trees and shrubs. tropical jungle (rainforest) swamp A region with dense trees and a variety of plant life. It has a tropical climate.
Assessing Atmospheric Releases of Hazardous Materials
 Assessing Atmospheric Releases of Hazardous Materials Nathan Platt and Jeffry Urban The Problem Atmospheric transport and dispersion (AT&D) models play an important role in the Department of Defense because
O 3 + UV photon (λ < 320 nm) O 2 * + O* O 3 + O 2O 2
 O 2 * + O* O 3 + O 2O 2") Tro Chpt 13 Chemical Kinetics Rate of a chemical reaction Effect of concentration on reaction rate Integrated rate laws: How concentrations change with time Effect of temperature on rate Reaction mechanisms
Tro Chpt 13 Chemical Kinetics Rate of a chemical reaction Effect of concentration on reaction rate Integrated rate laws: How concentrations change with time Effect of temperature on rate Reaction mechanisms
Patrick Leinenkugel. German Aerospace Center (DLR) Vortrag > Autor > Dokumentname > Datum
 Vortrag > Autor > Dokumentname > Datum") Characterisation of land surface phenology and land cover for the Mekong Basin on the basis of multitemporal and multispectral satellite data from the MODIS Sensor Patrick Leinenkugel German Aerospace
Characterisation of land surface phenology and land cover for the Mekong Basin on the basis of multitemporal and multispectral satellite data from the MODIS Sensor Patrick Leinenkugel German Aerospace
16 Global Climate. Learning Goals. Summary. After studying this chapter, students should be able to:
 16 Global Climate Learning Goals After studying this chapter, students should be able to: 1. associate the world s six major vegetation biomes to climate (pp. 406 408); 2. describe methods for classifying
AIRS and IASI Precipitable Water Vapor (PWV) Absolute Accuracy at Tropical, Mid-Latitude, and Arctic Ground-Truth Sites
 Absolute Accuracy at Tropical, Mid-Latitude, and Arctic Ground-Truth Sites") AIRS and IASI Precipitable Water Vapor (PWV) Absolute Accuracy at Tropical, Mid-Latitude, and Arctic Ground-Truth Sites Robert Knuteson, Sarah Bedka, Jacola Roman, Dave Tobin, Dave Turner, Hank Revercomb
AIRS and IASI Precipitable Water Vapor (PWV) Absolute Accuracy at Tropical, Mid-Latitude, and Arctic Ground-Truth Sites Robert Knuteson, Sarah Bedka, Jacola Roman, Dave Tobin, Dave Turner, Hank Revercomb
Chapter 13 - Chemical Kinetics II. Integrated Rate Laws Reaction Rates and Temperature
 Chapter 13 - Chemical Kinetics II Integrated Rate Laws Reaction Rates and Temperature Reaction Order - Graphical Picture A ->Products Integrated Rate Laws Zero Order Reactions Rate = k[a] 0 = k (constant
Agricultural Science Climatology Semester 2, Anne Green / Richard Thompson
 Agricultural Science Climatology Semester 2, 2006 Anne Green / Richard Thompson http://www.physics.usyd.edu.au/ag/agschome.htm Course Coordinator: Mike Wheatland Course Goals Evaluate & interpret information,
Changes in Seasonal Albedo with Land Cover Class
 Name: Date: Changes in Seasonal Albedo with Land Cover Class Guiding question: How does albedo change over the seasons in different land cover classes? Introduction. Now that you have completed the Introduction
METR 130: Lecture 2 - Surface Energy Balance - Surface Moisture Balance. Spring Semester 2011 February 8, 10 & 14, 2011
 METR 130: Lecture 2 - Surface Energy Balance - Surface Moisture Balance Spring Semester 2011 February 8, 10 & 14, 2011 Reading Arya, Chapters 2 through 4 Surface Energy Fluxes (Ch2) Radiative Fluxes (Ch3)
A new perspective on aerosol direct radiative effects in South Atlantic and Southern Africa
 A new perspective on aerosol direct radiative effects in South Atlantic and Southern Africa Ian Chang and Sundar A. Christopher Department of Atmospheric Science University of Alabama in Huntsville, U.S.A.
2016 Meteorology Summary
 2016 Meteorology Summary New Jersey Department of Environmental Protection AIR POLLUTION AND METEOROLOGY Meteorology plays an important role in the distribution of pollution throughout the troposphere,
Creating Meteorology for CMAQ
 Creating Meteorology for CMAQ Tanya L. Otte* Atmospheric Sciences Modeling Division NOAA Air Resources Laboratory Research Triangle Park, NC * On assignment to the National Exposure Research Laboratory,
ATMS 321 Problem Set 1 30 March 2012 due Friday 6 April. 1. Using the radii of Earth and Sun, calculate the ratio of Sun s volume to Earth s volume.
 ATMS 321 Problem Set 1 30 March 2012 due Friday 6 April 1. Using the radii of Earth and Sun, calculate the ratio of Sun s volume to Earth s volume. 2. The Earth-Sun distance varies from its mean by ±1.75%
A) usually less B) dark colored and rough D) light colored with a smooth surface A) transparency of the atmosphere D) rough, black surface
 usually less B) dark colored and rough D) light colored with a smooth surface A) transparency of the atmosphere D) rough, black surface") 1. Base your answer to the following question on the diagram below which shows two identical houses, A and B, in a city in North Carolina. One house was built on the east side of a factory, and the other
1. Base your answer to the following question on the diagram below which shows two identical houses, A and B, in a city in North Carolina. One house was built on the east side of a factory, and the other
13 SHADOW FLICKER Introduction Methodology
 Table of contents 13 SHADOW FLICKER... 13-1 13.1 Introduction... 13-1 13.2 Methodology... 13-1 13.2.1 Factors Influencing Shadow Flicker Occurrence... 13-2 13.2.2 Shadow Flicker Analysis Methodology...
Research Article Projection of the Spatially Explicit Land Use/Cover Changes in China,
 Advances in Meteorology Volume 2013, Article ID 908307, 9 pages http://dx.doi.org/10.1155/2013/908307 Research Article Projection of the Spatially Explicit Land Use/Cover Changes in China, 2010 2100 Yongwei
PHOTOSYNTHESIS. Joseph Priestly 1772 experiment. SFSU Geography 316 Fall 2006 Dr. Barbara A. Holzman
 Nutrient Cycling I. A.Photosynthesis B. Respiration C. Production Primary productivity Gross Production Net Production II. Types of photosynthesis A. C3, B. C4, C. CAM D. Comparisons III. General Carbon
Soil Moisture Prediction and Assimilation
 Soil Moisture Prediction and Assimilation Analysis and Prediction in Agricultural Landscapes Saskatoon, June 19-20, 2007 STEPHANE BELAIR Meteorological Research Division Prediction and Assimilation Atmospheric
AREP GAW. AQ Forecasting
 AQ Forecasting What Are We Forecasting Averaging Time (3 of 3) PM10 Daily Maximum Values, 2001 Santiago, Chile (MACAM stations) 300 Level 2 Pre-Emergency Level 1 Alert 200 Air Quality Standard 150 100
Appendix C. AMEC Evaluation of Zuni PPIW. Appendix C. Page C-1 of 34
 AMEC s Independent Estimate of PPIW Crop Water Use Using the ASCE Standardized Reference Evapotranspiration via Gridded Meteorological Data, and Estimation of Crop Coefficients, and Net Annual Diversions
Jackson County 2014 Weather Data
 Jackson County 2014 Weather Data 62 Years of Weather Data Recorded at the UF/IFAS Marianna North Florida Research and Education Center Doug Mayo Jackson County Extension Director 1952-2008 Rainfall Data
Jackson County 2018 Weather Data 67 Years of Weather Data Recorded at the UF/IFAS Marianna North Florida Research and Education Center
 Jackson County 2018 Weather Data 67 Years of Weather Data Recorded at the UF/IFAS Marianna North Florida Research and Education Center Doug Mayo Jackson County Extension Director 1952-2008 Rainfall Data
Chemistry 2.5 AS WORKBOOK. Working to Excellence Working to Excellence
 Chemistry 2.5 AS 91165 Demonstrate understanding of the properties of selected organic compounds WORKBOOK Working to Excellence Working to Excellence CONTENTS 1. Writing Excellence answers to Cis-Trans
An Internet-based Agricultural Land Use Trends Visualization System (AgLuT)
") An Internet-based Agricultural Land Use Trends Visualization System (AgLuT) Second half yearly report 01-01-2001-06-30-2001 Prepared for Missouri Department of Natural Resources Missouri Department of
An Internet-based Agricultural Land Use Trends Visualization System (AgLuT) Second half yearly report 01-01-2001-06-30-2001 Prepared for Missouri Department of Natural Resources Missouri Department of
4 Changes in Climate. TAKE A LOOK 2. Explain Why is more land exposed during glacial periods than at other times?
 Name Class CHAPTER 3 Date Climate 4 Changes in Climate SECTION National Science Education Standards BEFORE YOU READ After you read this section, you should be able to answer these questions: ES 1k, 2a
EAS 535 Laboratory Exercise Solar Radiation
 EAS 535 Laboratory Exercise Solar Radiation Lab Objectives: Estimate the atmospheric optical depth and solar constant from a set of measurements of the total and diffuse solar radiation at the surface.
Supplement for Understanding primary and secondary sources of. ambient carbonyl compounds in Beijing using the PMF model
 1 2 3 4 5 6 7 8 9 Supplement for Understanding primary and secondary sources of ambient carbonyl compounds in Beijing using the PMF model W. T. Chen 1, M. Shao 1, S. H. Lu 1, M. Wang 1, L. M. Zeng 1, B.
Jackson County 2013 Weather Data
 Jackson County 2013 Weather Data 61 Years of Weather Data Recorded at the UF/IFAS Marianna North Florida Research and Education Center Doug Mayo Jackson County Extension Director 1952-2008 Rainfall Data
Assessing the Impact of Using Different Land Cover Classification in Regional Modeling Studies for the Manaus Area, Brazil
 Journal of Geoscience and Environment Protection, 2015, *, ** Published Online **** 2015 in SciRes. http://www.scirp.org/journal/gep http://dx.doi.org/10.4236/gep.2015.***** Assessing the Impact of Using
Global Climates. Name Date
 Global Climates Name Date No investigation of the atmosphere is complete without examining the global distribution of the major atmospheric elements and the impact that humans have on weather and climate.
The UCR Environmental Chamber Database for Mechanism Evaluation
 Outline The UCR Environmental Chamber Database for Mechanism Evaluation William P. L. Carter CE-CERT, University of California, Riverside December 7, 26 Database used in SAPRC-99 evaluation and Current
PERCH Air Quality Study. Quarterly Report. February 7, 2004
 PERCH Air Quality Study Quarterly Report February 7, 2004 Submitted to: Professor Ranga Rao Center for Environmental Diagnostics and Bioremediation University of West Florida 11000 University Parkway Pensacola,
Weather and Climate of the Rogue Valley By Gregory V. Jones, Ph.D., Southern Oregon University
 Weather and Climate of the Rogue Valley By Gregory V. Jones, Ph.D., Southern Oregon University The Rogue Valley region is one of many intermountain valley areas along the west coast of the United States.
Multiple Choice Identify the choice that best completes the statement or answers the question.
 CH.15 practice TEST Multiple Choice Identify the choice that best completes the statement or answers the question. 1) The short-term state of the atmosphere is called a) climate. c) water cycle. b) weather.
Energy Balance and Temperature. Ch. 3: Energy Balance. Ch. 3: Temperature. Controls of Temperature
 Energy Balance and Temperature 1 Ch. 3: Energy Balance Propagation of Radiation Transmission, Absorption, Reflection, Scattering Incoming Sunlight Outgoing Terrestrial Radiation and Energy Balance Net
Energy Balance and Temperature
 Energy Balance and Temperature 1 Ch. 3: Energy Balance Propagation of Radiation Transmission, Absorption, Reflection, Scattering Incoming Sunlight Outgoing Terrestrial Radiation and Energy Balance Net
7. The weather instrument below can be used to determine relative humidity.
 1. What is the dewpoint temperature when the dry-bulb temperature is 12 C and the wet-bulb temperature is 7 C? A) 1 C B) -2 C C) -5 C D) 4 C 2. A parcel of air has a dry-bulb temperature reading of 16
Remote Sensing Applications for Land/Atmosphere: Earth Radiation Balance
 Remote Sensing Applications for Land/Atmosphere: Earth Radiation Balance - Introduction - Deriving surface energy balance fluxes from net radiation measurements - Estimation of surface net radiation from
Application of the UW/CIMSS high spectral resolution global IR land surface emissivity database into the RTTOV model
 Application of the UW/CIMSS high spectral resolution global IR land surface emissivity database into the RTTOV model Eva Borbas 1, Ben Ruston 2, Roger Saunders 3, Andrew Collard 3, Robert Knuteson 1, James
Lecture 7. Science A-30 February 21, 2008 Air may be forced to move up or down in the atmosphere by mechanical forces (wind blowing over an obstacle,
 Lecture 7. Science A-30 February 21, 2008 Air may be forced to move up or down in the atmosphere by mechanical forces (wind blowing over an obstacle, like a mountain) or by buoyancy forces. Air that is
Planned Burn (PB)-Piedmont online version user guide. Climate, Ecosystem and Fire Applications (CEFA) Desert Research Institute (DRI) June 2017
-Piedmont online version user guide. Climate, Ecosystem and Fire Applications (CEFA) Desert Research Institute (DRI) June 2017") Planned Burn (PB)-Piedmont online version user guide Climate, Ecosystem and Fire Applications (CEFA) Desert Research Institute (DRI) June 2017 The Planned Burn (PB)-Piedmont model (Achtemeier 2005) is
Planned Burn (PB)-Piedmont online version user guide Climate, Ecosystem and Fire Applications (CEFA) Desert Research Institute (DRI) June 2017 The Planned Burn (PB)-Piedmont model (Achtemeier 2005) is
Appendix 1. Supplementary information on methodology and chorus projections Location matters: evaluating Greater Prairie-Chicken (Tympanuchus cupido)
") Appendix 1. Supplementary information on methodology and chorus projections Location matters: evaluating Greater Prairie-Chicken (Tympanuchus cupido) boom chorus propagation Supplemental Methods Study
Appendix 1. Supplementary information on methodology and chorus projections Location matters: evaluating Greater Prairie-Chicken (Tympanuchus cupido) boom chorus propagation Supplemental Methods Study
Introduction to Climate ~ Part I ~
 2015/11/16 TCC Seminar JMA Introduction to Climate ~ Part I ~ Shuhei MAEDA (MRI/JMA) Climate Research Department Meteorological Research Institute (MRI/JMA) 1 Outline of the lecture 1. Climate System (