BIOINF 4120 Bioinforma2cs 2 - Structures and Systems -
|
|
|
- Janice Harris
- 5 years ago
- Views:
Transcription
1 BIOINF 4120 Bioinforma2cs 2 - Structures and Systems - Oliver Kohlbacher Summer Quan0ta0ve Proteomics Overview LC- MS- based proteomics - defini0on of maps and features Quan0fica0on approaches Labeled quan0fica0on Label- free quan0fica0on Algorithmic problems Feature finding Map alignment Examples 2 LC- MS- Based Proteomics Quan0ta0ve proteomics tries to measure the expression level of all proteins (as many as possible) in a sample Problems Sensi0vity of MS makes detec0on of low- abundance proteins difficult MS signal intensity is propor0onal to pep0de concentra0on, but factor varies from pep0de to pep0de! No absolute quan0fica0on from the signal alone Complexity of sample makes separa0on difficult Datasets tend to get huge (up to hundreds of GB per sample), so data analysis is difficult 3 1


2 Shotgun Proteomics Proteins digestion A L E L F R H P N D M A A K G A S E D I P V K D L K F G G H P E T L E S E D E M K H K A K D K V E L F A K H L K K S A Y K L Q D V A G M H M K G W I L Q G G Q E E G V G V G A E L G F Q G V L N G Q I K M R G L L I M S L S W V I D G E Q L F D K F K A K L T A E V G H H E A E L T P L A Q S H A T K S T H N G I Y L E F Peptidedigest Separation Key ideas Separa0on of whole proteins possible but difficult, hence diges0on preferred Usually: trypsin cuts axer K and R and ensures pep0des suitable for MS (posi0ve charge at the end) Separate pep0des; this is easy Iden0fy proteins through pep0des K Y K F K H K H L K F D K L F K I P V K A L E L F R S E D E M K N D M A A K A S E D L K E L G F Q G G H P E T L E H P G D F G A D A Q G A M S K V E A D V A G H G Q E V L K Y L E F I S E A I I Q V L Q S K G H H E A E L T P A Q S H A T K M G L S D G E W Q L V L N V W G K I R 4 HPLC- MS Analysis I HPLC ESI TOF Spectrum (scan) RT Separation 1 Different peptides have different retention time Ionization Peptide receives z charge units Separation 2 Detector measures 5 Orbitrap analyzer Introduc0on Intensity mass / charge 6 2

 8")

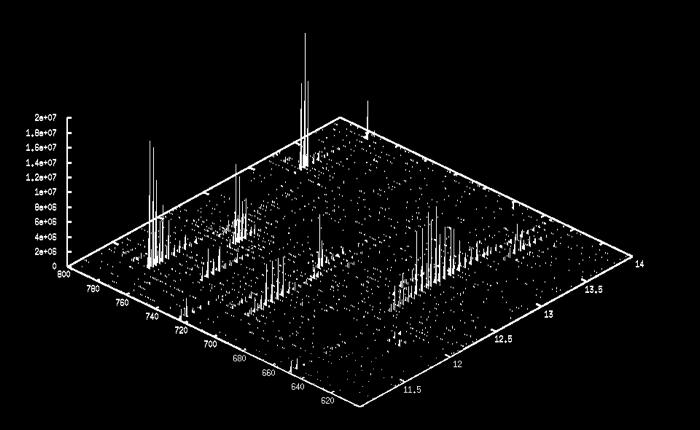
3 LC- MS Data (Map) 7 LC- MS Data (Map) 8 LC- MS Data (Map) 9 3

 11")


4 LC- MS Data (Map) 10 LC- MS Data (Map) 11 LC- MS Data (Map) 12 4

 14")


5 LC- MS Data (Map) 13 LC- MS Data (Map) 14 LC- MS Data (Map) 15 5
")


6 LC- MS Data (Map) 16 LC- MS Data (Map) 17 LC- MS Data (Map) 18 6
 19")


7 LC- MS Data (Map) Identification (EVAAFAQFGSDLDASTK) Quantification (15 nmol/µl, 3x overexpressed, ) 19 Quan2fica2on Key problem Detector signal is propor0onal to pep0de concentra0on Constant factor varies from pep0de to pep0de! Hence, no correla0on between absolute signal intensity and absolute concentra0on Reason Different ioniza0on/flight behavior of different pep0des Consequences Rela0ve quan0fica0on possible between two samples Absolute quan0fica0on requires external standard for calibra0on 20 Differen2al Analysis Two basic approaches: Labeling (e.g., SILAC, itraq, ) Label-Free Quantification (LFQ) State 1 Proteins w/ heavy label Mix Fractionate Digest Isolate Healthy State 2 Proteins w/ light label diseased Nat. Biotechnol. 17: ,


, 6:230 23 Isobaric Labeling http://en.wikipedia.")
8 SILAC SILAC Stable Isotope Labeling with Amino Acids in Cell Culture Introduce stable labels by feeding labeled amino acids to the cell culture Labels will be integrated into all proteins axer a reasonable amount of 0me Mix and compare with an unlabeled sample Tryp0c digest ensures that each pep0de contains (with some excep0ons) exactly one K/R! Pep0des with heavy and light label are otherwise iden0cal and coelute Spectra contain isotope paherns for both heavy and light pep0des light heavy SILAC pair with charge 2 and approximately a 1:1 ratio (unpeurbed) 22 SILAC Stable Isotope Labeling with Amino Acids in Cell Culture 3 Mumby, Brekken, Genome Biol (2005), 6: Isobaric Labeling [accessed , 19:48 CET] 24 8
9 Isobaric Labeling Idea Label the different samples with labels of the same mass (isobaric) Design the label in a way that they fragment differently upon collision- induced dissocia0on MS 2 spectra will then contain repoer ions Quan0fica0on and iden0fica0on are then both based on tandem spectra only Key method: itraq isobaric tags for rela2ve and absolute quan2fica2on Based on covalent modifica0on of N- terminus of pep0des Labeling performed axer diges0on (also applicable to clinical samples) Kits available for 4 or 8 dis0nct labels ( quadruplex, octoplex ) 25 itraq Ross et al., Mol Cell Prot (2004), 3, itraq Ross et al., Mol Cell Prot (2004), 3,
 Label-Free Quantification (LFQ) Map 1 ( healthy ) Map 2 ( diseased )?")


 Isotope pattern Elution profile Feature Finding Problem: Identify all peaks")
10 Differen2al Analysis Two basic approaches: Labeling (e.g., SILAC, itraq) Label-Free Quantification (LFQ) Map 1 ( healthy ) Map 2 ( diseased )? 28 Label- Free Quan2fica2on (LFQ) Label- free quan0fica0on is probably the most natural way of quan0fying No labeling required, removing fuher sources of error, no restric0on on sample genera0on, cheap Data on different samples acquired in different measurements higher reproducibility needed Manual analysis difficult Scales very well with the number of samples, basically no limit, no difference in the analysis between 2 or 100 samples 29 Data Reduc2on Peptide (feature) Isotope pattern Elution profile Feature Finding Problem: Identify all peaks belonging to one peptide and sum up their intensities 30 10

11 Data Reduc2on Features Aggregation of peaks to features achieves up to 1,000-fold reduction of data volume reduction to a meaningful quantity: ion count of one peptide 31 LFQ Analysis Strategy 1. Find features in all maps 32 LFQ Analysis Strategy 1. Find features in all maps 2. Align maps 33 11
12 LFQ Analysis Strategy 1. Find features in all maps 2. Align maps 3. Link corresponding features 34 LFQ Analysis Strategy 1. Find features in all maps 2. Align maps 3. Link corresponding features 4. Iden2fy features GDAFFGMSCK 35 LFQ Analysis Strategy 1. Find features in all maps 2. Align maps 3. Link corresponding features 4. Iden2fy features 5. Quan2fy GDAFFGMSCK 1.0 : 1.2 :

13 Proteomics Data Flow Sample HPLC/MS Raw Data 10 GB Sig.- Proc. 50 MB Maps Diff. Anal. Annot. Maps Data Reduction Filtered Raw Data 1 GB Differentially 50 MB Identification Expressed 1 kb Proteins 37 Quan2fying Analytes Analytes have to be in solu0on for proteomics and metabolomics We thus deal with concentra0ons: amounts per volume of sample V Molar concentra0on c i = n i / V [SI unit: mol/m 3 ] Mass concentra0on ρ i = m i / V [SI unit: kg/m 3 ] Transla0ng molar concentra0ons into mass concentra0ons can be done via the molecular weight M i of the analyte ρ i = c i M i Precision and Accuracy Reference value Probability density Accuracy good accuracy, poor precision good precision, poor accuracy Precision Accuracy: closeness to the true value (mostly influenced by systema0c error) repe00on of the experiment will not improve the result Precision: repeatability of the measurement (mostly influenced by random error) repe00on of the experiment will yield more a value closer to the true value An ideal experiment combines high accuracy with high precision Value 13
14 Measurement Errors Reference value Probability density Accuracy Precision Value Each measurement is associated with an error There are two basic types of error: Random error: defines the variance of repeated measurements (e.g., due to high noise level) this is always present in every measurement Systema2c error (bias): shixs the mean of repeated experiments (e.g., due to an incorrect calibra0on) Calibra2on Curve detector response concentration Measurement of the detector response for various (known) concentra0ons allows the construc0on of a calibra0on curve Most detector responses are chosen in a way that the response changes linearly with the concentra0on Once the calibra0on curve has been measured, it allows the determina0on of the concentra0on of an unknown sample Response saturation detector response slope = sensitivity LOD LOQ linear range LOL noise concentration LOD: level of detec0on at what concentra0on can we decide that the analyte is present LOQ: level of quan0fica0on at what concentra0on can we accurately quan0fy it LOL: limit of linearity satura0on effects sta here Linear range (dynamic range): the concentra0on range where we get a response that is linear in the concentra0on 14
15 Feature Finding Feature finding is a key data reduc0on step enabling complex analysis It is a key step for LC- MS data, both for proteomics and metabolomics Feature finding boils down huge maps to hundreds or thousands of features Various algorithms have been proposed for feature finding We will discuss the algorithm proposed by Gröpl et al. (2005), which uses a two- dimensional model fit The model is based on the shape of an ideal feature as defined by the separa0on process Gröpl, C, Lange, E, Reine, K, Kohlbacher, O, Sturm, M, Huber, C, Mayr, B, and Klein, C (2005). CompLife 2005, Springer LNBI 3695, p Feature Finding Iden0fy all peaks belonging to one pep0de Key idea: iden0fy suspicious regions Fit a model to that region and see what peaks are explained by it 44 Feature A[ributes Attributes Position (, RT) Intensity, volume Quality 45 15
16 Features Models Feature model = Isotope pattern x Elution profile 46 Feature Models Physical processes leading to the shape of a feature: Chromatography Elu0on profiles are (ideally) shaped like a Gaussian Parameters: width, height, posi0on Mass spectrometry Mass spectra of pep0des are characterized by the isotope pahern Modeled by a binomial distribu0on A two- dimensional feature is then described by the product of these func0ons 47 Isotope Pa[erns Molecule with one carbon atom Two possibili0es: light variant, 12 C Heavy variant 13 C 98.9% of all molecules will be light 1.1% will be heavy 12 C 98.90% 13 C 1.10% 14 N 99.63% 15 N 0.37% 16 O 99.76% 17 O 0.04% 18 O 0.20% 1 H 99.98% 2 H 0.02% 48 16
17 Isotope Pa[erns Molecule with 10 carbon atoms Lightest variant contains only 12 C This is called monoisotopic Others contain C atoms, these are heavier by 1-10 Da than the monoisotopic one In general, the rela0ve intensi0es follow a binomial distribu0on For higher masses (i.e., a larger number of atoms), the monoisotopic peak will be no longer the most likely variant 49 Averagine Since the isotope pahern changes with the composi0on of the pep0de, it is unknown which pahern should be fihed! Idea We know the mass of the feature Assume an average composi0on of an amino acid Then we can es0mate the composi0on The elemental composi0on of such an average amino acid, also called averagine, can be derived sta0s0cally: C 4.94 H 7.76 N 1.36 O 1.48 S Isotope Pa[erns Based on averagine compositions one can compute the isotope patterns for any given Heavier peptides have smaller monoisotopic peaks In the limit, the distribution approaches a normal distribution m [Da] P (k=0) P (k=1) P (k=2) P (k=3) P (k=4)
18 Feature Model Isotope pahern is also modulated by the instrument resolu0on We can assume a Gaussian shape for each of the peaks of the isotope pahern 52 Feature Model RT Elu0on profile is typically assumed to be Gaussian There are some variants that also allow for asymmetric peaks This defines the RT dimension of a feature 53 Feature Finding Algorithm Algorithm consists of four phases 1. Seeding. Choose peaks of high intensi6es, as those are usually in features ( seeds ). 2. Extension. Conserva6vely add peaks around the seed, never mind if you pick up a few peaks too many. 3. Modeling. Es6mate parameters of a two- dimensional feature for the region. 4. Refinement. Op6mally fit a model to the collected peaks. Remove peaks not agreeing with the model. Iterate un6l convergence

19 Algorithm: Seeding Sta with the highest peaks in the map Pick only one seed per feature, thus exclude peaks of already iden0fied features for later seeding More advanced variants of the algorithm use Wavelet techniques to detect the best seeds Problems Low- intensity features have intensi0es barely above the surrounding noise Choose a threshold based on the average noise Dilemma: threshold too high, features will not get seeded Threshold too low, millions of noise peaks will be considered as seeds ) HUGE run 0mes 55 Feature Finding Overview Sturm, OpenMS A Framework for Computational Mass Spectrometry, Disseation, Tübingen, Algorithm: Extension Explore the peaks around the seed Add them to a set of relevant peaks Abo if the peaks are getng too small or too far away up down up down 57 19
20 Algorithm: Refinement Remove peaks that are not consistent with the model Determine op2mal model for the reduced set of peaks Iterate this un0l no fuher improvement can be achieved Remove all peaks of this feature from poten0al seeds 58 Feature Finding Iden0fy all peaks belonging to one pep0de Key idea: iden0fy suspicious regions Fit a model to that region and iden0fy peaks explained by it 59 Feature Finding Extension: collect all data points close to the seed Refinement: remove peaks that are not consistent with the model Fit an op2mal model for the reduced set of peaks Iterate this un0l no fuher improvement can be achieved 60 20
21 Collec2ng Mass Traces A mass trace is a series of peaks along the RT dimension with lihle varia0on in the dimension Mass traces are found with a simple heuris0c abor0ng the search if the peak intensity hits the local noise level Search for mass traces in the correct distance Limit length of mass trace to the length of the most intense mass trace Sturm, OpenMS A Framework for Computational Mass Spectrometry, Disseation, Tübingen, Feature Deconvolu2on Sturm, OpenMS A Framework for Computational Mass Spectrometry, Disseation, Tübingen, Feature Deconvolu2on Features can overlap in various ways Mass traces can contain more than one chromatographic peak (features not baseline- separated in RT dimension) Mass traces can be interleaved between features in the m/ z dimension Co- elu0ng features can be sharing mass traces Resolving these conflicts is done in a feature deconvolu0on step by sta0s0cal tes0ng: Test several hypotheses that could explain the features The most likely of all hypotheses will be iden0fied through comparison with the data 63 21

22 Algorithm: Modeling Test all possible models for different charges states (charge +2, charge +3, ) Decide on the charge of the features based on the best fit for these models Algorithm: Modeling/Refinement Es0mate quality of fit for model m and data d i at posi0ons r i : Maximum Likelihood Es0mator determines good star2ng values for model parameters Fuher op2miza2on of model parameters in refinement phase (least- squares fit) 65 Feature Assembly Feature resolu0on is not always possible unambiguously 66 22

23 S2ll Difficult: Low- Intensity Features Problem: The algorithm picked up the blue feature, The red one was not found as it was too close to the noise peaks (green) 67 Map Alignment Goal: Correct retention time offset and distoions in label-free experiments. 68 Mul2ple Feature Map Alignment Given k feature maps Map 1 Map2 RT and of a peptide may vary between maps compute suitable mapping Map k 69 23
24 Mul2ple Feature Map Alignment Dewarp k maps onto a comparable coordinate system Map 1 T 1 Map2 T 2 Map k T k 70 Mul2ple Feature Map Alignment Dewarp k maps onto a comparable coordinate system Assign corresponding elements across k maps Map 1 Map 2 T 1 Map k T 2 Consensus map T k 71 Map Alignment Algorithm The algorithms proposed by Lange et al. tries to find an op0mal alignment of two maps through pose clustering It assumes an affine transforma0on between two maps (suitable, unless the chromatographic separa0on has very poor reproducibility) The algorithm consists of two phases Superposi2on phase transform all maps onto the coordinate system of a reference map Consensus phase successive grouping of corresponding elements group elements in the transformed maps, which are nearest neighbors in a weighted Euclidean metric 72 24
25 Superposi2on Phase S M T = As t +b The problem is to find the affine transformation T that minimizes the distance between T(S) and M. 73 Superposi2on Phase S M T = As t +b T(S) and M 74 Pose Clustering S M T (s ) = a s + b T (s ) = a s + b 75 25
26 Pose Clustering S M s 1 s 2 m 1 m 2 m 1 = a s 1 +b b m 2 = a s 2 +b a 76 Pose Clustering S M s1 m 1 s 2 m 2 m 1 = a s 1 +b b m 2 = a s 2 +b a 77 Pose Clustering S M s 1 m 1 s 2 m 2 m 1 = a s 1 +b b m 2 = a s 2 +b a 78 26
27 Pose Clustering S M s 1 m 1 s 2 m 2 m 1 = a s 1 +b b m 2 = a s 2 +b a 79 Pose Clustering S M s 1 m 1 s 2 m 2 a b Matching of corresponding pairs will result in the correct transformation These are more likely than random matches! 80 Speeding Things Up S M s 1 s 2 Only consider pairs (s 1,s 2 ) in S with s 1 having a small distance to s 2 in
28 Speeding Things Up S M s 1 m 1 s 2 m 2 Only match pair (s 1,s 2 ) onto pair (m 1,m 2 ) if s 1 and m 1 as well as s 2 and m 2 lie close together in. 82 Improve Matching S M s 1 m 1 s 2 m 2 Normalize intensities in M and S: weigh the vote of each transformation by the intensity similarities of the point matches (s 1,m 1 ) and (s 2,m 2 ). 83 Summary Quan0ta0ve shotgun proteomics produces large and complex datasets Manual analysis of these datasets is oxen prohibi0vely labor- intensive Feature detec0on significantly reduces the data and makes the quan0ta0ve analysis viable Map alignment enables the comparison of features across maps thus allowing for a label- free quan0fica0on 84 28
29 References Papers on Feature Finding and Map Alignment Gröpl, C, Lange, E, Reine, K, Kohlbacher, O, Sturm, M, Huber, C, Mayr, B, and Klein, C (2005). Algorithms for the automated absolute quan0fica0on of diagnos0c markers in complex proteomics samples. In: Proceedings of the 1st Symposium on Computa0onal Life Sciences (CLS 2005), edited by M. Behold, R. Glen, K. Diederichs, O. Kohlbacher, I. Fischer. Springer LNBI 3695, p Mayr, B, Kohlbacher, O, Reine, K, Sturm, M, Gröpl, C, Lange, E, Klein, C, and Huber, CG (2006). Absolute Myoglobin Quan0ta0on in Serum by Combining Two- Dimensional Liquid Chromatography- Electrospray Ioniza0on Mass Spectrometry and Novel Data Analysis Algorithms. J. Proteome Res. 5: Lange E, Gröpl C, Schulz- Trieglaff O, Leinenbach A, Huber C, Reine K. A geometric approach for the alignment of liquid chromatography- mass spectrometry data. Bioinforma0cs (2007), 23(13):i Web links to soaware tools
SeqAn and OpenMS Integration Workshop. Temesgen Dadi, Julianus Pfeuffer, Alexander Fillbrunn The Center for Integrative Bioinformatics (CIBI)
") SeqAn and OpenMS Integration Workshop Temesgen Dadi, Julianus Pfeuffer, Alexander Fillbrunn The Center for Integrative Bioinformatics (CIBI) Mass-spectrometry data analysis in KNIME Julianus Pfeuffer,
SeqAn and OpenMS Integration Workshop Temesgen Dadi, Julianus Pfeuffer, Alexander Fillbrunn The Center for Integrative Bioinformatics (CIBI) Mass-spectrometry data analysis in KNIME Julianus Pfeuffer,
Quan%ta%on with XPRESS. and. ASAPRa%o
 Quan%ta%on with XPRESS and ASAPRa%o 1 Pep%de and Protein Quan%ta%on Raw Mass Spec Data Pep%de Iden%fica%on Pep%de Valida%on Quan%ta%on Protein Assignment Protein List msconvert X!Tandem SpectraST SEQUEST*
Introduction into Selected Reaction Monitoring (SRM) Christina Ludwig
 Christina Ludwig") Introduction into Selected Reaction Monitoring (SRM) Christina Ludwig EuPA Bioinformatics course 28.11.2013 Overview A) What is selected reac/on monitoring, how does it work and why is it useful? B) How
Introduction into Selected Reaction Monitoring (SRM) Christina Ludwig EuPA Bioinformatics course 28.11.2013 Overview A) What is selected reac/on monitoring, how does it work and why is it useful? B) How
Isotopic-Labeling and Mass Spectrometry-Based Quantitative Proteomics
 Isotopic-Labeling and Mass Spectrometry-Based Quantitative Proteomics Xiao-jun Li, Ph.D. Current address: Homestead Clinical Day 4 October 19, 2006 Protein Quantification LC-MS/MS Data XLink mzxml file
Computational Methods for Mass Spectrometry Proteomics
 Computational Methods for Mass Spectrometry Proteomics Eidhammer, Ingvar ISBN-13: 9780470512975 Table of Contents Preface. Acknowledgements. 1 Protein, Proteome, and Proteomics. 1.1 Primary goals for studying
Developing Algorithms for the Determination of Relative Abundances of Peptides from LC/MS Data
 Developing Algorithms for the Determination of Relative Abundances of Peptides from LC/MS Data RIPS Team Jake Marcus (Project Manager) Anne Eaton Melanie Kanter Aru Ray Faculty Mentors Shawn Cokus Matteo
BIOINF 4120 Bioinformatics 2 - Structures and Systems - Oliver Kohlbacher Summer Systems Biology Exp. Methods
 BIOINF 4120 Bioinformatics 2 - Structures and Systems - Oliver Kohlbacher Summer 2013 14. Systems Biology Exp. Methods Overview Transcriptomics Basics of microarrays Comparative analysis Interactomics:
PC235: 2008 Lecture 5: Quantitation. Arnold Falick
 PC235: 2008 Lecture 5: Quantitation Arnold Falick falickam@berkeley.edu Summary What you will learn from this lecture: There are many methods to perform quantitation using mass spectrometry (any method
Mass Spectrometry and Proteomics - Lecture 5 - Matthias Trost Newcastle University
 Mass Spectrometry and Proteomics - Lecture 5 - Matthias Trost Newcastle University matthias.trost@ncl.ac.uk Previously Proteomics Sample prep 144 Lecture 5 Quantitation techniques Search Algorithms Proteomics
6 x 5 Ways to Ensure Your LC-MS/MS is Healthy
 6 x 5 Ways to Ensure Your LC-MS/MS is Healthy (Also known as - Tracking Performance with the 6 x 5 LC-MS/MS Peptide Reference Mixture) Mike Rosenblatt, Ph.D. Group Leader Mass Spec Reagents 215. We monitor
Comprehensive support for quantitation
 Comprehensive support for quantitation One of the major new features in the current release of Mascot is support for quantitation. This is still work in progress. Our goal is to support all of the popular
TOMAHAQ Method Construction
 TOMAHAQ Method Construction Triggered by offset mass accurate-mass high-resolution accurate quantitation (TOMAHAQ) can be performed in the standard method editor of the instrument, without modifications
Protein Quantitation II: Multiple Reaction Monitoring. Kelly Ruggles New York University
 Protein Quantitation II: Multiple Reaction Monitoring Kelly Ruggles kelly@fenyolab.org New York University Traditional Affinity-based proteomics Use antibodies to quantify proteins Western Blot RPPA Immunohistochemistry
MS-based proteomics to investigate proteins and their modifications
 MS-based proteomics to investigate proteins and their modifications Francis Impens VIB Proteomics Core October th 217 Overview Mass spectrometry-based proteomics: general workflow Identification of protein
Chemistry Jeopardy. Method valida'on QA/QC. Internal Standard
 Chemistry Jeopardy Calibra'on QA/QC 1 QA/QC 2 Method valida'on Internal Standard 200 200 200 200 200 400 400 400 400 400 600 600 600 600 600 800 800 800 800 800 1000 1000 1000 1000 1000 200 When would
Electrospray ionization mass spectrometry (ESI-
 Automated Charge State Determination of Complex Isotope-Resolved Mass Spectra by Peak-Target Fourier Transform Li Chen a and Yee Leng Yap b a Bioinformatics Institute, 30 Biopolis Street, Singapore b Davos
Mass spectrometry has been used a lot in biology since the late 1950 s. However it really came into play in the late 1980 s once methods were
 Mass spectrometry has been used a lot in biology since the late 1950 s. However it really came into play in the late 1980 s once methods were developed to allow the analysis of large intact (bigger than
Data pre-processing in liquid chromatography mass spectrometry-based proteomics
 BIOINFORMATICS ORIGINAL PAPER Vol. 21 no. 21 25, pages 454 459 doi:1.193/bioinformatics/bti66 Data and text mining Data pre-processing in liquid chromatography mass spectrometry-based proteomics Xiang
Overview - MS Proteomics in One Slide. MS masses of peptides. MS/MS fragments of a peptide. Results! Match to sequence database
 Overview - MS Proteomics in One Slide Obtain protein Digest into peptides Acquire spectra in mass spectrometer MS masses of peptides MS/MS fragments of a peptide Results! Match to sequence database 2 But
WADA Technical Document TD2015IDCR
 MINIMUM CRITERIA FOR CHROMATOGRAPHIC-MASS SPECTROMETRIC CONFIRMATION OF THE IDENTITY OF ANALYTES FOR DOPING CONTROL PURPOSES. The ability of a method to identify an analyte is a function of the entire
NPTEL VIDEO COURSE PROTEOMICS PROF. SANJEEVA SRIVASTAVA
 LECTURE-25 Quantitative proteomics: itraq and TMT TRANSCRIPT Welcome to the proteomics course. Today we will talk about quantitative proteomics and discuss about itraq and TMT techniques. The quantitative
From mass to compound iden3ty
 Mass Spectrometry Analy&cal tool measuring molecular weight of molecules in chemistry, biology and pharmacology Only picomolar concentra&ons required Within 5 ppm for small organic molecules For a 40 kda
Quantitative Proteomics
 Quantitative Proteomics Quantitation AND Mass Spectrometry Condition A Condition B Identify and quantify differently expressed proteins resulting from a change in the environment (stimulus, disease) Lyse
Modeling Mass Spectrometry-Based Protein Analysis
 Chapter 8 Jan Eriksson and David Fenyö Abstract The success of mass spectrometry based proteomics depends on efficient methods for data analysis. These methods require a detailed understanding of the information
Protein Quantitation II: Multiple Reaction Monitoring. Kelly Ruggles New York University
 Protein Quantitation II: Multiple Reaction Monitoring Kelly Ruggles kelly@fenyolab.org New York University Traditional Affinity-based proteomics Use antibodies to quantify proteins Western Blot Immunohistochemistry
Streaming - 2. Bloom Filters, Distinct Item counting, Computing moments. credits:www.mmds.org.
 Streaming - 2 Bloom Filters, Distinct Item counting, Computing moments credits:www.mmds.org http://www.mmds.org Outline More algorithms for streams: 2 Outline More algorithms for streams: (1) Filtering
Key questions of proteomics. Bioinformatics 2. Proteomics. Foundation of proteomics. What proteins are there? Protein digestion
 s s Key questions of proteomics What proteins are there? Bioinformatics 2 Lecture 2 roteomics How much is there of each of the proteins? - Absolute quantitation - Stoichiometry What (modification/splice)
Introduc)on to RNA- Seq Data Analysis. Dr. Benilton S Carvalho Department of Medical Gene)cs Faculty of Medical Sciences State University of Campinas
on to RNA- Seq Data Analysis. Dr. Benilton S Carvalho Department of Medical Gene)cs Faculty of Medical Sciences State University of Campinas") Introduc)on to RNA- Seq Data Analysis Dr. Benilton S Carvalho Department of Medical Gene)cs Faculty of Medical Sciences State University of Campinas Material: hep://)ny.cc/rnaseq Slides: hep://)ny.cc/slidesrnaseq
Introduc)on to RNA- Seq Data Analysis Dr. Benilton S Carvalho Department of Medical Gene)cs Faculty of Medical Sciences State University of Campinas Material: hep://)ny.cc/rnaseq Slides: hep://)ny.cc/slidesrnaseq
Mass spectrometry-based proteomics has become
 FOCUS: THE ORBITRAP Computational Principles of Determining and Improving Mass Precision and Accuracy for Proteome Measurements in an Orbitrap Jürgen Cox and Matthias Mann Proteomics and Signal Transduction,
SRM assay generation and data analysis in Skyline
 in Skyline Preparation 1. Download the example data from www.srmcourse.ch/eupa.html (3 raw files, 1 csv file, 1 sptxt file). 2. The number formats of your computer have to be set to English (United States).
QTOF-based proteomics and metabolomics for the agro-food chain.
 QTOF-based proteomics and metabolomics for the agro-food chain luigi.lucini@unicatt.it Metabolomics Two scenarios identification of known unknowns and unknown unknowns For known unknowns use spectral or
Isotope Dilution Mass Spectrometry
 Isotope Dilution Mass Spectrometry J. Ignacio Garcia Alonso and Pablo Rodriguez-Gonzalez Faculty of Chemistry, University of Oviedo, Oviedo, Spain E-mail: jiga@uniovi.es, rodriguezpablo@uniovi.es RSC Publishing
Making Sense of Differences in LCMS Data: Integrated Tools
 Making Sense of Differences in LCMS Data: Integrated Tools David A. Weil Agilent Technologies MassHunter Overview Page 1 March 2008 How Clean is our Water?... Page 2 Chemical Residue Analysis.... From
Quantitation of a target protein in crude samples using targeted peptide quantification by Mass Spectrometry
 Quantitation of a target protein in crude samples using targeted peptide quantification by Mass Spectrometry Jon Hao, Rong Ye, and Mason Tao Poochon Scientific, Frederick, Maryland 21701 Abstract Background:
Proteome-wide label-free quantification with MaxQuant. Jürgen Cox Max Planck Institute of Biochemistry July 2011
 Proteome-wide label-free quantification with MaxQuant Jürgen Cox Max Planck Institute of Biochemistry July 2011 MaxQuant MaxQuant Feature detection Data acquisition Initial Andromeda search Statistics
SILAC and TMT. IDeA National Resource for Proteomics Workshop for Graduate Students and Post-docs Renny Lan 5/18/2017
 SILAC and TMT IDeA National Resource for Proteomics Workshop for Graduate Students and Post-docs Renny Lan 5/18/2017 UHPLC peak chosen at 26.47 min LC Mass at 571.36 chosen for MS/MS MS/MS MS This is a
NANOLCMS SOLUTIONS HPLC BASICS
 NANOLCMS SOLUTIONS HPLC BASICS Main Course Topics This course is designed to provide a basic founda@on to HPLC principles. It includes a wealth of informa@on regarding HPLC instrumenta@on and HPLC columns.
TUTORIAL EXERCISES WITH ANSWERS
 TUTORIAL EXERCISES WITH ANSWERS Tutorial 1 Settings 1. What is the exact monoisotopic mass difference for peptides carrying a 13 C (and NO additional 15 N) labelled C-terminal lysine residue? a. 6.020129
Statistical analysis of isobaric-labeled mass spectrometry data
 Statistical analysis of isobaric-labeled mass spectrometry data Farhad Shakeri July 3, 2018 Core Unit for Bioinformatics Analyses Institute for Genomic Statistics and Bioinformatics University Hospital
Aplicació de la proteòmica a la cerca de Biomarcadors proteics Barcelona, 08 de Juny 2010
 Aplicació de la proteòmica a la cerca de Biomarcadors proteics Barcelona, 8 de Juny 21 Eliandre de Oliveira Plataforma de Proteòmica Parc Científic de Barcelona Protein Chemistry Proteomics Hypothesis-free
A Software Suite for the Generation and Comparison of Peptide Arrays from Sets. of Data Collected by Liquid Chromatography-Mass Spectrometry
 MCP Papers in Press. Published on July 26, 2005 as Manuscript M500141-MCP200 A Software Suite for the Generation and Comparison of Peptide Arrays from Sets of Data Collected by Liquid Chromatography-Mass
BST 226 Statistical Methods for Bioinformatics David M. Rocke. January 22, 2014 BST 226 Statistical Methods for Bioinformatics 1
 BST 226 Statistical Methods for Bioinformatics David M. Rocke January 22, 2014 BST 226 Statistical Methods for Bioinformatics 1 Mass Spectrometry Mass spectrometry (mass spec, MS) comprises a set of instrumental
Planning and Analyzing WFIRST Grism Observa:ons
 Planning and Analyzing WFIRST Grism Observa:ons Stefano Casertano and the STScI Slitless Spectroscopy Working Group (Brammer, Dixon, MacKenty, Pirzkal, Ravindranath, Ryan) Pasadena 2/29/2016 - WFIRST mee6ng,
WADA Technical Document TD2003IDCR
 IDENTIFICATION CRITERIA FOR QUALITATIVE ASSAYS INCORPORATING CHROMATOGRAPHY AND MASS SPECTROMETRY The appropriate analytical characteristics must be documented for a particular assay. The Laboratory must
MassHunter TOF/QTOF Users Meeting
 MassHunter TOF/QTOF Users Meeting 1 Qualitative Analysis Workflows Workflows in Qualitative Analysis allow the user to only see and work with the areas and dialog boxes they need for their specific tasks
Workflow concept. Data goes through the workflow. A Node contains an operation An edge represents data flow The results are brought together in tables
 PROTEOME DISCOVERER Workflow concept Data goes through the workflow Spectra Peptides Quantitation A Node contains an operation An edge represents data flow The results are brought together in tables Protein
MasSPIKE (Mass SPectrum Interpretation and Kernel Extraction) for Biological Samples p.1
 for Biological Samples p.1") MasSPIKE (Mass SPectrum Interpretation and Kernel Extraction) for Biological Samples Parminder Kaur Bogdan Budnik, Konstantin Aizikov and Peter B. O Connor, Department of Electrical and Computer Engineering,
MasSPIKE (Mass SPectrum Interpretation and Kernel Extraction) for Biological Samples Parminder Kaur Bogdan Budnik, Konstantin Aizikov and Peter B. O Connor, Department of Electrical and Computer Engineering,
Tutorial 1: Setting up your Skyline document
 Tutorial 1: Setting up your Skyline document Caution! For using Skyline the number formats of your computer have to be set to English (United States). Open the Control Panel Clock, Language, and Region
Monday (March 28)- Mass spectrometry Tuesday (March 29)- Experiment 6: Separa>ons ICP-MS calcula>ons
- Mass spectrometry Tuesday (March 29)- Experiment 6: Separa>ons ICP-MS calcula>ons") LOOKING AHEAD Monday (March 28)- Mass spectrometry Tuesday (March 29)- Experiment 6: Separa>ons ICP-MS calcula>ons Thursday (March 31)- Poster crea>on? Hayes on travel Monday (April 4)- Chromatographic
LOOKING AHEAD Monday (March 28)- Mass spectrometry Tuesday (March 29)- Experiment 6: Separa>ons ICP-MS calcula>ons Thursday (March 31)- Poster crea>on? Hayes on travel Monday (April 4)- Chromatographic
Computer Vision. Pa0ern Recogni4on Concepts Part I. Luis F. Teixeira MAP- i 2012/13
 Computer Vision Pa0ern Recogni4on Concepts Part I Luis F. Teixeira MAP- i 2012/13 What is it? Pa0ern Recogni4on Many defini4ons in the literature The assignment of a physical object or event to one of
Multi-residue analysis of pesticides by GC-HRMS
 An Executive Summary Multi-residue analysis of pesticides by GC-HRMS Dr. Hans Mol is senior scientist at RIKILT- Wageningen UR Introduction Regulatory authorities throughout the world set and enforce strict
High-Throughput Protein Quantitation Using Multiple Reaction Monitoring
 High-Throughput Protein Quantitation Using Multiple Reaction Monitoring Application Note Authors Ning Tang, Christine Miller, Joe Roark, Norton Kitagawa and Keith Waddell Agilent Technologies, Inc. Santa
LECTURE-11. Hybrid MS Configurations HANDOUT. As discussed in our previous lecture, mass spectrometry is by far the most versatile
 LECTURE-11 Hybrid MS Configurations HANDOUT PREAMBLE As discussed in our previous lecture, mass spectrometry is by far the most versatile technique used in proteomics. We had also discussed some of the
Atomic masses. Atomic masses of elements. Atomic masses of isotopes. Nominal and exact atomic masses. Example: CO, N 2 ja C 2 H 4
 High-Resolution Mass spectrometry (HR-MS, HRAM-MS) (FT mass spectrometry) MS that enables identifying elemental compositions (empirical formulas) from accurate m/z data 9.05.2017 1 Atomic masses (atomic
HR/AM Targeted Peptide Quantification on a Q Exactive MS: A Unique Combination of High Selectivity, High Sensitivity, and High Throughput
 HR/AM Targeted Peptide Quantification on a Q Exactive MS: A Unique Combination of High Selectivity, High Sensitivity, and High Throughput Yi Zhang 1, Zhiqi Hao 1, Markus Kellmann 2 and Andreas FR. Huhmer
Networks. Can (John) Bruce Keck Founda7on Biotechnology Lab Bioinforma7cs Resource
 Bruce Keck Founda7on Biotechnology Lab Bioinforma7cs Resource") Networks Can (John) Bruce Keck Founda7on Biotechnology Lab Bioinforma7cs Resource Networks in biology Protein-Protein Interaction Network of Yeast Transcriptional regulatory network of E.coli Experimental
Networks Can (John) Bruce Keck Founda7on Biotechnology Lab Bioinforma7cs Resource Networks in biology Protein-Protein Interaction Network of Yeast Transcriptional regulatory network of E.coli Experimental
Simula'ons as a tool for higher mass resolu'on spectrometer: Lessons from exis,ng observa,ons
 Simula'ons as a tool for higher mass resolu'on spectrometer: Lessons from exis,ng observa,ons 1 G. Nicolaou, 1 M. Yamauchi, 1,2 H. Nilsson, 1 M. Wieser, 3 A. Fedorov, 1 D. R. Cas'llo and 2 L. Berčič Mo'va'on
Bias/variance tradeoff, Model assessment and selec+on
 Applied induc+ve learning Bias/variance tradeoff, Model assessment and selec+on Pierre Geurts Department of Electrical Engineering and Computer Science University of Liège October 29, 2012 1 Supervised
Introduction. Chapter 1. Learning Objectives
 Chapter 1 Introduction Learning Objectives To understand the need to interface liquid chromatography and mass spectrometry. To understand the requirements of an interface between liquid chromatography
Calibration in Proteomics. Proteomics 202 :: Practical Proteomics Using the Skyline Software Ecosystem Lindsay K. Pino Monday, Jan 22
 Calibration in Proteomics Proteomics 202 :: Practical Proteomics Using the Skyline Software Ecosystem Lindsay K. Pino (lpino@uw.edu) Monday, Jan 22 objectives Define calibration for proteomics List common
Quantitative Proteomics
 BSPR workshop 16 th July 2010 Quantitative Proteomics Kathryn Lilley Cambridge Centre for Proteomics Department of Biochemistry University of Cambridge k.s.lilley@bioc.cam.ac.uk www.bio.cam.ac.uk/proteomics/
LC-MS. Pre-processing (xcms) W4M Core Team. 22/09/2015 v 1.0.0
 W4M Core Team. 22/09/2015 v 1.0.0") LC-MS Pre-processing (xcms) W4M Core Team 22/09/2015 v 1.0.0 Acquisition files pre-processing with xcms: extraction, alignment and retention time drift correction. SECTION 1 2 Extraction with XCMS R based
LC-MS Pre-processing (xcms) W4M Core Team 22/09/2015 v 1.0.0 Acquisition files pre-processing with xcms: extraction, alignment and retention time drift correction. SECTION 1 2 Extraction with XCMS R based
Scin/lla/on of liquid neon Photon Detec/on at 27 K
 Scin/lla/on of liquid neon Photon Detec/on at 27 K Hugh Lippinco, Fermilab Jin Ping Solar Neutrino Workshop June 9, 2014 1 Why neon? Scin?llates efficiently (of order 20 photons/kev or more) No long lived
Biological Mass Spectrometry
 Biochemistry 412 Biological Mass Spectrometry February 13 th, 2007 Proteomics The study of the complete complement of proteins found in an organism Degrees of Freedom for Protein Variability Covalent Modifications
A d. Par$cle size and the rate of dissolu$on. Consider the surface of the fixed amount of compound as the func$on of linear microcrystal
 Par$cle size and the rate of dissolu$on Consider the surface of the fixed amount of compound as the func$on of linear microcrystal size, d, and the total volume V For non-cubic shapes, calculate the Area
(Refer Slide Time 00:09) (Refer Slide Time 00:13)
 (Refer Slide Time 00:13)") (Refer Slide Time 00:09) Mass Spectrometry Based Proteomics Professor Sanjeeva Srivastava Department of Biosciences and Bioengineering Indian Institute of Technology, Bombay Mod 02 Lecture Number 09 (Refer
(Refer Slide Time 00:09) Mass Spectrometry Based Proteomics Professor Sanjeeva Srivastava Department of Biosciences and Bioengineering Indian Institute of Technology, Bombay Mod 02 Lecture Number 09 (Refer
Mass spectrometry based proteomics (1)
") Mass spectrometry based proteomics (1) Department of Biochemistry, Ghent University Department of Medical Protein Research, VIB Ghent, Belgium AMI ACIDS AD PRTEIS Amino Acids and their properties From:
Mass spectrometry based proteomics (1) Department of Biochemistry, Ghent University Department of Medical Protein Research, VIB Ghent, Belgium AMI ACIDS AD PRTEIS Amino Acids and their properties From:
Radia%ve B decays at LHCb
 Radia%ve B decays at LHCb XLII Interna7onal Mee7ng on Fundamental Physics Benasque, January 28 th, 2014 Vicente J Rives Molina Vicente.rives@cern.ch Radia7ve decays: theory Radia7ve decays are FCNC processes:
Reagents. Affinity Tag (Biotin) Acid Cleavage Site. Figure 1. Cleavable ICAT Reagent Structure.
 Acid Cleavage Site. Figure 1. Cleavable ICAT Reagent Structure.") DATA SHEET Protein Expression Analysis Reagents Background The ultimate goal of proteomics is to identify and quantify proteins that are relevant to a given biological state; and to unearth networks of
DATA SHEET Protein Expression Analysis Reagents Background The ultimate goal of proteomics is to identify and quantify proteins that are relevant to a given biological state; and to unearth networks of
Tandem mass spectra were extracted from the Xcalibur data system format. (.RAW) and charge state assignment was performed using in house software
 and charge state assignment was performed using in house software") Supplementary Methods Software Interpretation of Tandem mass spectra Tandem mass spectra were extracted from the Xcalibur data system format (.RAW) and charge state assignment was performed using in house
Supplementary Methods Software Interpretation of Tandem mass spectra Tandem mass spectra were extracted from the Xcalibur data system format (.RAW) and charge state assignment was performed using in house
Analysis of Labeled and Non-Labeled Proteomic Data Using Progenesis QI for Proteomics
 Analysis of Labeled and Non-Labeled Proteomic Data Using Progenesis QI for Proteomics Lee Gethings, Gushinder Atwal, Martin Palmer, Chris Hughes, Hans Vissers, and James Langridge Waters Corporation, Wilmslow,
DIA-Umpire: comprehensive computational framework for data independent acquisition proteomics
 DIA-Umpire: comprehensive computational framework for data independent acquisition proteomics Chih-Chiang Tsou 1,2, Dmitry Avtonomov 2, Brett Larsen 3, Monika Tucholska 3, Hyungwon Choi 4 Anne-Claude Gingras
Chemistry Instrumental Analysis Lecture 37. Chem 4631
 Chemistry 4631 Instrumental Analysis Lecture 37 Most analytes separated by HPLC are thermally stable and non-volatile (liquids) (unlike in GC) so not ionized easily by EI or CI techniques. MS must be at
profileanalysis Innovation with Integrity Quickly pinpointing and identifying potential biomarkers in Proteomics and Metabolomics research
 profileanalysis Quickly pinpointing and identifying potential biomarkers in Proteomics and Metabolomics research Innovation with Integrity Omics Research Biomarker Discovery Made Easy by ProfileAnalysis
Mul$ple Sequence Alignment Methods. Tandy Warnow Departments of Bioengineering and Computer Science h?p://tandy.cs.illinois.edu
 Mul$ple Sequence Alignment Methods Tandy Warnow Departments of Bioengineering and Computer Science h?p://tandy.cs.illinois.edu Species Tree Orangutan Gorilla Chimpanzee Human From the Tree of the Life
for the Novice Mass Spectrometry (^>, John Greaves and John Roboz yc**' CRC Press J Taylor & Francis Group Boca Raton London New York
 Mass Spectrometry for the Novice John Greaves and John Roboz (^>, yc**' CRC Press J Taylor & Francis Group Boca Raton London New York CRC Press is an imprint of the Taylor & Francis Croup, an informa business
All Ions MS/MS: Targeted Screening and Quantitation Using Agilent TOF and Q-TOF LC/MS Systems
 All Ions MS/MS: Targeted Screening and Quantitation Using Agilent TOF and Q-TOF LC/MS Systems Technical Overview Introduction All Ions MS/MS is a technique that is available for Agilent high resolution
Designed for Accuracy. Innovation with Integrity. High resolution quantitative proteomics LC-MS
 Designed for Accuracy High resolution quantitative proteomics Innovation with Integrity LC-MS Setting New Standards in Accuracy The development of mass spectrometry based proteomics approaches has dramatically
Sta$s$cs for Genomics ( )
") Sta$s$cs for Genomics (140.688) Instructor: Jeff Leek Slide Credits: Rafael Irizarry, John Storey No announcements today. Hypothesis testing Once you have a given score for each gene, how do you decide
Sta$s$cs for Genomics (140.688) Instructor: Jeff Leek Slide Credits: Rafael Irizarry, John Storey No announcements today. Hypothesis testing Once you have a given score for each gene, how do you decide
Methods for proteome analysis of obesity (Adipose tissue)
") Methods for proteome analysis of obesity (Adipose tissue) I. Sample preparation and liquid chromatography-tandem mass spectrometric analysis Instruments, softwares, and materials AB SCIEX Triple TOF 5600
Methods for proteome analysis of obesity (Adipose tissue) I. Sample preparation and liquid chromatography-tandem mass spectrometric analysis Instruments, softwares, and materials AB SCIEX Triple TOF 5600
Robert Crampton Ph.D Brent Olive PH.D, Don Gamelis PH.D. Argos Scien7fic
 Using Spectral Averaging and Signal Processing to Leverage Exis7ng Short- term Fence Line UV Spectroscopic Data to Retrieve Accurate, Long- term Gas Concentra7ons to Meet New Monitoring Goals Robert Crampton
Chem 250 Unit 1 Proteomics by Mass Spectrometry
 Chem 250 Unit 1 Proteomics by Mass Spectrometry Article #1 Quantitative MS for proteomics: teaching a new dog old tricks. MacCoss MJ, Matthews DE., Anal Chem. 2005 Aug 1;77(15):294A-302A. 1. Synopsis 1.1.
Choosing the metabolomics platform
 GBS 748 Choosing the metabolomics platform Stephen Barnes, PhD 4 7117; sbarnes@uab.edu So, I have my samples what s next? You ve collected your samples and you may have extracted them Protein precipitation
The Power of LC MALDI: Identification of Proteins by LC MALDI MS/MS Using the Applied Biosystems 4700 Proteomics Analyzer with TOF/TOF Optics
 APPLICATION NOTE TOF MS The Power of LC MALDI: Identification of Proteins by LC MALDI MS/MS Using the Applied Biosystems 4700 Proteomics Analyzer with TOF/TOF Optics Purpose The Applied Biosystems 4700
Microarray Preprocessing
 Microarray Preprocessing Normaliza$on Normaliza$on is needed to ensure that differences in intensi$es are indeed due to differen$al expression, and not some prin$ng, hybridiza$on, or scanning ar$fact.
Unsupervised Learning: K- Means & PCA
 Unsupervised Learning: K- Means & PCA Unsupervised Learning Supervised learning used labeled data pairs (x, y) to learn a func>on f : X Y But, what if we don t have labels? No labels = unsupervised learning
Development and Evaluation of Methods for Predicting Protein Levels from Tandem Mass Spectrometry Data. Han Liu
 Development and Evaluation of Methods for Predicting Protein Levels from Tandem Mass Spectrometry Data by Han Liu A thesis submitted in conformity with the requirements for the degree of Master of Science
Protein analysis using mass spectrometry
 Protein analysis using mass spectrometry Michael Stadlmeier 2017/12/18 Literature http://www.carellgroup.de/teaching/master 3 What is Proteomics? The proteome is: the entire set of proteins in a given
Features or compounds? A data reduction strategy for untargeted metabolomics to generate meaningful data
 TECHNICAL NOTE 65204 Features or compounds? A data reduction strategy for untargeted metabolomics to generate meaningful data Authors Amanda Souza and Ralf Tautenhahn Thermo Fisher Scientific Keywords
ALIGNMENT OF LC-MS DATA USING PEPTIDE FEATURES. A Thesis XINCHENG TANG
 ALIGNMENT OF LC-MS DATA USING PEPTIDE FEATURES A Thesis by XINCHENG TANG Submitted to the Office of Graduate Studies of Texas A&M University in partial fulfillment of the requirements for the degree of
De Novo Metabolite Chemical Structure Determination. Paul R. West Ph.D. Stemina Biomarker Discovery, Inc.
 De Novo Metabolite Chemical Structure Determination Paul R. West Ph.D. Stemina Biomarker Discovery, Inc. As a part of non targeted metabolomic analysis, when peaks in the mass spectra are thought to be
A Brief History of EPA s Criteria for GC/MS Tuning Compounds. Harry McCarty and Kevin Roberts CSC
 A Brief History of EPA s Criteria for GC/MS Tuning Compounds Harry McCarty and Kevin Roberts CSC Disclaimer Although the authors are EPA contractors and much of this material is taken directly from EPA
TANDEM MASS SPECTROSCOPY
 TANDEM MASS SPECTROSCOPY 1 MASS SPECTROMETER TYPES OF MASS SPECTROMETER PRINCIPLE TANDEM MASS SPECTROMETER INSTRUMENTATION QUADRAPOLE MASS ANALYZER TRIPLE QUADRAPOLE MASS ANALYZER TIME OF FLIGHT MASS ANALYSER
Ensemble of Climate Models
 Ensemble of Climate Models Claudia Tebaldi Climate Central and Department of Sta7s7cs, UBC Reto Knu>, Reinhard Furrer, Richard Smith, Bruno Sanso Outline Mul7 model ensembles (MMEs) a descrip7on at face
Tiffany Samaroo MB&B 452a December 8, Take Home Final. Topic 1
 Tiffany Samaroo MB&B 452a December 8, 2003 Take Home Final Topic 1 Prior to 1970, protein and DNA sequence alignment was limited to visual comparison. This was a very tedious process; even proteins with
Figure S1. Interaction of PcTS with αsyn. (a) 1 H- 15 N HSQC NMR spectra of 100 µm αsyn in the absence (0:1, black) and increasing equivalent
 1 H- 15 N HSQC NMR spectra of 100 µm αsyn in the absence (0:1, black) and increasing equivalent") Figure S1. Interaction of PcTS with αsyn. (a) 1 H- 15 N HSQC NMR spectra of 100 µm αsyn in the absence (0:1, black) and increasing equivalent concentrations of PcTS (100 µm, blue; 500 µm, green; 1.5 mm,
Figure S1. Interaction of PcTS with αsyn. (a) 1 H- 15 N HSQC NMR spectra of 100 µm αsyn in the absence (0:1, black) and increasing equivalent concentrations of PcTS (100 µm, blue; 500 µm, green; 1.5 mm,
An Effective Workflow for Impurity Analysis Incorporating High Quality HRAM LCMS & MSMS with Intelligent Automated Data Mining
 An Effective Workflow for Impurity Analysis Incorporating High Quality HRAM LCMS & MSMS with Intelligent Automated Data Mining Dave Weil, Ph.D. and Jim Lau, Ph.D. Typical Method Conditions: 1260 UHPLC
PeptideProphet: Validation of Peptide Assignments to MS/MS Spectra. Andrew Keller
 PeptideProphet: Validation of Peptide Assignments to MS/MS Spectra Andrew Keller Outline Need to validate peptide assignments to MS/MS spectra Statistical approach to validation Running PeptideProphet
Surface Ioniza.on on Metal Oxide Gas Sensors
 Surface Ioniza.on on Metal Oxide Gas Sensors A. Ponzoni 1, D. Zappa 1,2, A. Karakuscu 1,2, E. Comini 1,2, G. Faglia 1,2, G. Sberveglieri 1,2 1 CNR- IDASC SENSOR Lab, Via Branze 45, 25123 Brescia, Italy
Introduction to Chemical Research (CHEM 294) Introduction to Chemical Research (CHEM 294)
 Introduction to Chemical Research (CHEM 294)") Introduction to Chemical Research (CHEM 294) Mondays: Lecture 1-2 pm CRN: Lab 2:15-5:15 pm 38609 Mentoring 6. Do Preliminary Experiments 5. Plan the Experiments 1.Pose a Research Idea Proposal to submit
Introduction to Chemical Research (CHEM 294) Mondays: Lecture 1-2 pm CRN: Lab 2:15-5:15 pm 38609 Mentoring 6. Do Preliminary Experiments 5. Plan the Experiments 1.Pose a Research Idea Proposal to submit