A Software Suite for the Generation and Comparison of Peptide Arrays from Sets. of Data Collected by Liquid Chromatography-Mass Spectrometry
|
|
|
- Doris Shaw
- 5 years ago
- Views:
Transcription
1 MCP Papers in Press. Published on July 26, 2005 as Manuscript M MCP200 A Software Suite for the Generation and Comparison of Peptide Arrays from Sets of Data Collected by Liquid Chromatography-Mass Spectrometry Xiao-jun Li, Eugene C. Yi, Christopher J. Kemp, Hui Zhang, and Ruedi Aebersold Institute for Systems Biology, 1441 North 34 th Street, Seattle, WA Fred Hutchinson Cancer Research Center, Seattle, Washington Institute for Molecular Systems Biology, Swiss Federal Institute of Technology, ETH Hönggerberg and Faculty of Natural Sciences, University of Zurich, Switzerland Corresponding author: Xiao-jun Li, (206) (phone), (206) (fax), xli@systemsbiology.org Running title: Quantitative LC-MS Approach for Peptide Profiling Abbreviations: LC, liquid chromatography; MS, mass spectrometry; MS/MS, tandem mass spectrometry; ESI, electrospray ionization; MALDI, matrix assisted laser desorption/ionization; CID, collision-induced disassociation; QTOF, quadrupole time-of-flight; RP, reversed phase; CV, coefficient of variation; m / z, mass-to-charge ratio; S / N, signal-to-noise ratio; SIC, single ion chromatogram; RTCC, retention time calibration curve; RMS, root-meansquare. 1 Copyright 2005 by The American Society for Biochemistry and Molecular Biology, Inc.
2 Summary There is an increasing interest in the quantitative proteomic measurement of the protein contents of substantially similar biological samples, e.g., for the analysis of cellular response to perturbations over time or for the discovery of protein biomarkers from clinical samples. Technical limitations of current proteomics platforms such as limited reproducibility and low throughput make this a challenging task. A new liquid chromatography (LC)-mass spectrometry (MS) based platform is able to generate complex peptide patterns from the analysis of proteolyzed protein samples at high throughput and represents a promising approach for quantitative proteomics. A crucial component of the LC-MS approach is the accurate evaluation of the abundance of detected peptides over many samples and the identification of peptide features that can stratify samples with respect to their genetic, physiological or environmental origins. We present here a new software suite, SpecArray, which generates a peptide vs. sample array from a set of LC-MS data. A peptide array stores the relative abundance of thousands of peptide features in many samples and is in a format identical to that of a gene expression microarray. A peptide array can be subjected to an unsupervised clustering analysis to stratify samples or to a discriminant analysis to identify discriminatory peptide features. We applied the SpecArray to analyze two sets of LC-MS data: one was from four repeat LC-MS analyses of same glycopeptide sample and another was from LC-MS analysis of serum samples of five male and five female mice. We demonstrate through these two study cases that the SpecArray software suite can serve as an effective software platform in the LC-MS approach for quantitative proteomics. 2
3 Introduction The identification and quantification of the protein contents of biological samples plays a crucial role in biological and biomedical research (1-4). Due to the large dynamic range and the high complexity of most proteomes, it is very challenging to identify and accurately quantify the majority of proteins from such samples. Liquid chromatography (LC) and tandem mass spectrometry (MS/MS) based methods are currently most efficient for the identification of a large number of proteins and have been widely applied in biological and biomedical research (5-7). If combined with stable isotope labeling, such methods can also accurately quantify proteins (7-13). In a typical LC-MS/MS based quantitative proteomic experiment, samples to be compared are differentially and isotopically labeled, combined and enzymatically digested into peptides. The obtained peptide samples are then separated by a multidimensional LC system and analyzed by MS/MS. Peptides are ionized either by electrospray ionization (ESI) (14) or by matrix assisted laser desorption/ionization (MALDI) (15) and peptide ions are selected, usually in the order of decreasing signal intensity, for fragmentation by collision-induced disassociation (CID) (16, 17). Peptides are identified by using an automated search engine, such as SEQUEST (18) or Mascot (19), to match their fragment ions against a designated protein database. Peptides are quantified by using a quantification software tool, such as XPRESS (8) or ASAPRatio (20), that uses the relative MS signal intensities of the different isotopic forms to calculate the relative abundance of each identified peptide. The identification and quantification of proteins is then achieved by combining the information obtained from the peptides that associate with the particular protein (20, 21). The quantitative LC-MS/MS approach can routinely identify and quantify hundreds 3
4 to thousands of proteins from a single biological sample but is generally unable to comprehensively analyze proteomes. There is an increasing interest in the quantitative proteomic measurement of the protein contents of numerous, substantially similar samples. Typical examples include the discovery of protein biomarkers from clinical samples (3, 22, 23) and the measurement of the response of cells and tissues to perturbations. For biomarker discovery, large numbers of samples need to be processed to achieve sufficient statistical power to distinguish disease specific markers from coincidental proteome fluctuations within the human population. For the study of cellular response to perturbations, temporal and dose dependent changes are usually particularly informative for the identification of patterns of proteins that are specifically affected by the treatment (24). Therefore, these and similar applications require high sample throughput and highly reproducible coverage of the proteome. Quantitative LC-MS/MS is of limited use for such large-scale studies due to significant under-sampling of complex proteomic samples. Even after extensive peptide fractionation, a significant fraction of the peptides present in a sample is not selected by the mass spectrometer for CID (25). These peptides are neither identified nor quantified. Therefore, if multiple, substantially similar samples are being analyzed, the fraction of those peptides that are measured in every sample rapidly decreases with increasing sample number. Furthermore, the peptides that are consistently detected tend to be the high abundance peptides that generate intense MS signals, whereas many lower abundance, biologically interesting peptides are inconsistently sampled. As a result, it is very difficult to consistently obtain quantitative information on low abundance proteins across multiple samples by the LC-MS/MS. 4
5 As an alternative to LC-MS/MS based methods, peptide mapping by LC-MS has been gaining momentum as a method for quantitative proteomics (23, 26, 27). The LC- MS approach is based on the principle that the MS signal intensity of each peptide in a substantially similar sample analyzed under identical conditions is proportional to the abundance of the peptide within the dynamic range of the instrument and is at least monotonic to the abundance beyond the dynamic range. Therefore one may evaluate the relative abundance of a peptide in different, related samples by analyzing the samples under identical LC-MS conditions and by comparing MS signal intensity of the same peptide in different LC-MS runs (26-28). The obtained relative abundance is quantitative within MS dynamic range and semi-quantitative beyond the range. The LC-MS approach for quantitative proteomics can be summarized in the following three steps: (1) Proteins are extracted and purified from related samples and enzymatically digested into peptides. Peptide samples are then analyzed by an LC-ESI-MS system, preferably using a high resolution, high accuracy quadrupole time-of-flight (QTOF) or similarly performing analyzer, under identical conditions. Optionally, peptides can be labeled with stable isotope reagents to achieve more accurate quantification and a limited number CID attempts can be carried out to identify a subset of the detected and quantified peptides. (2) Software tools are applied to compare peptide patterns, extract peptide relative abundance from LC-MS data, and identify a list of peptides that stratify samples with respect to their genetic, physiological or environmental characters. Despite the fact that the amino acid sequence of the detected peptides is generally not known, identical peptides in different samples can be unambiguously matched by their mass-to-charge ratio ( m / z ), their charge state and their chromatographic retention time. (3) Information 5
6 ( m / z, charge and retention time) of discriminatory peptides is fed into to a mass spectrometer to identify the amino acid sequence of such peptides by targeted MS/MS and database searching (23). By first measuring the relative abundance of thousands of peptides and then focusing the power of MS/MS selectively on discriminatory peptides, this method has a better chance of identifying discriminatory proteins than the standard LC-MS/MS shotgun approach. Here we present a new software suite, SpecArray, that fulfills the important second step of the LC-MS approach for quantitative proteomics. The software suite takes a set of LC-MS data as input and outputs a peptide vs. sample array that stores the relative abundance of thousands of peptide features matched in all samples. The format of a peptide array is identical to that of a gene expression microarray, except that peptide features replace gene names in a peptide array. Just like microarrays (29), peptide arrays can be subjected to unsupervised clustering analyses (such as hierarchical or k-means) to classify sample types and/or to discriminant analyses (such as student t-test or linear discriminant function) to identify peptides discriminating between samples of different characters. The SpecArray software suite contains five distinct but integrated software tools: (1) The Pep3D module visualizes LC-MS data in graphic images to ensure data quality (25); (2) the mzxml2dat module extracts high quality MS signals from raw noisy MS signals; (3) the PepList module applies pattern matching to extract peptide features from MS signals; (4) the PepMatch module aligns peptide features between different samples; and (5) the PepArray module generates a peptide array from aligned peptide features in all samples. To minimize the adverse effects of possible retention time shift in different LC runs, PepMatch first evaluates a retention time calibration curve (RTCC) 6
7 between any two samples and then uses the RTCCs to align peptides of all samples. To correct any systematic errors due to uneven sample loading or uneven ionization efficiency, PepArray performs sample-dependent ratio normalization (20) before reporting peptide relative abundance. We applied the SpecArray software suite to analyze two sets of LC-MS data: one was from four repeat LC-MS analyses of same glycopeptide sample and another from LC-MS analysis of serum samples of five male and five female mice. As demonstrated by these two study cases, the SpecArray software suite is very useful for analyzing LC-MS data and can serve as an effective software platform in the LC-MS approach for quantitative proteomics. Experimental Procedures Serum collection and sample preparation. Ten serum samples were collected from five male and five female mice of same litter at the age of 22 weeks, using a procedure described previously (23). A plasma sample was collected from a male mouse at the age of 22 weeks, using a similar protocol except that blood was placed in a K3EDTA coated 1.5ml microcentrifuge tube and centrifuged at 4 o C for 5 minutes at 3000rpm. Formerly N-linked glycosylated peptides were isolated from 50µl of each sample using the N-linked glycopeptide capture procedure as described previously (23, 30). LC-MS analysis. 7
8 Peptide isolates from 5µl of original serum or plasma sample were analyzed by an reversed phase (RP) LC-ESI-QTOF-MS system as described previously (23). An ESI- QTOF mass spectrometer (Waters, Beverly, MA) was used. Experimental settings were identical in all sample analyses. Raw MS data was converted into the mzxml common file format using the MassWolf file converter (31). Initial MS signal processing. The software tool mzxml2dat processes raw LC-MS data. The process is illustrated in Supplementary Figure S1 and includes the following five steps: (1) A smooth MS spectrum is generated from each raw MS spectrum by using the onedimensional translation-invariant wavelet transformation filtering method (Symmlet8) (32, 33); (2) A centroid MS spectrum is then generated from each smoothed MS spectrum that consists of all peak apexes (as specified by m / z and intensity) in the smoothed spectrum; (3) Local background noise within each centroid MS spectrum is estimated as the median intensity of all signals that are within a ±50 target m / z window of the m / z value; (4) Low-intensity signals are removed from each centroid MS spectrum using a signal-to-noise ratio ( S / N ) cutoff of 2 and local background is subtracted from the retained MS signals; (5) The remaining MS signals, as specified by m / z, intensity and S / N, constitute a denoised, centroid spectrum. Thus a denoised centroid MS spectrum is derived from each raw MS spectrum. Since the current mzxml schema (31) does not store S / N for MS signals, we designed an mzdat binary file format to store all denoised, centroid MS spectra of an LC-MS analysis. Details of the mzdat format are described in Supplementary Figure 8
9 S2. The mzdat format allows for a quick access to individual MS spectra and also decreases the file size. The mzxml2dat program also allows user to specify the m / z range and the retention time range within which raw data is processed and converted. Hence information poor spectra, such as those collected when the RP column is washed, can be removed without further analysis. Extraction of peptide features. The software tool PepList extracts peptide features from denoised, centroid LC- MS data as stored in our mzdat file format. The extraction process contains the following three steps: (1) Signals in each MS spectrum are compared with peptide isotopic distributions to identify potential peptide features from the spectrum. Starting with the most intense signal in the spectrum, the software first determines the charge state of the signal by examining the m / z difference between neighboring MS signals. Assuming the most intense signal is produced by the mono-isotopic mass ( M ) of a peptide, the software then calculates the expected peptide isotopic distribution (34, 35) and assesses how well the distribution fits neighboring MS signals. Considering that the mono-isotopic peak of a peptide may not be the most intense among all isotopic peaks of the peptide, the software repeats the pattern matching process by assuming that the most intense signal is produced by M + 1 or M + 2 isotopic mass of a peptide. If at least one of the three expected isotopic distributions fits the MS signals well, a peptide feature is identified from the MS spectrum; the best-fitting assumption determines the monoisotopic mass of the peptide. A peptide feature is specified by its mono-isotopic mass, its charge, and the retention time of the MS spectrum. The intensity and the S / N of the 9
10 peptide feature are given by the corresponding values of the mono-isotopic peak. In some cases the charge state of the most intense signal cannot be unambiguously determined. In such cases all possible charge states are examined but only the one provides the best fitting of nearby signals is eventually accepted. MS signals that are matched to the identified peptide feature are then removed from the MS spectrum. If no peptide feature can be identified, only the most intense signal is removed. The feature identification process is repeated for the remaining signals in the MS spectrum until no MS signal has an S / N above 5. In this way the PepList identifies a list of peptide features from each MS spectrum. Some peptide features may be generated by the same peptide but in different charge states. (2) Peptide features of nearby MS spectra (within half minute in retention time), similar mass (within a m / z tolerance of 0.05) and same charge state are compared with each other and those of a lower intensity are discarded. (3) A single ion chromatogram (SIC) is reconstructed for each remaining peptide feature by summing MS signals of the first three isotopic masses of the peptide and tracing the summed MS signals against time. Applying methodologies developed in the ASAPRatio program (20), the raw SIC is smoothed and the background noise in the SIC is estimated. Peptide features whose intensity at SIC peak apex is less than twice of the corresponding SIC background are discarded. The remaining peptide features are collected as the output of the software. Each peptide feature is specified by its mono-isotopic mass, its charge, and the retention time at the corresponding SIC peak apex while the area of the SIC peak determines the abundance of the feature and the quality of the feature. S / N at the SIC peak apex indicates the 10
11 Peptide alignment across multiple samples. The software tool PepMatch aligns peptide features from multiple samples. The whole alignment process can be described in the following seven steps: (1) Peptide features of two samples are first paired together if their charges are identical and their masses are close (within a m / z tolerance of 0.5). At this initial stage, information on peptide retention time is ignored and a peptide feature in one sample may pair with several peptide features in another sample. (2) The software then learns from all peptide pairs the RTCC between the two LC-MS analyses. The RTCC is determined in the retention time vs. retention time space under two constraints: (a) The RTCC minimizes the root-mean-square (RMS) distance between peptide pairs and itself and (b) the RTCC is monotonic. (3) The software then evaluates the distance between each peptide pair and the RTCC, computes the ratio between the distance and the RMS distance, and applies the formula of a normal distribution to calculate a p value for the peptide pair. The p value assesses the significance of a peptide pair. Peptide pairs having a very low p value (using a cutoff of 10-3 ) are removed. Among peptide pairs that share at least one common peptide feature, the one having the lowest p value is also removed. (4) Steps (2) and (3) are repeated until all peptide pairs have a p value above the cutoff of 10-3 and each peptide feature pairs with only one peptide feature in another analysis. At this point, the RTCC between the two LC-MS analyses is determined. (5) To collect the likely peptide pairs from the two analyses, the software evaluates a p value for all original peptide pairs in (1). The calculation is similar to that in (3), except that the p value of a peptide pair now depends on both its distance to the RTCC and the m / z difference between the two corresponding peptide features. The final peptide pairs are selected in 11
12 the same way as in (4). In this way, peptide features between the two LC-MS analyses are aligned to pairs. (6) Steps (1)-(5) are repeated for all samples until peptide features are aligned between every two samples. (7) Peptide features of all samples are combined into a peptide super list. At the beginning, every peptide feature of every sample enters the peptide super list as a separate entry. Based on pairing information and pairing strength (as evaluated by the p value), entries linked by pairs are iteratively combined in the order of strength. Weak conflicting pairs are treated as false positive and discarded in the process. In the end, the peptide super list stores all alignment information between peptide features of all samples. Generation of a peptide array. The software tool PepArray generates a user-customized peptide array from a peptide super list (the output of PepMatch). There are five steps in the process: (1) Based on user-specified criteria, the software first selects a list of peptide features from the peptide super list as entries to the peptide array. The software allows a user to list samples by group and specify the required minimal number of appearance for each group. To enter the peptide array, a peptide feature must satisfy the appearance requirement of at least one group. The software also allows a user to specify a m / z range and a retention time range for valid peptide features. Out-of-range peptide features are not selected for the peptide array. (2) The software then generates an initial peptide vs. sample array from selected peptide features: The first dimension of the array is the list of all samples, the second dimension is the list of all selected peptide features, and an array element specifies the abundance of the corresponding peptide feature in the corresponding 12
13 sample. If a peptide feature is missed in a sample, the corresponding array element is left blank. (3) For each blank element in the initial peptide array, the software then searches the corresponding peptide feature in the corresponding denoised centroid LC-MS data to check whether the feature is truly absent. The retention time of the missed feature in the sample is estimated from retention times of the feature in other samples, using the RTCCs between the samples to correct any retention time drift. If valid peptide signals are found, the abundance of the feature is evaluated, as in the PepList program, and stored in the initial peptide array; otherwise, the array element is left blank. (4) The software then carries out a sample-dependent normalization (20) to correct any systematic errors on peptide abundance that may arise from variations in sample loading or ionization efficiency between LC-MS analyses. The software collects a list of common peptide features, which appears in at least two thirds of all samples in the initial peptide array. If a common peptide feature appears in a sample, the ratio between its abundance in the sample and its averaged abundance across all samples is evaluated. The software then collects all abundance ratios of common peptide features in each sample and applies a methodology developed for the ASAPRatio program (20) to calculate a sample-dependent normalization factor for the sample. Peptide abundance in the initial peptide array is then normalized by the corresponding normalization factor. (5) In the final step, the software evaluates the average abundance of each peptide feature across all samples, divides peptide abundance in individual samples by the averaged abundance, and obtains the relative abundance of the peptide feature in individual samples. The final output of the software is a peptide array describing the relative abundance of individual peptide features in individual samples. Peptide features in the 13
14 peptide array are specified by their m / z, retention time (in minutes), mono-isotopic mass, and charge state. Depending on the nature of the samples, a user may decide whether to keep blank elements in a peptide array or to replace them with a very low abundance ratio. The peptide array is so formatted that it can be analyzed directly by the clustering program Cluster ( (29). To add flexibility, the software allows a user to skip steps (4) and/or (5). Unsupervised hierarchical clustering analysis. The Cluster program ( (29) was used for unsupervised hierarchical clustering analysis of peptide arrays. Peptide array data were unfiltered and logarithmic transformed. Both samples and peptide features were clustered using single linkage clustering with centered correlation similarity metrics. The TreeView program ( (29) was used to visualize the clustering results. Results Generating a peptide array from a set of LC-MS data. As depicted in Figure 1, the software suite SpecArray generates a peptide array from a set of LC-MS data in five distinct functional steps and each step is achieved by one of the five software tools: Pep3D, mzxml2dat, PepList, PepMatch, and PepArray. We describe in the following these five functional steps in detail and illustrate their main 14
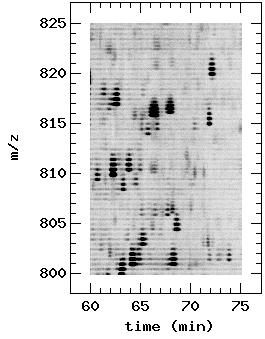
15 features with data collected from four repeat LC-MS analyses of an N-linked glycopeptide sample that was derived from plasma of a male mouse (23, 30). <Figure 1.> Step 1: LC-MS data in mzxml common file format (31) is first visualized by the Pep3D software tool to assess data quality (25); see Figure 2A for an example of a Pep3D image. Since the LC-MS approach relies exclusively on MS signal intensity for peptide quantification, it is crucial to obtain high-quality, reproducible LC-MS data. Pep3D is used for assessing data quality due to the easy-to-use nature of the tool and easy-tointerpret nature of the results. Common problems such as low peptide concentration, chemical or polymer contaminations, non-optimal LC-MS performance, insufficient LC separation, etc., can be easily diagnosed by visually inspecting Pep3D images (25). Each LC-MS data is assessed almost immediately after collection. Low quality data are rejected without further processing. Samples are repeatedly analyzed until high quality data are obtained from each sample. <Figure 2.> Step 2: Raw LC-MS data stored in the profiling mode is processed into denoised, centroid data by the software tool mzxml2dat. Raw LC-MS spectra consist of mainly noisy data. Mining peptide signals from such noisy data is an important step in the analysis of LC-MS data. The software tool mzxml2dat applies advanced signal processing technologies, such as the translation-invariant wavelet transformation (32, 33), to extract peptide signals from raw LC-MS data, as described in Experimental Procedures. To illustrate the effect of this step, we plot two Pep3D images side by side in Figure 2: Figure 2A was generated from raw LC-MS data in profiling mode while Figure 15
16 2B was from the corresponding denoised, centroid data. It is apparent that the denoised, centroid data retained most peptide signals but removed the majority of noise. Due to centroiding, peptide MS signals are much focused along the m / z axis in Figure 2B. Peptide MS signals in Figure 2B are slightly less intense than those in Figure 2A due to the subtraction of background noise. The file size of the denoised, centroid data is significantly smaller than that of the raw data: the average file size from the four repeat LC-MS analyses was 2.0GB in raw vendor file format, 3.5GB in the mzxml file format but only 5.8MB in the mzdat file format. As a byproduct, one may use the mzxml2dat software tool to significantly reduce the file size of LC-MS data, and hence the cost of data storage, without losing significant amount of peptide information. Step 3: Peptide features are extracted from denoised, centroid LC-MS data by the software tool PepList. The LC-MS approach aims to compare MS signals of real peptides and to identify the underlying proteins. It is hence crucial for the LC-MS approach to reliably extract peptide features from LC-MS data. PepList applies rather restrictive conditions to ensure that most extracted peptide features are in fact derived from peptides, as described in Experimental Procedures. PepList specifies a peptide feature by peptide mono-isotopic mass, charge and retention time and uses MS signals to determine the abundance and the S / N of the feature. A total of, respectively, 2770, 3105, 3064, and 3162 peptide features were extracted from data of the four repeat LC-MS analyses. In Figure 2C, we overlay peptide features from one of the analysis onto the corresponding Pep3D image, where identified peptide features are marked with boxes of colors reflecting their S / N values. Clearly most peptide features were supported by the underlying MS signals. The number of peptide features extracted from the four LC-MS 16
17 data had an average of 3025, a standard deviation of 175, and a coefficient of variation (CV) of 5.8%. The consistency in the number of peptide features provides an indication that LC-MS data is reproducible. Some peptide features were produced by same peptides but in different charge states. Peptide features of the four LC-MS analyses can be combined to, respectively, 2559, 2880, 2872, and 2957 unique peptides. Only 7% of peptide features were produced in more than one charge state. Currently the software considers only charge states up to [M+5H] 5+ since higher charge states were rarely observed and may be beyond the resolution of the mass spectrometer used. Among peptide features of all four LC-MS analyses, a total of 6744 peptide features were found in the [M+H] + charge state, 3477 in [M+2H] 2+, 1426 in [M+3H] 3+, 379 in [M+4H] 4+, and 75 in [M+5H] 5+. More than half of all peptide features were found in the [M+H] + charge state while less than 4% were found in charge states higher than [M+3H] 3+. In comparison, a small percentage of peptides were identified in the [M+H] + charge state in a typical LC-MS/MS experiment (20). The discrepancy in the peptide charge distribution between the two experiments may arise from differences in LC and/or MS settings (36). The discrepancy may also reflect the fact that singly charged peptide ions are poorly fragmented and thus under-represented among peptides identified by an LC-MS/MS experiment. In addition, non-peptide components such as chemical contaminants and polymers may also be detected as peptide features (25). Depending on the amount of samples and the sensitivity of the LC-MS system used, PepList normally extracts one thousand to five thousand reliable peptide features from one LC-MS data. Step 4: Peptide features from different samples are aligned against each other by the software tool PepMatch so that the abundance of the same peptide present in different 17
18 samples can be compared. In most LC-MS analyses, the peptide m / z value is highly reproducible from run to run. Peptide retention times however may shift up to a few minutes between two runs even though peptide elution order is rather reproducible. PepMatch evaluates a RTCC to correct any retention time shifts between two LC-MS analyses and aligns peptide features based on their charge, mass and calibrated retention time, as described in Experimental Procedures. In Figure 3A, we plot the retention time of aligned peptide features in two LC-MS analyses, along with the corresponding RTCC. The RMS distance between aligned peptide features and the RTCC was 0.94 minutes and the RMS m / z difference between aligned peptide features was To illustrate the quality of the alignment, we plot the intensity of aligned peptide features in the two analyses in Figure 3B, where peptide features with alignment p < 0. 5 were plotted in green while those with p > 0. 5 were in red. The collapse of most data, including those with p < 0. 5, into a diagonal line in the intensity scattering plot indicates that the alignment is quite successful. The scattering plot has the same characters as that of two microarrays. It is apparent that peptide features of high intensity and high alignment p values are more reproducible than those of low intensity or low p values. The few outliers in Figure 3B are most likely due to misalignment, as indicated by their low p values. <Figure 3.> Step 5: A peptide vs. sample array is generated from aligned peptide features by the software tool PepArray. The peptide array describes the relative abundance of aligned peptide features in different samples and is the output of the SpecArray software suite. The generation of a peptide array from aligned peptide features is described in 18
19 Experimental Procedures. We plot in Figure 3C a section of the peptide array that was generated from the four LC-MS analyses. Peptide features in the peptide array were selected if they were aligned to at least two analyses. While peptide features that were aligned across all analyses are always selected in a peptide array, peptide features that were missed in some analyses may be filtered out by some selection criteria. Since not all peptide features can be aligned across all analyses, a different selection criterion may thus select a slightly different set of peptide features for the peptide array. There were totally 3188 peptide features in the peptide array, among which 2078 had peptide relative abundance across all four analyses, 752 across three, and 358 across two. About 12% of all array elements were blank, which may be caused by peptide misalignment, peptide overlapping, or failure in detecting low-abundance peptides in some analyses by MS or by software. No blank element exists if one selects only peptide features that are aligned across all samples when designing a peptide array. Features of the same peptide ionized in different charge states were treated as separated entries in the peptide array. Alternatively one may opt to combine features of the same peptide into a single entry in the peptide array. This alternative is not adopted in PepArray due to the consideration that features in different charge states may have different alignment configurations. While features in charge states having high MS signal intensities may be aligned across all samples, those in charge states having low MS signal intensities may be missed in some or many samples. As a result, it is rather difficult to combine features having different alignment configurations. The 3188 peptide features in the peptide array corresponded to 2913 unique peptides: 2662 peptides (91.4%) had only one feature in the peptide array, 229 (7.9%) had two, 20 (0.7%) had 3, and only 2 (0.1%) had 4. The CV 19
20 distribution of the relative abundance of the same peptide ionized in different charge states had a mean of 0.14, a median of 0.10 and a mode of about Hence the relative abundance of the same peptide ionized in different charge states was consistent. The CV distribution of peptide relative abundance evaluated in different analyses is an important criterion in assessing the quality of the peptide array. For the four repeat analyses, the data are plotted in Figure 3D. The CV distribution had a mean of 0.31, a median of 0.24 and a mode of about 0.1. In other words, the LC-MS approach is able to evaluate peptide relative abundance with an accuracy of about ±20-30%, i.e., smaller changes than the accuracy may not be detected by the approach. Such accuracy makes it possible to apply the LC-MS approach to discover discriminatory peptides with about 50% abundance change in different samples. Applying LC-MS approach to the quantitative profiling of mouse sera. To demonstrate the application of the LC-MS approach for large-scale sample profiling, we collected serum samples from 5 male and 5 female mice of same litter at the age of 22 weeks. Peptides that are N-glycosylated in the intact proteins were isolated in their de-glycosylated form, using previously described protocols (23, 30). It has been demonstrated that the sample preparation procedure is highly reproducible (23). N-linked glycopeptide samples were analyzed by an LC-ESI-QTOF-MS system under identical settings. We applied the SpecArray software suite to analyze the LC-MS data. In Figure 4 we plot four Pep3D images that were generated from these data. Pep3D images of other samples are very similar. We used identical parameters to generate these images so that the gray scale of a peptide spot reflects directly the MS signal intensity of the 20
21 corresponding peptide. The overall pattern of these Pep3D images closely resembles each other, indicating that the samples had similar peptide contents. The signal intensity from the male 1 sample is noticeably weaker than that from other samples, probably due to lower peptide concentration in the sample. The occurrence of intensity variations between different LC-MS analyses illustrates the importance of carrying out sampledependent normalization to minimize such variations. <Figure 4.> The number of peptide features that were detected from individual samples is listed in Table I. The number ranges from 2245 ( female 4 ) to 3723 ( male 5 ); the largest difference is The Pep3D images revealed a strong correlation between the number of peptide features and the overall MS signal intensity, as illustrated by Pep3D images of male 1 and male 5 in Figure 4. On average, about 363 more peptide features were detected from samples of male mice than from samples of female mice. This difference however is statistically insignificant ( p = ). The average number (3056) of peptide features detected from the serum samples is close to that (3025) from the four repeat LC-MS analyses of the plasma sample. But the corresponding CV (17.0%) is about 3 times larger than that (5.8%) of the four repeat analyses. The increase in CV was likely due to biological difference between different mice or due to experimental handling of different samples. <Table I.> We tested four different feature selection criteria when generating a peptide array from the mouse serum data. The results are listed in Table II. At the lowest stringency, peptide features were selected if they were aligned in at least two out of the ten samples 21
22 (the 2/10 criterion). The obtained peptide array contained a total of 5319 peptide features. But only 687 of the selected features were aligned across all ten samples and 38.9% of all array elements were blank. Some blank elements may be due to the absence (or low abundance) of some peptides in the corresponding serum samples and hence carry biological information. Others may be due to experimental and software artifacts. The latter is likely the cause for most blank elements in this peptide array. At the highest stringency, peptide features were selected if they were aligned in either five out of the five samples of male mice or five out of the five samples of female mice (the 5/5 or 5/5 criterion). The obtained peptide array contained a total of 897 peptide features. Most (547) of the selected features were aligned across all ten samples and only 6.4% of all array elements were blank. Peptide relative abundance stored in this peptide array is much more reliable than that in the 2/10 peptide array. But the more restrictive criteria may also cause some loss of useful information. Although the total number of peptide features varied significantly in peptide arrays that were generated from different feature selection criteria, the number of peptide features that were aligned across all ten samples was more consistent. Indeed mostly the same peptide features were fully aligned in all peptide arrays. Despite the large variation of array size, the same core information was contained in all peptide arrays that were generated from the same set of LC-MS data. Since the software searched and recovered some missing features, more peptide features were aligned across all ten samples at a low stringency than at a high stringency. <Table II.> It is straightforward to evaluate the CV distribution of the relative abundance of the same peptide measured in different samples from a peptide array. We plot in Figure 22
23 5A the CV distribution evaluated from the 5/5 or 5/5 peptide array. The CV distribution among samples of male mice had a mean of 0.51 and a median of 0.49 while the corresponding values among samples of female mice were 0.48 and 0.45, respectively. In comparison with the CV distribution among the four repeat LC-MS analyses of same plasma sample (see Figure 3D), CV distributions among samples of different mice shifted significantly towards higher values. Despite the same genetic background of all mice, mouse-to-mouse variations were prevalent, which makes it difficult to discover sex-specific features. (Variations arising from sample collection and sample preparation may also contribute to the larger CV values. It has been demonstrated that variations from sample preparation are small (23).) The CV distribution among samples of all mice of both sexes had a mean of 0.55 and a median of There was a small but noticeable shift towards higher values in the CV distribution of all mice, in comparison with those of unisex mice. This shift was likely due to biological difference between male and female mice. But it appears that sex-specific variations in peptide abundance were submissive to variations between individual mice. More thorough investigation is needed to verify this finding. The CV distributions evaluated from all four peptide arrays listed in Table II are plotted in Supplementary Figure S3. Despite the large discrepancy in the number of peptide features between different peptide arrays, all CV distributions were very similar to each other. This reflects the robustness of peptide arrays against different feature selection criteria. <Figure 5.> We carried out an unsupervised clustering analysis of the 5/5 or 5/5 peptide array, using the Clustering program ( (23). A 23
24 section of the clustering results was plotted in Figure 5B. While mice were arranged in the right order with respect to their sex, mice female 4 and female 5 were clustered with male mice. Similar results were obtained from all four peptide arrays listed in Table II; see Supplementary Figure S4. Despite the apparent difference between male and female mice, other unknown factors dominate the difference between these samples. To investigate this result further, we recall that blank elements in a peptide array may be traced to two different origins: (1) The corresponding peptides are truly absent (or beyond detection) in the corresponding samples or (2) experimental and software artifacts cause the corresponding peptides not to be detected or aligned properly in the corresponding samples. Without repeat experiments, it is rather difficult to distinguish between the two origins. The Clustering program treats blank elements as artifacts and completely ignores such data in the unsupervised clustering analysis. Assuming that blank elements in the 5/5 or 5/5 peptide array arose from the first origin, we replaced those blank elements with one-tenth of the lowest relative abundance in the array (0.03) in a separated unsupervised clustering analysis. Mice were properly clustered in the new clustering analysis; see Figure 5C for a section of peptide features discriminating mice of different sex. When same analysis was applied to other peptide arrays listed in Table II, mice female 4 and female 5 were still clustered with male mice; see Supplementary Figure S4. These results indicate that unsupervised clustering analysis can be strongly influenced by unknown biological factors and by experimental and software artifacts. The application of unsupervised clustering analysis of peptide arrays should be examined with caution for sample stratification. 24
25 A total 566 (63.1%) peptide features in the 5/5 or 5/5 peptide array had a S / N above 10. In order to discover specific peptide features that can distinguish male mice from female mice, we applied student-t test to evaluate the p value of the 566 peptide features being discriminatory from peptide relative abundance stored in the peptide array. The complete results are listed in Supplementary Table S1. The five most discriminatory peptides had a p value of , , , , and As an example, we plot the zoomed Pep3D images and the relative abundance of the most discriminatory peptide in Figure 6. The Pep3D images were generated with exactly same parameters so that the gray scale of the circled peptide feature in individual samples directly reflects the corresponding peptide MS signal intensity. Despite the large variation in the relative abundance of the peptide among different mice of same sex, the relative abundance of male mice was consistently higher than that of female mice in this example. Another example containing the second and the third most discriminatory peptides is given in Supplementary Figure S5. The two features had a mass difference of and a retention time difference of 1.7 minutes. It is not clear whether the two features were chemically related, e.g., by de-amidation (37). In this study, we didn t find any peptide features that were present in only one sex; see Table II. A total of 15 peptides had a p value less than Due to the small sample size and the prevalent mouse-to-mouse variations in peptide abundance, very few peptide features had a statistically significant p value in distinguishing male mice from female mice. Nevertheless, analyzing the peptide array allowed us to discover such discriminatory peptides, which were specified by their mono-isotopic mass, charge and retention time and can selected for targeted MS/MS identification (23). 25
26 <Figure 6.> Discussion We present here a new software suite, SpecArray, which generates peptide arrays from sets of LC-MS data. We used data collected from four repeat LC-MS analyses of a glycopeptide sample to illustrate the main features of SpecArray. We showed that the SpecArray software suite was able to extract from LC-MS data accurate qualitative information on thousands of peptide features across multiple samples. We also utilized our glycopeptide capture and LC-MS approach to profile serum proteins of five male and five female mice. We applied SpecArray to discover peptide features that distinguished male mice from female mice. We demonstrated through these two samples that the SpecArray software suite facilitates the analysis of LC-MS data and is therefore a very useful software platform for the LC-MS approach to large-scale protein profiling in quantitative proteomics. The SpecArray software suite presents its results in an array format that is identical to that of a gene expression microarray. Just like microarray technology for transcriptomics, we anticipate a broad application of the LC-MS approach and the SpecArray software suite in quantitative proteomics. This new platform of quantitative proteomics can be especially useful when one needs to measure the protein contents of a large number of substantially similar samples, as in the case of biomarker discovery, time course studies, knockout experiments, etc. By first collecting information on discriminatory peptides and then using targeted MS/MS to identify the corresponding 26
27 proteins, the platform may also provide researchers a better chance than most current proteomics platforms of discovering proteins of biological or physiological interest. The array output format also makes it natural to adopt some existing microarray analysis tools to the downstream analysis of SpecArray output results, which further simplifies the extraction of biological information from LC-MS data. There is no doubt that the LC-MS approach and the SpecArray software suite are still at their early development stage. Experimental and software artifacts are present in peptide arrays. Improvement on sample source, LC-MS analysis and data analysis is under way. More and more attention is paid to minimize potential artifacts that may be introduced during sample collection, sample storage and/or sample preparation (4). On LC-MS analysis, ongoing efforts are aimed to reduce run-to-run variations in peptide retention time and peptide MS signal intensity and to cut down the overlap of peptide features by simplifying sample complexity, increasing MS resolution and improving LC separation. We have demonstrated recently (data not shown) that one may achieve a consistent and reproducible LC-MS analysis of about a hundred samples after optimizing LC-MS components such as LC column, LC gradient and MS settings. New developments such as on chip-based LC columns and improved nano flow chromatography systems also significantly increase the resolution power and the reproducibility of peptide separation (38). New MS instruments such as the linear ion trap Fourier transform (LTQ-FT) MS offer much improved accuracy and sensitivity in measuring peptide ions (39). All these experimental advances will enhance the quality of LC-MS data. On data analysis, some low-abundance or overlapping peptide features may be difficult to extract reliably. A small percentage of peptide features may be misaligned 27
28 by the software tools. Sophisticated analytic methods are under development to detect low-abundance peptide signals, decompose overlapping peptide features and unambiguously determine peptide features that are absent from a sample. These new methods will definitely make information stored in peptide arrays more reliable. In short, the prowess of the LC-MS approach and the usefulness of peptide arrays are expected to improve along with the constant improvement on sample source, LC-MS analysis and data analysis. The SpecArray software suite is written in C language. The current version runs on the Linux operating systems. A new version for the Windows operating systems is planned. Just liker other software tools developed by our group, the SpecArray software suite will be freely distributed under an open source license upon publication and will be available at Acknowledgements This work was supported in part by the NHLBI, National Institutes of Health, under Contract N01-HV-28179, by the NCI, National Institutes of Health, under Contract N01-CO and under grant 1R21CA114852, and by the NIEHS, National Institutes of Health, under grant U01-ES
29 References 1. Tyers, M., and Mann, M. (2003) From genomics to proteomics. Nature 422, Aebersold, R., and Mann, M. (2003) Mass spectrometry-based proteomics. Nature 422, Hanash, S. (2003) Disease proteomics. Nature 422, Boguski, M. S., and McIntosh, M. W. (2003) Biomedical informatics for proteomics. Nature 422, Washburn, M. P., Wolters, D., and Yates, J. R., 3rd. (2001) Large-scale analysis of the yeast proteome by multidimensional protein identification technology. Nat Biotechnol 19, Washburn, M. P., Ulaszek, R., Deciu, C., Schieltz, D. M., and Yates, J. R., 3rd. (2002) Analysis of quantitative proteomic data generated via multidimensional protein identification technology. Anal Chem 74, Gygi, S. P., Rist, B., Gerber, S. A., Turecek, F., Gelb, M. H., and Aebersold, R. (1999) Quantitative analysis of complex protein mixtures using isotope-coded affinity tags. Nat. Biotechnol. 17, Han, D. K., Eng, J., Zhou, H., and Aebersold, R. (2001) Quantitative profiling of differentiation-induced microsomal proteins using isotope-coded affinity tags and mass spectrometry. Nat. Biotechnol. 19, Ong, S. E., Blagoev, B., Kratchmarova, I., Kristensen, D. B., Steen, H., Pandey, A., and Mann, M. (2002) Stable isotope labeling by amino acids in cell culture, SILAC, as a simple and accurate approach to expression proteomics. Mol Cell Proteomics 1,
30 10. Blagoev, B., Kratchmarova, I., Ong, S. E., Nielsen, M., Foster, L. J., and Mann, M. (2003) A proteomics strategy to elucidate functional protein-protein interactions applied to EGF signaling. Nat. Biotechnol. 21, Oda, Y., Huang, K., Cross, F. R., Cowburn, D., and Chait, B. T. (1999) Accurate quantitation of protein expression and site-specific phosphorylation. Proc. Natl. Acad. Sci. USA 96, Yao, X., Freas, A., Ramirez, J., Demirev, P. A., and Fenselau, C. (2001) Proteolytic 18O labeling for comparative proteomics: model studies with two serotypes of adenovirus. Anal Chem 73, Ross, P. L., Huang, Y. N., Marchese, J. N., Williamson, B., Parker, K., Hattan, S., Khainovski, N., Pillai, S., Dey, S., Daniels, S., Purkayastha, S., Juhasz, P., Martin, S., Bartlet-Jones, M., He, F., Jacobson, A., and Pappin, D. J. (2004) Multiplexed protein quantitation in Saccharomyces cerevisiae using amine-reactive isobaric tagging reagents. Mol Cell Proteomics 3, Fenn, J. B., Mann, M., Meng, C. K., Wong, S. F., and Whitehouse, C. M. (1989) Electrospray Ionization for Mass Spectrometry of Large Biomolecules. Science 246, Karas, M., and Hillenkamp, F. (1988) Laser desorption ionization of proteins with molecular masses exceeding 10,000 daltons. Anal Chem 60, Hunt, D. F., Yates, J. R., 3rd, Shabanowitz, J., Winston, S., and Hauer, C. R. (1986) Protein sequencing by tandem mass spectrometry. Proc Natl Acad Sci U S A 83,
31 17. Aebersold, R., and Goodlett, D. R. (2001) Mass spectrometry in proteomics. Chem Rev 101, Eng, J. K., McCormack, A. L., and Yates, J. R. I. (1994) An Approach to Correlate Tandem Mass Spectral Data of Peptides with Amino Acid Sequences in a Protein Database. J. Am. Soc. Mass Spectrum. 5, Perkins, D. N., Pappin, D. J., Creasy, D. M., and Cottrell, J. S. (1999) Probabilitybased protein identification by searching sequence databases using mass spectrometry data. Electrophoresis 20, Li, X. J., Zhang, H., Ranish, J. A., and Aebersold, R. (2003) Automated statistical analysis of protein abundance ratios from data generated by stable-isotope dilution and tandem mass spectrometry. Anal Chem 75, Nesvizhskii, A. I., Keller, A., Kolker, E., and Aebersold, R. (2003) A Statistical Model for Identifying Proteins by Tandem Mass Spectrometry. Anal Chem 75, Adkins, J. N., Varnum, S. M., Auberry, K. J., Moore, R. J., Angell, N. H., Smith, R. D., Springer, D. L., and Pounds, J. G. (2002) Toward a human blood serum proteome: analysis by multidimensional separation coupled with mass spectrometry. Mol Cell Proteomics 1, Zhang, H., Yi, E. C., Li, X. J., Mallick, P., Kelly-Spratt, K. S., Masselon, C. D., Camp, D. G., 2nd, Smith, R. D., Kemp, C. J., and Aebersold, R. (2005) High throughput quantitative analysis of serum proteins using glycopeptide capture and liquid chromatography mass spectrometry. Mol Cell Proteomics 4,
32 24. Blagoev, B., Ong, S. E., Kratchmarova, I., and Mann, M. (2004) Temporal analysis of phosphotyrosine-dependent signaling networks by quantitative proteomics. Nat Biotechnol 22, Li, X. J., Pedrioli, P. G., Eng, J., Martin, D., Yi, E. C., Lee, H., and Aebersold, R. (2004) A tool to visualize and evaluate data obtained by liquid chromatographyelectrospray ionization-mass spectrometry. Anal Chem 76, Wang, W., Zhou, H., Lin, H., Roy, S., Shaler, T. A., Hill, L. R., Norton, S., Kumar, P., Anderle, M., and Becker, C. H. (2003) Quantification of proteins and metabolites by mass spectrometry without isotopic labeling or spiked standards. Anal Chem 75, Radulovic, D., Jelveh, S., Ryu, S., Hamilton, T. G., Foss, E., Mao, Y., and Emili, A. (2004) Informatics platform for global proteomic profiling and biomarker discovery using liquid chromatography-tandem mass spectrometry. Mol Cell Proteomics 3, Bondarenko, P. V., Chelius, D., and Shaler, T. A. (2002) Identification and relative quantitation of protein mixtures by enzymatic digestion followed by capillary reversed-phase liquid chromatography-tandem mass spectrometry. Anal Chem 74, Eisen, M. B., Spellman, P. T., Brown, P. O., and Botstein, D. (1998) Cluster analysis and display of genome-wide expression patterns. Proc Natl Acad Sci U S A 95,
33 30. Zhang, H., Li, X. J., Martin, D. B., and Aebersold, R. (2003) Identification and quantification of N-linked glycoproteins using hydrazide chemistry, stable isotope labeling and mass spectrometry. Nat Biotechnol 21, Pedrioli, P. G., Eng, J. K., Hubley, R., Vogelzang, M., Deutsch, E. W., Raught, B., Pratt, B., Nilsson, E., Angeletti, R. H., Apweiler, R., Cheung, K., Costello, C. E., Hermjakob, H., Huang, S., Julian, R. K., Kapp, E., McComb, M. E., Oliver, S. G., Omenn, G., Paton, N. W., Simpson, R., Smith, R., Taylor, C. F., Zhu, W., and Aebersold, R. (2004) A common open representation of mass spectrometry data and its application to proteomics research. Nat Biotechnol 22, Mallat, S. G. (1989) A theory for multidirectional signal decomposition: the wavelet representation. IEEE Trans. Pattern Anal. Machine Intell. 11, Coifman, R. R., and Donoho, D. L Translation-Invariant De-Noising, p In A. Antoniadis and G. Oppenheim (ed.), Wavelets and Statistics. Springer- Verlag, New York. 34. Senko, M. W., Beu, S. C., and McLafferty, F. W. (1995) Determination of Monoisotopic Masses and Ion Populations for Large Biomolecules from Resolved Isotopic Distributions. J Am Soc Mass Spectrom 6, Wehofsky, M., Hoffmann, R., Hubert, M., and Spengler, B. (2001) Isotopic deconvoluation of matrix-assisted laser desorption/ionization mass spectra for substance-class specific analysis of complex samples. Eur J Mass Spectrom 7, Li, Y., and Cole, R. B. (2003) Shifts in peptide and protein charge state distributions with varying spray tip orifice diameter in nanoelectrospray Fourier transform ion cyclotron resonance mass spectrometry. Anal Chem 75,
34 37. Teshima, G., Porter, J., Yim, K., Ling, V., and Guzzetta, A. (1991) Deamidation of soluble CD4 at asparagine-52 results in reduced binding capacity for the HIV-1 envelope glycoprotein gp120. Biochemistry 30, Yin, H., Killeen, K., Brennen, R., Sobek, D., Werlich, M., and van de Goor, T. (2005) Microfluidic chip for peptide analysis with an integrated HPLC column, sample enrichment column, and nanoelectrospray tip. Anal Chem 77, Syka, J. E., Marto, J. A., Bai, D. L., Horning, S., Senko, M. W., Schwartz, J. C., Ueberheide, B., Garcia, B., Busby, S., Muratore, T., Shabanowitz, J., and Hunt, D. F. (2004) Novel linear quadrupole ion trap/ft mass spectrometer: performance characterization and use in the comparative analysis of histone H3 post-translational modifications. J Proteome Res 3,
35 Figure Legends Figure 1. Flowchart for generating a peptide array from a set of LC-MS data. The software tools for specific functions are listed above the functions in italic. Figure 2. Pep3D images of an LC-MS data. All Pep3D images were generated from same data and with same parameters. On the top panel are Pep3D images of the whole data range. On the bottom panel are Pep3D images of a zoomed data range. (A) Pep3D images generated from raw profiling MS spectra. (B) Pep3D images generated from denoised, centroid spectra. (C) Pep3D images overlaid with extracted peptide features. The color of the box indicates the signal-to-ratio of the corresponding peptide feature. Figure 3. (A) Retention time of aligned peptide features in two LC-MS runs and the corresponding retention time calibration curve between the two runs. The retention time correlation between the two runs is (B) Intensity of aligned peptide features in the same two LC-MS runs as in (A). Data with alignment p < 0. 5 are plotted in green while data with p > 0. 5 are in red. The intensity correlation between the two runs is The data are fitted well with log10 ( y ) = * log10 ( x) (C) A small section of the peptide array that was generated from four repeat LC-MS analyses of same glycopeptide sample. The peptide array was output in the same format as that of microarrays (29). Individual peptide features are specified by their mass-to-charge ratio, retention time (in minutes), mono-isotopic mass, and charge state. The EWEIGHT (GWEIGHT) specifies the weight of individual experiments (aligned peptide features) in 35
36 a clustering analysis and was calculated as the averaged, alignment p value from all peptides belonging to the corresponding experiments (unique peptide features). (D) The coefficient of variation (CV) distribution of the relative abundance of peptide features that were aligned in the four repeat LC-MS analyses of same glycopeptide sample. Figure 4. Four Pep3D images that were generated from LC-MS data collected from serum samples of different mice. Figure 5. (A) The coefficient of variation (CV) distribution of the relative abundance of peptide features that were aligned in serum samples of all (red), male (blue) or female (green) mice in the mouse serum study, as evaluated from the 5/5 or 5/5 peptide array listed in Table II. (B) A section of the results from an unsupervised clustering analysis of the 5/5 or 5/5 peptide array listed in Table II. The relative abundances of same peptide feature in different samples are plotted in a row, while the relative abundances of different peptide features of same sample are plotted in a column. The red indicates a relative abundance above 1 and the green below 1. The gray indicates missing data. (C) Same as (B) with the exception that missing data were replaced with a tenth of the lowest relative abundance within the peptide array (0.03). Figure 6. An example of peptide features that distinguish male mice from female mice. (A) Pep3D images zoomed around the most discriminatory peptide feature, which is circled in the images. All Pep3D images were generated with the same gray scale so that the relative abundance of the peptide feature in different samples is directly reflected by 36
37 the darkness of the feature. (B) The relative abundance of the most discriminatory feature in all samples. 37
38 Table I. Number of peptide features detected from N-linked glycopeptide samples of mouse sera. Sample Average SD a %CV b Male Female a SD, standard deviation b CV, coefficient of variation 38
39 Table II. Number of peptide features that were aligned to a specific number of samples when different feature selection criteria were applied to generate a peptide array from LC-MS data of mouse sera. The criteria specify the minimal number of samples that a peptide feature must be aligned to before being selected as an entry in the peptide array. Criterion Number of samples Total %Blank /10 a /10 a /5 or 2/5 b /5 or 5/5 b a 2 (5) out of the 10 samples of both male and female mice. b 2 (5) out of the 5 samples of male mice or 2 (5) out of the 5 samples of female mice. 39
40 Collect LC-ESI-MS data Pep3D Evaluate data quality mzxml2dat Process raw data PepList Extract peptide features PepMatch Align peptides across samples PepArray Generate peptide array Figure 1. 40

41 A B C Figure 2. 41
42 A B C UID NAME GWEIGHT RUN 1 RUN 2 RUN 3 RUN 4 EWEIGHT ( , , , 1) ( , , , 1) ( , , , 2) ( , , , 1) ( , , , 1) ( , , , 4) ( , , , 1) ( , , , 2) ( , , , 2) ( , , , 2) ( , , , 1) ( , , , 1) ( , , , 3) ( , , , 3) ( , , , 1) ( , , , 2) ( , , , 3) ( , , , 2) ( , , , 3) ( , , , 2) D Figure 3. 42

43 female 1 female 5 male 1 male 5 Figure 4. 43
44 A B C Figure 5. 44
45 A female 1 female 2 female 3 female 4 female 5 m/z male 1 male 2 male 3 male 4 male 5 retention time (min) B 2 relative abundance female 1 female 2 female 3 female 4 female 5 male 1 male 2 male 3 male 4 male 5 sample Figure 6. 45

46 A B C D m/z Figure S1. (A) A full raw MS spectrum in profiling mode. (B) A section of the MS spectrum in (A). The raw spectrum is plotted in red, the smooth spectrum in green, the centroid spectrum in blue, and the local background in cyan. (C) Same as (B) with the exception that only the raw spectrum (in red) and the final denoised, centroid spectrum (in blue) are plotted. (D) The final denoised, centroid spectrum obtained from the raw spectrum in (A). 46
47 A Binary file format: ScanNumber Header 1 Header N (m/z) 11 (m/z) 1i Intensity 11 Intensity 1i (S/N) 11 (S/N) 1i (m/z) N1 (m/z) Nk intensity N1 intensity Nk (S/N) N1 (S/N) Nk FilePath PathLength B Spectrum header structure: long scan int type float mass int charge float time float ce int size long offset Figure S2. (A) Structure of the mzdat binary file format for LC-MS data. In the following, long, int, char, and float indicate data type. In the mzdat file format, the total number of scans in the LC-MS analysis (ScanNumber, long) is written first. Headers of all spectra (Header n, structure, described in (B)) are then written sequentially, which is followed by sequential writing of all spectra. For each spectrum, the m / z values (float) of MS signals are written first, then signal intensities (float), then signal-to-noise ratios (float). After writing all spectra, the full path (FilePath, char []) of the mzxml file from which the denoised, centroid data is extracted is written. In the end, the length (PathLenght, int) of the mzxml file path is written. (B) Spectrum header structure. Here scan is the scan number, type is the spectrum type (type = 1 for MS spectrum, 2 for MS/MS spectrum, etc.), mass is the neutral mass of the precursor ion for MS/MS spectrum (0 for MS spectrum, m / z if the charge of the precursor ion cannot be determined), charge is the charge of the precursor ion (-1 if it cannot be determined or if the spectrum is a MS spectrum), time is the scan time (in minutes), ce is the collision energy used in acquiring the spectrum, size is the total number of MS signals, and offset is the starting position of the corresponding spectrum within the file. 47
48 A B C D Figure S3. The coefficient of variation (CV) distribution of the relative abundance of peptide features that were aligned in serum samples of all (red), male (blue) or female (green) mice in the mouse serum study, as evaluated from (A) the 2/10, (B) the 5/10, (C) the 2/5 or 2/5, and (D) the 5/5 or 5/5 peptide array listed in Table II. (D) is same as Figure 5A. 48
 the")


49 A1 B1 C1 D1 A2 B2 C2 D2 Figure S4. A section of the results from an unsupervised clustering analysis of (A) the 2/10, (B) the 5/10, (C) the 2/5 or 2/5, and (D) the 5/5 or 5/5 peptide array listed in Table II. The relative abundances of same peptide feature in different samples are plotted in a row, while the relative abundances of different peptide features of same sample are plotted in a column. The red indicates a relative abundance above 1 and the green below 1. The gray indicates missing data. In the upper panel, no action was taken on missing data in the corresponding peptide arrays. In the lower panel, missing data were replaced with a tenth of the lowest relative abundance within the corresponding peptide array. (D1) is same as Figure 5B and (D2) as Figure 5C. 49

50 A female 1 female 2 female 3 female 4 female 5 m/z male 1 male 2 male 3 male 4 male 5 retention time (min) B relative abundance C relative abundance female 1 female 2 female 3 female 4 female 5 male 1 male 2 male 3 male 4 male 5 female 1 female 2 female 3 female 4 female 5 male 1 male 2 male 3 male 4 male 5 sample sample Figure S5. Two examples of peptide features that distinguish male mice from female mice. (A) Pep3D images zoomed around the two discriminatory peptide features. The second most discriminatory peptide feature is circled in the images while the third is boxed. All Pep3D images were generated with the same gray scale so that the relative abundance of the peptide features in different samples is directly reflected by the darkness of the features. (B) The relative abundance of the second most discriminatory feature in all samples. (C) The relative abundance of the third most discriminatory feature in all samples. 50
Isotopic-Labeling and Mass Spectrometry-Based Quantitative Proteomics
 Isotopic-Labeling and Mass Spectrometry-Based Quantitative Proteomics Xiao-jun Li, Ph.D. Current address: Homestead Clinical Day 4 October 19, 2006 Protein Quantification LC-MS/MS Data XLink mzxml file
Towards the Prediction of Protein Abundance from Tandem Mass Spectrometry Data
 Towards the Prediction of Protein Abundance from Tandem Mass Spectrometry Data Anthony J Bonner Han Liu Abstract This paper addresses a central problem of Proteomics: estimating the amounts of each of
PeptideProphet: Validation of Peptide Assignments to MS/MS Spectra. Andrew Keller
 PeptideProphet: Validation of Peptide Assignments to MS/MS Spectra Andrew Keller Outline Need to validate peptide assignments to MS/MS spectra Statistical approach to validation Running PeptideProphet
Computational Methods for Mass Spectrometry Proteomics
 Computational Methods for Mass Spectrometry Proteomics Eidhammer, Ingvar ISBN-13: 9780470512975 Table of Contents Preface. Acknowledgements. 1 Protein, Proteome, and Proteomics. 1.1 Primary goals for studying
profileanalysis Innovation with Integrity Quickly pinpointing and identifying potential biomarkers in Proteomics and Metabolomics research
 profileanalysis Quickly pinpointing and identifying potential biomarkers in Proteomics and Metabolomics research Innovation with Integrity Omics Research Biomarker Discovery Made Easy by ProfileAnalysis
Quan%ta%on with XPRESS. and. ASAPRa%o
 Quan%ta%on with XPRESS and ASAPRa%o 1 Pep%de and Protein Quan%ta%on Raw Mass Spec Data Pep%de Iden%fica%on Pep%de Valida%on Quan%ta%on Protein Assignment Protein List msconvert X!Tandem SpectraST SEQUEST*
Designed for Accuracy. Innovation with Integrity. High resolution quantitative proteomics LC-MS
 Designed for Accuracy High resolution quantitative proteomics Innovation with Integrity LC-MS Setting New Standards in Accuracy The development of mass spectrometry based proteomics approaches has dramatically
Overview - MS Proteomics in One Slide. MS masses of peptides. MS/MS fragments of a peptide. Results! Match to sequence database
 Overview - MS Proteomics in One Slide Obtain protein Digest into peptides Acquire spectra in mass spectrometer MS masses of peptides MS/MS fragments of a peptide Results! Match to sequence database 2 But
Methods for proteome analysis of obesity (Adipose tissue)
") Methods for proteome analysis of obesity (Adipose tissue) I. Sample preparation and liquid chromatography-tandem mass spectrometric analysis Instruments, softwares, and materials AB SCIEX Triple TOF 5600
Methods for proteome analysis of obesity (Adipose tissue) I. Sample preparation and liquid chromatography-tandem mass spectrometric analysis Instruments, softwares, and materials AB SCIEX Triple TOF 5600
Protein Quantitation II: Multiple Reaction Monitoring. Kelly Ruggles New York University
 Protein Quantitation II: Multiple Reaction Monitoring Kelly Ruggles kelly@fenyolab.org New York University Traditional Affinity-based proteomics Use antibodies to quantify proteins Western Blot RPPA Immunohistochemistry
Biological Mass Spectrometry
 Biochemistry 412 Biological Mass Spectrometry February 13 th, 2007 Proteomics The study of the complete complement of proteins found in an organism Degrees of Freedom for Protein Variability Covalent Modifications
BIOINF 4120 Bioinformatics 2 - Structures and Systems - Oliver Kohlbacher Summer Systems Biology Exp. Methods
 BIOINF 4120 Bioinformatics 2 - Structures and Systems - Oliver Kohlbacher Summer 2013 14. Systems Biology Exp. Methods Overview Transcriptomics Basics of microarrays Comparative analysis Interactomics:
High-Throughput Protein Quantitation Using Multiple Reaction Monitoring
 High-Throughput Protein Quantitation Using Multiple Reaction Monitoring Application Note Authors Ning Tang, Christine Miller, Joe Roark, Norton Kitagawa and Keith Waddell Agilent Technologies, Inc. Santa
Protein Quantitation II: Multiple Reaction Monitoring. Kelly Ruggles New York University
 Protein Quantitation II: Multiple Reaction Monitoring Kelly Ruggles kelly@fenyolab.org New York University Traditional Affinity-based proteomics Use antibodies to quantify proteins Western Blot Immunohistochemistry
TANDEM MASS SPECTROSCOPY
 TANDEM MASS SPECTROSCOPY 1 MASS SPECTROMETER TYPES OF MASS SPECTROMETER PRINCIPLE TANDEM MASS SPECTROMETER INSTRUMENTATION QUADRAPOLE MASS ANALYZER TRIPLE QUADRAPOLE MASS ANALYZER TIME OF FLIGHT MASS ANALYSER
Quantitation of a target protein in crude samples using targeted peptide quantification by Mass Spectrometry
 Quantitation of a target protein in crude samples using targeted peptide quantification by Mass Spectrometry Jon Hao, Rong Ye, and Mason Tao Poochon Scientific, Frederick, Maryland 21701 Abstract Background:
Improved 6- Plex TMT Quantification Throughput Using a Linear Ion Trap HCD MS 3 Scan Jane M. Liu, 1,2 * Michael J. Sweredoski, 2 Sonja Hess 2 *
 Improved 6- Plex TMT Quantification Throughput Using a Linear Ion Trap HCD MS 3 Scan Jane M. Liu, 1,2 * Michael J. Sweredoski, 2 Sonja Hess 2 * 1 Department of Chemistry, Pomona College, Claremont, California
Tandem mass spectra were extracted from the Xcalibur data system format. (.RAW) and charge state assignment was performed using in house software
 and charge state assignment was performed using in house software") Supplementary Methods Software Interpretation of Tandem mass spectra Tandem mass spectra were extracted from the Xcalibur data system format (.RAW) and charge state assignment was performed using in house
Supplementary Methods Software Interpretation of Tandem mass spectra Tandem mass spectra were extracted from the Xcalibur data system format (.RAW) and charge state assignment was performed using in house
PesticideScreener. Innovation with Integrity. Comprehensive Pesticide Screening and Quantitation UHR-TOF MS
 PesticideScreener Comprehensive Pesticide Screening and Quantitation Innovation with Integrity UHR-TOF MS The Challenge of Comprehensive Pesticide Residue Analysis The use of pesticides to reduce crop
Advances in quantitative proteomics using stable isotope tags
 Advances in quantitative proteomics using stable isotope tags Mark R. Flory, Timothy J. Griffin, Daniel Martin and Ruedi Aebersold A great deal of current biological and clinical research is directed at
WADA Technical Document TD2015IDCR
 MINIMUM CRITERIA FOR CHROMATOGRAPHIC-MASS SPECTROMETRIC CONFIRMATION OF THE IDENTITY OF ANALYTES FOR DOPING CONTROL PURPOSES. The ability of a method to identify an analyte is a function of the entire
Identification of proteins by enzyme digestion, mass
 Method for Screening Peptide Fragment Ion Mass Spectra Prior to Database Searching Roger E. Moore, Mary K. Young, and Terry D. Lee Beckman Research Institute of the City of Hope, Duarte, California, USA
Chemical Labeling Strategy for Generation of Internal Standards for Targeted Quantitative Proteomics
 Chemical Labeling Strategy for Generation of Internal Standards for Targeted Quantitative Proteomics mtraq Reagents Triplex Christie Hunter, Brian Williamson, Marjorie Minkoff AB SCIEX, USA The utility
All Ions MS/MS: Targeted Screening and Quantitation Using Agilent TOF and Q-TOF LC/MS Systems
 All Ions MS/MS: Targeted Screening and Quantitation Using Agilent TOF and Q-TOF LC/MS Systems Technical Overview Introduction All Ions MS/MS is a technique that is available for Agilent high resolution
Comprehensive support for quantitation
 Comprehensive support for quantitation One of the major new features in the current release of Mascot is support for quantitation. This is still work in progress. Our goal is to support all of the popular
Analysis of Labeled and Non-Labeled Proteomic Data Using Progenesis QI for Proteomics
 Analysis of Labeled and Non-Labeled Proteomic Data Using Progenesis QI for Proteomics Lee Gethings, Gushinder Atwal, Martin Palmer, Chris Hughes, Hans Vissers, and James Langridge Waters Corporation, Wilmslow,
Tutorial 1: Setting up your Skyline document
 Tutorial 1: Setting up your Skyline document Caution! For using Skyline the number formats of your computer have to be set to English (United States). Open the Control Panel Clock, Language, and Region
Key questions of proteomics. Bioinformatics 2. Proteomics. Foundation of proteomics. What proteins are there? Protein digestion
 s s Key questions of proteomics What proteins are there? Bioinformatics 2 Lecture 2 roteomics How much is there of each of the proteins? - Absolute quantitation - Stoichiometry What (modification/splice)
PROTEIN SEQUENCING AND IDENTIFICATION USING TANDEM MASS SPECTROMETRY
 PROTEIN SEQUENCING AND IDENTIFICATION USING TANDEM MASS SPECTROMETRY Michael Kinter Department of Cell Biology Lerner Research Institute Cleveland Clinic Foundation Nicholas E. Sherman Department of Microbiology
Guide to Peptide Quantitation. Agilent clinical research
 Guide to Peptide Quantitation Agilent clinical research Peptide Quantitation for the Clinical Research Laboratory Peptide quantitation is rapidly growing in clinical research as scientists are translating
HOWTO, example workflow and data files. (Version )
") HOWTO, example workflow and data files. (Version 20 09 2017) 1 Introduction: SugarQb is a collection of software tools (Nodes) which enable the automated identification of intact glycopeptides from HCD
HOWTO, example workflow and data files. (Version 20 09 2017) 1 Introduction: SugarQb is a collection of software tools (Nodes) which enable the automated identification of intact glycopeptides from HCD
LECTURE-11. Hybrid MS Configurations HANDOUT. As discussed in our previous lecture, mass spectrometry is by far the most versatile
 LECTURE-11 Hybrid MS Configurations HANDOUT PREAMBLE As discussed in our previous lecture, mass spectrometry is by far the most versatile technique used in proteomics. We had also discussed some of the
SEAMLESS INTEGRATION OF MASS DETECTION INTO THE UV CHROMATOGRAPHIC WORKFLOW
 SEAMLESS INTEGRATION OF MASS DETECTION INTO THE UV CHROMATOGRAPHIC WORKFLOW Paula Hong, John Van Antwerp, and Patricia McConville Waters Corporation, Milford, MA, USA Historically UV detection has been
Electrospray ionization mass spectrometry (ESI-
 Automated Charge State Determination of Complex Isotope-Resolved Mass Spectra by Peak-Target Fourier Transform Li Chen a and Yee Leng Yap b a Bioinformatics Institute, 30 Biopolis Street, Singapore b Davos
Modeling Mass Spectrometry-Based Protein Analysis
 Chapter 8 Jan Eriksson and David Fenyö Abstract The success of mass spectrometry based proteomics depends on efficient methods for data analysis. These methods require a detailed understanding of the information
Mass Spectrometry and Proteomics - Lecture 5 - Matthias Trost Newcastle University
 Mass Spectrometry and Proteomics - Lecture 5 - Matthias Trost Newcastle University matthias.trost@ncl.ac.uk Previously Proteomics Sample prep 144 Lecture 5 Quantitation techniques Search Algorithms Proteomics
Agilent MassHunter Profinder: Solving the Challenge of Isotopologue Extraction for Qualitative Flux Analysis
 Agilent MassHunter Profinder: Solving the Challenge of Isotopologue Extraction for Qualitative Flux Analysis Technical Overview Introduction Metabolomics studies measure the relative abundance of metabolites
Data pre-processing in liquid chromatography mass spectrometry-based proteomics
 BIOINFORMATICS ORIGINAL PAPER Vol. 21 no. 21 25, pages 454 459 doi:1.193/bioinformatics/bti66 Data and text mining Data pre-processing in liquid chromatography mass spectrometry-based proteomics Xiang
Multi-residue analysis of pesticides by GC-HRMS
 An Executive Summary Multi-residue analysis of pesticides by GC-HRMS Dr. Hans Mol is senior scientist at RIKILT- Wageningen UR Introduction Regulatory authorities throughout the world set and enforce strict
Proteomics. November 13, 2007
 Proteomics November 13, 2007 Acknowledgement Slides presented here have been borrowed from presentations by : Dr. Mark A. Knepper (LKEM, NHLBI, NIH) Dr. Nathan Edwards (Center for Bioinformatics and Computational
WADA Technical Document TD2003IDCR
 IDENTIFICATION CRITERIA FOR QUALITATIVE ASSAYS INCORPORATING CHROMATOGRAPHY AND MASS SPECTROMETRY The appropriate analytical characteristics must be documented for a particular assay. The Laboratory must
Mass spectrometry-based proteomics has become
 FOCUS: THE ORBITRAP Computational Principles of Determining and Improving Mass Precision and Accuracy for Proteome Measurements in an Orbitrap Jürgen Cox and Matthias Mann Proteomics and Signal Transduction,
TargetScreener. Innovation with Integrity. A Comprehensive Screening Solution for Forensic Toxicology UHR-TOF MS
 TargetScreener A Comprehensive Screening Solution for Forensic Toxicology Innovation with Integrity UHR-TOF MS TargetScreener Get the Complete Picture Forensic laboratories are frequently required to perform
Performing Peptide Bioanalysis Using High Resolution Mass Spectrometry with Target Enhancement MRM Acquisition
 Performing Peptide Bioanalysis Using High Resolution Mass Spectrometry with Target Enhancement MRM Acquisition Yun Wang Alelyunas, Mark D. Wrona, and Nick Tomczyk Waters Corporation, Milford, MA, USA GOAL
Maximizing Triple Quadrupole Mass Spectrometry Productivity with the Agilent StreamSelect LC/MS System
 Maximizing Triple Quadrupole Mass Spectrometry Productivity with the Agilent StreamSelect LC/MS System Application Note Authors Kevin McCann, Sameer Nene, Doug McIntyre, Edmond Neo, Dennis Nagtalon, and
Last updated: Copyright
 Last updated: 2012-08-20 Copyright 2004-2012 plabel (v2.4) User s Manual by Bioinformatics Group, Institute of Computing Technology, Chinese Academy of Sciences Tel: 86-10-62601016 Email: zhangkun01@ict.ac.cn,
LECTURE-13. Peptide Mass Fingerprinting HANDOUT. Mass spectrometry is an indispensable tool for qualitative and quantitative analysis of
 LECTURE-13 Peptide Mass Fingerprinting HANDOUT PREAMBLE Mass spectrometry is an indispensable tool for qualitative and quantitative analysis of proteins, drugs and many biological moieties to elucidate
PeptideProphet: Validation of Peptide Assignments to MS/MS Spectra
 PeptideProphet: Validation of Peptide Assignments to MS/MS Spectra Andrew Keller Day 2 October 17, 2006 Andrew Keller Rosetta Bioinformatics, Seattle Outline Need to validate peptide assignments to MS/MS
Bruker Daltonics. EASY-nLC. Tailored HPLC for nano-lc-ms Proteomics. Nano-HPLC. think forward
 Bruker Daltonics EASY-nLC Tailored HPLC for nano-lc-ms Proteomics think forward Nano-HPLC World-Class Performance with a Small Footprint Bruker Daltonics presents a nano-lc system, perfectly integrated
Developing Algorithms for the Determination of Relative Abundances of Peptides from LC/MS Data
 Developing Algorithms for the Determination of Relative Abundances of Peptides from LC/MS Data RIPS Team Jake Marcus (Project Manager) Anne Eaton Melanie Kanter Aru Ray Faculty Mentors Shawn Cokus Matteo
NPTEL VIDEO COURSE PROTEOMICS PROF. SANJEEVA SRIVASTAVA
 LECTURE-25 Quantitative proteomics: itraq and TMT TRANSCRIPT Welcome to the proteomics course. Today we will talk about quantitative proteomics and discuss about itraq and TMT techniques. The quantitative
MS-based proteomics to investigate proteins and their modifications
 MS-based proteomics to investigate proteins and their modifications Francis Impens VIB Proteomics Core October th 217 Overview Mass spectrometry-based proteomics: general workflow Identification of protein
Overview. Introduction. André Schreiber 1 and Yun Yun Zou 1 1 AB SCIEX, Concord, Ontario, Canada
 LC-MS/MS Based Strategy for the Non-Targeted Screening of an Unlimited Number of Contaminants in Food Using the AB SCIEX TripleTOF 5600 System and Advanced Software Tools André Schreiber 1 and Yun Yun
Mass spectrometry has been used a lot in biology since the late 1950 s. However it really came into play in the late 1980 s once methods were
 Mass spectrometry has been used a lot in biology since the late 1950 s. However it really came into play in the late 1980 s once methods were developed to allow the analysis of large intact (bigger than
Aplicació de la proteòmica a la cerca de Biomarcadors proteics Barcelona, 08 de Juny 2010
 Aplicació de la proteòmica a la cerca de Biomarcadors proteics Barcelona, 8 de Juny 21 Eliandre de Oliveira Plataforma de Proteòmica Parc Científic de Barcelona Protein Chemistry Proteomics Hypothesis-free
Analysis of Peptide MS/MS Spectra from Large-Scale Proteomics Experiments Using Spectrum Libraries
 Anal. Chem. 2006, 78, 5678-5684 Analysis of Peptide MS/MS Spectra from Large-Scale Proteomics Experiments Using Spectrum Libraries Barbara E. Frewen, Gennifer E. Merrihew, Christine C. Wu, William Stafford
Tips & Tricks GPC/SEC: Quantify and Get More Than Molar Mass Averages
 Tips & Tricks GPC/SEC: Quantify and Get More Than Molar Mass Averages Daniela Held, PSS Polymer Standards Service GmbH, Mainz, Germany Gel permeation chromatography/size-exclusion chromatography (GPC/SEC)
Chemometrics. Classification of Mycobacteria by HPLC and Pattern Recognition. Application Note. Abstract
 12-1214 Chemometrics Application Note Classification of Mycobacteria by HPLC and Pattern Recognition Abstract Mycobacteria include a number of respiratory and non-respiratory pathogens for humans, such
Translational Biomarker Core
 Translational Biomarker Core Instrumentation Thermo Scientific TSQ Quantum Triple Quadrupole Mass Spectrometers. There are two TSQ Quantum Ultra AM instruments available in the TBC. The TSQ Quantum Ultra
Fundamentals of Mass Spectrometry. Fundamentals of Mass Spectrometry. Learning Objective. Proteomics
 Mass spectrometry (MS) is the technique for protein identification and analysis by production of charged molecular species in vacuum, and their separation by magnetic and electric fields based on mass
Quantitative Proteomics
 Quantitative Proteomics Quantitation AND Mass Spectrometry Condition A Condition B Identify and quantify differently expressed proteins resulting from a change in the environment (stimulus, disease) Lyse
The Power of LC MALDI: Identification of Proteins by LC MALDI MS/MS Using the Applied Biosystems 4700 Proteomics Analyzer with TOF/TOF Optics
 APPLICATION NOTE TOF MS The Power of LC MALDI: Identification of Proteins by LC MALDI MS/MS Using the Applied Biosystems 4700 Proteomics Analyzer with TOF/TOF Optics Purpose The Applied Biosystems 4700
Live Webinar : How to be more Successful with your ACQUITY QDa Detector?
 Live Webinar : How to be more Successful with your ACQUITY QDa Detector? Q&A Transcript ---------------- Q - How do you generate multiple charges reproductively? A - If you use the same settings on the
DIA-Umpire: comprehensive computational framework for data independent acquisition proteomics
 DIA-Umpire: comprehensive computational framework for data independent acquisition proteomics Chih-Chiang Tsou 1,2, Dmitry Avtonomov 2, Brett Larsen 3, Monika Tucholska 3, Hyungwon Choi 4 Anne-Claude Gingras
Peptide Targeted Quantification By High Resolution Mass Spectrometry A Paradigm Shift? Zhiqi Hao Thermo Fisher Scientific San Jose, CA
 Peptide Targeted Quantification By High Resolution Mass Spectrometry A Paradigm Shift? Zhiqi Hao Thermo Fisher Scientific San Jose, CA Proteomics is Turning Quantitative Hmmm.. Which ones are my targets?
Qualitative Proteomics (how to obtain high-confidence high-throughput protein identification!)
") Qualitative Proteomics (how to obtain high-confidence high-throughput protein identification!) James A. Mobley, Ph.D. Director of Research in Urology Associate Director of Mass Spectrometry (contact: mobleyja@uab.edu)
Qualitative Proteomics (how to obtain high-confidence high-throughput protein identification!) James A. Mobley, Ph.D. Director of Research in Urology Associate Director of Mass Spectrometry (contact: mobleyja@uab.edu)
for the Novice Mass Spectrometry (^>, John Greaves and John Roboz yc**' CRC Press J Taylor & Francis Group Boca Raton London New York
 Mass Spectrometry for the Novice John Greaves and John Roboz (^>, yc**' CRC Press J Taylor & Francis Group Boca Raton London New York CRC Press is an imprint of the Taylor & Francis Croup, an informa business
Yun W. Alelyunas, Mark D. Wrona, Russell J. Mortishire-Smith, Nick Tomczyk, and Paul D. Rainville Waters Corporation, Milford, MA, USA INTRODUCTION
 Quantitation by High Resolution Mass Spectrometry: Using Target Enhancement and Tof-MRM to Achieve Femtogram-level On-column Sensitivity for Quantitation of Drugs in Human Plasma Yun W. Alelyunas, Mark
Quantitation of High Resolution MS Data Using UNIFI: Acquiring and Processing Full Scan or Tof-MRM (Targeted HRMS) Datasets for Quantitative Assays
 Datasets for Quantitative Assays") : Acquiring and Processing Full Scan or Tof-MRM (Targeted HRMS) Datasets for Quantitative Assays Mark Wrona, Jayne Kirk, and Yun Alelyunas Waters Corporation, Milford, MA, USA APPLICATION BENEFITS Ability
: Acquiring and Processing Full Scan or Tof-MRM (Targeted HRMS) Datasets for Quantitative Assays Mark Wrona, Jayne Kirk, and Yun Alelyunas Waters Corporation, Milford, MA, USA APPLICATION BENEFITS Ability
Introduction. Chapter 1. Learning Objectives
 Chapter 1 Introduction Learning Objectives To understand the need to interface liquid chromatography and mass spectrometry. To understand the requirements of an interface between liquid chromatography
ALIGNMENT OF LC-MS DATA USING PEPTIDE FEATURES. A Thesis XINCHENG TANG
 ALIGNMENT OF LC-MS DATA USING PEPTIDE FEATURES A Thesis by XINCHENG TANG Submitted to the Office of Graduate Studies of Texas A&M University in partial fulfillment of the requirements for the degree of
Self-assembling covalent organic frameworks functionalized. magnetic graphene hydrophilic biocomposite as an ultrasensitive
 Electronic Supplementary Material (ESI) for Nanoscale. This journal is The Royal Society of Chemistry 2017 Electronic Supporting Information for: Self-assembling covalent organic frameworks functionalized
Yifei Bao. Beatrix. Manor Askenazi
 Detection and Correction of Interference in MS1 Quantitation of Peptides Using their Isotope Distributions Yifei Bao Department of Computer Science Stevens Institute of Technology Beatrix Ueberheide Department
Atomic masses. Atomic masses of elements. Atomic masses of isotopes. Nominal and exact atomic masses. Example: CO, N 2 ja C 2 H 4
 High-Resolution Mass spectrometry (HR-MS, HRAM-MS) (FT mass spectrometry) MS that enables identifying elemental compositions (empirical formulas) from accurate m/z data 9.05.2017 1 Atomic masses (atomic
Effective desalting and concentration of in-gel digest samples with Vivapure C18 Micro spin columns prior to MALDI-TOF analysis.
 Introduction The identification of proteins plays an important role in today s pharmaceutical and proteomics research. Commonly used methods for separating proteins from complex samples are 1D or 2D gels.
Canonical Correlation, an Approximation, and the Prediction of Protein Abundance
 Canonical Correlation, an Approximation, and the Prediction of Protein Abundance Anthony Bonner Han Liu Abstract This paper addresses a central problem of Bioinformatics and Proteomics: estimating the
Analytical determination of testosterone in human serum using an Agilent Ultivo Triple Quadrupole LC/MS
 Application Note Clinical Research Analytical determination of testosterone in human serum using an Agilent Ultivo Triple Quadrupole LC/MS Authors Yanan Yang 1, Victor Mandragon 2, and Peter Stone 1 1
SeqAn and OpenMS Integration Workshop. Temesgen Dadi, Julianus Pfeuffer, Alexander Fillbrunn The Center for Integrative Bioinformatics (CIBI)
") SeqAn and OpenMS Integration Workshop Temesgen Dadi, Julianus Pfeuffer, Alexander Fillbrunn The Center for Integrative Bioinformatics (CIBI) Mass-spectrometry data analysis in KNIME Julianus Pfeuffer,
SeqAn and OpenMS Integration Workshop Temesgen Dadi, Julianus Pfeuffer, Alexander Fillbrunn The Center for Integrative Bioinformatics (CIBI) Mass-spectrometry data analysis in KNIME Julianus Pfeuffer,
RMassBank: Automatic Recalibration and Processing of Tandem HR-MS Spectra for MassBank
 RMassBank: Automatic Recalibration and Processing of Tandem HR-MS Spectra for MassBank Eawag: Swiss Federal Institute of Aquatic Science and Technology Presenting: Emma Schymanski Coauthors: Michael Stravs,
Proteomics: the first decade and beyond. (2003) Patterson and Aebersold Nat Genet 33 Suppl: from
 Patterson and Aebersold Nat Genet 33 Suppl: from") Advances in mass spectrometry and the generation of large quantities of nucleotide sequence information, combined with computational algorithms that could correlate the two, led to the emergence of proteomics
Advances in mass spectrometry and the generation of large quantities of nucleotide sequence information, combined with computational algorithms that could correlate the two, led to the emergence of proteomics
Mass Spectrometry. Hyphenated Techniques GC-MS LC-MS and MS-MS
 Mass Spectrometry Hyphenated Techniques GC-MS LC-MS and MS-MS Reasons for Using Chromatography with MS Mixture analysis by MS alone is difficult Fragmentation from ionization (EI or CI) Fragments from
1. Prepare the MALDI sample plate by spotting an angiotensin standard and the test sample(s).
.") Analysis of a Peptide Sequence from a Proteolytic Digest by MALDI-TOF Post-Source Decay (PSD) and Collision-Induced Dissociation (CID) Standard Operating Procedure Purpose: The following procedure may
Analysis of a Peptide Sequence from a Proteolytic Digest by MALDI-TOF Post-Source Decay (PSD) and Collision-Induced Dissociation (CID) Standard Operating Procedure Purpose: The following procedure may
Peptide Isolation Using the Prep 150 LC System
 Jo-Ann M. Jablonski and Andrew J. Aubin Waters Corporation, Milford, MA, USA APPLICATION BENEFITS The Prep 150 LC System, an affordable, highly reliable system for preparative chromatography, is suitable
PC235: 2008 Lecture 5: Quantitation. Arnold Falick
 PC235: 2008 Lecture 5: Quantitation Arnold Falick falickam@berkeley.edu Summary What you will learn from this lecture: There are many methods to perform quantitation using mass spectrometry (any method
The Theory of HPLC. Quantitative and Qualitative HPLC
 The Theory of HPLC Quantitative and Qualitative HPLC i Wherever you see this symbol, it is important to access the on-line course as there is interactive material that cannot be fully shown in this reference
High-Field Orbitrap Creating new possibilities
 Thermo Scientific Orbitrap Elite Hybrid Mass Spectrometer High-Field Orbitrap Creating new possibilities Ultrahigh resolution Faster scanning Higher sensitivity Complementary fragmentation The highest
(Refer Slide Time 00:09) (Refer Slide Time 00:13)
 (Refer Slide Time 00:13)") (Refer Slide Time 00:09) Mass Spectrometry Based Proteomics Professor Sanjeeva Srivastava Department of Biosciences and Bioengineering Indian Institute of Technology, Bombay Mod 02 Lecture Number 09 (Refer
(Refer Slide Time 00:09) Mass Spectrometry Based Proteomics Professor Sanjeeva Srivastava Department of Biosciences and Bioengineering Indian Institute of Technology, Bombay Mod 02 Lecture Number 09 (Refer
Rapid and Accurate Forensics Analysis using High Resolution All Ions MS/MS
 Rapid and Accurate Forensics Analysis using High Resolution All Ions MS/MS Application Note Forensic Toxicology Authors Martin Josefsson, and Markus Roman National Board of Forensic Medicine Linköping,
Targeted protein quantification
 Targeted Quantitative Proteomics Targeted protein quantification with high-resolution, accurate-mass MS Highly selective Very sensitive Complex samples HR/AM A more complete quantitative proteomics picture
Overview. Introduction. André Schreiber AB SCIEX Concord, Ontario (Canada)
") Quantitation and Identification of Pharmaceuticals and Personal Care Products (PPCP) in Environmental Samples using Advanced TripleTOF MS/MS Technology André Schreiber AB SCIEX Concord, Ontario (Canada)
Quantitation and Identification of Pharmaceuticals and Personal Care Products (PPCP) in Environmental Samples using Advanced TripleTOF MS/MS Technology André Schreiber AB SCIEX Concord, Ontario (Canada)
BST 226 Statistical Methods for Bioinformatics David M. Rocke. January 22, 2014 BST 226 Statistical Methods for Bioinformatics 1
 BST 226 Statistical Methods for Bioinformatics David M. Rocke January 22, 2014 BST 226 Statistical Methods for Bioinformatics 1 Mass Spectrometry Mass spectrometry (mass spec, MS) comprises a set of instrumental
UCD Conway Institute of Biomolecular & Biomedical Research Graduate Education 2009/2010
 EMERGING PROTEOMIC TECHNOLOGIES - MODULE SCHEDULE & OUTLINE 2010 Course Organiser: Dr. Giuliano Elia Module Co-ordinator: Dr Giuliano Elia Credits: 5 Date & Time Session & Topic Coordinator 14th April
Empirical Statistical Model To Estimate the Accuracy of Peptide Identifications Made by MS/MS and Database Search
 Anal. Chem. 2002, 74, 5383-5392 Empirical Statistical Model To Estimate the Accuracy of Peptide Identifications Made by MS/MS and Database Search Andrew Keller,*, Alexey I. Nesvizhskii,*, Eugene Kolker,
Isotope Dilution Mass Spectrometry
 Isotope Dilution Mass Spectrometry J. Ignacio Garcia Alonso and Pablo Rodriguez-Gonzalez Faculty of Chemistry, University of Oviedo, Oviedo, Spain E-mail: jiga@uniovi.es, rodriguezpablo@uniovi.es RSC Publishing
MassHunter METLIN Metabolite PCD/PCDL Quick Start Guide
 MassHunter METLIN Metabolite PCD/PCDL Quick Start Guide What is the MassHunter METLIN Metabolite PCD/PCDL? 2 Where to find more information 2 Kit Content 3 Installation 5 Before you start 5 Install MassHunter
HR/AM Targeted Peptide Quantitation on a Q Exactive MS: A Unique Combination of High Selectivity, Sensitivity and Throughput
 Application Note: 554 HR/AM Targeted Peptide Quantitation on a Q Exactive MS: A Unique Combination of High Selectivity, Sensitivity and Throughput Yi Zhang 1, Zhiqi Hao 1, Markus Kellmann 2 and Andreas
An Effective Workflow for Impurity Analysis Incorporating High Quality HRAM LCMS & MSMS with Intelligent Automated Data Mining
 An Effective Workflow for Impurity Analysis Incorporating High Quality HRAM LCMS & MSMS with Intelligent Automated Data Mining Dave Weil, Ph.D. and Jim Lau, Ph.D. Typical Method Conditions: 1260 UHPLC
Improved Throughput and Reproducibility for Targeted Protein Quantification Using a New High-Performance Triple Quadrupole Mass Spectrometer
 Improved Throughput and Reproducibility for Targeted Protein Quantification Using a New High-Performance Triple Quadrupole Mass Spectrometer Reiko Kiyonami, Mary Blackburn, Andreas FR Hühme: Thermo Fisher
Making Sense of Differences in LCMS Data: Integrated Tools
 Making Sense of Differences in LCMS Data: Integrated Tools David A. Weil Agilent Technologies MassHunter Overview Page 1 March 2008 How Clean is our Water?... Page 2 Chemical Residue Analysis.... From
FORENSIC TOXICOLOGY SCREENING APPLICATION SOLUTION
 FORENSIC TOXICOLOGY SCREENING APPLICATION SOLUTION A purpose-built collection of the best-inclass components for forensic toxicology Whether you re challenged to present reliable and secure forensic sample