DISSERTATION. Presented in Partial Fulfillment of the Requirements for. the Degree Doctor of Philosophy in the
|
|
|
- Alicia Henderson
- 6 years ago
- Views:
Transcription
1 ZEBRAFISH HDAC1 IS REITERATIVELY AND DIFFERENTIALLY REQUIRED DURING NEURAL CREST CELL DEVELOPMENT AND HDAC1 IS A POSITIVE REGULATOR OF THE NON CANONICAL WNT SIGNALING PATHWAY DISSERTATION Presented in Partial Fulfillment of the Requirements for the Degree Doctor of Philosophy in the Graduate School of The Ohio State University By Myron S. Ignatius, M.S. ***** The Ohio State University 2008 Dissertation Committee: Dr. Paul D. Henion, Advisor Dr. Christine E. Beattie Dr. Heithem El-Hodiri Approved by Advisor Graduate Program in Molecular, Cellular, and Developmental Biology Dr. Amanda S. Simcox
2
3 ABSTRACT The neural crest is a transient embryonic cell population that contributes to multiple cell types in the vertebrate embryo including chromatophores, craniofacial cartilages, neurons and glia of the peripheral nervous system. Neural crest cell (NCC) development has been used extensively to explore mechanisms of cell fate specification, differentiation and migration, which more broadly illuminate mechanisms in the development of multicellular organisms. Through a combination of forward and reverse genetic approaches using mutants, morpholinos and a chemical inhibitor, I identify in vivo requirements of hdac1 (histone deacetylase1) in NCC development. The zebrafish mutant colgate (col) /hdac1 exhibits defective NCC-derived melanophore, peripheral neuron and craniofacial development. Additionally, hdac1 col mutants also display defects in the extension of the body axis and the migration of branchiomotor neurons. I demonstrate that hdac1 is specifically required for melanophore and branchial arch specification. In melanophores, I define a likely mechanism regulating specification. Characterization of the hdac1 col mutant craniofacial defects, suggests that hdac1 is also required for proper terminal differentiation and migration of manidubular and hyoid arch cartilages. Similarly, hdac1 is required for the differentiation of PNS-derived dorsal root ganglion (DRG), enteric ii
4 and sympathetic neurons. Specifically, in sympathetic neurons, hdac1 is required for acquisition of neurotransmitter characteristics. The HDAC inhibitor trichostatina (TSA) inhibits multiple HDACs including Hdac1. Interestingly, TSA phenocopies multiple aspects of hdac1 col development, suggesting that hdac1 is an important HDAC in embryogenesis. Using TSA, I define temporal requirements of HDAC/hdac1 function during craniofacial and sympathetic neuron differentiation. In hdac1 col / tfap2a mutant/ morphant embryos, there are severe reductions in melanophore and craniofacial derivatives at all stages analyzed, when compared to single mutants, suggesting a new additive or synergistic genetic interaction between hdac1 and tfap2a that is required for NCC-derived melanophore and craniofacial development. Finally, activation of the non-canonical Wnt/PCP pathway that is required for axis extension, in hdac1 col mutant embryos, rescues axis extension defects. This suggests that hdac1 acts as a positive regulator of the non-canonical Wnt/PCP pathway. Additionally, hdac1 normally regulates the caudal migration of facial hindbrain branchiomotor neurons, independently of the non-canonical Wnt/ PCP pathway. iii
5 DEDICATION To mom, for making this possible iv
6 ACKNOWLEDGMENTS I would like to thank Dr. Paul Henion for being a constructive mentor and fostering a positive work culture that permeates through the lab. My lab experience has been one of learning and at the same time, challenged me to explore the unknown. This training will hold me in good stead in future scientific endeavors. To my thesis committee members, Dr. Amanda Simcox, Dr. Christine Beattie and Dr. Heithem El-Hodiri, I am greatly appreciative of their keen insight and support, which have been invaluable in helping me focus my efforts, and made me a better scientist. A special thank you to my lab mates, Dr. Brigitte Arduini, Dr. Roopa Nambiar, Dr. Min An, Dr. Marsha Lucas, Matt Freida, Kevin Bosse, Tamara Robinson, Smitha Malireddy, and Glen Gallagher for providing a positive, cheerful and stimulating work environment. Very special thanks to Dr. Marsha Lucas who spent hours providing feedback to this and several other documents, and Smitha Malireddy, Glen Gallagher, and Holly Moose, who helped me generate exciting data. I would like to thank past and present members of the Beattie and the Jontes lab, especially, Dr. James Jontes, Dr. Michelle Edmond, Dr. Anil Challa, v
7 Dr. Michelle Gray, Dr. Tennore Ramesh and Dr. Michelle McWhorter for stimulating discussions, help with experiments and creating a collaborative learning environment. I would like to express my gratitude to Dr. Sujayakumari, Dr. Sheela Donde, Dr. Nandita Mangalore and Dr. Radiya Pacha Gupta at the Life Sciences Department in St. Xavier s College, Bombay, for laying the early foundations in Biology that led me down this path. To Dr. Sujayakumari for convincing me to stick with Life Sciences during those soul searching moments, clueless freshmen invariably experience. To my friends in Columbus, Francisco Agosto, Litty Paul, Poornima Bhupathy, Priya Raja, Ravi Singh, Richa Tripathi and Reyna Martinez, thank you for being there throughout the rollercoaster ride that is graduate school. To my family, my parents Placid and Bernadette Ignatius, Manohar and Renuka, Mario and Wendy, and Lee for believing in me and enabling me to become the person I am today. And finally, to Alethea, my lovely wife, thank you for your support and patience through it all. vi
8 VITA June 23, Born Bombay, India May, B.S. Life Sciences and Biochemistry St. Xaviers College, Bombay May, M.S. Biochemistry The Maharaja Sayajirao University of Baroda Lecturer St. Xaviers College, Bombay Teaching Assistant The Ohio State University Research Associate The Ohio State University Research Publications PUBLICATIONS 1. Nambiar, R. M., Ignatius, M. S. and Henion, P.D. (2007). Zebrafish colgate/hdac1 functions in the non-canonical Wnt pathway during axial extension and in Wnt-independent branchiomotor neuron migration. Mech. Dev. 124(9-10), Ignatius, M. S., Moose, H. E., El - Hodiri H. M. and Henion, P. D. (2008). colgate/hdac1 repression of foxd3 expression is required to permit mitfadependent melanogenesis, Dev. Biol. 313(2), FIELDS OF STUDY Major Field: Molecular, Cellular, and Developmental Biology vii
9 TABLE OF CONTENTS Title P a g e Abstract Dedication.. Acknowledgments. Vita.. List of Tables. List of Figures List of Abbreviations. Ii Iv V Vii xi xiii xvi Chapter 1: Introduction. 1 Neural crest induction.. 3 Intermediate Bmp signaling levels specify NPB.. 5 Wnt, Notch and FGF signaling pathways are involved in neural crest induction... 6 Neural crest cell fate specification.. 8 Multipotent vs. Fate restricted precursors. 12 Neural crest cell differentiation 16 Craniofacial development in zebrafish.. 17 Sympathetic neuron differentiation 19 Histone modifications and gene expression 20 Histone acetylation 22 Histone Deacetylase Hdac1and the canonical Wnt signaling pathway. 25 HDAC deacetylase inhibitors (HDACi) Tables and figures 29 Chapter 2: colgate/hdac1 Repression of foxd3 expression is required to permit mitfa-dependent melanogenesis. viii
10 Abstract Introduction 39 Results Discussion.. 58 Materials and Methods. 64 Tables and Figures 68 Chapter 3: Differential and reiterated requirement of zebrafish hdac1/hdac function during neural crest derived craniofacial and peripheral neuron development. Abstract Introduction. 88 Results Discussion Materials and Methods. 114 Tables and Figures Chapter 4: Zebrafish colgate/hdac1 functions in the non-canonical Wnt pathway during axial extension and in Wnt-independent branchiomotor neuron migration. Abstract Introduction. 133 Results 137 Discussion Materials and Methods. 159 Tables and Figures 164 Chapter 5: Genetic interactions between hdac1 and tfap2a in neural crest derived craniofacial and melanophore development. Chapter 6: Discussion Abstract 185 Introduction. 186 Results. 189 Discussion and future direction Methods and materials. 196 Figures 198 Hdac1/ HDAC function in neural crest development 203 ix
11 Foxd3 and specification of non-ectomessenchymal neural crest fates 205 Transdifferentiation of melanocytes to glial fates and vice versa 206 BAC to the future Antibodies and designer mutations 210 Conclusion. 211 List of references x
12 LIST OF TABLES Table Page 1.1 Neural crest associated diseases with incidence and causative genes HDAC inhibitors in clinical trials Reduced melanophore number and migration in hdac1 col mutants compared to wild-type Rescue of melanophore number and migration in hdac1 col mutants at 3 dpf foxd3 levels genetically, by morpholino mediated translational interference, or both Rescue of melanophore number and migration at 60 hpf in hdac1 col mutants by low dose of foxd3 morpholino injection Temporal requirements of HDAC function during craniofacial development Temporal requirements of HDAC function during craniofacial development Effect of 800 nm of TSA on sympathetic neuron th expression Statistical analysis of mean length of wildtype and col/hdac1 embryos at 25, 48 and 72 hpf Somite counts of wildtype and col mutants at 16, 27 and 48 hpf post fertilization Wnt/PCP components are able to rescue the notochord phenotype in col mutant embryos Components of the non-canonical Wnt/PCP pathway can rescue aspects of the col mutant phenotype xi
13 4.5 hdac1 RNA is able to rescue the col mutant phenotype while the hdac1 MO is able to phenocopy the mutants TSA treatment is able to phenocopy the col mutant phenotype xii
14 LIST OF FIGURES Figure Page 1.1 Diagrammatic representation of neural crest induction Molecular Regulation of Neural Crest Induction Craniofacial development in zebrafish embryos Sympathetic neuron (SN) development Chromatin structure, modifications and gene expression A model for the activation of the Wnt/β-catenin signaling Pathway Melanophore development is defective in hdac1 col mutants Fewer melanoblasts are specified in hdac1 col embryos Melanophore development does not recover in hdac1 col mutants Neural crest induction and migration of non melanogenic cells are largely unaffected in hdac1 col mutants foxd3 expression is prolonged in the premigratory neural crest and increased numbers of cranial satellite glia are present in hdac1 col mutants Repression of Foxd3 rescues melanogenesis in hdac1 col mutants Genetically reducing foxd3 rescues melanophore development in hdac1 col -/- ; foxd3 zdf10+/ - mutants Foxd3 negatively regulates mitfa Foxd3 can physically interact with predicted forkhead binding sites in the mitfa promoter 83 xiii
15 2.10 A model for the regulation of the initiation of melanogenesis Injection of 0.56 ng of foxd3 morpholino per embryo only partially phenocopies the foxd3 zdf10 mutant sympathetic neuron defect Melanoblast differentiation and migration does not recover at 30 hpf Further repression of Foxd3 in hdac1 col -/- ; foxd3 zdf10+/- and hdac1 col -/- ; foxd3 zdf10+/+ mutants increases the rate of rescue of melanogenesis Severe craniofacial defects in hdac1 col mutants Neural crest derived posterior branchial are specification is defective in hdac1 col Late differentiation and survival defect in the pharyngeal arches in hdac1 col mutants Enzyme activity and stage specific requirements of HDAC function on craniofacial development in wild type embryos Differential temporal requirements of HDAC activity during craniofacial development in wild type embryos DRG, enteric and sympathetic neuron development in hdac1 col mutants Effect of HDAC inhibition on sympathetic neuron differentiation is reversible Sympathetic neurons are specified in TSA treated embryos Sympathetic neuron differentiation is disrupted in hdac1 col mutants col mutant embryos display a late axial extension phenotype Facial (nvii) hindbrain neurons in col mutants do not migrate tangentially Gross patterning of the hindbrain is unperturbed in col mutants. 175 xiv
16 4.4 Regulators of the Wnt/PCP pathway are able to partially rescue col mutants tri/vangl2 is able to rescue extension defects and tangential migration of hindbrain branchiomotor neurons in col mutant embryos The col locus encodes hdac1. col maps close to the zebrafish hdac1 locus on LG 19 (A) hdac1 morphants phenocopy col mutants and hdac1 RNA rescues col mutant phenotypes CE defects in early TSA-treated wildtype embryos resembles other zebrafish Wnt/PCP mutants Wildtype embryos treated late with TSA phenocopy col mutants hdac1 RNA does not rescue defects in vangl2 morphants Overexpression of hdac1 in wildtype embryos, causes brain and trunk defects Severe melanophore defects in hdac1 col /tfap2a mutant / morphants at 48 hpf Severe melanophore and craniofacial defects in hdac1 col /tfap2a mutant /morphants at 3.5 dpf Severe reductions in the specification and differentiation of melanophpores Reductions in the specification of xanthophore and craniofacial sublineage Abrogation of posterior trunk neural crest cells in hdac1 col /tfap2a mutant/ morphants. 204 xv
17 LIST OF ABBREVIATIONS α alpha ~ approximately + positive β beta µ micro ADP AP AP-2 A-P BAC Adenosine diphosphate alkaline phosphatase see Tfap2 Anterior-posterior bacterial artificial chromosome bcl2 B-cell CLL/lymphoma 2 BMP bp BRAF Bone Morphogenetic Protein base pair V-raf murine sarcoma viral oncogene homolog B1 C degrees Celsius Ck2b CASH1 CDKN2A casein kinase 2b chicken homologue of drosophila achete-scute Cyclin-dependent kinase inhibitor 2A xvi
18 cb cdna cls cm CNC CNS col2a1 CRE ctn c-myc CE col Co-REST CREB DBH Dct DIG ceratobranchial complementary deoxyribonucleic acid colourless centi-morgans cranial neural crest central nervous system Collagen2-alpha-1 cyclic AMP responsive element crestin V-myc myelocytomatosis viral oncogene homolog convergent-extension colgate Cofactor of RE1-silencing transcription factor Cyclic AMP responsive element binding Dopamine beta hydroxylase Dopachrome tautomerase digoxygenin dkk1 Dickkopf homolog 1 DMSO DNA dpf dimethyl sulfoxide deoxyribonucleic acid days postfertilization Dlx2 Distalless homeobox 2 DRG Dorsal root ganglia xvii
19 Ndsh D-V E ECM EFNB1 Edn1 ES cells Ednr EMT EMSAs ENU FGF Fkd6 Flu Fms Fzd G N-terminal deleted disheveled Dorsal-Ventral embryonic extracellular matrix Ephrin-B1 endothelin1 Embrtonic stem cells Endothelin receptor epithelial-mesenchymal transition Electrophoretic mobility shift assays ethyl-n-nitrosourea Fibroblast Growth Factor Forkhead6; currently FoxD3 fluorescein Colony stimulating factor 1 receptor, formerly McDonough feline sarcoma viral (v-fms) oncogene homolog Frizzled guanine Gata2/3 GATA binding protein 2/3 GDNF gsk3ß Glial cell line-derived neurotrophic factor glycogen synthetase kinase beta H2A, H2B, H3 and H4 Histone2A/2B/H3/H4 Hand2 Heart and neural crest derivatives expressed 2 xviii
20 HATs HDACs histone acetyltransferases histone deacetylases hdac1 histone deacetylase 1 HDACi hey1 Hox ISH Isl K kny LC HDAC inhibitors hairy/enhancer-of-split related with YRPW motif1 homeobox in situ hybridization Islet Lysine knypek locus coreleus LEF1 Lymphoid enhancer-binding factor 1 M mab MASH1 Mitf ml MO mob mrna molar monoclonal antibody Mammalian homologue of drosophila achete-scute; Microphthalmia-related transcription factor milliliter morpholino mont blanc messenger ribonucleic acid msx1 Msh homeobox 1 MW molecular weight xix
21 my MC1R NC NCC NCSCs ng Ngn nl nm NF1 NP NPB NRAS NT ntl NTN NuRD myotome melanocortin 1 receptor neural crest neural crest cells Neural crest stem cells nanograms Neurogenin nanoliter nanomolar Neurofibromatosis neural plate Neural Plate Border Neuroblastoma RAS viral (v-ras) oncogene homolog neural tube no tail neurturin nucleosome remodelling and deacetylating Otx Orthodenticle homeobox 1 pax3 paired box domain 3 PBS PBT PCR PCP phosphate-buffered saline phosphate-buffered saline-tween20 polymerase chain reaction planar cell polarity pathway xx
22 PFA pg phox2a pk ppt PRE PNS PTU r RB RNA RPD3 RT RET rho S SAHA scrb1 paraformaldehyde pictograms paired-like (aristaless) homeobox 2a prickle pipetail pigmented retinal epithelium peripheral nervous system 1-Phenyl-2-thiourea rhombomere Rohon Beard sensory neurons ribonucleic acid drosophila homologue of hdac1 room temperature REarranged during Transfection kinase2 somite suberoyl anilide bishydroxamide scribble1 SDS PAGE sodium dodecyl sulfate polyacrylamide gel electrophoresis snai1b SNPs SKPs snail1b Single nucleotide polymorphisms skin precursor cells xxi
23 slb Sox Sp1 SSLP Stat3 sbn T tbx1 silberblick SRY-related homeobox Sp1 transcription factor simple sequence length polymorphism Signal Transducers and Activators of Transcription somitabun Thymine t-box protein1 TCOF1 Treacher Collins-Franceschetti syndrome 1 Tfap2 Transcription factor-activator protein 2 TH tri TUNEL Tyr TNC TSA Tyrosine hydroxylase trilobite Terminal dutp Nicked End Labeling Tyrosinase Trunk neural crest trichostatin A Trkc neurotrophic tyrosine kinase, receptor, type 3 Val VPA wt Wnt Xdh Y valentine valproic acid wild-type Wingless-integrated Xanthine dehydrogenase tyrosine xxii
24 YY1 Zash1a YY1 transcription factor zebrafish homologue 1a of drosophil xxiii
25 CHAPTER 1 INTRODUCTION The neural crest is a transient embryonic cell population that contributes to multiple cell types including pigment cells, neurons and glia of the peripheral nervous system and the craniofacial skeleton (LeDouarin, N., Kalcheim, C., 1999). The neural crest also contributes to cell derivatives, and structures in multiple tissues and organ systems in the vertebrate body. Some of these derivatives include myofibroblasts, the cardiac out flow tract, fibroblasts, fin messenchyme and endocrine cells (Dupin et al., 2006; LeDouarin, N., Kalcheim, C., 1999). Given the diversity of cells types, tissue and organ contributions to vertebrate embryos, the neural crest has been at times referred to as the fourth germ layer (Hall, 2000). Historically, the neural crest was first described by His in 1868 and the term neural crest was coined by Marshal in 1879 (Hall, 1999). The neural crest arises at the border of the neural plate and the epidermis, and following neural tube closure these cells come to sit at the top or crest of the neural tube. Subsequently, neural crest cells delaminate from the dorsal neural tube and migrate along different pathways to their unique locations in thembryos, after which they differentiate into various derivatives. The neural crest provides an insight into vertebrate origins, because it is a tissue unique to vertebrates. Its 1
26 evolutionary appearance, in effect, created the vertebrates and is thought to have underpinned their explosive radiation relative to other chordate animals lacking neural crest cells (Gans and Northcutt, 1983). Studies on neural crest development have focused on fundamental questions of induction, cell fate specification, delamination, migration, differentiation, cell proliferation and survival. These questions in large part are also important and relevant to the broader question of the development of multicellular organisms. From a clinical perspective, defects in the neural crest often result in syndromic disease conditions in humans involving multiple cell types and tissues collectively known as neurocristopathies (Table 1) (Amiel and Lyonnet, 2001; Bolande, 1997; Etchevers et al., 2006; Kulesa et al., 2004; Nemecek et al., 2003). The precise regulation of gene expression is important for induction, cell fate specification, differentiation, proliferation and survival during the development of the neural crest as well as other tissues. Differential gene expression is controlled by transcription factors that can by themselves or as part of larger complexes, activate or repress transcription. Differential gene expression can also be regulated via other processes which include mrna stability and by controlling access of the transcriptional machinery to chromatin (Isken and Maquat, 2007; Maquat and Carmichael, 2001; Shyu et al., 2008). In the first half of this introduction, I will review important findings in neural crest cell induction, cell fate specification and differentiation. In the second half, I will introduce hdac1/histone deacetylase 1, a chromatin modifying enzyme, which is 2
27 an essential gene required for multiple aspects of development. hdac1 mediated neural crest cell and overall development is the focus of this dissertation. Neural crest induction The ectoderm germ layer gives rise to the epidermis, neural plate as well as the neural crest. How each tissue is induced from the ectoderm is an important question. The neural crest forms at the border of the epidermis and the neural plate also known as the Neural Plate Border (NPB). Initially, the NPB is not a distinct cell population but rather has epidermal, neural crest as well as neural plate potentials (Bronner-Fraser and Fraser, 1988; Bronner-Fraser and Fraser, 1989). This is evidenced at the molecular level, where some epidermal genes are also expressed in the NPB and there is a partial overlap between other neural plate and NPB genes (Sargent, 2006). For example, Msx1 and AP2 are expressed in the epidermis and the NPB and c-myc is expressed in the NBP as well as in the NP. Given that the NPB is flanked by the epidermis and neural plate and overlaying the paraxial mesoderm, all three tissues appear to be important for neural crest induction. Experiments in amphibians and in chick have demonstrated the ability of ectoderm tissue juxtaposed to the neural plate to induce neural crest cells (Mancilla and Mayor, 1996; Moury and Jacobson, 1989; Selleck and Bronner-Fraser, 1995). Likewise, juxtaposition of the lateral plate mesoderm and paraxial mesoderm to the ectoderm can induce neural crest cells or marker expression (Bonstein et al., 1998; Marchant et al., 1998; Monsoro-Burq 3
28 et al., 2003; Raven and Kloos, 1945; Selleck and Bronner-Fraser, 1995). In zebrafish, the paraxial mesoderm appears not be required for neural crest induction (Ragland and Raible, 2004) and similarly in mice, there is no evidence for paraxial mesoderm requirement in neural crest induction suggesting that species specific differences may exist. Thus, NPB formation requires signaling from multiple tissues which are juxtaposed during development. At the molecular level, at least four different signaling pathways have been shown to be required for neural crest induction. These include Bmp (bone morphogenetic protein), Wnt (wingless-integrated), Fgf (fibroblast growth factor) and Notch/Delta signaling (reviewed in and references there in, Barembaum and Bronner-Fraser, 2005; Cornell and Eisen, 2005; Huang and Saint-Jeannet, 2004; Steventon et al., 2005). Finally, neural crest induction at the molecular level is defined by the expression of specific genes which includes tfap2a (Barrallo- Gimeno et al., 2004; Brewer and Williams, 2004; Knight et al., 2003; O'Brien et al., 2004; Schorle et al., 1996; Zhang et al., 1996), foxd3 (Dottori et al., 2001; Lee et al., 2006; Lister et al., 2006; Sakai and Wakamatsu, 2005; Stewart et al., 2006a; Teng et al., 2008), snai1b (Aybar et al., 2003; Nieto et al., 1994; Nieto, 2002), sox9 (Cheung and Briscoe, 2003; Cheung et al., 2005; Lee et al., 2004; Yan et al., 2002; Yan et al., 2005), and sox10 (Dutton et al., 2001a; Honore et al., 2003; Southard-Smith et al., 1998b) that are required for neural crest development. 4
29 Intermediate Bmp signaling levels specify NPB A model put forward for the role of Bmp signaling in neural crest induction proposes that, the gradient of Bmp signaling in the ectoderm created by the diffusion of Bmp antagonists secreted by the dorsal mesoderm into the ectoderm results in the specification of neural crest at intermediate levels of Bmp signaling, while at low and high levels NP and epidermis are specified respectively. This model suggests that neural crest induction is coupled with NP formation. Support for the model comes from experiments in zebrafish where in Bmp-signaling mutants swirl/bmp2b, snailhouse/bmp7 and somitabun/smad5 where the threshold of bmp signaling is reduced sufficiently to cause a reduction of nonneural ectoderm and a concomitant expansion in the neighboring neural crest (Nguyen et al., 1998; Nguyen et al., 2000). Similarly in Xenopus, modulating Bmp signaling in the ectoderm and in animal cap assays, has shown that high levels of Bmp signaling induces epidermis, intermediate levels neural crest, while low levels neural tissue (Mayor et al., 1995; Morgan and Sargent, 1997). In chick, intermediate neural plates can form neural crest cells if cultured in the absence of non-neural ectoderm but in the presence of Bmps (Liem et al., 1995; Liem et al., 1997). In avian embryos, Bmp4, a Bmp ligand, is expressed in the epidermis adjacent to the neural plate and modulating Bmp signaling by implanting soaked beads containing Bmp4 or Bmp antagonists at the epidermis-neural plate border causes a narrowing or expansion respectively of the neural tube (Streit and Stern, 1999). In mice, the requirement of Bmp signaling in neural crest induction is less obvious (Bachiller et al., 2000), suggesting that there are some species 5
30 specific differences. Thus, intermediate levels of Bmp signaling are important for neural crest induction, while high and low levels of Bmp signaling is required for epidermis and neural plate induction respectively. Wnt, Notch and FGF signaling pathways are involved in neural crest induction While Bmp signaling is essential for neural crest induction, Bmp signaling alone cannot induce neural crest cells and additional signaling pathways are required. The involvement of Wnt signaling in neural crest induction is well documented in several species including chick (Garcia-Castro et al., 2002), mouse (Brault et al., 2001; Dunn et al., 2000; Ikeya et al., 1997), Xenopus (Bang et al., 1999; Chang and Hemmati-Brivanlou, 1998; LaBonne and Bronner-Fraser, 1998; Luo et al., 2003b; Saint-Jeannet et al., 1997) and zebrafish (Lewis et al., 2004). The Wnt family of growth factors has been shown to be necessary and sufficient to induce neural crest in the absence of other factors in chick (Garcia- Castro et al., 2002). In Xenopus, ectopic Wnt signaling can induce neural crest in embryos and animal cap assays, while blocking Wnt signaling abrogates neural crest formation (Chang and Hemmati-Brivanlou, 1998; LaBonne and Bronner- Fraser, 1998; Saint-Jeannet et al., 1997). In mouse embryos, targeted inactivation of β-catenin which is the downstream effecter component of the Wnt signaling pathway, in the dorsal neural tube, results in severe defects in the cranial ganglia, dorsal root ganglia (DRG), and craniofacial development (Brault 6
31 et al., 2001). In zebrafish, wnt8 has been shown to be required for neural crest induction (Lewis et al., 2004). Fgf signaling is also involved in neural crest induction. In Xenopus, it has been demonstrated that both Fgf and attenuation Bmps signaling together can induce neural crest (Mayor et al., 1995). Conversely, decreasing Fgf signaling with a dominant negative Fgf receptor can inhibit neural crest marker gene slug (Mayor et al., 1997). In this study, the source of Fgf signaling was identified as the non-neural ectoderm. Presently, it is not clear as to the source of Fgf signaling that is critical for neural crest induction as the paraxial mesoderm has also been implicated as a source of Fgf (Monsoro-Burq et al., 2003). Notch/Delta signaling has also been implicated in neural crest induction in zebrafish, frog and chick model systems. During trunk neural crest formation in zebrafish, notch signaling is required to specify neural crest cells at the expense of Rohan-Beard sensory neurons, both of which are derived from the NPB (Cornell and Eisen, 2000; Cornell and Eisen, 2002). In contrast to the trunk neural crest, in the zebrafish cranial region, notch signaling does not appear to be required for cranial neural crest induction. In Xenopus, Notch signaling cell autonomously induces cranial neural crest expression of slug (Glavic et al., 2004). However, the effect of Notch signaling appears to be stage dependent. Modulating, Notch signaling with a hormone inducible construct at the 2 cell stage caused an expansion of paraxial mesoderm in addition to neural crest complicating interpretation of the results, while inducing Notch signaling at the end of gastrulation caused an expansion of neural crest without any obvious 7
32 effects on neural plate or mesoderm (Glavic et al., 2004). Further, Notchsignaling via down-regulation of Bmp4 expression in the ectoderm is thought to regulate the expansion of neural crest induction (Glavic et al., 2004). In chick, the Notch signaling ligand Delta is implicated in maintaining Bmp4 expression in the ectoderm and thus indirectly controls neural crest induction (Endo et al., 2002). Taken together, neural crest induction requires signals from the ectoderm and the mesoderm and at the molecular level these signals include a combination of Bmp, Wnt, Fgf and Notch signaling. Also, intermediate levels of Bmp signaling are essential to induce neural crest cells. In the hdac1 mutant hdac1 col, there is an increase in wnt8 expression in the ventrolateral mesoderm during gastrulation resulting in the reduction of the shield or dorsal mesoderm organizer tissue (Nambiar and Henion, 2004). Consequently, due to increased Wnt and Bmp signaling, there is an expansion of epidermis and a reduction of neural plate tissues. Neural crest induction was not studied directly and I address this issue in chapter 2 of this thesis. Neural crest cell fate specification An important question at the core in the development of multicellular organisms is how a pleuripotent or multipotent cell can give rise to diverse cell types that are required to form a tissue or organ system. The neural crest is a transient embryonic cell population that is at least initially multipotent and gives rise to multiple cell types including craniofacial cartilages, neurons and glia of the peripheral nervous system and pigment cells in addition to other cells types. 8
33 Therefore, how different sublineages are determined within the neural crest is a central question. Another important question is whether one can isolate potential multipotent stem cells in developing embryos that contributes to most neural crest derivatives or is the multipotent nature transient. Several approaches have been employed to address the question of how the diversity of cell types is attained in neural crest cells. Some of the early experiments used to address the potential of neural crest cells employed the transplantation of neural tube fragments from quail or chick embryos into all levels along a chick recipient neural axis (LeDouarin, N., Kalcheim, C., 1999; Noden, 1975, 1978; Weston, 1963; Weston and Butler, 1966). The quail-chick chimera approach uses the unique differential staining properties of the nuclei of quail and chick to differentiate between donor and recipient cells (Le Douarin, 1973). These transplantation studies established that neural crest cells have a broad developmental potential (Revirwed in LeDouarin, N., Kalcheim, C., 1999 and references there in). Transplantation studies also revealed that the fate of the tissue transplanted is dependent on the regional environment or location along the neural axis of the recipient (Le Douarin, 2004; Le Douarin, N., Kalcheim, C., 1999). The results of transplantation studies have culminated in the development of an extensive neural crest fate map of the avian embryo. The salient features of the fate map studies in avian embryos are the following; 1) the neural crest is generated from the cephalic folds in the mid-diencephalon region to the posterior limit of the neural tube. 2) Melanocytes are derived from all levels of the neural crest. 3) The PNS neurons are generated from distinct regions of 9
34 along the neural axis. 4) Finally, only cranial crest can give rise to chondrocytes and osteocytes. Another approach used to study cell fate specification is to manipulate neural crest cells in vivo and or in cell culture conditions to eliminate, enhance or skew cell fates obtained (Dupin et al., 2006). This can be achieved by overexpression or knockdown studies, transplantation studies, growing neural crest cell cultures under unique conditions or treatments and by using small molecules to change the outcome of cell types obtained (Dupin et al., 2006; Le Douarin, 2004). The discovery or creation of mutants or knockouts of genes that have an impact on cell fate specification in model organisms and also in disease conditions have been identified. At the molecular level, several genes and molecular pathways that are required for neural crest development have been identified. Mutations or Knockout or knock-down or knock-in of genes required for neural crest cell fate specification fall in two categories, those that affect multiple cell types and others that affect only a single cell type. For example, loss of function of sox10 in zebrafish, frogs and mice results in the disruption or absence of all non-ectomessenchymal neural crest derivatives which includes pigment cells and neurons and glia of the PNS (Dutton et al., 2001b; Kelsh and Eisen, 2000; Potterf et al., 2000; Southard-Smith et al., 1998a). Similarly, humans with hypomorphic SOX10 mutations are associated with a syndrome known as Waardenburg-Shah syndrome in which individuals have hypopigmentation defects in addition to defects associated with the enteric nervous system (PNS 10
35 derivative) resulting in a condition known as dominant megacolon (Bondurand et al., 2000; Pingault et al., 1998; Steingrimsson et al., 2004). On the other hand, in zebrafish and humans, defects in mitf primarily lead to the loss of melanophores or melanocytes (Lister et al., 1999; Steingrimsson et al., 2004). mitf is a lineage specific transcription factor that is necessary and sufficient to specify melanophore cell fate, while sox10 is required for multiple lineages which includes melanophores and is upstream of mitf in the hierarchy of genes required to regulate mitf expression (Dutton et al., 2001a; Lee et al., 2000; Steingrimsson et al., 2004). sox10 controls melanophore cell fate specification by directly upregulating mitf expression (Elworthy et al., 2003; Verastegui et al., 2000). Several other genes and molecular pathways which affect the specification of single neural crest derivatives or multiple overlapping derivatives have been identified. These include both, cell-intrinsic and extrinsic factors or genes. One of the caveats when interpreting loss or gain of function data is that many key regulators required for neural crest cell fate specification are reiteratively required during development. Another problem faced is a functional redundancy in the generation derivatives. Recently, work carried out in our laboratory has demonstrated that in the absence of tfap2a and foxd3 there is a complete loss in the specification of all neural crest derivatives (Unpublished), however in single mutants while there are unique derivatives lost, overall most derivatives are generated and some even recover to wild-type levels, highlighting a functional redundancy in neural crest development (Barrallo-Gimeno et al., 2004; Knight et al., 2003; Stewart et al., 2006). 11
36 Multipotent vs. Fate restricted precursors While transplantation studies have provided us valuable information about the developmental potential of neural crest as an entire population, they are unable to address the potential of single neural crest cells. Transplantation experiments also likely reflect the effects of location of transplantation and the presence of mixed clones of lineage restricted and multipotent cells. To address the specific question of whether neural crest cells are multipotent it is important to study the development of individual neural crest cells. To facilitate this analysis, in vivo labeling of single cells and clonal culture systems have been established (Bronner-Fraser and Fraser, 1988; Bronner-Fraser et al., 1991; Cohen and Konigsberg, 1975; Dupin and Le Douarin, 1995; Henion and Weston, 1997; Lahav et al., 1998; Shah et al., 1994; Sieber-Blum and Cohen, 1980; Sieber-Blum, 1989; Sieber-Blum, 1991; Stemple and Anderson, 1992; Stemple and Anderson, 1993; Trentin et al., 2004). Lineage analysis experiments are the most direct and informative way to illuminate the process of fate specification in neural crest cells. In avian neural crest cell culture experiments, a segment of the neural tube is cultured on a rich medium plate and as neural crest cells migrate away from the neural tube they are labeled with a non diffusible lineage dye or virus and individual cell fates subsequently followed continuously, including all cell divisions and derivatives (Henion and Weston, 1997). Avian neural crest cell culture lineage tracing experiments determined that the initial neural crest population is heterogeneous in which close to half the labeled clones generated only a single cell fate (Henion 12
37 and Weston, 1997). The proportion of neural crest derivatives produced by labeled clones was identical to those obtained from unlabelled cultures. Additionally, temporal labeling experiments determined that initially neurogenic clones migrated away from the cultured neural tube and only subsequently followed by melanogenic clones, consistent with other avian experiments (Erickson and Perris, 1993; Henion and Weston, 1997; Reedy et al., 1998). Also, neural-fate restricted precursors were obtained before fate restricted glial or melanocyte populations were obtained. These experiments indicated that lineage specification is a relatively early event in neural crest development (Henion and Weston, 1997). The lineage tracing experiments were corroborated by tracing the fate of early labeled clones that were identified by in vivo labelling as Trkc + clones or C-kit + clones. Trkc + clones produced neuronal, glial or mixed neuronal and glial progeny. In contrast, C-kit + clones only gave rise to melanocytes, suggesting that fate restricted heterogeneous precursors exist before they immigrate from the dorsal neural tube and undergo overt differentiation (Luo et al., 2003a). In in vivo avian lineage tracing experiments, neural crest cells labeled mostly produced bipotent or unipotent derivatives with few truly multipotent clones present (Bronner-Fraser and Fraser, 1988; Bronner-Fraser et al., 1991). Also clones which give rise to neurons and melanocytes were rare supporting avian cell culture experiments, which determined that melanogenic and neurogenic lineages segregated early. However, the authors interpret their results to suggest that cell fate specification was a relatively late event in neural crest development that is likely to be influenced by local environments (Bronner- 13
38 Fraser and Fraser, 1988; Bronner-Fraser et al., 1991). One of the limitations of the study is that the authors labeled neuroepithelial cells initially and it is not known whether a neuroepithelial cell, which delaminates give rise to one or more neural crest precursors (Henion and Weston, 1997). Another limitation is the relatively small sample size in labelling experiments, compared to large representative sampling in avian cell culture experiments (Henion and Weston, 1997). Clonal analysis of trunk neural crest cells has been performed in zebrafish embryos by labeling premigratory neural crest cells (Raible and Eisen, 1994; Schilling and Kimmel, 1994). The results obtained indicate that majority of the premigratory neural crest cells are single-fate restricted, however, bi and tripotent precursors although fewer are also present (Raible and Eisen, 1994). In contrast, in the zebrafish cranial neural crest only single fate restricted precursors are present (Schilling and Kimmel, 1994). Clonal analysis in vitro in which single cells are isolated by limit dilution has demonstrated that initially neural crest populations contain a heterogeneous population of multipotent and fate restricted precursors (Cohen and Konigsberg, 1975; Dupin and Le Douarin, 1995; Lahav et al., 1998; Sieber-Blum and Cohen, 1980; Sieber-Blum, 1989; Sieber-Blum, 1991; Trentin et al., 2004). Progenitor neural crest cells contain multipotent cells that can yield three or more cell types, yet others are bi-potent and can give rise to glial cells and melanocytes or glial cells and neurons or to glial cells and myofibroblasts (Stemple and Anderson, 1992; Trentin et al., 2004). An interesting result from these clonal studies is that 14
39 gliogenic potential precursors are present in all bipotent precursors (Trentin et al., 2004). Clonal analysis by limit dilution in mice and rat neural crest cultures, similarly have identified pleuripotent progenitors (Ito et al., 1993; Paratore et al., 2001; Rao and Anderson, 1997; Shah et al., 1994; Shah et al., 1996; Stemple and Anderson, 1992). Trunk neural crest cells derived from rats yield autonomic neurons, glial cells and myofibroblasts. The neural crest isolated were shown to be able to self renew, which is an intrinsic property only of stem cells (Stemple and Anderson, 1992). Similar stem cell ability was shown in avian cultures where bipotent glial-melanocyte precursors and glial-myofibroblast precursors present can self-renew in vitro after being sub-cloned onto new culture plates (Trentin et al., 2004). An important limitation of in vitro clonal analysis when compared to lineage tracing experiments in primary cultures is that experiments are performed on secondary cultures which were isolated from primary neural tube outgrowth cells. As a consequence it is difficult to estimate the true proportions of neural crest progenitors in vivo. In some studies, small clones were excluded from analysis, which I would predict to be fate restricted clones that are predominant in primary cultures (Baroffio et al., 1991; Henion and Weston 1997). Another consequence of establishing secondary clonal cultures from individual primary clones is that cell-cell interactions present within the primary neural tube explants are lost. Non-cell autonomous interactions between neural crest cells could determine the outcome of cell fates. Finally, in most clonal cell culture analyses the experimental observations were not continuous but rather at one or two 15
40 observation points. In contrast, in lineage tracing experiments cell fates were monitored continuously (Henion and Weston 1997; Luo et al., 2003). Two alternative models have been proposed to explain the specification of neural crest sublineages. The first model proposes that neural crest sublineages are specified fairly early even before migration occurs. The alternative model suggests that neural crest cell fates are determined late in development most likely by local environmental cues. However, an overlapping sub-set of both models are likely to work. All sets of data support the fact that very early the neural crest is a heterogeneous population which is mostly unipotent, with lower probabilities of bi and tripotent precursors and rare multipotent clones. Also, neurogenic and melanogenic cell fate segregation is a very early event. Bipotent clones are fate restricted to neurons and glia, or glia and melanocytes, or glia and some other derivative. Thus, a combined model will propose that early segregation of neuronal and melanocyte sublineages occur before neural crest cells leave the neural tube. Subsequently, fate restricted unipotent, bipotent or tripotent precursors progressively differentiate with the help of local cues into limited derivatives. Neural crest cell differentiation Once a particular cell fate is specified several important decisions have to be made to finally determine the appropriate numbers of cells required and to make a complete fully functioning terminally differentiated cell. Neural crest derived pigment cell, sympathetic neuron and craniofacial development has been 16
41 extensively studied and has provided important insights into cell differentiation. Chapter 2 in this thesis introduces melanophore development and will not be discussed here. In Chapter 3, I discuss the function of hdac1 in craniofacial and peripheral neuron development. Hence, I will briefly introduce craniofacial development in zebrafish and also summarize to date the development of PNS derived-sympathetic neurons. Craniofacial development in zebrafish The craniofacial elements of the jaw are derived from migrating streams of CNC which originate from the neural crest lining the midbrain and hindbrain in the developing embryo. Fate mapping studies in zebrafish have determined that the anterior most CNC stream gives rise to the anterior neurocranium and the mandibular arch, while CNC derived from r4 (rombomere4) gives rise to the hyoid arch and CNC streams migrating out from r6 contribute to 5 streams that form the posterior branchial arches which support the gills in zebrafish (FIG, (Knight and Schilling, 2006). Distinct A-P homeobox gene expression patterns define and give unique developmental cues to CNC in the pharyngeal arches. The anterior neurcranium and mandibular arches are Otx positive and Hox negative (Hunter and Prince, 2002; Knight and Schilling, 2006). The hyoid arch is hox group 2 positive, while the posterior pharyngeal or branchial arches are hox group 3 positive (Hunter and Prince, 2002). Loss of hoxa2 expression in the second hyoid arch results in a homeotic transformation to anterior mandibular 17
42 arch fates, highlighting requirements of hox group 2 genes in determining hyoid arch identity (Hunter and Prince, 2002). The CNC in each of pharyngeal streams migrate ventrally into the pharyngeal pouches, which is made up of a core mesoderm surrounded by migrating CNC which in turn is surrounded by pharyngeal endoderm and ectoderm. As a result of the ventral migration of the CNC, the pharyngeal pouches have a distinct D-V axis and differentially express genes required for the development of different elements of the jaw (Fig 3, (Knight and Schilling, 2006). It has been shown that the ventral endoderm and ectoderm expresses endothelin1, a secreted ligand, which binds to its G-protein receptor that is expressed in the migrating CNC (Miller et al., 2000; Miller et al., 2003). Thus, a model has been proposed that the decreasing D-V morphogen gradient of endothelin1 patterns the pharyngeal pouch (Miller et al., 2003). In addition to the CNC, proper craniofacial morphogenesis requires the interaction of the ectoderm, the pharyngeal endoderm and mesoderm (Knight and Schilling, 2006). Requirements for the endoderm in pharyngeal skeleton development is highlighted in casanova/sox32 mutants which completely lacks endoderm, consequently, there is a complete loss of the pharyngeal skeleton (David et al., 2002). Transplanting wild-type endoderm back into casanova mutants rescues craniofacial development (David et al., 2002). Similarly in tbx1 mutants, cranial cartilage patterning is disrupted as an indirect consequence of defects in endoderm development (Piotrowski et al., 2003). The potential requirement of the ectoderm in craniofacial development is highlighted by a recent paper where the 18
43 authors studied the effect of simultaneously eliminating tfap2 family members, tfap2a and tfap2b, on jaw development (Knight et al., 2005). Disrupting the combination of tfap2a and tfap2b in zebrafish embryos caused a drastic reduction of all elements of the jaw. Next, the authors rescued craniofacial development by exclusively transplanting ectodermal origin cells back into tfap2a/b mutant/ morphant embryos (Knight et al., 2005). Thus, the differentiation of craniofacial cartilages requires the combination of multiple genes that determine proper A-P and D-V identity. Also, craniofacial development requires interactions between the neural crest and tissues contributed by the ectoderm, mesoderm and endoderm. Sympathetic neuron differentiation The sympathetic ganglia are derived from the TNC that migrate along the ventral migratory pathway to come to be situated adjacent to the dorsal aorta where they undergo terminal cathecholaminergic and neuronal differentiation (Goridis and Rohrer, 2002; Howard, 2005; Huber, 2006). BMP signals from the dorsal aorta are important for the earliest developmental stages of sympathetic neurons (Schneider et al., 1999). Early developing sympathetic neuron precursors require the expression of MASH1 (CASH1, chicken homologue of drosophila achete-scute; Zash1a, zebrafish homologue 1a of drosophila achetescute), the mammalian homologue of drosophila acheate-scute, which is necessary for autonomic cell fate determination (Hirsch et al., 1998) and Phox2b which is required for the expression of downstream transcription factors Hand2, 19
44 Phox2a and Gata2/3 (Hirsch et al., 1998; Howard et al., 2000; Lim et al., 2000; Lo et al., 1999; Lucas et al., 2006; Pattyn et al., 1999; Pattyn et al., 2000; Tsarovina et al., 2004). Finally, the combination of MASH1, Phox2b, Hand2, Phox2a and Gata2/3 is required for the expression and maintenance of neuronal markers and cathecholaminergic synthesis enzymes like tyrosine hydroxylase (TH) and dopamine beta hydroxylase (DBH) (reviewed in Goridis and Rohrer, 2002; Howard, 2005; Huber, 2006). In addition to requirements in differentiation the maintenance of the differentiated state of sympathetic neurons is also important. Accordingly Hand2 and Gata3 have been found to required for differentiation but also to maintain the differentiated state (Muller and Rohrer, 2002; Tsarovina et al., 2004). While an overall hierarchy has been established for the development of sympathetic neurons in multiple model organisms and in cell culture experiments, presently, the exact relationships between many of the players are still being elucidated. It appears that while there is a heirachy of gene regulation, there are also feed- back networks present that are required to regulate proper differentiation. Finally, the mechanisms by which transcription factors function to regulate TH and DBH expression at the promoter level are currently being elucidated. Histone modifications and gene expression In this dissertation I explore neural crest induction, specification, and differentiation of neural crest cell using the zebrafish mutant colgate (col)/ histone 20
45 deacetylase 1 (hdac1). The hdac1 col is a recessive larval lethal mutant that was isolated in a forward genetic ENU mutagenesis screen, for regulators of neural crest development and the mutant has defects in melanophores, craniofacial cartilages and peripheral neuron development. hdac1 as the name suggests, is a histone deacetylating enzyme and is known to be required for epigenetic control of gene expression. In eukaryotic cells, DNA is packaged into a higher order structure known as chromatin. The chromatin complex is comprised of DNA associated with histone and non-histone proteins. The basic unit of chromatin is known as the nucleosome, that is comprised of 146 bp of negatively charged DNA wrapped around an octameric core of positively charged histone proteins. The histone octamer is made up of two molecules each of H2A, H2B, H3 and H4. Histone proteins are made up of a globular domain and a protruding N-terminal tail. The N-terminal tail which comprises of up to 25-30% of histone proteins, contain multiple amino acid residues that are capable of being posttranslationally modified by acetylation, methylation, phosphorylation modifications in the histone tails or combinations of modifications as being an important code that is required to regulate gene transcription (Figure 5) (Jenuwein, ubiquitination and ADP-ribosalation. Numerous studies have implicated specific and Allis, 2001; Richards and Elgin, 2002; Spotswood and Turner, 2002). It is known that the activation or repression of gene expression correlates with the acetylation state of histones (Allfrey, 1966). In general, acetylated histones are associated with more open chromatin and correspondingly active gene expression, whereas deacetylated histones are usually associated with closed chromatin and 21
46 repressed gene expression (Ahringer, 2000). Methylation is another important histone modification. Lysine residues K4 and K9 are commonly methylated in H3. Methylation at K4 and K9 residues have opposite effects on transcription (Richards and Elgin, 2002; Zhang and Reinberg, 2001) where H3 methylated at K4 is largely associated with silent chromatin, while K9 methylation is usually indicative of actively transcribed DNA. Histone acetylation The effect of histone acetylation on transcription is relatively well studied. In addition to its function in regulating transcription, histone acetylation is also found to be involved in DNA repair, replication and heterochromatin formation (reviewed in Kurdistani and Grunstein, 2003). The acetylation and or deacetylation of histones within the eukaryotic cell is catalyzed by two types of enzymes known as histone deacetylases (HDACs) and histone acetyltransferases (HATs) (de Ruijter et al., 2003; Marks et al., 2003; Roth et al., 2001).While histones are by and far the most abundant substrate of HDACs and HATs, they are also known to regulate the acetylation status of other proteins. The acetylation of proteins is implicated in affecting protein stability, protein-protein interactions, protein localization and DNA binding (Minucci and Pelicci, 2006). Several HDACs have been identified. On the basis of homology, HDACs are classified into four groups (de Ruijter et al., 2003; Dokmanovic et al., 2007). Class I HDACs which include HDAC1, 2, 3 and 8 are primarily nuclear in localization and ubiquitously expressed. Class II HDACs include HDAC4, -5, -6, -7, -9 and -10 and 22
47 are restricted in their tissue expression. Also, Class II HDACs are present both in the nucleus and the cytoplasm of the cell and are functionally regulated in part by controlling the shuttling between the nucleus and the cytoplasm. Both Class I and Class II HDACs are zinc-dependent enzymes and are inhibited by trichostatin A (TSA) a fungal metabolite. Class III HDACs are different from Class I and II HDACs and require NAD + for enzymatic activity (Blander and Guarente, 2004). Class III HDAC enzymatic activity is not inhibited by compounds like TSA. Recently a Class IV HDAC, HDAC11 has been described (Dokmanovic et al., 2007). Histone Deacetylase 1 Class I HDACs, HDAC1 and HDAC2 are highly homologous and have an 82% overall identity (de Ruijter et al., 2003). HDAC1 and HDAC2 require additional co-factors for activity in vivo and are usually present as part of multiprotein complexes. Multiprotein complexes containing HDAC1 and 2 include Sin3 (DNA binding subunit of Sin3p-Rpd3p histone deacetylase complex), NuRD (nucleosome remodelling and deacetylating) and Co-REST complexes (Corepressor complex containing REST, Repressor 1E Silencing Transcription factor) (Ahringer, 2000). Additionally, HDAC1 can also directly bind to DNA binding proteins, for example YY1 and Sp1 (de Ruijter et al., 2003). In zebrafish, hdac1 is required by proliferating cells in the retina to exit the cell cycle and undergo terminal differentiation (Stadler et al., 2005; Yamaguchi et al., 2005). Hdac1is also a negative regulator of the Notch signaling pathway which is required for the terminal differentiation of retinal and other CNS neurons (Cunliffe, 2004; Yamaguchi et al., 2005). Another study in 23
48 zebrafish has shown that hdac1 is required to specify oligodendrocytes in the CNS (Cunliffe, 2004; Cunliffe and Casaccia-Bonnefil, 2006). Negative regulation of the canonical Wnt signaling pathway by hdac1 is also required for early dorsal-ventral patterning and later regional anterior-posterior cell fate determination within the anterior neuroectoderm in zebrafish embryos (Nambiar and Henion, 2004). In mice loss of both HDAC1 alleles results in embryonic lethality before day E10.5 (Lagger et al., 2002). Embryos and ES cells that are null for HDAC1 have reduced proliferation which is associated with up-regulation of cyclin-dependent kinase inhibitors p21 and p27 (Lagger et al., 2002). Additionally, HDAC1 related enzymes HDAC2 and HDAC3 are upregulated in HDAC1 null embryos, however, they cannot compensate for the loss of HDAC1 (Lagger et al., 2002). Conditional HDAC1 mutants in which HDAC1 is specifically deleted in the heart have been created and these mutants are viable and have no developmental defects. During heart development, there is a redundant function between HDAC1 and HDAC2 and only when both genes are conditionally deleted is a severe defect in cardiac morphogenesis and function observed (Montgomery et al., 2007). Thus, based on studies so far there appear to be differential stage and tissue specific requirements of hdac1 function during development. Also, there are overlapping redundant and non-overlapping requirements of hdac1 function. hdac1 is ubiquitously expressed in the developing embryo so it is interesting to find tissue specific requirements. Therefore, one of the central themes of my thesis was to isolate and characterize hdac1 specific requirements in development 24
49 Hdac1 and the canonical Wnt signaling pathway To understand hdac1 requirements in development, in this section I will discuss earlier findings of hdac1 function in the the canonical Wnt signaling pathway that were identified with the help of the hdac1 mutant hdac1 col.the canonical Wnt proteins form a family of highly conserved secreted signaling molecules that regulate cell-to-cell interactions and help pattern the developing embryo. Canonical Wnt signaling has been implicated in A-P patterning of the neuroectoderm and still earlier in controlling D-V development (Figure 6) (Heasman et al., 1994; Moon et al., 1997; Sokol, 1999; Wylie et al., 1996). The canonical Wnt signaling pathway is required for the formation of the organizer, which is known as the shield in zebrafish (Schneider et al., 1996). The shield or organizer tissue secretes factors like Wnt and BMP antagonists that dorsalize the early embryo (Harland and Gerhart, 1997). Dorsalized ectoderm forms the neural plate, while more ventralized ectoderm forms the epidermis. Later in development, Wnt signaling is required to pattern the A-P axis within the neural plate (Kiecker and Niehrs, 2001; Nordstrom et al., 2002). Here an A-P Wnt signaling gradient is created in part by the secretion of Wnt antagonists predominantly in the anterior of the embryo (Bouwmeester et al., 1996; Glinka et al., 1998; Leyns et al., 1997). Support for the requirement of Wnt signaling in patterning the neural plate comes from overexpression studies in which overexpression of Wnt antagonists caused an enlargement of the head in Xenopus and zebrafish, while loss of function of Wnt antagonists resulted in the reduction of anterior tissues (Deardorff et al., 1998; Fekany-Lee et al., 2000; Glinka et al., 1997; Glinka et al., 1998; Heasman et al., 2000; Pierce and Kimelman, 1995). Additionally, mutations 25
50 that cause an increase in Wnt signaling result in the loss anterior head structures (Heisenberg et al., 2001; Kim et al., 2000; Mukhopadhyay et al., 2001). Finally, still later in development Wnt signaling is implicated in regulation of A-P cell fates within the anterior neural plate (Houart et al., 2002). In zebrafish, hdac1 is a negative regulator of the canonical Wnt signaling pathway that is required for D-V patterning of the embryo. Later in development, hdac1 regulation of the Wnt signaling pathway is required for the posterioization of the neural plate and regional patterning of the anterior neural plate (Nambiar and Henion, 2004). HDAC deacetylase inhibitors (HDACi) HDACs are enzymes and in the last few years HDAC inhibitors (HDACi) have been discovered as potential drug candidates for the treatment of cancer and multiple neurodegenerative diseases (Bolden et al., 2006; Guasconi and Puri, 2008; Hockly et al., 2003; Marks et al., 2001; Minucci and Pelicci, 2006). HDACi have been demonstrated to be particularly potent at killing cancer cells while not having many toxic side effects when compared to other treatments currently available (Minucci and Pelicci, 2006). In addition to beneficial effects in the treatment of cancer, in animal model studies, HDACi potentially through as yet undefined epigenetic mechanisms, have significant positive effects on disease progression in Huntingtons disease and Muscular dystrophy (Guasconi and Puri, 2008; Hockly et al., 2003; Minetti et al., 2006). It is currently thought that HDACi function by blocking access to the catalytic active site (reversible or irreversible) of HDAC enzymes (Finnin et al., 26
51 1999). There are many known HDACi, but the most potent one discovered so far is Trichostatin A, TSA. TSA had been used extensively in cell culture systems to facilitate efficient differentiation long before its effects on HDACs were known or defined. TSA belongs to the group of hydroxamic acids, and is effective at nanomolar concentrations in reversibly inhibiting both Class I and Class II HDACs in vitro (Minucci and Pelicci, 2006). Another well known group of HDACi are shortchain fatty acids such as butyrate, phenylbutyrate and valproic acid (Dokmanovic et al., 2007; Minucci and Pelicci, 2006). These compounds are far less efficient in their HDAC-inhibiting capability than TSA (millimolar compared to nanomolar range). The HDACi compounds butyrate, phenylbutyrate, depsipeptide, pyroxamide, suberoyl anilide bishydroxamide (SAHA) and valproic acid have been entered into clinical trials (Table 2) (Dokmanovic et al., 2007; Marks et al., 2001; Minucci and Pelicci, 2006). The consequences of treatment with HDACi in vivo and in vitro are growth arrest, increased differentiation and apoptosis (Minucci and Pelicci, 2006; Xu et al., 2007). While HDACi have been shown to be promising candidates in the treatment of cancer, the mechanisms by which they function are still being understood. Effects of HDACi treatment appear to be epigenetic, via the inhibition of multiple HDACs which in turn controls chromatin structure and gene expression. However, HDAC mediated deacetylation is not the only modification involved in regulating chromatin structure and clearly the effects of HDACi in the presence of other posttranslational modifications of histones regulates gene expression (Minucci and Pelicci, 2006). Additionally, roles for HDACs in DNA repair, replication, heterochromatin formation 27
52 and effects due to acetylation of non-histone proteins are continuously being discovered (Kurdistani and Grunstein, 2003; Minucci and Pelicci, 2006). While chromatin is a major substrate of HDACs it is not the only substrate. Hence, the impact of the acetylation on other non-histone proteins in disease treatment needs to be investigated. Also, while multiple potential targets of HDACi have been identified, there likely will be additional effects due to dose of drugs, period of treatment and differential effects based on tissue and or cell type treated. For this reason, it appears that use of HDACs as drug candidates for the treatment of cancers is counterintuitive to relatively well defined mechanisms for many approved drugs. However, in cell culture HDACi have proven to be robust yet selective in eliminating cancerous cell lines and vronistat, a HDAC inhibitor, has been approved in the limited use for the treatment of cutaneous T-Cell lymphoma a rare cancer. Hence, there is a need to address the requirements of HDAC biology at multiple levels including development. In chapter 3 of this dissertation, I explore concentration and temporal effects of HDAC inhibitor TSA during craniofacial and sympathetic neuron development and relate our findings to the hdac1 col mutant phenotypes and discuss its relevance. 28
53 TABLES AND FIGURES Cancer Isolated Syndromic Malformation Skin Melanoma (NRAS, BRAF, CDKN2A, MC1R) Neurofibromatosis (NF1) 1 in births Neurocutanou s melanosis Peripheral nervous system Neuroblastoma (RET), 13% of all childhood cancer deaths Schwannoma Paraganglioma Hischsprung+ neuroblastoma Congenital central hypoventilation (PHOX2B) Endocrine Pheochromocytoma (RET) Familial or sporadic medullary thyroid carcinoma Chromaffin paraganglioma Carcioid tumors Muliple endocrine neoplasis 2 A, B (RET) Craniofacial/ pharyngeal Hemagiocytoma Non- chromaffin paraganglioma Isolated Syndromic Piebaldism (KIT) Congenital giant nervus (1 in 100 births) Hischsprung 1 in 5000 births (RET, GDNF, ARAF, NTN, EDNRB, EDN3, PHOX2B) Waardenburg 1-4, 1 in 30,000 births (PAX3, MITF, SOX10, PHOX2B, SNAI2, EDNRB) Familial dysautonomia type 2 Cleft palate/lip (1 in 1000 births) Isolated conotruncal cardiopathies (1 in 500 births) Aplasia of lachrymal and salivary glands. DiGeorge (TBX1), 1 in 5000 births Pierre Robin Treacher-Collins- Franceschetti (TCOF1), 1 in 50,000 births Craniofrontonasal (EFNB1) Oro-facial-digital Table 1.1. Neural crest associated diseases with incidence and causative genes (Sources; Amiel and Lyonnet, 2001; Bolande, 1997; Etchevers et al., 2006; Kulesa et al., 2004; Nemecek et al., 2003) 29
54 Figure 1.1. Diagrammatic representation of neural crest induction. A, The neural crest is derived from the ectoderm at the border between the epidermis (non-neural ectoderm) and the neural plate (neural ectoderm); B, C, during neurulation the neural crest is present in the neural folds and finally at the top or crest of the neural tube, D, subsequently neural crest cells undergo an epithelial-messenchymal transformation, delaminate for the neural tube and migrate to their unique locations in the vertebrate embryo (source Marsha Lucas) 30
.")

55 Figure 1.2. Molecular Regulation of Neural Crest Induction. A gradient of BMP signaling is required to specify the NPB (neural plate border). In addition to BMP signaling, Wnt, FGF and Notch signaling pathways are also required to induce the NPB and neural crest gene expression which includes foxd3, sox9, snail1b and tfap2a (Adapted from Steventon et al., 2005) 31
 Ventral view of a dissected and flat mounted wild type jaw skeleton identifying the different elements. B) Lateral view of stained cartilage elements in wild type embryos.")
.")
56 Figure 1.3. Craniofacial development in zebrafish embryos. A and B, Alcian Blue staining of craniofacial cartilages in wild type embryos at 5 dpf. A) Ventral view of a dissected and flat mounted wild type jaw skeleton identifying the different elements. B) Lateral view of stained cartilage elements in wild type embryos. The first phanryngeal or mandibular arch is made up of the meckels and palatoquodrate cartilages (small arrows). The second pharyngeal or hyoid arch is comprised of the ceratohyal and hyosymplectic as the major components (arrowheads). The posterior 5 pharyngeal streams that form the Branchial arches consist of the 5 ceratobranchials and other minor cartilage elements (large arrows). C) The seven pharyngeal streams originate from four distinct populations of dlx2-expressing precursors at 25 hpf. The anterior most dlx2-positive population gives rise to the mandibular arch. The second cluster of dlx2-positive cells forms the hyoid arch. The third and fourth groups of dlx2- positive cells, gives rise to the posterior branchial arches. D) dlx2-positive CNC migrate ventrally into the pharyngeal pouches (black arrows indicating the direction of migration of CNC). E) is a cartoon representing the structure of a single pharyngeal pouch. Indicated are the unique gene expression patterns that are expressed by various components of the CNC and pharyngeal mesoderm, endoderm and ectoderm. M, mandibular; m, meckels; pq, palatoquadrate; H, hyoid; ch, ceratohyal; hs, hyosymplectic; BA; branchial arches; CB1-5, ceratobranchials 1 through 5; a, anterior; d, dorsal; v, ventral; p, posterior. (3 E adapted from Knight and Schilling, 2006) 32
 development A; Sympathetic neurons migrate along the ventral migratory")

57 Figure 1.4. Sympathetic neuron (SN) development A; Sympathetic neurons migrate along the ventral migratory pathway until they get localized adjacent to the dorsal aorta. B; Molecular expression of genes required for the differentiation of sympathetic neurons. NCC, neural crest cells; NT, neural tube; NO, notochord; SG, sympathetic ganglia; DA, dorsal aorta (Adapted from Huber, 2006) 33
58 Figure 1.5. Chromatin structure, modifications and gene expression A model representing A, chromatin structure; B, an individual nucleosome core which consists of two molecules of H2A and H2B and H3 and H4 histones; C, a single histone H3 which has a N- terminal tail and C-terminal globular domain both of which are highly conserved across eukaryotes; D, modifications which include acetylation, methylation, phosphorylation of conserved Lysine residues occur at N-terminal tail in H3 and other histone proteins. E, Indicated are potential Lysine residues which are acetylated, methylated, phosphorylated in the N-terminal tail of H3 and their generalized effects. The effects of higher order combinations is presently unclear (adapted from Strahl and Allis, 2000) 34

59 Figure
 In the absence of a Wnt signaling ligand, some β-catenin is bound to the cytosolic tail of cadherin proteins (not shown) and cytosolic β-catenin is bound by the APC-axin-GSK-3β degradation complex.")

60 Figure 1.6. A model for the activation of the Wnt/β-catenin signaling pathway. A) In the absence of a Wnt signaling ligand, some β-catenin is bound to the cytosolic tail of cadherin proteins (not shown) and cytosolic β-catenin is bound by the APC-axin-GSK-3β degradation complex. β-catenin is phosphorylated by GSK-3β in this complex. Phosphorylated β-catenin is ubiquitinated and targeted for proteosome mediated degradation. Consequently, Wnt-responsive target genes are repressed by the Groucho corepressor protein bound to the gene regulatory protein LEF-1/TCF. B) Wnt-ligand binding to Frizzled and LRP activates Dishevelled by an unknown mechanism. Activated Dishevelled through a chain of events results in the inactivation of GSK-β3 in the degradation complex. As a result, the phosphorylation and degradation of β-catenin is inhibited, and β-catenin accumulates in the cytoplasm and nucleus. In the nucleus, β-catenin binds to LEF-1/TCF, displaces Groucho, and acts as a coactivator to stimulate the transcription of Wnt target genes (adapted from Molecular biology of the cell 4 th Edition). 36
61 Class Compound HDAC target Potency Stage of development/ Pharmaceutical company Hydroxamates TSA Class I & II nm NA SAHA, Zolinza, vorinostat CBHA M- carboxycinnamic acid bishydroxamate Class I & II? µm µm Merck Food and Drug Administration approved for CTCL Merck Cyclic peptide Aliphatic Acids PDX-101 LBH-589 ITF2357 Depsipeptide (FK-228) Valproic Acid Phenyl butyrate Class I & II nm TopoTarget phase II Class I & II nm Novartis phase I Class I & II nm Italfarmaco phase I Class I nm Gloucester Pharmaceuticals phase IIb for CTCL and PTCL phases I and II Class I and IIa mm Abbot phase II Class I and IIa mm Phase II Butyrate Class I and IIa mm Phase II AN-9 (probutyric? acid) Benzamides MS-275 HDAC1,HDAC2, HDAC3 µm Titan Pharmaceuticals phase II µm Schering AG phase II Table 1.2. HDAC inhibitors in clinical trials (Adapted from Dokmanovic et al., 2007; Minucci and Pelicci, 2006); CTCL, cutaneous T-cell lymphoma; PTCL, peripheral T-cell lymphoma 37
62 CHAPTER 2 COLGATE/HDAC1 REPRESSION OF FOXD3 EXPRESSION IS REQUIRED TO PERMIT MITFA-DEPENDENT MELANOGENESIS 1. ABSTRACT Neural crest-derived pigment cell development has been used extensively to study cell fate specification, migration, proliferation, survival and differentiation. Many of the genes and regulatory mechanisms required for pigment cell development are conserved across vertebrates. The zebrafish mutant colgate (col) /histone deacetylase1 (hdac1) has reduced numbers, delayed differentiation and decreased migration of neural crest-derived melanophores and their precursors. In hdac1 col mutants, normal numbers of premigratory neural crest cells are induced. Later, while there is only a slight reduction in the number of neural crest cells in hdac1 col mutants, there is a severe reduction in the number of mitfa-positive melanoblasts suggesting that hdac1 is required for melanoblast specification. Concomitantly there is a significant increase in and prolonged 1 Ignatius, M. S., Moose, H. E., El - Hodiri H. M. and Henion, P. D. (2008). colgate/hdac1 repression of foxd3 expression is required to permit mitfa-dependent melanogenesis, Dev. Biol. 313(2), , Copyright 2008, with permission from Elsevier. All data herein was produced by M S Ignatius under the guidance of Paul Henion. Figure 9 was generated by H E Moose in the laboratory of H M El-Hodiri. 38
63 expression of foxd3 in neural crest cells in hdac1 col mutants. We found that partially reducing Foxd3 expression in hdac1 col mutants rescues mitfa expression and the melanophore defects in hdac1 col mutants. Further, we demonstrate the ability of Foxd3 to physically interact at the mitfa promoter. Because mitfa is required for melanoblast specification and development, our results suggest that hdac1 is normally required to suppress neural crest foxd3 expression thus derepressing mitfa resulting in melanogenesis by a subset of neural crest-derived cells. Keywords: neural crest, melanophore, histone deacetylase1, foxd3, mitfa; c-kit, zebrafish INTRODUCTION The neural crest is an embryonic cell population that gives rise to pigment cells, craniofacial cartilage and neurons and glia of the peripheral nervous system among other cell types (LeDouarin and Kalcheim, 1999). Neural crest cell-derived pigment cell development has been studied extensively, aided by a large number of pigment mutant loci in mice as well as zebrafish. There are more than 800 coat color alleles identified in mice, corresponding to 127 genetic loci (Bennett and Lamoreux, 2003). Similarly, almost 100 pigmentation mutants have been identified in multiple genetic screens in zebrafish (Henion et al., 1996; Kelsh et al., 1996; Odenthal et al., 1996). In birds and mammals, melanocytes are the only neural crest-derived pigment cells present. In contrast, there are three types of pigment cells or chromatophores present in zebrafish. They are the black, melanin-containing melanophores, the yellow, pteridine-containing 39
64 xanthophores and iridescent, purine-containing iridiphores. Henceforth, we will use the term melanophore to describe zebrafish, avian and mammalian melanocytes. Identification of many of the genes involved in pigment cell development has revealed that, by and large, regulation of melanophore development is conserved among vertebrates. One such conserved gene is microphthalmiaassociated transcription factor (mitf) which is a critical regulator of melanophore development. In humans, defects in MITF are associated with type 2a Waardenberg syndrome, which is characterized by hypopigmentation and deafness (Steingrimsson et al., 2004; Widlund and Fisher, 2003). Additionally, in humans, MITF is also found to be amplified in a fraction of malignant melanomas and can function as an oncogene (Garraway et al., 2005; Widlund and Fisher, 2003). Similar to defects in humans, the zebrafish mitfa mutant, nacre, completely lacks melanophores (Lister et al., 1999). The requirement for mitf in melanophore development is further underscored by experiments in which overexpression of mitfa in zebrafish produces ectopic pigmented cells and misexpression of Mitf in NIH/3T3 fibroblasts resulted in their conversion into a melanophore-like cell fate (Lister et al., 1999; Tachibana et al., 1996). In mice, mutations in Mitf reveal that in addition to a loss of melanophores, there are also variable defects in the eyes, osteoblasts and mast cell development depending on the severity of the mutations (reviewed by Steingrimsson et al., 2004; Widlund and Fisher, 2003). In zebrafish, there are two mitf co-orthologues, mitfa and mitfb, with mitfa being required for melanophore development (Lister et al., 1999; 40
65 Lister et al., 2001). mitf regulates the expression of multiple genes within the melanophore lineage including tyrosinase, tryp1, dct, c-kit, and bcl2 (reviewed in Steingrimsson et al., 2004). Given the central function of mitf in melanophore development, several genes and gene pathways have been shown to affect melanophore development via mitf at the transcriptional and post transcriptional level. Transcription factors and pathways that positively regulate mitf at the promoter level include CREB, sox10, pax3 and lef1/wnt/β-catenin signaling (Bertolotto et al., 1998; Bondurand et al., 2000; Dorsky et al., 2000a; Elworthy et al., 2003; Lee et al., 2000; Potterf et al., 2000; Price et al., 1998b; Saito et al., 2002; Takeda et al., 2000; Verastegui et al., 2000). Consistent with requirements of pax3 and sox10 for mitf expression, human mutations in PAX3 and SOX10 cause subtypes of Waardenburg syndromes, which overlap with hypopigmentation associated with Type 2a Waardenburg syndrome caused by defects in MITF (Pingault et al., 1998; Read and Newton, 1997; Steingrimsson et al., 2004). At the post translation level, the protoonco-receptor tyrosine kinase c-kit, via phosphorylation, affects Mitf protein activity and stability (Price et al., 1998a; Wu et al., 2000; Xu et al., 2000). The transcription factors sox10, pax3, and lef1 positively regulate mitfa transcription yet are also expressed and required by the precursors of other neural crest derivatives. Thus, it is not presently known how sox10, pax3 and lef1 specify melanophores within the neural crest cell population. It is likely that there are additional levels of regulation of mitfa and/or other transcription factors in 41
66 specifying melanogenic cell fate. A potential candidate for the regulation of melanophore specification is the Winged Helix transcription factor foxd3. foxd3 expression is induced in cells at the neural plate border and is extinguished prior to the initial expression of melanogenic sublineage-specific genes such as mitf (Kos et al., 2001; Odenthal and Nusslein-Volhard, 1998). Overexpression of foxd3 in avian embryos represses melanogenesis whereas morpholino mediated knockdown in avian neural crest cultures promotes melanogenesis (Kos et al., 2001). However, the mechanism by which foxd3 functions in melanophore development has not yet been established. Seemingly contrary to predictions from avians, in zebrafish foxd3 mutants and morphants, melanophore development is largely normal (Lister et al., 2006; Montero-Balaguer et al., 2006; Stewart et al., 2006). This apparent inconsistency is not presently understood. In our study, we take advantage of the co1 b382 mutation, that we have shown encodes histone deacetylase 1 (hdac1; Nambiar et al., 2007), in which there is a severe disruption of the specification, migration and differentiation of melanophores. We show that in hdac1 col mutants there is a misregulation of foxd3 expression such that foxd3 expression is extended for a prolonged period of time in neural crest cells compared to wild-type embryos. The melanophore phenotype in hdac1 col mutants, including mitfa expression, migration and overt differentiation, can be selectively rescued by a partial repression of foxd3 expression. Further, we demonstrate by EMSA assays binding of in-vitro translated Foxd3 protein to two putative Foxd3 binding sites of the mitfa promoter within a region capable of driving melanophore-specific expression (Dorsky et al., 42
67 2000) suggesting the possibility that foxd3 can represses melanophore specification and melanogenesis by directly inhibiting mitfa expression. Our results indicate that hdac1 is normally required, directly or indirectly, to repress foxd3 expression, and foxd3 repression is required to permit the induction of mitfa and subsequent mitfa-dependent melanophore development. RESULTS The zebrafish mutant colgate (co1 b382 ) is an ENU-induced, recessive larval lethal mutation (Henion et al., 1996; Nambiar and Henion, 2004). Mutants die between 7 and 9 dpf. The co1 b382 mutant was originally isolated in a screen for mutants with defects in neural crest development and was identified based on an abnormal melanophore pigment pattern (Henion et al., 1996). The co1 b382 locus was recently identified as histone deacetylase1 (hdac1; Nambiar et al., 2007). Melanophore development is abnormal in hdac1 col mutants. In wild-type embryos at 27 hpf, differentiated (melanin granule-containing) melanophores are found just posterior to the eye and posterior to the otic vesicle (Figure 2.1A). By 2 dpf, these melanophores have migrated dorsally and anteriorly over the head away from their site of origin (Knight et al., 2003; Schilling and Kimmel, 1994). In the trunk of wild-type embryos at 3 dpf (Figure 2.1C), melanophores are organized into distinct dorsal, lateral, ventral, and yolk stripes (Kelsh et al., 1996; Schilling and Kimmel, 1994). In hdac1 col mutants at 27 hpf, the total number of melanophores is reduced (Figure 2.1B) and those 43
68 present are located just posterior to the otic vesicle. Additionally, the hdac1 col mutant melanophores are hypo-pigmented compared to wild-type. Later, in hdac1 col mutants, at 2 dpf and 3 dpf, the melanophores that arise in the post otic region fail to migrate and instead form a distinctive patch of cells (data not shown, see Figure 2.1D). At 3 dpf, most of the melanophores in the trunk fail to migrate and instead are located in the dorsal stripe. hdac1 col mutants, compared to wild-type embryos, have fewer melanophores in the ventral stripe and only occasional melanophores are present in the lateral stripe. Additionally, only 0-6 melanophores migrate into the ventral stripe in the tail region in hdac1 col mutants as compared to wild-type embryos, where there are numerous melanophores present. The yolk sac stripe is absent in hdac1 col mutants and any individual melanophores present on the yolk are located anteriorly, close to the heart and near the post otic patch of melanophores. To quantify the melanophore phenotype, melanophore cell counts were performed in wild-type and hdac1 col mutant embryos between somites 5-15 at 60 hpf, 5 dpf and 8 dpf (Table 2.1, A). Cell counts are a sum of the dorsal, lateral and ventral stripe melanophores. At 60 hpf, hdac1 col embryos have only 59% of the number of melanophores present in wild-type embryos. The deficit in melanophore number in hdac1 col mutants recovers slightly to 63% of wild-type melanophores by 5 dpf. At 8 dpf, while wildtype melanophore numbers are the same as at 5 dpf, there is a decrease in melanophore numbers to 53% of wild-type in hdac1 col mutants. This indicates that between 5 and 8 dpf, some existing melanophores in hdac1 col mutants die or are demelanized. 44
69 The migration of melanophores was calculated as a percentage of melanophores present in the ventral stripe to the total number of melanophores present in the dorsal, lateral and ventral stripes. In wild-type embryos at 60 hpf to 8 dpf between 41-46% of the total melanophores are present in the ventral stripe. In contrast, in hdac1 col mutants, only 19-23% (Table 2.1, B) of the total melanophores are present in the ventral stripe. The melanophore defects do not recover in hdac1 col mutants. In contrast to melanophore development, xanthophore numbers and migration patterns, although initially delayed, are equivalent to wild-type embryos by 3 dpf in hdac1 col mutants (Figure 2.1C, 2.1D). hdac1 col is required for melanophore specification, migration and differentiation. The reduced number of melanophores and their abnormal migration in hdac1 col mutant embryos led us to examine whether there are differences in the expression of genes required for melanoblast specification, differentiation, migration and survival between wild-type and hdac1 col mutants. mitfa is a critical regulator of melanophore development that is required to specify melanoblasts beginning at the somite stage (Lister et al., 1999). In hdac1 col mutants, mitfa expression is delayed by approximately 1 hour (data not shown) and later, at 20 somites (data not shown) and qualitatively at 25 hpf (Figure 2.2A, 2.2B, 1.2G, 1.2H), there are fewer mitfa-positive melanoblasts specified compared to wild-type embryos. Further, in hdac1 col mutants, the expression of mitfa in the trunk does not extend as far caudal as in wild-type embryos and there are fewer 45
70 melanoblasts migrating ventrally as compared to wild-type embryos. At 30 hpf (Figure 2.11, 2.12), there are still fewer mitfa-positive melanoblasts in hdac1 col mutants compared to wild-type and most of these cells are located in the dorsal stripe and in the post-otic region, suggesting a general disruption of melanoblast migration. At 48 hpf (Figure 2.3A, 2.3B), mitfa is downregulated in most differentiating melanoblasts in wild-type embryos. In contrast, mitfa continues to be expressed in the reduced number of melanoblasts present in hdac1 col mutants, suggesting a failure in the downregulation of mitfa. Additionally, mitfapositive melanoblasts in hdac1 col mutants have still not migrated at this stage and are predominantly located in the post-otic region and the dorsal stripe. We also examined the expression of c-kit, a receptor tyrosine kinase required for migration and survival of melanoblasts (Parichy et al., 1999) in wildtype and hdac1 col mutants. By 25 hpf, the majority of the mitfa-positive melanoblasts also express c-kit. c-kit is expressed in migrating melanoblasts in the head and trunk regions. In addition to melanoblasts, c-kit is also expressed in the posterior notochord, near the anus, in the retina and in the branchial arches in wild-type embryos (Parichy et al., 1999). In hdac1 col mutants, very few c-kitexpressing melanoblasts are present at 25 hpf (Figure 2.2C, 2.2D, 2.2I, 2.2J), 30 hpf (Figure 2.12C, 2.12D) and 36 hpf (data not shown). In addition, c-kit expression in the few c-kit-positive melanoblasts in hdac1 col is also reduced when compared to the robust expression in wild-type melanoblasts. Later, by 48 hpf, the numbers of c-kit-positive melanoblasts and expression within melanoblasts does not recover to wild-type levels in hdac1 col mutants (Figure 2.3C, 2.3D). In 46
71 contrast to expression in melanoblasts in hdac1 col mutants, c-kit expression in the branchial arches and near the anus is normal and equivalent to wild-type embryos at equivalent stages. This suggests that the reduction/absence of c-kit expression in hdac1 col mutants is specific to melanoblasts. Dopachrome tautamerase (dct) is an enzyme required for melanin synthesis and hence an indicator of melanoblast differentiation (Kelsh et al., 2000). In wild-type embryos dct is robustly expressed in differentiating melanoblasts in the head and in the trunk including migrating melanoblasts beginning at 25 hpf. In contrast, in hdac1 col mutants the numbers of dct-positive melanoblasts are reduced in number and the melanoblasts are restricted in distribution to the regions posterior to the otic vesicle and in the dorsal stripe in the trunk at 25 hpf in hdac1 col mutants (Figure 2.2E, 2.2F). dct expression levels in hdac1 col mutant melanoblasts also appears to be reduced as compared to robust expression in wild-type melanoblasts at 25 hpf. Later at 30 hpf (Figure 2.12E, 2.12F), 36 hpf (data not shown) and 48 hpf (Figure 2.3E, 2.3F) most of the dct-positive differentiating melanoblasts are located in the dorsal stripe in the trunk and in a patch of cells just posterior to the otic vesicle, indicating a failure in migration. Finally, reduced numbers of dct-positive melanoblasts arise anterior to the otic vesicles at all stages observed in hdac1 col mutants. Taken together, the mitfa, c-kit and dct expression data indicate that early melanophore specification is delayed by an hour in hdac1 col mutants as compared to wild-type and there are fewer melanoblasts specified and those that are specified have defects in migration and differentiation. 47
72 In contrast to delayed differentiation and migration of melanophores and their precursors, in hdac1 col mutants there is no delay in the expression of xanthine dehydrogenase (xdh) (Figure 2.12I, 2.12J, Figure 2.3I, 1.3J), an enzyme that is expressed in differentiating xanthoblasts (Parichy et al., 2000). Also, fms, a receptor tyrosine kinase orthrologue of c-kit, required for xanthoblast survival and migration is expressed robustly in hdac1 col mutants and is equivalent to wild-type embryos at all stages analyzed (Figure 2.12G, 2.12H, Figure 2.3G, 2.3H) (Parichy et al., 2000). Thus, normal hdac1 function is selectively required for melanogenesis and is not required for xanthophore differentiation and migration. Neural crest cell induction and the migration of non-melanogenic neural crest cells are unaffected in hdac1 col mutants. Since there is a reduction of melanophores and their precursors during development, we decided to analyze the expression of genes expressed by premigratory and migratory neural crest cells to discern if there is a similar reduction in neural crest cells in hdac1 col mutants. At the 3 and 6-somite stages, there is no difference in the neural crest cell expression of tfap2a, sox9b, sox10 and snai1b between wild-type and hdac1 col mutant embryos (Figure 2.4 A-D, data not shown). Later, at the somite stage there is no difference in the expression of tfap2a, sox10, foxd3 and ctn between hdac1 col mutants and wildtype embryos (Figure 2.4 E- L). The early expression of tfap2a, sox10, snail1b, sox9b, foxd3 and ctn indicated to us that equivalent numbers of neural crest cells 48
73 are induced in hdac1 col mutants and wild-type embryos. By 24 hpf, there is a slight decrease in the number of cells expressing ctn and sox10 in the migrating trunk neural crest in hdac1 col mutants (Figure 2.4 M-P). There is also a slight delay in neural crest cell migration in the trunk in hdac1 col mutants. However, relative to the reduction in mitfa in hdac1 col mutants there are many more ctn and sox10 positive neural crest cells present. In cranial neural crest cells, there is no difference in the expression of sox10 and ctn between wild-type and hdac1 col mutants at 24 hpf, except in the region of the branchial arches where there are fewer ctn positive cells migrating out of the post otic region (data not shown). Overall, however, general neural crest migration in the trunk is much more robust than the migration of melanoblasts suggesting that non-melanoblast neural crest cells successfully migrate, albeit after a brief delay. Prolonged delay in the down regulation of foxd3 in hdac1 col mutants. Defects in melanophore development are first detectable at the level of mitfa expression in hdac1 col mutants. Therefore, we looked at the expression of the transcription factors tfap2a, foxd3, sna1b, sox9a/b and sox10 which are generally required earlier than mitfa in neural crest cell development. After 24 hpf, sox10 expression is downregulated in differentiating neural crest cell derivatives in wild-type embryos. However, in hdac1 col mutants there is a delay in extinguishing sox10 expression and sox10 continues to be expressed robustly in neural crest cells as late as 36 hpf and 52 hpf (unpublished data, Figure 2.5A, 1.5B). In addition to sox10, foxd3 is the only other transcription factor in which 49
74 there is a delay in downregulation in hdac1 col mutants compared to wild-type expression (Figure 2.5C-2.5J). Beginning at approximately 16 hpf, foxd3 expression is extinguished in the premigratory neural crest in wild-type embryos in a rostral to caudal fashion. By 24 hpf, foxd3 is only expressed in cranial satellite glia and in the premigratory neural crest at the tip of the tail (Figure 2.5C). At 30 hpf, foxd3 is no longer expressed in the neural crest, but continues to be expressed in cranial satellite glia (Kelsh et al., 2000). In contrast, at 24 hpf in hdac1 col mutants, foxd3 continues to be expressed in trunk neural crest cells, in addition to premigratory neural crest cells in the tail region (Figure 2.5D). In the cranial region, there is an increase in foxd3-positive cells in hdac1 col mutants compared to wild-type embryos (Figure 2.5E, 2.5F). The location of the foxd3- positive cranial neural crest cells in the area of the cranial satellite glia suggests that there are more cranial satellite glial cells in hdac1 col mutants as compared to wild-type embryos. However, as the domain of foxd3 expression is expanded in hdac1 col mutants relative to wild-type embryos, it is possible that some of the foxd3 positive cells could also be undifferentiated neural crest cells in addition to cranial satellite glia. At 30 hpf (data not shown) and 36 hpf (Figure 2.5G, 2.5H), foxd3 continues to be expressed in the premigratory neural crest cells in the tail, while in wild-type embryos, foxd3 is no longer expressed. Finally, at 48 hpf, foxd3 is no longer expressed in the premigratory neural crest cells in the tail and the number of foxd3 positive presumptive cranial satellite glia in hdac1 col embryos is greater than in wild-type (data not shown, Figure 2.5I, 2.5J). Thus, overall, there 50
75 is a significant delay in the downregulation of foxd3 expression in neural crest cells in hdac1 col mutants. Reduction of foxd3 expression in hdac1 col mutants rescues melanophore numbers and migration. The prolonged expression of foxd3 in trunk neural crest cells and reduced expression of mitfa, raised the possibility that continued expression of foxd3, which can function as a transcriptional repressor (Pohl and Knochel, 2001), could result in the repression of melanogenesis in hdac1 col mutants (Kos et al., 2001). To test this hypothesis, we designed two strategies to reduce foxd3 expression in hdac1 col -/- mutants. First, we knocked down FoxD3 protein using a translation blocking morpholino (Stewart et al., 2006). The second approach was to generate hdac1 col -/- ; foxd3 zdf10-/- double mutants. 20 ng of the foxd3 morpholino per embryo used in this study can phenocopy the complete loss of sympathetic neurons in foxd3 zdf10 mutants, the foxd3 mutant allele formerly known as foxd3 sym1 (Stewart et al., 2006). In our study, a 20-fold dilution of between ng of foxd3 morpholino per embryo was used to partially knockdown Foxd3. The injection of ng of morpholino per wild-type embryo results in the partial reduction in the number of tyrosine hydroxylase-positive sympathetic neurons at 56 hpf (Figure 2.11A-D). Partial knockdown of Foxd3 resulted in an initial delay in melanophore differentiation, as is the case in both hdac1 col mutants and foxd3 zdf10 mutants. In contrast, by 2 dpf (data not shown) and later at 3 dpf (Figure 2.6 A-D), there is an 51
76 increase in melanophore number and many more melanophores are migrating over the anterior head, over the yolk and in the tail of hdac1 col /foxd3 mutant/morphant embryos. In hdac1 col embryos most of the melanophores in the trunk fail to migrate and are located in the dorsal stripe. As a result the dorsal stripe is at least 3-5 melanophores wide in hdac1 col compared to the 2-3 melanophore wide dorsal stripe in wild-type (Figure 2.6E, 2.6F). Partial knock down of Foxd3 via morhpolino injection, resulted in the migration of melanophores from the dorsal stripe of the hdac1 col /foxd3 mutant/morphant embryos into the ventral stripe and over the yolk sac. The resulting dorsal stripe in hdac1 col /foxd3 mutant/morphants is reduced to the wild-type 2-3 melanophore width (Figure 2.6G, 2.6H). To score for the rescue of melanophore number and migration, the following 3 minimum criteria were established based on the hdac1 col mutant phenotype. First, there must be migration of melanophores into the anterior head, since very few melanophores are found migrating over the head in hdac1 col mutants (Figure 2.6B, 2.6D, arrowhead). Second, in the trunk, there must be an increase in the migration of melanophores over the yolk sac ( 15 melanophores), compared to mutants in which melanophores are only rarely present over the posterior yolk sac and in the yolk extension region (Figure 2.6B, 2.6D). Finally, in the ventral stripe of the tail, there are usually between 0 and 6 melanophores present in hdac1 col embryos (Figure 2.6B, 2.6D). Therefore, a rescued mutant must have more than 6 melanophores present. Based on these criteria, 84% of the hdac1 col embryos injected with foxd3 morpholino showed rescue of the 52
77 melanophore phenotype (n= 72, Table 2.2 a ). We quantified the rescue of melanophore number and migration by performing melanophore cell counts at 60 hpf in somites 5 through 15 of the trunk in wild-type/foxd3 morphant and hdac1 col /foxd3 mutant/morphant embryos (Table 2.3). Melanophore counts are a total of pigmented melanophores present in the dorsal, ventral and lateral stripes. There is a statistically significant increase in melanophore numbers from 68±10.7 to 86±11.1 in hdac1 col /foxd3 mutant/morphants as compared to uninjected hdac1 col -/- mutants (P< 0.05). Additionally, wild-type and hdac1 col -/- embryos injected with foxd3 morpholino have statistically equivalent number of melanophores in the trunk showing a rescue of the melanophore phenotype at 60 hpf (92±17.1 vs. 86.3±11.13 melanophores, P>0.05). However, wild-type/foxd3 morphants have fewer melanophores as compared to uninjected wild-type embryos (92±17.1 vs. 109± 8.7 melanophores, P <0.05) at 60 hpf. This is consistent with the delay in melanophore development in foxd3 zdf10 mutants (Stewart et al. 2006). In addition to the rescue of melanophore numbers, there is a rescue in the migration of melanophores into the ventral stripe in hdac1 col /foxd3 mutant/morphant embryos as compared to uninjected hdac1 col -/- embryos (Table 2.3). The percentage of melanophores that migrate into the ventral stripe is statistically the same between wild-type uninjected, wild-type/foxd3 morphants and hdac1 col /foxd3 mutant/morphant embryos at 60 hpf. We then reduced foxd3 expression genetically by mating hdac1 col +/- ; foxd3 zdf10+/- double mutant heterozygous carriers. There are 4 distinct phenotypes observed: wild-type, foxd3 zdf10 mutants, hdac1 col mutants and hdac1 col ; foxd3 zdf10 53
78 double mutants (Figure 2.7 A-D). In a heterozygous cross between double mutant hdac1 col+/- ; foxd3 zdf10+/ - heterozygous carriers, the following ratio of phenotypes was obtained wild-type: hdac1 col : foxd3 zdf10 : hdac1 col ;foxd3 zdf10 ::152:48:52:17 confirming a Mendelian 2 factor ratio of 9:3:3:1. Loss of hdac1 col and foxd3 function in hdac1 col -/- ; foxd3 zdf10 -/- double mutants, resulted in the reduction of the total number of melanophores at all stages observed, compared to foxd3 zdf10 -/- or hdac1 col -/- single mutants or wild-type embryos. This indicates a genetic interaction between hdac1 col and foxd3 zdf10 in melanophore development which is only revealed when both genes are simultaneously knocked out. In separate genetic incrosses of hdac1 col +/- ; foxd3 zdf10+/- double heterozygous carriers, we observed that of the mutant embryos which are phenotypically hdac1 col, 10 % (n= 80) have a rescue of melanophore number and migration (Figure 2.7 E). Based on the hypothesis that foxd3 represses melanogenesis we would predict that the rescued hdac1 col mutants should also be heterozygous for foxd3. Genotyping the rescued hdac1 col mutants for foxd3 allele status with closely linked polymorphic SSLP marker z5294 revealed that all rescued hdac1 col mutants were also foxd3 zdf10+/- (Table 2.2 b ). Additionally, although not all completely satisfying the rescue criteria, 42.5 % (n= 80) of hdac1 col mutant embryos derived form a double heterozygous cross (hdac1 col +/- ; foxd3 zdf10+/ - ) have more melanophores present, qualitatively and a greater migration of these melanophores over the head and into the lateral and ventral stripes, especially in the tail region as compared to more severe melanophore number and migration defects in hdac1 col -/- mutants obtained from 54
79 a hdac1 col +/- only heterozygous incross. This is significant as we would expect 50% of hdac1 col mutants from a hdac1 col+/- ; foxd3 zdf10+/- double heterozygous incross to also be heterozygous for foxd3 zdf10. Partial morpholoino-mediated knock down of foxd3 function in hdac1 col mutants produced a more efficient (>80% vs. 10%) rescue of melanophore number and migration as compared to hdac1 col +/- ; foxd3 zdf10+/ - double mutant analysis. It is possible that the level of Foxd3 present within the neural crest cells is important for its function to repress melanogenesis and that in many of the hdac1 col -/- ; foxd3 zdf10+/- mutants Foxd3 levels are sufficiently high to prevent complete rescue of the melanophore phenotype. Therefore, we reasoned then that by still further reducing Foxd3 using foxd3 morpholino in the hdac1 col -/- ; foxd3 zdf10+/-, or hdac1 col -/- ; foxd3 zdf10+/+ mutants would enhance the melanophore rescue phenotype. This was observed, wherein 62.5 % (n= 80, Table 2.2 b, Figure 2.13 A-D) of phenotypically hdac1 col mutants obtained from a hdac1 col +/- ; foxd3 zdf10+/- double heterozygous incross injected with ng of foxd3 morpholino have a complete rescue of melanophore number and migration. In contrast, reducing Foxd3 using morpholino in hdac1 col -/- ; foxd3 zdf10 -/- double mutants which already completely lack functional Foxd3 has no effect on melanophore recovery. Taken together, the morpholino and double mutant approaches indicate that foxd3 represses melanogenesis in hdac1 col mutants and this repression can be eliminated by partially reducing Foxd3 expression. Also, a complete loss of foxd3 in hdac1 col mutants results in more severe melanophore defects as compared to relatively 55
80 milder defects in single hdac1 col -/- or foxd3 zdf10 -/- mutants indicating a genetic interaction between hdac1 and foxd3 in melanophore development. Foxd3 may repress melanogenesis at the the level of mitfa. The observation that melanoblast-specific expression of both mitfa as well as c-kit is significantly reduced in hdac1 col mutants raised the question as to whether foxd3 represses melanogenesis at the level of either or both mitfa and c- kit. To address this question we analyzed hdac1 col /foxd3 mutant/morphants for recovery of mitfa and/or c-kit expression. 84% of hdac1 col /foxd3 mutant/morphants have a recovery of melanophore number and migration at 3 dpf. We performed in situ hybridization for mitfa and c-kit in hdac1 col /foxd3 mutant/morphant and wild-type/foxd3 morphant embryos with uninjected wildtype and hdac1 col mutants as controls. At 32 hpf, there is an increase in the number of mitfa- positive melanoblasts in hdac1 col /foxd3 mutant/morphants as compared to uninjected hdac1 col mutant embryos (Figure 2.8 A-D). In wildtype/foxd3 morphant embryos, although there is no difference in the number of mitfa-positive melanoblasts, qualitatively, there is a slight decrease in the number of mitfa-positive melanoblasts migrating as compared to uninjected wild-type embryos. However, mitfa continues to be expressed robustly in melanoblasts in wild-type/foxd3 morphants as well as hdac1 col /foxd3 mutant/morphants, when compared to uninjected wild-type or hdac1 col mutants. Next, we analyzed c-kit expression at 32 hpf in hdac1 col /foxd3 mutant morphants and wild-type/foxd3 morphants. In hdac1 col /foxd3 mutant/morphants, c-kit expression does not 56
81 recover and is similar to uninjected hdac1 col mutants (Figure 2.8 E-H). In hdac1 col /foxd3 mutant/ morphants embryos the rescue of the differentiated black pigmented melanophore number and migration is only clearly visible by 2 dpf. Therefore, we also analyzed c-kit expression at 48 hpf in hdac1 col /foxd3 mutant/ morphants and wild-type/foxd3 morphants. At 48 hpf, qualitatively there is a slight increase in c-kit expression levels in hdac1 col /foxd3 mutant morphant embryos when compared to uninjected hdac1 col mutants (data not shown). However, c-kit expression in hdac1 col /foxd3 mutant/morphant melanoblasts remains significantly reduced compared to wild-type or wild-type/foxd3 mutant/ morphants. This indicates that foxd3 initially genetically represses melanogenesis at the level of mitfa and not c-kit in hdac1 col mutants. This data also correlates with the expression pattern of foxd3 in wild-type embryos where at s stages foxd3 is switched off in a rostral-caudal fashion in the premigratory neural crest, while mitfa starts to be expressed around the same time in a rostral-caudal fashion. In hdac1 col mutants, foxd3 fails to be downregulated and mitfa expression is repressed. Analysis of an 836 bp promoter region of mitfa which is sufficient to drive melanoblast-specific expression of mitfa (Dorsky et al., 2000) contains two putative foxd3 binding sites. The predicted Foxd3 binding sites are located overlapping the ATG transcriptional start site and 171 bp upstream of the translation start site of mitfa. The -171 bp site is present clustered between two functional sox10 (S1 and S3) binding sites in the mitfa promoter region (Elworthy et al., 2003). We decided to test whether Foxd3 can bind directly to the mitfa 57
82 promoter. We used electrophoretic mobility shift assays (EMSA) to investigate the interaction of Foxd3 with the predicted forkhead sites in the mitfa promoter. We found that in vitro translated (IVT) Foxd3 was capable of interacting with probes spanning either predicted forkhead site to form complexes exhibiting retarded electrophoretic mobility (Figure 2.9). We observed competition for formation of the complex using an excess of unlabeled wild type competitors. No competition was observed when we added an excess of mutated or nonspecific (OCTA) competitors. These results indicate that Foxd3 can specifically interact with both predicted forkhead binding sites in the mitfa promoter. DISCUSSION Our analysis of the hdac1 col mutant has revealed that hdac1 is indirectly required for melanogenesis during zebrafish neural crest development. We found that expression of the transcription factor foxd3 fails to be extinguished in neural crest cells of hdac1 col mutants in a temporally appropriate manner and that concomitantly, mitfa expression and melanogenesis are suppressed. We also found that Foxd3 is capable of physically interacting at the mitfa promoter, raising the possibility that foxd3 acts as a repressor of mitfa expression. Together, our results suggest that hdac1 function is required to repress foxd3 expression thereby permitting the expression of mitfa and melanophore specification of a subset of neural crest cells during development. Thus, we identify hdac1 as a regulator of neural crest development and identify a mechanism by which foxd3 is capable of repressing melanogenesis. 58
83 Hdac1 and foxd3 expression The mechanism of action by which hdac1 col affects the expression of foxd3 within the neural crest is not known. However, it is known that the acetylation and deacetylation and other post-translational modifications of histone tails are important in the regulation of chromatin structure, which in turn plays an important role in regulating eukaryotic gene expression (Jenuwein and Allis, 2001; Rice and Allis, 2001; Strahl and Allis, 2000). Transcriptionally active chromatin usually has highly acetylated histone cores and transcriptionally inactive chromatin is associated with deacetylated histones (Ahringer, 2000; Allfrey, 1966). Histone acetylases (HATs) and histone deacetylases (HDACs) are required to control the acetylation and deactylation of histones (Marks et al., 2003; Roth et al., 2001). This suggests the possibility that the deacetylation activity of HDAC1 is necessary to extinguish foxd3 expression, in response to an unknown signal, and that the disruption of HDAC1 function in hdac1 col mutants results in the failure to extinguish foxd3 expression, resulting in the repression of melanogenesis. However, in addition to regulating transcription via controlling chromatin conformation, HATs and HDACs are also known to regulate several non-histone proteins via acetylation and deactylation. Changing the acetylation status on proteins has been shown to regulate protein stability, protein-protein interactions, sub-cellular localization of proteins and also regulate DNA binding (Minucci and Pelicci, 2006) suggesting that gene regulation by HDACs including HDAC1 is likely to be more complex than just histone acetylation states. Thus, 59
84 whether hdac1 directly regulates foxd3 expression and the mechanism by which this regulation occurs will require further investigation. A similar mechanism of mitfa regulation by Foxd3 in avian and zebrafish embryos Our finding that repressing foxd3 expression in hdac1 col mutants rescues mitfa expression and melanogenesis can be thought of as an experimental recapitulation of normal development. Specifically, in wild-type zebrafish embryos, the termination of neural crest foxd3 expression is temporally and spatially contemporaneous with the induction of mitfa expression and melanophore specification. Our finding that Foxd3 is capable of interacting at the mitfa promoter in vitro indicates the possibility that this interaction could be direct in vivo. Consistent with this possibility, it has been reported that overexpression of foxd3 in melanoma cell lines repressed the expression of endogenous mitf (Lister et al., 2005; Thomas and Erickson, 2006). Also, in chick it has been reported that Foxd3 can repress luciferase expression driven by the chick Mitf promoter and that Foxd3 can physically interact with the chick Mitf promoter (Thomas and Erickson, 2006). However, a more rigorous analysis of this interaction will be required to determine whether it occurs directly in zebrafish embryos. In any case, it is important to emphasize that the termination of foxd3 expression is permissive, not instructive, for melanogenesis. This is indicated by the fact that most if not all premigratory neural crest cells express foxd3 whereas only a subset of the neural crest cell population develop as melanophores. 60
85 Instructive cues likely include pax3, CREB, sox10 and lef1 based on their demonstrated ability to positively regulate mitf (Bertolotto et al., 1998; Bondurand et al., 2000; Dorsky et al., 2000; Elworthy et al., 2003; Lee et al., 2000; Potterf et al., 2000; Price et al., 1998b; Saito et al., 2002; Takeda et al., 2000; Verastegui et al., 2000). However, as these factors are more broadly expressed in the neural crest population than mitfa, it remains to be determined what factors limit the induction of mitfa within the neural crest cell population. Nevertheless, our results strongly suggest that the termination of foxd3 expression during normal development, mediated at least in part by hdac1, is required for melanogenesis to occur (Figure 2.10). The effects of the hdac1 col mutation on neural crest sox10 expression may be informative. Briefly, we found that, like foxd3, sox10 expression is inappropriately extended in hdac1 col mutants. In fact, the expression of both transcription factors is expanded among cranial neural crest cells and appears to result in an expansion of cranial satellite glial numbers. This consequence is consistent with the requirement for both sox10 and foxd3 in zebrafish for cranial satellite glial development (Dutton et al., 2001; Kelsh and Eisen, 2000; Kelsh et al., 2000; Stewart et al., 2006). In contrast, the extension of neural crest sox10 expression in hdac1 col mutants might be predicted to increase melanogenesis given the requirement for sox10 for melanogenesis (Dutton et al., 2001; Elworthy et al., 2003; Kelsh and Eisen, 2000) and the direct positive regulation of mitfa by sox10 (Elworthy et al., 2003). However, the fact that melanogenesis remains suppressed in hdac1 col mutants suggests that sox10 is incapable of promoting 61
86 mitfa expression when foxd3 is expressed, further indicating a requirement for foxd3 expression termination for melanogenesis via mitfa. Consistent with our data, it has been reported that foxd3 represses sox10 mediated transcriptional activation of luciferase driven by the 836 bp endogenous zebrafish mitfa promoter (Lister et. al., 2005). Although this suggests a hierarchical relationship, more sensitive means of quantifying expression than in situ hybridization will be required to detail the in vivo regulation of mitfa by sox10 and foxd3. The melanophore phenotype rescue of hdac1 col mutants by reducing foxd3 expression levels is somewhat surprising given the apparent lack of a concomitant rescue of c-kit expression by melanogenic neural crest cells. C-kit has been shown to be required for melanophore migration and survival in zebrafish (Parichy et al., 1999). Thus, the rescue of melanophore migration in rescued hdac1 col mutants in which c-kit remains suppressed is puzzling. It is formally possible that repression of foxd3 in hdac1 col mutants results in the expression or overexpression of an unknown factor or factors that facilitate melanophore and melanophore precursor migration in the absence of c-kit. Instead, we suggest that this apparent quandary is most likely due to the relatively insensitive in situ hybridization method of detecting gene expression. For example, in the zebrafish c-kit mutant sparse (spa), melanophore migration fails, there is extensive melanophore cell death, and a patch of melanophores forms behind the ear (Parichy et al.., 1999). While these phenotypes are also characteristic of hdac1 col mutants, they are less severe. For example, some melanophores migrate and fewer die in hdac1 col mutants than in spa mutants 62
87 suggesting the presence of at least low levels of c-kit expression in hdac1 col mutant melanophores. Thus, we speculate that c-kit expression in rescued hdac1 col mutants is elevated to levels permitting extensive migration and survival of melanophores but at expression levels still below that which can be readily detectable by in situ hybridization. Thus, we suggest that the principle consequence on melanogenesis of foxd3 expression is the suppression of melanophore specification due to the repression of mitfa. Our data suggests a similar function of foxd3 in repressing melanogenesis in zebrafish and chick systems, in contrast to earlier studies in which there appeared to be differences. In zebrafish, loss of foxd3 in foxd3 zdf10 mutants generally does not affect neural crest induction and does not affect melanophore development, although there is a slight delay in differentiation (Stewart et al., 2006). Additionally, in zebrafish, loss of function of foxd3 suggests that foxd3 is required in premigratory and migratory neural crest for subsets of neural crest derivatives which include neurons and glia of the peripheral nervous system, and posterior elements of the pharyngeal skeleton (Lister et al., 1999; Montero- Balaguer et al., 2006; Stewart et al., 2006). In chick, electporation of foxd3 into the neural tube induces a neural crest cell-like fate (Cheung et al., 2005; Dottori et al., 2001; Kos et al., 2001). In addition, foxd3 overexpression prevents the migration of neural crest cells onto the dorso-lateral pathway and most cells migrate along the medial pathway. Neural crest cells that migrate on the dorsalateral pathway in avian embryos are exclusively melanophores and never express foxd3, while those that migrate along the medial pathway form neurons 63
88 and glia and initially express foxd3, which is then extinguished in late migrating neural crest cells (Dottori et al., 2001; Kos et al., 2001). Further, knock down of Foxd3 via morpholinos in avian neural crest cultures increases the numbers of melanophores without affecting proliferation, indicating that foxd3 represses melanogenesis (Kos et al., 2001). Conflicting results obtained in chick and zebrafish argue for differences between the chick and zebrafish systems. However, our data reconciles differences between these two systems by defining gain of function requirements of foxd3 in zebrafish. In this study, we demonstrate that as a result of temporally abnormal foxd3 expression after it has normally been extinguished in neural crest cells, fewer melanophores are specified. This abnormal gain of function of foxd3 in the hdac1 col mutants along with a loss of function in foxd3 zdf10 mutants and knock down via morpholino suggests that while foxd3 is not necessary to specify melanophores, it can repress specification when present. Reconciliation between the apparent induction of neural crest-like cells in chick in response to foxd3 misexpression and the absence of this effect in zebrafish remains to be investigated. Materials and methods Animal husbandry Adult zebrafish and embryos were raised and maintained at 28.5 C in the Ohio State University zebrafish facility. hdac1 col -/- mutant embryos were obtained by pair wise matings of heterozygous adult zebrafish that were maintained in AB and WIK backgrounds. Embryos were staged according to Kimmel et al. (Kimmel 64
89 et al., 1995). In order to determine the genotype of embryos before a visible phenotype was clearly apparent, genomic DNA from individual embryos was obtained and PCR was performed using chromosome 19-linked polymorphic SSLP markers that have been shown to be closely linked to the hdac1 col locus (Knapik et al., 1996; Nambiar and Henion, 2004; Nambiar et al., 2007). The hdac1 col +/- ;foxd3 zdf10+/- double mutant line was created by crossing foxd3 zdf10+/- (Stewart et al., 2006) heterozygous carriers, formerly known as foxd3 sym1, to hdac1 col +/- (b382) heterozygous carriers and double mutant embryos genotyped using the markers above and SSLP markers for the foxd3 zdf10 locus (Stewart et al., 2006). In situ hybridization In situ hybridization was carried out on staged embryos as described previously (Thisse et al., 1993) with minor modifications. Embryos over 24 hpf were raised in 0.03 g/l 1-phenyl-2- thiourea (PTU) to prevent melanin synthesis. Probes used were tfap2a (Knight et al., 2003), c-kit (Parichy et al., 1999), crestin (Luo et al., 2001; Rubinstein et al., 2000), dct (Kelsh et al., 2000), fms and xdh (Parichy et al., 2000), foxd3 (Kelsh et al., 2000a; Odenthal and Nusslein- Volhard, 1998), snai1b (Thisse et al., 1995), sox9b (Li et al., 2002), sox10 (Dutton et al., 2001) and th (An et al., 2002). Melanophore cell counts and statistical analysis Melanophore cell counts were performed between somites 5 and 15 in the dorsal, ventral and lateral stripes under a dissecting microscope. In order to 65
90 facilitate counts, embryos were first treated with epinephrine for 5 minutes to contract the melanosomes (Johnson et al., 1995; Parichy et al., 1999; Rawls and Johnson, 2000). Melanosome contraction in hdac1 col mutants took between 15 and 20 min. Embryos were then fixed in 4% paraformaldehyde in PBS. Cell counts were carried out at 60 hours post fertilization (hpf), 5 days post fertilization (dpf), and 8 dpf in wild-type and mutant embryos. For each time point, between 7 and 11 embryos were counted and data analyzed using 2-way ANOVA and Bonferroni post hoc tests. Graph prism pad version 4.0 software was used to conduct statistical analysis and graph data. Morpholino injections The foxd3 morpholino is a translation blocking morpholino (Stewart et al., 2006). The sequence of the morpholino is as follows: 5 CAC CGC GCA CTT TGC TGC TGG AGC A 3 (Gene tools Inc.). The concentration of morpholino used in experiments was 0.25 mm. Complete phenocopy of foxd3 zdf10 was achieved by injecting 20 ng of morpholino per embryo (Stewart et al., 2006). In our experiments ng of morpholino was injected per embryo which partially knocks down Foxd3 (Supplementary figure 1). Uninjected embryos from heterozygous carrier crosses were used as controls. EMSA assays Electrophoretic mobility shift assays (EMSAs) were performed using in vitro translated proteins as described previously (Voronina et al., 2004). Foxd3 66
91 protein was synthesized from pcs2/foxd3 in vitro (Lister et al., 2006) (Quick TNT Linked In Vitro Transcription/Translation Kit; Promega) with the addition of [ 35 S]-methionine (Amersham). Proper translation was verified by SDS-PAGE and autoradiography. EMSAs were performed using annealed double-stranded oligonucleotide probes representing the predicted forkhead binding sites from the mitfa promoter (GenBank accession # AF211890), Site 1 (nucleotides ; Site 1 wt F: 5 - ATG CTG AGA ACA AAC AAT GTT TTA TGC AG) and Site 2 (nucleotides ; Site 2 wt F: 5 - CGT TTG GGT AAA AAA AAC AAT ATG AGA AGA). For competitions, a 100-fold molar excess of unlabelled doublestranded oligonucleotide was included. Competitors used represented the wild type or mutated Site 1 or Site 2 or the unrelated oct1 binding site, OCTA (Hinkley and Perry, 1991), Site 1 mut F: 5 - ATG CTG ATg gca ggg gat GTT TTA TGC AG Site 2 mut F: 5 - CGT TTG GGT Agg gaa gga gat ATG AGA AGA (changed bases are in lower case). 67
92 TABLES AND FIGURES Hours/ days post fertilizati on 60 hpf 110± dpf 143±6.5 8 dpf Trunk melanophores (±1 SD) Melanophore migration Melanophore # {Ventral (%) a } wt hdac1 col wt hdac1 col ± ±8.44 *** 90.64±11.2 6*** 72.36±12.3 *** 41.24± ±9.64 *** 43.13± ±6.5* ** 45.69± ±6.96 *** Percentage of wt melanophore s in hdac1 col 59.13% 63.38% 53.35% Table 2.1. Reduced melanophore number and migration in hdac1 col mutants compared to wild-type. Significantly lower melanophore numbers were present at all times post fertilization (***, p<0.001) in hdac1 col mutants compared to wild-type. In addition to lower melanophore numbers significant impairment of melanophore migration was also noticed in hdac1 col mutants when compared to wild-type controls at 2.5, 5 and 8 dpf (***, p<0.001). Melanophore counts were performed in somite 5 through 15 in the dorsal, lateral and ventral stripe. n=8-11/group were counted at 60 hpf (2.5 dpf), 5 dpf, and 8 dpf. Melanophore migration {Ventral (%) a }; Migration is calculated as a percentage of melanophores in the ventral stripe to the total number of melanophores in the dorsal, ventral and lateral stripes. 2-way ANOVA with Bonferroni post hoc test was used to analyze data. 68
93 hdac1 col Foxd3 genotype Foxd3 morpholino injected #/ % of rescued hdac1 col mutants at 3 dpf a hdac1 col -/- +/+ 0 2/134 (1.5%) a hdac1 col -/- +/ ng 61/72 (84.7%) b hdac1 col -/- ;foxd3 zdf10+/+ hdac1 col -/- ;foxd3 zdf10+/- hdac1 col -/- ;foxd3 zdf10-/- b hdac1 col -/- ;foxd3 zdf10+/+ hdac1 col -/- ;foxd3 zdf10+/- hdac1 col -/- ;foxd3 zdf10-/- +/+ +/- -/- +/+ +/- -/ ng ng ng 0/20 7/34 0/21 Overall rescue 8/80 (10%)* 14/24 36/41 0/13 Overall rescue 50/80 (62.5%)^ Table 2.2. Rescue of melanophore number and migration in hdac1 col mutants at 3 dpf by reducing foxd3 levels genetically, by morpholino mediated translational interference, or both. a Single hdac1 col control and hdac1 col /foxd3mo mutant/morphant embryos scored for rescue of the melanophore phenotype. b Control and foxd3 morpholino treated hdac1 col embryos obtained from a hdac1 col +/- ;foxd3 zdf10+/- double heterozygous incross. Closely linked SSLP marker z5294 was used to determine foxd3 genotype. * Genotypes of 5/80 control embryos were not determined, including 1 rescued embryo. ^ Genotypes of 2/80 embryos were not determined, 1 of the 2 embryos was a potential double mutant based on phenotype. 69
94 Uninjected controls foxd3 morphants Melanophore # Trunk melanophores (± 1 SD) Melanophore migration {Ventral (%) a } wt hdac1 col Wt hdac1 col ± ±10.73*** 43.26± ±3.23*** 92.71± ±11.13^ 45.27± ±9.41^ ^ ^ Table 2.3. Rescue of melanophore number and migration at 60 hpf in hdac1 col mutants by low dose of foxd3 morpholino injection. hdac1 col mutants have significantly lower melaphore number than uninjected wild-type embryos (***, p<0.001). Partial knock down of Foxd3 in hdac1 col mutants rescued melanophore number significantly, as compared to uninjected hdac1 col mutants (^, P<0.05), also melanophore number between wildtype/foxd3 morphants and hdac1 col /foxd3 mutant/morphants were comparable. Significantly lower migration was noted in hdac1 col mutants embryos at 60 hpf (***, p<0.001). Partial knock down of Foxd3 resulted in comparable melanophore migration between hdac1 col /foxd3 mutant/morphants, wild-type/foxd3 morphants and wild-type embryos. n=7 for all groups. Melanophore migration {Ventral (%) a }; Migration is calculated as a percentage of melanophores in the ventral stripe to the total number of melanophores in the dorsal, ventral and lateral stripes. 2-way ANOVA with Bonferroni post hoc test was performed. 70

95 Figure 2.1. Melanophore development is defective in hdac1 col mutants. Lateral views of live embryos at 27 hpf (A, B) and 3 dpf (C, D). A, B: At 27 hpf in wild-type embryos melanophores are present posterior to the eye and otic vesicle and are migrating over the flank of the embryo. In hdac1 col mutants, there are fewer melanophores and most of the melanophores are located posterior to the otic vesicle (arrowhead). There are no migrating melanophores in hdac1 col mutants. C, D: By 3 dpf, melanophores are present in four stripes in wild-type; dorsal (d), lateral (l), ventral (v), and yolk (y). In hdac1 col mutants melanophore numbers do not recover. Melanophores present in hdac1 col fail to migrate and are mainly localized to the dorsal stripe and a patch of melanophores posterior to the otic vesicle (arrows, arrowhead). Melanophores that do migrate ventrally in hdac1 col mutants are present in the anterior ventral stripe over the yolk extension. Xanthophores, which give a yellowish hue to embryos, are present in the head and over the flank of wild-type embryos and hdac1 col mutants. 71
 views of 25 hpf embryos that are stained by in situ hybridization to reveal expression of mifta (A, B, G, H), c-kit (C, D, I, J) and dct (E, F).")
96 Figure 2.2. Fewer melanoblasts are specified in hdac1 col embryos. Lateral and dorsal (cranial region) views of 25 hpf embryos that are stained by in situ hybridization to reveal expression of mifta (A, B, G, H), c-kit (C, D, I, J) and dct (E, F). A, B, G, H: There are fewer mitfa-positive melanoblasts specified in hdac1 col mutants as compared to wild-type. C, D: Melanoblast specific c-kit expression in hdac1 col mutants is absent and or reduced (arrowheads), although non-melanoblast expression of c-kit in the post anal region and posterior mesoderm is equivalent to wild-type (arrows). I, J: Similarly, in the cranial region melanoblast specific c-kit expression is reduced or absent, while c-kit expression in the branchial arches is more robust albeit disorganized in hdac1 col mutants as compared to wild-type (arrowheads). E, F: There are fewer dct-positive differentiating melanoblasts in hdac1 col mutants compared to wild-type (arrowheads) and most of the dct-positive melanoblasts are located posterior to the otic vesicle in the dorsal stripe suggesting defects in migration. Also, there is a lack of dct-positive melanoblasts in the anterior head (arrow). 72
97 Figure 2.3. Melanophore development does not recover in hdac1 col mutants. All panels are lateral views of 48 hpf embryos that are stained by in situ hybridization to reveal expression of mifta (A, B), c-kit (C, D), dct (E, F), fms (G, H) and xdh (I, J). A, B: By 48 hpf mitfa expression is switched off in differentiating melanoblasts in wild-type however in hdac1 col mutants, mitfa continues to be expressed robustly in melanoblasts. A, B, E, and F: There are still reduced numbers of mitfa and dct expressing melanoblasts in hdac1 col mutants as compared to wild-type. Additionally, there is still a migration defect as most of the mitfa and dct expressing melanoblasts are located at their site of origin in the post-oitc region (arrowhead) and in the dorsal stripe (arrow). C, D: In contrast to levels of mitfa and dct expression in melanoblasts in hdac1 col mutants, c-kit expression in melanoblasts does not recover to wild-type levels (arrowheads). G-J: Unlike melanophore development, xanthophore number and migration recovers by 48 hpf, where there are numerous migrating fms-positive and xdh-positive xanthoblasts in wild-type and hdac1 col mutants. 73

98 Figure
99 Figure 2.4. Neural crest induction and migration of non melanogenic cells are largely unaffected in hdac1 col mutants. In situ hybridizations for tfap2a (A, E, F), sox9b (B), sox10 (C, G, H, O, P), sna1b (D), foxd3 (I, J) and ctn (K, L, M, N) between 3 somites (s) and 24 hpf. A- D: Dorsal views of representative gene expression in 3 somite embryos. Neural crest induction is normal and there is no difference in the expression of tfap2a, sox9b, sox10 and sna1b between wild-type and hdac1 col mutants. E-L: lateral views of 15 somite embryos. At the 15 s stage there is no difference in the expression and number of cranial and trunk neural crest cells (arrowheads) expressing tfap2a (E, F), sox10 (G, H), foxd3 (I, J), and ctn (K, L) between wildtype and hdac1 col mutants. M-P: lateral views of 24 hpf embryos. Later by 24 hpf there is a slight reduction in the number of trunk neural crest cells expressing ctn and sox10 in hdac1 col mutants compared to wild-type. However, the overall migration of trunk neural crest cells in hdac1 col mutants is largely unaffected though slightly delayed (arrows, arrowheads). 75

100 Figure
 and foxd3 (C-J) between 24 hpf and 52 hpf. A, B: lateral views of 52 hpf embryos.")
101 Figure 2.5. foxd3 expression is prolonged in the premigratory neural crest and increased numbers of cranial satellite glia are present in hdac1 col mutants. In situ hybridizations of sox10 (A, B) and foxd3 (C-J) between 24 hpf and 52 hpf. A, B: lateral views of 52 hpf embryos. At 52 hpf sox10 continues to be expressed robustly in the dorsal stripe in hdac1 col mutants, while expression in wild-type is absent to faint (arrowheads). C, D: lateral views of 24 hpf embryos. There is a prolonged expression of foxd3 in the premigratory neural crest cells at 24 hpf in hdac1 col mutants compared to wild-type (D, arrowheads). In wildtype, foxd3-positive neural crest cells are mostly present at the tip of the tail (C, arrowhead). In addition to increased numbers of neural crest cells expressing foxd3, foxd3 expression is also increased in the somites in hdac1 col mutants when compared to wild-type. E, F: Flat mounts of the cranial region of 24 hpf embryos indicates that there is an increase in the number of cranial satellite glia in the pre-otic and post-otic placodes (arrowheads) in hdac1 col mutants as compared to wild-type. In contrast, pineal gland foxd3 expression (arrows) in hdac1 col mutants is slightly reduced compared to wild-type. G, H: lateral views of the tail region at 36 hpf. While foxd3 is not expressed in the premigratory neural crest cells in wild-type, it is still expressed in this population in hdac1 col mutants (arrowhead). I, J: lateral views of the head at 48 hpf. The number of foxd3- positive cranial satellite glia associated with the cranial ganglia is much larger than those present in wild-type embryos (black arrow and white arrowheads). 77

102 Figure 2.6. Repression of Foxd3 rescues melanogenesis in hdac1 col mutants. Images of live embryos at 3 dpf, A-D lateral views, E-H dorsal views. A, B: There are fewer melanophores present in hdac1 col mutants at 3 dpf compared to wildtype embryos. Melanophores present in hdac1 col mutants fail to migrate and are present at the site of origin in the post otic region, in the dorsal (d) stripe and in the anterior ventral stripe. In wild-type embryos, melanophores migrate to form four stripes; dorsal (d), lateral (l), ventral (v) and yolk (y). C, D: Partial knock down of Foxd3 in hdac1 col mutants increases melanophore numbers and the melanophores migrate over the head (arrowhead), into the ventral stripe and over the yolk. E, F: In control uninjected hdac1 col mutants the dorsal stripe (d) is usually 3-5 melanophores wide (arrowhead), in comparison the wild-type dorsal stripe is 2-3 melanophores wide (arrowhead). G, H: Partially reducing Foxd3 with a translation blocking morpholino (mo) in hdac1 col mutants increases the migration of melanophores into the ventral stripe and over the yolk, the resulting a dorsal stripe in hdac1 col /foxd3 mo mutant/morphants is only 2-3 melanophores wide (arrowhead). 78

103 Figure 2.7. Genetically reducing foxd3 rescues melanophore development in hdac1 col -/- ; foxd3 zdf10+/ - mutants. A-E: Live images with lateral views of 3.5 dpf embryos. Embryos obtained from a heterozygous incross of hdac1 col +/- ; foxd3 zdf10+/- carriers gave rise to 4 distinct phenotypes. A: wild-type that have melanophores present in 4 distinct stripes; dorsal, lateral, ventral and yolk. B: foxd3 zdf10 mutants in which the melanophore migration patterns has largely recovered to resemble the wild-type. C: hdac1 col -/- ; foxd3 zdf10+/+ and hdac1 col -/- ; foxd3 zdf10+/- mutants whose melanophore phenotype resembles single hdac1 col -/- homozygous mutant phenotype. D: hdac1 col -/- ; foxd3 zdf10-/- double mutants in which there is a reduction in melanophore numbers as well as reduced migration into the lateral, ventral and yolk stripe locations. E: 10% of phenotypically hdac1 col mutants that are hdac1 col -/- ; foxd3 zdf10+/- display a rescue of melanophore number as well as migration into the lateral, ventral and yolk stripes. 79

104 Figure 2.8. Foxd3 negatively regulates mitfa. A-D: lateral views of mitfa in situ hybridizations of 32 hpf embryos. B, D: there is an increase in the number of mitfa-positive melanoblasts in hdac1 col /foxd3 mutant/ morphant embryos as compared to uninjected hdac1 col mutants. A, C: in wild-type/foxd3 morphant embryos mitfa expression in melanoblasts is more robust than uninjected controls. E-H: lateral views of c-kit in situ hybridizations in 32 hpf embryos. F, H: there is no rescue of c-kit expression in melanoblasts in hdac1 col /foxd3 mutant morphants when compared to uninjected hdac1 col mutants at 32 hpf. E, G: Qualitatively, there are fewer c-kit positive melanoblasts in foxd3 morpholino treated wild-type embryos as compared to uninjected wildtype embryos. E-H: In contrast to melanoblast expression, there is no difference in c-kit expression in the post anal region between wild-type, hdac1 col mutants, wt/foxd3 wild-type/ morphants, and hdac1 col /foxd3 mutant/ morphant embryos (arrows). 80
 using synthetic Foxd3 protein, radiolabelled conserved region probes spanning the predicted forkhead binding sites (Site 1 and Site 2), and unlabelled wild")
105 Figure 2.9. Foxd3 can physically interact with predicted forkhead binding sites in the mitfa promoter. Electrophoretic mobility shift assay (EMSA) using synthetic Foxd3 protein, radiolabelled conserved region probes spanning the predicted forkhead binding sites (Site 1 and Site 2), and unlabelled wild type or mutated site 1 or site 2 or unrelated (OCTA) oligonucleotide competitors. Arrows denote specific bands observed with Foxd3 protein. wt wild-type site1 or site 2 competitors; Mut: Mutated site 1 or site 2 competitors; NS nonspecific (OCTA) competitor; FP free probe (arrowhead). 81
106 Figure A model for the regulation of the initiation of melanogenesis. A. Expression of foxd3 prohibits the expression of mitfa and the initiation of melanogenesis by premigratory neural crest cells. Foxd3 is depicted as acting at the mitfa promoter, which can occur in vitro, but it is not known if this is the case in vivo. B. Prior to migration Hdac1 is required, directly or indirectly, to repress neural crest foxd3 expression. Repression of foxd3 expression permits transcriptional activation of mitfa by Sox10, Lef1 and other (O) regulators, resulting in the initiation of melanogenesis by a subpopulation of neural crest cells. 82

107 Figure Injection of 0.56 ng of foxd3 morpholino per embryo only partially phenocopies the foxd3 zdf10 mutant sympathetic neuron defect. A-D: side views of 56 hpf wild-type embryos labeled by in situ hybridization expression for tyrosine hydroxylase. foxd3 is required for sympathetic neuron development and loss of foxd3 in foxd3 zdf10 mutants or by knock down with high doses (20 ng/embryo) of translational blocking morpholino results in the complete loss of th-positive sympathetic neurons. A: wild-type uninjected control embryo in which there are two clear stripes of th-positive sympathetic neurons in the anterior trunk region (arrowheads). B-D: All embryos shown are from the same treated clutch. Reducing Foxd3 partially (0.56 ng/embryo) decreases the number of th-positive sympathetic neurons, although rare wild-type morpholino treated embryos (D) have an absence of sympathetics (arrowheads). A-D: In contrast to differences in th-positive sympathetic neuron expression, th expression in the hind-brain (arrows) and locus coeruleus (white arrowheads) is similar between control uninjected and wild-type/foxd3 morphants. 83
108 Figure Melanoblast differentiation and migration does not recover at 30 hpf. All panels are lateral views of 30 hpf embryos that are stained by in situ hybridization to reveal expression of mifta (A, B), c-kit (C, D), dct (E, F), fms (G, H) and xdh (I, J). A, B: By 30 hpf, the number of melanoblasts that express mitfa does not recover in hdac1 col mutants. Also, most of the mitfa-positive melanoblasts fail to migrate and are located in the dorsal stripe and in the post otic region in hdac1 col mutants. In contrast, wild-type melanoblasts have migrated into the ventral stripe and over the head. C, D: Additionally, melanoblast-specific c-kit expression in hdac1 col is still absent and/or reduced (arrowhead), although non-melanoblast expression of c-kit in the post anal region and posterior mesoderm is equivalent to wild-type (arrows). E, F: There are fewer dct-positive differentiating melanoblasts in hdac1 col mutants as compared to wild-type (arrowheads) and most of the dct-positive melanoblasts are located posterior to the otic vesicle and in the dorsal stripe. A few dct-positive melanoblasts are migrating in the anterior trunk in hdac1 col mutants, although, dct is not expressed as robustly compared to expression in wild-type melanoblasts. G, H: In contrast to c-kit-positive melanoblasts, there are many more fms-positive differentiating xanthoblasts in hdac1 col mutants compared to wild-type. I, J: although reduced in number when compared to wild-type, xdh-positive differentiating xanthoblasts are more numerous in the cranial region (arrows) and trunk (arrowheads) as compared to differentiating dct-positive melanoblasts in hdac1 col mutants. 84

109 Figure

110 Figure Further repression of Foxd3 in hdac1 col -/- ; foxd3 zdf10+/- and hdac1 col -/- ; foxd3 zdf10+/+ mutants increases the rate of rescue of melanogenesis. A-D: side views of live images of hdac1 col embryos at 3.5 dpf obtained from hdac1 col+/- ; foxd3 zdf10+/- heterozygous mutant incrosses in which either Foxd3 is further reduced with 0.477ng of foxd3 morpholino (mo) or are uninjected controls. A: At 3.5 dpf 10 % of hdac1 col embryos obtained from a double mutant hdac1 col+/- ; foxd3 zdf10+/- heterozygous incross have increased number of melanophores which migrate over the head, into the ventral stripe (v) in the tail and onto the yolk sac areas (y). The genotype of the rescued mutants was identified as hdac1 col -/- ; foxd3 zdf10+/-. B: hdac1 col -/- ; foxd3 zdf10-/- double homozygous mutants have fewer melanophores than hdac1 col -/- single mutants and most of the melanophores are present in the dorsal (d) stripe. C, D: Reducing Foxd3 via morpholino rescues the melanophore defect in hdac1 col -/- ; foxd3 zdf10+/- and hdac1 col -/- ; foxd3 zdf10+/+ mutants (62.5 % of all hdac1 col mutants) but not in hdac1 col -/- ; foxd3 zdf10-/- double homozygous mutants. A-D: hdac1 col -/- ; foxd3 zdf10+/-, hdac1 col -/- ; foxd3 zdf10+/+ and hdac1 col-/- ; foxd3 zdf10-/- mutants have the same eye defect as hdac1 col -/- single mutants and knock down of Foxd3 has no effect on the eye phenotype (arrows) 86
111 CHAPTER 3 DIFFERENTIAL AND REITERATED REQUIREMENT OF ZEBRAFISH HDAC1/HDAC FUNCTION DURING NEURAL CREST DERIVED CRANIOFACIAL AND PERIPHERAL NEURON DEVELOPMENT 2 ABSTRACT The precise regulation of gene expression is important for cell fate specification, differentiation, proliferation and survival during the development of the neural crest. In hdac1 col mutants, craniofacial cartilage development is defective. In the anterior mandibular and hyoid arches, chondricyte precursors fail to terminally differentiate. Fewer posterior branchial arch precursors are specified in hdac1 co1 mutants and subsequently branchial arch precursors fail to express essential genes including sox9a, hoxb3a, dlx2 and dlx3 among others 2 Myron S. Ignatius 1,2, Smitha Malireddy 1, Roopa M. Nambiar 1,2 and Paul D. Henion 1,2* 1 Center for Molecular Neurobiology, Department of Neuroscience, The Ohio State University, 105 Rightmire Hall, 1060 Carmack Rd., Columbus, OH United States. 2 Molecular, Cellular and Developmental Biology Program, The Ohio State University, 105 Rightmire Hall, 1060 Carmack Rd., Columbus, OH United States. Unpublished, completed project; manuscript in preparation. All data described herein, unless otherwise cited, were generated by M.S. Ignatius under the guidance of P.D. Henion. Figures 3.4, 3.5, 3.7 and 3.8 were generated with the assistance of Smitha Malireddy. Figure 3.6 C-E was generated by Dr Roopa M. Nambiar. 87
112 that required for cartilage development and as a consequence undergo apoptosis. In the peripheral nervous system, there is a disruption in neuronal differentiation in hdac1 col mutants when compared to wild-type embryos. For instance, DRG precursors differentiate into Hu-positive neurons anterior to the anus, while in the tail Hu-positive DRG neurons are rarely present, although potential sox10-positve precursors are present. Sympathetic neurons in hdac1 col mutants fail to undergo noradrenergic differentiation. Using HDAC inhibitor, TSA, we isolated enzyme activity and temporal requirements of HDAC function, which overlap with hdac1 col mutants during craniofacial and sympathetic neuron development. Finally, our study identifies potential hdac1 regulated gene targets within the neural crest. These include known targets col2a1 and th and others including dlx3, dbh, hand2, foxd3, sox10 and sox9a. Key words; hdac1, histone deacetylase, neural crest, craniofacial, peripheral neurons, zebrafish INTRODUCTION The neural crest is a transient embryonic cell population that gives rise to craniofacial cartilage, neurons and glia of the peripheral nervous system and pigment cells among other cell types (LeDouarin and Kalcheim, 1999). Over the last few years multiple molecular pathways and genes that control gene expression required for neural crest development have been identified. These include the Bmp, Fgf, Notch and Wnt signaling pathways (reviewed in Barembaum and Bronner-Fraser, 2005; Cornell and Eisen, 2005; Steventon et 88
113 al., 2005) and key transcription factors including tfap2a (Barrallo-Gimeno et al., 2004; Knight et al., 2003; O'Brien et al., 2004), snail1b (del Barrio and Nieto, 2002; Sefton et al., 1998), foxd3 (Kos et al., 2001; Lister et al., 2006; Sasai et al., 2001; Stewart et al., 2006), pax3 (Epstein et al., 1991), sox9 (Yan et al., 2002; Yan et al., 2005) and sox10 (Dutton et al., 2001; Kelsh and Eisen, 2000) that are essential for neural crest development. Disruptions in many of these genes result in neuropathies, pigmentation and craniofacial defects in humans (reviewed by Etchevers et. al., 2006). In eukaryotic cells, gene expression can also be regulated by control of chromatin structure. Chromatin consists of DNA associated with histone and nonhistone proteins. The basic unit of chromatin is the nucleosome, that is comprised of 146 bp of negatively charged DNA wrapped around an octameric core of positively charged histone proteins. Numerous studies have implicated specific modifications in the histone tails or combinations of modifications as being important for regulating gene transcription (Jenuwein and Allis, 2001; Richards and Elgin, 2002; Spotswood and Turner, 2002). The activation or repression of gene expression correlates with the acetylation state of histones (Allfrey, 1966). In general, acetylated histones are associated with more open chromatin and correspondingly active gene expression, whereas deacetylated histones are usually associated with closed chromatin and repressed gene expression (Ahringer, 2000). The acetylation status of histones within the eukaryotic cell is catalyzed by two types of enzymes known as histone deacetylases (HDACs) and histone acetyltransferases (HATs) (reviewed in de 89
114 Ruijter et al., 2003; Marks et al., 2003; Roth et al., 2001). HDAC enzymes are classified into four classes based on homology studies (reviewed in de Ruijter et al., 2003; Dokmanovic et al., 2007). While the global affects of histone acetylation on gene expression is somewhat well known, the requirements of individual HDACs in this process, is presently not well understood. Also, tissue specific requirements for individual HDACs are just being discovered. hdac1 is a Class I HDAC that so far has been shown to be required in multiple tissues and molecular pathways in zebrafish and mice. In zebrafish, hdac1 is a positive regulator of the canonical wnt signaling pathway during A-P patterning of the anterior brain (Nambiar and Henion, 2004), and a negative regulator of the non canonical wnt signaling pathway that is required for A-P axis elongation (Nambiar et al., 2007). hdac1 regulation of the canonical wnt signaling pathway is also required to control proliferation of retinal precursors (Yamaguchi et al., 2005). hdac1 is also a negative regulator of Notch signaling in the retina and CNS (Cunliffe, 2004). We have earlier shown that hdac1 is required to specify neural crest derived melanophores by negatively regulating foxd3 expression in premigratory neural crest cells (Ignatius et al., 2008). A genetic interaction between HDAC activity and REREa/ Atrophin-2 in craniofacial development has been suggested (Plaster et al., 2007). hdac1 required for overall craniofacial and fin development in zebrafish, yet the mechanism by which this occurs has not been explored (Pillai et al., 2004). In mice, Hdac1 knock out mutants die at E9.5 potentially due to proliferation deficits (Lagger et al., 2002). Recently, cardiac specific conditional knockout mouse 90
115 mutants have identified a role for Hdac1 in heart development, which is manifested only when Hdac1 and Hdac2 are both eliminated (Montgomery et al., 2007). In zebrafish, the effect of loss of hdac1 on overall development is not uniform but appears to be cell type or tissue specific. In the retina for instance, hdac1 functions as a switch from proliferation towards differentiation (Stadler et al., 2005; Yamaguchi et al., 2005). In contrast, in the hindbrain, hdac1 is required for cell proliferation (Cunliffe, 2004). Thus, hdac1 is an essential gene during early development and tissue specific requirements have also been suggested. In this study we explore the function of hdac1 in neural crest derived craniofacial and peripheral neuron development. During neural crest development, hdac1 is required reiteratively in multiple derivatives. However, within the neural crest derivatives, there are differences in the effect, as well as the stage at which cell types are blocked in development. In craniofacial development, defects observed are likely due to early as well as late patterning differences within the anterior and posterior pharyngeal arches. In peripheral neurons, there is an overall delay and or absence in differentiation. To further characterize craniofacial development defects in hdac1 col mutants, we isolated HDAC enzyme activity and temporal requirements of HDAC function, using HDAC inhibitor TSA. We also used TSA to phenocopy the sympathetic neuron phenotype in hdac1 col mutants and then tested if the effect of HDAC inhibition on sympathetic neuron development is reversible. Finally, our studies in hdac1 col mutants identify potential hdac1/ HDAC gene targets within the neural crest that are misregulated due to loss of Hdac1 activity. 91
116 RESULTS Craniofacial defects in hdac1 col mutants. At 3 days post fertilization (dpf), the neural crest derived cartilage cells of the pharyngeal arches differentiate and condense into distinct cartilage elements of the jaw in wild-type embryos as observed by alcian blue staining. Similarly, the cells that comprise the neurocranium condense into clearly identifiable cartilaginous elements. In contrast, in hdac1 col mutants at 3 dpf there is a complete lack of alcian blue stained-cartilage elements in the jaw (Nambiar and Henion, 2004). In hdac1 col mutants, the neurocranium cartilages are stained with alcian blue, however, the neurocranium itself is reduced in size and the ethmoid plate elements fail to fuse at the midline as in wild-type embryos (Nambiar and Henion, 2004). Later by 5 dpf, the mandibular and hyoid arches in hdac1 col mutants are very faintly stained with alcian blue, however compared to wild-type, these arch elements are not easily distinguishable and are drastically reduced in size (Fig 3.1A-D). High magnification resolution of condricytes reveals well defined elongated cells in wild-type embryos. In contrast, in hdac1 col mutants, few defined chondricytes are visible and those that are have a rounded morphology suggesting defects in terminal differentiation (Fig. 3.1 E, F). In hdac1 col mutants the posterior branchial arch elements are not stained with alcian blue (Fig 3.1 A- D). In live wild-type embryos at 3 dpf the overall jaw outline is clearly defined, while in hdac1 col mutants the overall jaw appears reduced and the posterior branchial arch elements are not evident (Ignatius et al., 2008; Nambiar and Henion, 2004). 92
117 Neural crest derived posterior branchial arch specification is defective in hdac1 col mutants Earlier analysis of neural crest precursors indicated to us that neural crest induction and development until 24 hpf is unaffected in hdac1 col mutants (Ignatius et. al., 2008), therefore abnormalities in craniofacial development likely result from later defects in neural crest development. We analyzed if there were differences in the specification of the different craniofacial elements in hdac1 col mutants. At hpf in the wild-type embryos, dlx2 is expressed in four out of the eventual seven pharyngeal arches (Akimenko et al., 1994), namely the mandibular/first pharyngeal arch, the hyoid/second pharyngeal arch and the third and fourth posterior branchial arches. In hdac1 col mutants, dlx2 expression in the mandibular and hyoid pharyngeal arches is similar to wild-type embryos (Fig. 3.2 A, B). In contrast, dlx2 expression in the third and fourth arch cell populations which give rise to the branchial arches (pharyngeal arches 3-7) is reduced. Also, the dlx2-positive cells are mislocalized to a more posterior position as compared to wild-type expression, and the cells fail to coalesce into a distinct third and fourth arch group of cells (Fig 3.2A, B). Similar to dlx2, ctn is expressed in migrating neural crest cells that populate the pharyngeal arches at 25 hpf (Luo et al., 2001). In hdac1 col mutants, while overall numbers of ctn-positive cranial neural crest cells are similar to wild-type, there are reduced numbers of cranial neural crest cells migrating into the third and fourth pharyngeal arches (Fig 3.2C, D). The neural crest cells that form the mandibular arch are hox-negative, while neural crest cells migrating into the hyoid arch require hox group 2 genes, and 93
118 the posterior/branchial arches require hox group 3 genes for proper development (Hunter and Prince, 2002). In hdac1 col mutants, while there is only a slight reduction in hoxb2a expression in the hyoid arch as compared to wild-type (data not shown), the expression of hoxb3a is highly reduced in the branchial arches at 25 hpf in hdac1 col mutants when compared to wild-type embryos (Fig. 3.2 E, F). The reduced hoxb3a expression levels observed in hdac1 col mutants is consistent with fewer branchial arch precursors being specified. Next we analyzed tbx1 expression which is required for pharyngeal endoderm development (Piotrowski et al., 2003). In hdac1 col mutants at 32 hpf, there is no difference in the number of tbx1-positive pharyngeal pouch endodermal cells as compared to wild-type (Fig. 3.2 G, H). The only difference observed is a disruption in the organization of the pharyngeal pouches in the posterior pharyngeal arches in hdac1 col mutants when compared to wild-type. Taken together, the dlx2, ctn, hox2a, hox3a and tbx1 data indicated to us that while the mandibular and hyoid arch specification is normal in hdac1 col mutants, there is a reduction in the number of branchial arch cranial neural crest cells specified. Also, in contrast to the defective specification of the neural crest derived branchial arches there is no defect in the number of non-neural crest derived pharyngeal endoderm cells specified. 94
119 Late differentiation and survival defect in the pharyngeal arches in hdac1 col mutants In hdac1 col mutants, although the mandibular and hyoid arch populations are specified properly, there is still a clearly visible defect in the size and shape of the mandibular and hyoid arches. There is also a complete absence of branchial arch alcian blue staining at 3 and 5 dpf, potentially as a consequence of reduced numbers specified. Therefore, we decided to analyze the expression of genes that are required for later development of the pharyngeal arches. At 48 hpf, the pharyngeal skeleton has a distinct dorso-ventral dimension due to the migration of neural crest cells ventrally into the pharyngeal pouches. Migrating cranial neural crest cells express dlx2 along the entire dorso-ventral axis. In hdac1 col mutants there is drastic reduction in migrating neural crest cells in the posterior branchial arches as compared to wild-type (Fig. 3.3 A, B). In the mandibular and hyoid arch, while qualitatively there are equivalent numbers of migrating cells, there appear to be differences in the shape of the migrating elements as compared to wild-type. dlx3 is expressed by cranial neural crest cells that have migrated ventrally into the pharyngeal pouch in wild-type embryos (Akimenko et al., 1994). In hdac1 col mutants, dlx3 is expressed in the mandibular and hyoid arches, but is highly reduced to absent in the posterior branchial arches (Fig. 3.3 C, D). We next analyzed the expression of col2a1 which is a major collagen expressed in differentiating pharyngeal arch cartilages (Vandenberg et al., 1991; Yan et al., 2002b). In wild-type embryos by 68 hpf, col2a1 is robustly expressed by all elements of the pharyngeal skeleton. In 95
120 contrast, in hdac1 col mutants, there is a delay in the expression of col2a1 by a day (Data not shown, Fig. 3.3 G, H). Further, there is a distinct migration defect where the elements of the hyoid arch from both sides of the head fail to meet ventrally close to the middle of the head. There are also defects in the migration of the mandibular arch elements (Data not shown). There is no expression of col2a1 in the branchial arches in hdac1 col mutants (Fig. 3.3 G, H). sox9, is required for the differentiation of cartilage in part by controlling the expression of collagens, like col2a1, that are required for the cartilage extra-cellular matrix (Bell et al., 1997; Lefebvre et al., 1997; Ng et al., 1997; Wright et al., 1995; Yan et al., 2005; Zhao et al., 1997). In zebrafish, the ancestral sox9 gene has undergone a gene duplication event with the function of sox9 shared between sox9a and sox9b (Yan et al., 2005). In hdac1 col mutants, sox9a is expressed only in the mandibular and hyoid arches at 48 and 68 hpf and is not expressed in the posterior branchial arches, in contrast, sox9a is expressed robustly in the mandibular, hyoid and branchial arches in wild-type embryos at 48 and 68 hpf (Fig. 3.3 E, F, data not shown). Analysis of dlx2, dlx3, col2a1, and sox9a indicates that there is a late differentiation and migration defect between 2-4 dpf in the anterior mandibular and hyoid arches, while in the posterior branchial arches, there is no recovery of the cell number or in cell differentiation in hdac1 col mutants. We observe that in hdac1 col mutants at 48 hpf, while there is decreased and abnormal differentiation of the branchial arches there are still ctn-positive neural crest cells present, albeit in reduced numbers and they are disorganized (Fig. 3.3 I, J). As these cells fail to differentiate, we analyzed if the branchial arch 96
121 precursors undergo cell death by TUNEL staining. We performed TUNEL at 36, 48, 56, 60 and 72 hpf in wild-type and hdac1 col mutants. Between 48 and 60 hpf there are numerous of TUNEL positive cells present in the branchial arches (Data not shown, Fig 3.3 K, L). Consistent with the neural crest cells undergoing apoptosis, concomitantly there is a loss of ctn expression in the branchial arches at 56 hpf (data not shown). These data suggest that as a consequence of the failure of branchial arch neural crest cells to differentiate correctly, at least some of the cells undergo apoptosis. Reiterated and stage specific requirements of HDAC function in craniofacial development Two alternative possibilities could explain the severe craniofacial defects in hdac1 col mutants. Firstly, due to early defects in craniofacial development in hdac1 col mutants later development fails to occur. Alternatively, the cumulative effect of defects in specification, migration, differentiation and survival may result in the severe craniofacial defects in hdac1 col mutants. In an attempt to distinguish between these two possibilities, we decided to isolate enzyme activity and temporal requirements of HDAC function during craniofacial development using a small molecule inhibitor approach. TSA (trichostatin A), a fungal metabolite, is a potent reversible inhibitor of both Class I and Class II HDACs has been used extensively to selectively block HDAC enzyme activity (Dokmanovic et al., 2007; Minucci and Pelicci, 2006). Hdac1 is a Class1 histone deacetylase. The addition of a variety of concentrations of TSA to different stage zebrafish embryos, can 97
122 reproduce aspects of eye, brain and the overall morphology of hdac1 col mutant development (Nambiar et al., 2007; Plaster et al., 2007; Yamaguchi et al., 2005). These studies indicated that the time of treatment and the concentration of HDAC inhibitor used are important determinants of the phenotype obtained (Nambiar et al., 2007; Yamaguchi et al., 2005). In hdac1 col mutants, only after 16 hpf (Ignatius et al., 2008) are differences in neural crest gene expression observed. Therefore, we selected 16 hpf as the first time point of TSA treatment. We also selected 28 hpf as the next time point for TSA treatment, as at 28 hpf the initial specification of the pharyngeal arch populations is already established and subsequently any differences observed between treated and control wildtype embryos would be a result of later developmental defects. Treated and control embryos were analyzed for pharyngeal arch specification at 24 hpf with dlx2 and for terminal differentiation with alcian blue at 3.5 dpf. The cartilage terminal differentiation phenotype was analyzed for the presence of all craniofacial elements, the size of the elements which could be indicative of proliferation and/or survival defects and shape which could result from improper cell migration. Initial experiments indicated that 800 nm of TSA from 28 hpf overall phenocopies the hdac1 col mutant, however, the phenocopy appears to be slightly more severe than hdac1 col mutants. Therefore, we also selected 400 and 600 nm TSA treatments at 16 and 28 hpf as additional dosages for analysis. Similar to hdac1 col mutants, treatment with 400, 600 and 800 nm of TSA between 16 and 24 hpf resulted in reduced specification of dlx2-positive branchial arch precursors with increasing severity in the branchial arch defects 98
123 correlating with higher concentrations of HDAC inhibitor TSA (Fig 3.4 a-d). In contrast to differences in branchial arch expression, no differences in dlx2 expression are observed in the mandibular and hyoid arches in TSA treated and control embryos consistent with hdac1 col mutant defects. Treatment of wild-type embryos with 400 nm of TSA from 16 hpf caused a clearly distinguishable overall reduction in size and shape of the mandibular, hyoid and branchial arches at 3.5 dpf (Fig 3.4 C, D). Only 3 out of the 5 ceratobranchial elements (CB) are observed in 79.71% (n=138, Table 3.1) of treated embryos. In treated wild-type embryos, the mandibular and hyoid cartilage elements are short and stubby, possibly indicating a lack of proper migration. Treatment of wild-type embryos continuously from 28 hpf with 400 nm TSA resulted in mild reductions/defects in overall development of the jaw at 3.5 dpf as compared to embryos treated from 16 hpf (Fig 3.4 C, D ; Table 3.1). Treatment with 600 nm of TSA from 16 hpf caused a more severe reduction in the size and shape of the mandibular and hyoid arches (Fig 3.4 E, F; Table 3.1). In the branchial arches, only CB1 is visibly stained in TSA treated embryos. The treated embryos overall morphology closely resembles the hdac1 col mutant phenotype with the exception that stained mandibular, hyoid and CB1 are observed at 3.5 dpf in treated embryos, whereas in hdac1 col mutants at 3.5 dpf, none of the jaw elements are stained. Continuous treatment from 28 hpf resulted in relatively less severe jaw defects as compared to treatment with 600 nm TSA from 16 hpf (Fig 3.4 E, F ; Table 3.1). However, there is still a reduction in jaw size, as well as defects in shape of the different arch elements. Similar to 400 nm treated wild- 99
124 type embryos, wild-type embryos treated after 28 hpf with 600 nm TSA exhibit a much smaller effect on overall size and shape of the craniofacial elements as compared to post 16 hpf treatment, suggesting that the additional 12 h treatment between 16 and 28 hpf has a significant effect on overall jaw development. Finally, treatment of wild-type embryos with 800 nm of TSA from 28 hpf until 3.5 dpf resulted in the complete absence of alcian blue stained jaw and neurocranium in treated embryos (Fig. 3.4 G, H ; Table 3.1). This phenotype, while closely mirroring the hdac1 col mutant phenotype is slightly more severe. Treatment with 800 nm from 28 hpf well after the entire pharyngeal arches are specified, indicated to us, that while decreased specification in the branchial arches contributes to craniofacial defects in hdac1 col mutants, jaw development can also be disrupted by later defects after 28 hpf in development. To further define temporal windows for HDAC function during craniofacial development we treated wild-type embryos with 800 nm of TSA for a fixed time of 24 h from 16, 28 and 48 hpf. After 24 h, embryos were washed clear of TSA with embryo medium and then allowed to develop until 3.5 dpf. Embryos were fixed at 3.5 dpf and then stained with alcian blue to identify terminally differentiating cartilage. This temporal treatment with 800 nm of TSA for 24 h indicated that between hpf, HDAC function is required to determine the overall size of all the jaw elements (Fig. 3.5 C, D; Table 3.2). Later, between 28 and 52 hpf (Fig. 3.5 G, H; Table 3.2) in addition to size, HDAC activity is also required for the migration/shape of the craniofacial cartilage structures. Also, craniofacial development is much more sensitive to inhibition at hpf than earlier or later 100
125 treatments with HDAC inhibitor TSA. At hpf (Fig. 3.5 K, L; Table 3.2), the main requirement for HDAC activity, is for the shape or proper migration of the craniofacial cartilage elements. TSA Treatment between 48 and 72 hpf results in relatively minor overall changes in craniofacial development as compared to hpf and hpf TSA treatments. Sensory, enteric and sympathetic neuron development in hdac1 col mutants Trunk neural crest cells give rise to peripheral neurons, which includes the dorsal root ganglia (DRG), enteric, and noradrenergic sympathetic neurons. In hdac1 col mutants, there is an overall reduction in the numbers of Hu-positive neurons in the DRG, enteric and sympathetic ganglia (Fig. 3.6, data not shown). In wild-type embryos at 52 hpf and 3 dpf the DRG sensory neurons are located bilaterally along the entire length of the trunk and are positioned ventro-lateral to the spinal cord with one pair of DRG neurons per somite (An et al., 2002). In hdac1 col mutants, the DRG numbers are drastically reduced at 52 hpf (data not shown), and the DRG neurons are often mislocalized, as they have not yet migrated into their ventro-lateral location. Later at 3dpf, the DRG numbers in the trunk anterior to the anus recover, in contrast, very few Hu-positive-DRG neurons differentiate in the tail region (Fig 3.6 A, B). Although many of the DRG neurons are localized ventro-lateral to the neural tube, very often, the DRG ganglia are mislocalized in hdac1 col mutants at 3 dpf (Fig. 3.6 C-E). As there is an absence of DRG neurons in the tail we performed in situ hybridizations for sox10 which is expressed in some DRG neurons precursors 101
126 and is switched off in more mature sensory neurons (Carney et al., 2006). In hdac1 col mutants, sox10 continues to be expressed robustly in potential DRG precursors at 52 hpf, in contrast to wild-type embryos, sox10 expression is absent or extremely low (Fig 3.6 F-I). In contrast to differences in potential DRG precursor expression, there is no difference in the expression of sox10 in the otic vesicle between hdac1 col mutants and wild-type embryos at 52 hpf. Thus, it appears that DRG precursors maybe specified along the entire trunk in hdac1 col mutants, but there is a delay in DRG differentiation in the anterior trunk and a loss of terminal differentiation in the tail. sox10 is also expressed in neural crest derived glia which are associated with the DRG sensory neurons (Dutton et al., 2001c), therefore, an alternative explanation for the sox10 overexpression phenotype, is that sox10 is overexpressed in glia which are associated with DRG sensory neurons. Presently we cannot distinguish between these two possibilities. Hu-positive enteric neurons are located along the entire length of the gut at 3-4 dpf in wild-type embryos (An et al., 2002). In hdac1 col mutants the first Hupositive enteric neurons are observed only by 4 dpf suggesting delayed differentiation (Fig. 3.6 K, L). The overall numbers of enteric neurons are drastically reduced and they are present only in the proximal gut in hdac1 col mutants as compared to wild-type, indicating a failure in differentiation and migration (data not shown). Differentiated sympathetic neurons signal via noradrenergic neurotransmitters. Hence, neurons producing noradrenergic neurotransmitters 102
127 require the expression of tyrosine hydroxylase (th) and dopamine β-hydroxylase (dbh) (reviewed in Howard, 2005; Huber, 2006). Tyrosine hydroxylase is a rate limiting enzyme in the synthesis of noradrenergic neurotransmitters. Sympathetic neurons in hdac1 col mutants do not differentiate properly and fail to express th or dbh (Fig. 3.6 M, N; data not shown). Nonetheless, in hdac1 col mutants, sympathetic neuron precursors are present and robustly express transcription factors phox2b and zash1a that are required for sympathetic neuron precursor development (Fig. 3.6 O, P; Fig. 3.9) (reviewed in Howard, 2005; Huber, 2006). Next we analyzed hand2 expression that is required for sympathetic neuron differentiation (Lucas et al., 2006). In hdac1 col mutants at 48 hpf, hand2 is expressed in only a few sympathetic neuron precursors as compared to robust expression in wild-type sympathetic neuron precursors (Fig. 3.9 C, D). We also analyzed phox2a expression and similar to hand2 expression reduced numbers of phox2a-positive precursors are present in hdac1 col mutants (Fig. 3.9 E, F) At 3 dpf, some of the sympathetic neurons precursors in hdac1 col mutants express Hu/16A11 (Fig. 3.6 Q, R), indicating the differentiation of some of the sympathetic precursors into neurons. The cranial ganglia neurons are derived from epidermal placodes with contributions from the neural crest (Schilling and Kimmel, 1994). In hdac1 col mutants, overall there is a reduction in the size of the cranial ganglia. However, there are more severe reductions in sizes of the facial (VII) and glossopharyngeal (IX) ganglia than the trigeminal (V) and vagal (X) ganglia at 52 hpf and 3 dpf (data not shown, Fig. 3.6 Q, R). In contrast to the reductions in the size of the 103
128 cranial ganglia, the glia associated with the cranial ganglia which have contributions from the neural crest, are increased in number in hdac1 col mutants as compared in to wild-type embryos at 25 and 48 hpf (Ignatius et al., 2008). Thus, there is an overall delay in the differentiation of all types of neurons of the peripheral nervous system in hdac1 col mutants. The enteric, sympathetic, and DRG neurons in the tail are the most severely affected while the DRGs in the anterior trunk are less affected in hdac1 col mutants compared to wild-type. Finally, in hdac1 col mutants there are pronounced migration defects of enteric neuron progenitors while DRG precursor migration defects are less pronounced. Effect of HDAC inhibition on sympathetic neuron differentiation is reversible Disruption of Hdac1 function in hdac1 col mutants results in the absence of th expression in sympathetic neurons, even though precursors cells are present, some of which undergo neuronal differentiation. We therefore decided to test the effect of HDAC inhibition on sympathetic neuron differentiation in zebrafish embryos. Specifically, we tested the effect of 800 nm of TSA on th expression in sympathetic neurons (Table 3.3). Treatment of wild-type embryos for 24 h between hpf with 800 nm TSA results in the complete loss of th-expression in the sympathetic ganglia (0%, n = 82, Fig. 3.7 A, B). In contrast to sympathetic neuron th-expression, TSA treated embryos retain th-expression in the mid-brain dopaminergic neurons and arch associated ganglia (100% and 98.8% of treated embryos respectively, n = 82). All wild-type control (DMSO treated) embryos 104
129 express th in the sympathetic ganglia, mid-brain dopaminergic neurons and arch associated ganglia (n = 140). The th-expression phenotype is clearly reminiscent of the hdac1 col mutant phenotype. In hdac1 col mutants, sympathetic neuron precursors express precursor genes, phox2b and zash1a but fail express differentiation genes th and dbh. We therefore analyzed phox2b expression in hpf TSA treated embryos. 95% (n = 78) of all TSA treated wild-type embryos express phox2b in the sympathetic ganglia, although, the overall ganglia size is slightly reduced when compared to control DMSO treated wildtype embryos (100%, n = 21). This data suggests that treatment of wild-type embryos for 24 h between hpf phenocopies the hdac1 col mutant sympathetic neuron development. As it is possible to phenocopy the sympathetic neuron defect in hdac1 col mutants at 52 hpf using HDAC inhibitor TSA, we next decided to test if the TSA induced failure of terminal differentiation of sympathetic neurons is reversible. To address this question, we treated wild-type embryos with 800 nm of TSA for 24 h (28-52 hpf), subsequently embryos were washed with embryo medium to remove TSA and then allowed to develop until 72 hpf in embryo medium. At 72 hpf, embryos were fixed and analyzed for th expression. 96% of wild-type embryos treated as above had th-positive sympathetic neurons present as compared to only 14% of embryos with th-positive sympathetic neurons that were treated continuously between hpf with TSA (Fig. 3.7 C-E; Table 3.3). This indicated to us that the th-expression terminal differentiation phenotype is reversible if the inhibition of HDACs is relieved. Also, the effect of HDAC 105
130 inhibition on th expression is cell type specific with mid-brain dopaminergic neurons and arch associated ganglia th-expression relatively unaffected by TSA, and Locus coreleus th expression is mildly affected, in contrast, sympathetic neuron th-expression is severely affected. Thus, sympathetic neurons are particularly sensitive to TSA mediated HDAC inhibition. DISCUSSION Activity and temporal requirements of hdac1/hdac function during craniofacial development There are early and late defects in craniofacial development in hdac1 col mutants. The complete loss of branchial arch development in hdac1 col mutants is likely due to the cumulative effects of an early defect in the specification of branchial arch precursors and later developmental defects that result in at least some branchial arch cells undergoing apoptosis. In the anterior mandibular and hyoid arches, there is late failure in terminal differentiation. Using a HDAC inhibitor approach, we were able to show that while the specification of precursors is important for posterior branchial arch development, subsequent development post specification is also an important contributor to the hdac1 col mutant phenotype. Namely, loss of HDAC activity in wild-type TSA treated embryos between hpf results in a severe loss of posterior branchial arch craniofacial structures, when compared to inhibition between earlier hpf or later hpf stages. Also, between hpf the main function of HDACs is 106
131 for the shape of craniofacial elements. We were also able to show that the severity of craniofacial defects depends on the concentration of inhibitor used. The effect of HDAC inhibitor TSA on embryonic development has been studied in multiple organisms. In the fly, 5 µm of TSA exposure induced death or delayed development (Pile et al., 2001) and in the sea urchin (Nemer, 1998) low nm concentrations of TSA before gastrulation caused growth arrest. In Xenopus and zebrafish, treatment with TSA and Valproic acid (VPA) induced growth retardation, bent tails, eye defects and pericardial effusions (Gurvich et al., 2005; Phiel et al., 2001). VPA which is prescribed to patients as an anticonvulsant, acts as a HDAC inhibitor at mm concentrations and this effect on HDAC inhibition is different from its anticonvulsant activity as other VPA analogs used in anticonvulsant treatment do not have HDAC inhibitory activity (Phiel et al., 2001). In humans, VPA is a well studied teratogen and has been shown to cause birth defects characterized by spina bifida, craniofacial abnormalities, and other less frequent systemic defects collectively known as Fetal Valproate Syndrome (Alsdorf and Wyszynski, 2005; Kozma, 2001). It will be interesting to speculate that the resulting craniofacial defects consistently observed in Fetal Valproate syndrome are due to the HDAC inhibitory activity of VPA on neural crest derived craniofacial development. HDAC inhibition by TSA and VPA in mice induces axial skeletal malformation but no external craniofacial or limb abnormalities were observed (Menegola et al., 2005; Menegola et al., 2006). Similarly, other HDAC inhibitors have been shown to have similar effects or no effect on axial skeletal 107
132 malformation, while no effect on craniofacial development was observed (Wise et al., 2007). Thus, it is possible that there exist species specific differences between mice, Xenopus and zebrafish with respect to the effect of TSA and VPA on craniofacial development. Alternatively, a more likely explanation based on our results is that that either the timing of treatment or the effect on concentration of inhibitor used could result in mild or no effects in development. Hdac1 knockout mice die at E8.5, potentially due to the accumulation of earlier defects (Lagger et al., 2002). Most of the mice studies add HDAC inhibitor at E8 which is potentially late. Additionally, the concentration of inhibitor used is likely lower than the amount required to obtain complete or severe loss of HDAC activity. In support of this assertion, non-human primates treated with 1-30x VPA concentrations of the oral dose equivalent prescribed in humans during gestation, developed craniofacial and axial skeletal abnormities at all doses above the 1x prescribed VPA dose (Mast et al., 1986). Given the potential of HDAC inhibitors like VPA to be teratogens, coupled with gaps in our knowledge as to the effective doses required to treat different disease situations, more detailed studies would be required to completely rule out harmful developmental side effects in humans as well as mice. HDAC activity is present globally in most if not all cell types. However, in many studies tissues specific requirements have been described. A simple explanation for tissues specific effects of HDAC would be its interaction with tissue specific cofactors that likely account for differential effects. Two studies one in zebrafish and another in Xenopus support this assertion. In zebrafish, 108
133 HDAC inhibition phenocopies multiple aspects of the babyface/rerea/atrophin- 2 mutant phenotype, these include defects in craniofacial development (Plaster et. al., 2007). Interestingly, REREa/atrophin-2 has been shown to be present in a HDAC complex associated with regions of the genome that are repressed (Plaster et al., 2007). In Xenopus, foxn3 is required for anterior mandibular and hyoid arch differentiation. FoxN3 physically interacts with xsin3a and xrpd3 which are HDAC repression complexes suggesting that foxn3 via interaction with HDAC complexes regulates anterior pharyngeal arch development (Schuff et al., 2007). An alternative hypothesis for tissue specific requirements of HDACs during development is that the differential expression of HDACs in multiple tissues could potentially result in situations where there are redundant overlapping functions in one tissue, whereas in other tissues there could be nonredundant essential requirements. In support of this, expression studies have shown that while Class 1 HDACs are globally expressed Class 2 HDAC display tissue specific expression patterns (de Ruijter et al., 2003; Dokmanovic et al., 2007). Also, in mice embryonic knock out of Hdac1 results in embryonic lethality, whereas conditional heart specific knock out of Hdac1 results in cardiac specific growth, morphogenesis and other defects only when there is a combined loss of Hdac1 and Hdac2 (Montgomery et al., 2007). Hdac1 is required for neural crest cell differentiation In this study we show that hdac1 col is required for the differentiation of multiple neural crest derivatives including all craniofacial cartilages and neurons 109
134 of the peripheral nervous system. Earlier studies in hdac1 mutants have identified a requirement for hdac1 in the differentiation of melanophores, the eye, and motor neurons in the CNS (Cunliffe, 2004; Ignatius et al., 2008; Stadler et al., 2005; Yamaguchi et al., 2005). Thus, a global function of hdac1 appears to be in regulating cellular differentiation. Consistent with this proposed function, neural crest cells robustly express precursor genes foxd3 and sox10 well after they are downregulated in wild-type embryos, indicating a delay in differentiation of at least a few neural crest precursors (Ignatius et al., 2008). In the CNS, there is failure to downregulate the Notch signaling pathway, which is expressed in undifferentiated neurons (Cunliffe and Casaccia-Bonnefil, 2006). The function of hdac1 in differentiation that we propose is exactly opposite to the requirement of HDAC inhibitors in differentiation. Specifically, HDAC inhibitors have been approved in the treatment of cutaneous T-cell lymphoma, where HDAC inhibitors drive the terminal differentiation of cancer cells (reviewed in Dokmanovic et al., 2007). Also, the HDAC inhibitor TSA has been used extensively in many studies to increase the differentiation of multiple cell types (Dokmanovic et al., 2007; Minucci and Pelicci, 2006; Xu et al., 2007). The opposite effect on differentiation observed could be the result of differential effects of Hdac1/HDAC function in multiple cell or tissue types. Alternatively, differences in HDAC activity levels could also account for the opposite phenotypes observed. Analysis of the protocols in which HDAC inhibitors are used in differentiation most often treat cell types with inhibitor for a brief period of time; subsequently, the inhibitor is washed away and the cells are then maintained for a longer period of time to undergo 110
135 differentiation. It is only when inhibition is removed that differentiation occurs. Alternatively, the concentration of HDAC inhibitor used is often lower than that which would achieve complete loss of HDAC enzyme activity. In both these scenarios HDAC activity is not completely eliminated. In contrast, the hdac1 col mutant, that is most likely a null allele, there is a complete loss of Hdac1 activity. In this paper we test this specific question in the differentiation of sympathetic neurons. We demonstrate that treatment of zebrafish embryos with a high concentration of TSA (800 nm) after 28 hpf can faithfully reproduce the hdac1 col loss of th-expression in sympathetic neurons defect. Subsequently, if we remove TSA within 24 h there is extensive th-expression in sympathetic neurons. In contrast, few continuously TSA treated wild-type embryos express th in the sympathetic neurons. This data suggests that severe HDAC inhibition like in hdac1 col mutants is required for terminal differentiation. We also tested the effect of lower concentrations of 50 and 100 nm of TSA on wild-type embryos treated continuously from 28 hpf and did not observe any effect on th-expression, however, the overall sympathetic ganglia size is slightly reduced. In sympathetic neuron cell culture experiments, TSA and sodium butyrate, another HDAC inhibitor, have been shown to inhibit intrinsic th expression at high concentrations, while at low concentrations there is a slight increase in th expression (Kim et al., 2003). However, this increase in th expression appears to be dependent on the stage in development of the noradrenergic precursor cell, suggesting that the effect of HDAC inhibitor on th expression might be stage specific (Kim et al., 2003). 111
136 Characterization of the 5 cis promoter region of th in humans, defined a 151 bp region proximal to the transcription start site as the minimal promoter required for th expression. This 151 bp element is negatively regulated by HDAC activity and contains a Sp1 and CRE binding sites (Kim et al., 2003). Another study also identified three neuron-restrictive silencing factor (NSRF) repressor elements within the 3.2 kb upstream region that are HDAC responsive (Kim et al., 2006). However, given the repression of intrinsic th expression by HDAC inhibitors, there likely exist additional positive regulatory elements of th expression in addition to the above described elements. Presently the zebrafish th promoter has not been characterized, therefore, whether similar HDAC regulating mechanisms controls th- expression remains to be determined. An alternative explanation for the absence of th espression is sympathetic neurons is that hdac1/hdac function could be required indirectly for th expression. In support of this assertion, in our characterization of the hdac1 col mutant, we find that hdac1 is required for the expression of hand2 and phox2a in sympathetic neurons. During sympathetic neuron development hand2, a bhlh transcription factor is required for th and dbh expression (Lucas et al., 2006; Morikawa et al., 2007). Also hand2 in combination with phox2b is required for phox2a and gata2/3 expression and a combination of phox2b, phox2a, hand2 and gata2/3 is required for th expression. In experiments studying the effect of HDAC inhibitors on th expression the authors did not analyze the expression of of the transcription factors required for th expression (Kim et al., 2003, Kim et al., 2006). 112
137 Candidate targets of hdac1 function in neural crest development There is intense interest in the use of HDAC inhibitors in the treatment of cancer, cardiac disease and degenerative diseases (reviewed in Marks and Breslow, 2007; Minucci and Pelicci, 2006). While a HDAC inhibitor has already be approved for the limited treatment of cutaneous T-cell lymphoma, a relatively rare cancer, potential uses in other cancers are in various phases of clinical trials (reviewed in Marks and Breslow, 2007; Minucci and Pelicci, 2006). Our study has identified known targets of HDAC inhibition like th and col2a1 that are also lost and or aberrantly expressed specifically in neural crest derived tissues in hdac1 col mutants. During craniofacial development hdac1/hdac function is required differentially in the anterior and posterior branchial arches for sox9a expression. The absence of sox9a in the branchial arches could potentially account for the loss of branchial arch development. In the anterior arches loss of hdac1 function results in a delay in col2a1 expression even though sox9a is robustly expressed, suggesting a partial non-redundant function of hdac1 in the initial timing of col2a1 expression. In sympathetic neurons, hdac1 is required for noradrenergic specific enzyme expression of th and dbh. hdac1 is not required for the transcription factors phox2b and zash1a that are expressed by sympathetic neuron precursors. However, hdac1 is required for the expression of hand2, which is essential for th and dbh expression. Presently, it is not entirely clear as to the molecular mechanisms by which hdac1 controls the expression of genes essential for craniofacial, peripheral neuron, melanophore and other neural crest development. However, the hdac1 col 113
138 mutant can potentially be used as a model to study hdac1/ HDAC mediated transcription regulation. In this study and our earlier work we have been able to pinpoint specific stages at which hdac1/hdac function is required during neural crest derivative development (Ignatius et al., 2008). In the future, once the promoters of many of these genes are better defined, the hdac1 col mutant could potentially be used to explore in vivo mechanisms of hdac1 function during neural crest development. MATERIALS AND METHODS Animal husbandry and genotyping Adult zebrafish and embryos were raised and maintained at 28.5 C in the Ohio State Zebrafish facility. hdac1 col-/- mutant embryos were obtained by pair wise matings of heterozygous adult zebrafish that were maintained in AB and WIK backgrounds. Embryos were staged according to Kimmel et al. (Kimmel et al., 1995). In order to determine the genotype of embryos before a visible phenotype was clearly apparent, genomic DNA from individual embryos was obtained and PCR was performed using chromosome 19-linked polymorphic SSLP markers that have been shown to be closely linked to the col locus (Knapik et al., 1996; Knapik et al., 1998; Nambiar and Henion, 2004). 114
139 In situ hybridization, immunohistochemistry, cell death assays and alcian blue staining In situ hybridization was carried out on staged embryos as described previously (Thisse et al., 1993) with minor modifications. Embryos over 24 hpf were raised in 0.03g/l 1-phenyl-2- thiourea (PTU) to prevent melanin synthesis. Probes used were tfap2 (Knight et al., 2003), crestin (Luo et al., 2001; Rubinstein et al., 2000), col2a1 (Yan et al., 1995), dbh (Holzschuh et al., 2003), dlx2 (Akimenko et al., 1994), dlx3 (Akimenko et al., 1994), foxd3 (Kelsh et al., 2000; Odenthal and Nusslein-Volhard, 1998), hox2a (Hunter and Prince, 2002), hox3a (Hunter and Prince, 2002), phox2b (J. Holzchuh, University of Freiburg, Germany, unpublished), sox9a (Yan et al., 2002), sox9b (Li et al., 2002; Yan et al., 2005b), sox10 (Dutton et al., 2001a), tbx1 (Piotrowski et al., 2003), th (T. Look, Dana Faber Cancer Institute), zash1a (T. Look, Dana Farber Cancer Institute). Immunohistochemistry was performed according to An et al., A11monoclonal antibody that recoginizes pan neural marker Hu was obtained from Sigma. Apoptotic cell death was detected in whole embryos by terminal transferase dutp nick-end labeling (TUNEL) using modifications suggested by the manufacturer (Roche). Alcian blue was used to stain jaw cartilages in a protocol modified from (Schilling et al., 1996; Piotrowski et al., 1996). TSA treatment Trichostatin A (TSA, Sigma) was dissolved in DMSO at a concentration of 1 mg/ml. This stock solution was then diluted in embryo medium to 400, 600 and 115
140 800 nm concentrations. TSA added to embryos was changed every 12 hours and after treatment embryos were washed 3 X 10 ml in embryo medium to remove TSA. Washed embryos were allowed to develop in embryo medium to required stages or fixed in 4% paraformaldehyde. For experiments involving sympathetic neurons, embryos were treated with TSA diluted in embryo medium containing 0.03 g/l 1-phenyl-2- thiourea (PTU) to prevent melanin synthesis. 116
141 Jaw elements analyzed Mandibula r 400 nm 15s TABLES AND FIGURES Concentration and start time of TSA treatment 600 nm 15s Control 400 nm 28h 600 nm 28h 800 nm 28h Control / Hyoid / CB / CB / CB3 +/- +/ /- +/ CB / CB / Migration defects / #/% % 73.61% 72.89% 75.33% 0% n wild-type +++/- Mild defects ++ Moderate defects + Severe defects - Jaw elements absent/not stained Percentages reflect the most represented group in analysis. All experiments were terminated at 3.5 dpf. Table 3.1. Temporal requirements of HDAC function during craniofacial development 117
142 Jaw elements analyzed 24h time intervals of treatment with 800 nm TSA hpf hpf 48 hpf Control Mandibular +++/- (98.8%) + (86.3%) +++/- (58.5%) +++ Hyoid +++/- (98.8%) + (70.8%) +++/- (59.2%) +++ CB1 ++ (98.8%) + (79.5%) +++/- (98.6%) +++ CB2 ++ (98.8%) + (70.8%) +++/- (98.6%) +++ CB3 ++ (97.7%) - (79.5%) +++/- (97.9%) +++ CB4 ++ (70.9%) - (82.6%) +++/- (95.9%) +++ CB5 ++ (72.7%) - (82.6%) +++/- (92.5%) +++ Migration +++/ /- +++ defects n wild-type +++/- Mild defects ++ Moderate defects + Severe defects - Jaw elements absent/not stained. Percentages reflect the most represented group in analysis. All experiments were terminated at 3.5 dpf. Table 3.2. Temporal requirements of HDAC function during craniofacial development 118
143 800 nm TSA treatment for 24 hpf and fixed at 52 hpf 800 nm TSA treatment for 24/48 hpf and fixed at 72 hpf Time of treatment TSA hpf Control hpf Treated hpf Treated hpf Control hpf Sympathetic 0% 100% 96% 13.7% 100% neurons Locus coreleus 12.2% 99.3% 93% 54.8% 100% Arch associated cells 98.8% 100% 96% 86.3% 100% Mid-brain 100% 100% 89% 77.4% 100% dopaminergic neurons Negative 0/82 0/140 1/100 4/124 0/125 (unstained embryos) n Table 3.3. Effect of 800 nm of TSA on sympathetic neuron th expression 119
 and hdac1 col mutant embryos at 5 dpf.")
 at 5 dpf; m, meckels; pq, palatoquadrate;")
144 Figure 3.1. Severe craniofacial defects in hdac1 col mutants. A-B; ventral views of disected and flat mounted wt (wild-type) and hdac1 col mutant embryos at 5 dpf. C-D; Lateral view of wt (wild-type) and hdac1 col mutant embryos at 5 dpf. E-F 40x maginfication of wt and hdac1 col mutant craniofacial condrocytes (arrows) at 5 dpf; m, meckels; pq, palatoquadrate; m+pq = M, mandibular archch, ceratohyal; hs, hyosymplectic; ch+hs = H, hyoid archcb, ceratobranchial; cb1-5 = BA, branchial arches 120

, hoxb3a (25 hpf, E,")
145 Figure 3.2. Neural crest derived posterior branchial arch specification is defective in hdac1 col. A-B dorsal view of insitu hybridizations of dlx2 expression in wt and hdac1 col mutant embryos at 25 hpf; Black arrowheads indicating; m, mandibular arch; H, hyoid arch; white arrowheads indicating BA, branchial arches. C-H lateral views of wt and hdac1 col mutants with in situ hybridizations for ctn (25 hpf, C, D), hoxb3a (25 hpf, E, F) and tbx1 (32 hpf, G, H). 121
 and hdac1 col mutants (B, D, F, H, J, L), A-J are insitu hybridizations and K, L are TUNEL")

146 Figure 3.3. Late differentiation and survival defect in the pharyngeal arches in hdac1 col mutants. A-L Lateral views of wt (wild type A,C, E, G, I, L) and hdac1 col mutants (B, D, F, H, J, L), A-J are insitu hybridizations and K, L are TUNEL stained embryos. A, B; dlx2 expression at 48 hpf. C, D; dlx3 expression at 48 hpf; E, F; sox9a expression at 48 hpf; G, H; col2a1 expression at 96 hpf; I, J; ctn expression in the BA at 48 hpf; K, L TUNEL staining at 56 hpf. M, mandibular arch (Black arrowhead); H, hyoid arch (white arrowhead); BA, branchial arches (black arrows). 122
147 Figure 3.4. Enzyme activity and stage specific requirements of HDAC function on craniofacial development in wild type embryos. 1. Experimental outline; X, HDAC inhibitor TSA treatments from 16 hpf upto 24 hpf and 16 hpf until 3.5 dpf. Y, HDAC inhibitor TSA treatments between 28 hpf and 3.5 dpf. At 24 hpf fixed embryos were analyzed for dlx2 expression via in situ hybridization (2. a-d) and at 3.5 dpf embryos were stained with alcian blue which stains crainiofacial cartilage elements. Inhibitor concentration used were 0 nm (control), 400 nm (2. b, C, D, C and D ), 600 nm (2. c, E, F, E and F ) and 800 nm (2. d, G, H ). 2 a-d, lateral views; 2 A, C, E, 2 A, C, E, G ventral view; 2 B, D, F, B, D, F and H lateral views. M, mandibular arch; H, hyoid arch; BA, branchial arches. 123


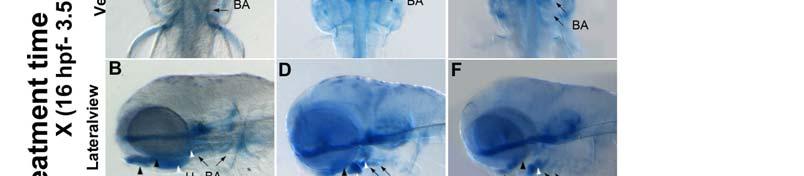
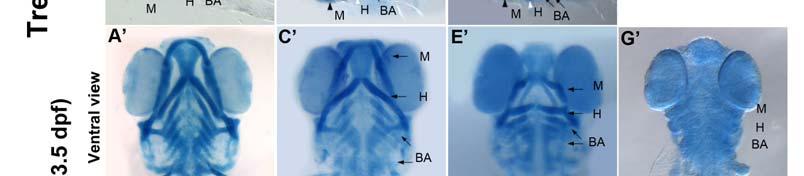
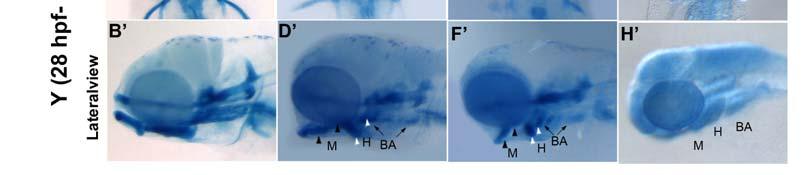
148 Figure
149 Figure 3.5. Differential temporal requirements of HDAC activity during craniofacial development in wild type embryos. 1) Experimental outline; all embryos were treated for a fixed 24 h time interval with 800 nm TSA between X, 16 and 24 hpf; Y, 28 and 52 hpf and Z, between 48 and 72 hpf. All embryos were fixed at 3.5 dpf and stained with alcian blue which labels craniofacial cartilages.2; A, C, E, G, I and K are ventral views of control and treated wild type embryos.2; B, D, F, H, J and L are lateral views of control and treated wild type embryos. M, mandibular arch; H, hyoid arch; BA, branchial arches 125


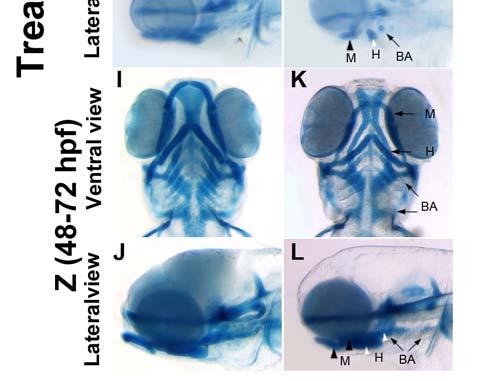
150 Figure
151 Figure 3.6. DRG, enteric and sympathetic neuron development in hdac1 col mutants. A, B lateral view of wild type (wt) and hdac1 col mutants at 3 dpf stained with 16A11 monoclonal antibody, which labels pan neural marker Hu. Black arrowheads indicate DRG sensory neurons; white arrowheads indicate ectopic DRG neurons; * indicate tail region in hdac1 col mutants where DRG neurons are largely absent. C-E, sectioned 3 dpf wt (C) and hdac1 col (D, E) embryos, labeled with anti Hu antibody, white arrowheads point to DRG neurons. F-G lateral tail views of wt and hdac1 col mutants stained by insituhybridization for sox10 and ctn; black arrowhead indicate either neural crest derived glia or potential DRG and glia precursors. K, L; transverse sections through the gut stained with anti Hu antibody, which labels enteric neurons in wt and hdac1 col mutants (white arrowheads). M, N; in situ hybridizations for th expression, black arrowheads indicate sympathetic neurons in wt (M) and hdac1 col mutants (N). O, P; In situ hybridization for phox2b in wt and mutant embryos (black arrowheads label sympathetic neurons). Q, R; whole mount antibody labeling with 16A11 at 3 dpf, black arrowheads label sympathetic neurons in wt and hdac1 col mutants. Also labeled by 16A11 staining are the cranial canglia; v, trigeminal; ix, glossopharyngeal; x; vagal ganglia. 127

152 Figure

153 Figure 3.7. Effect of HDAC inhibition on sympathetic neuron differentiation is reversible. A-E lateral view of wild type (wt) embryos stained by in situ hybridization for th expression. A and C control DMSO treated embryos at 52 hpf and 72 hpf. B and D, 800 nm TSA treated embryos which were soaked in inhibitor continuously from 28 hpf until 52 and 72 hpf respectively. E, Discontinous treatment of wt embryos between 28 and 52 hpf after which embryos were washed clear of TSA and then fixed at 72 hpf. 129
 embryos stained by in situ hybridization for phox2b expression; A, C control DMSO treated embryos.")
154 Figure Sympathetic neurons are specified in TSA treated embryos A-D lateral view of wild type (wt) embryos stained by in situ hybridization for phox2b expression; A, C control DMSO treated embryos. B, wt treated with 800 nm TSA from hpf. D, wt embryo treated with 800nM TSA between 28 and 72 hpf. Black arrowheads in all panels indicate sympathetic neuron precursors. 130

; B, D and F are hdac1 col mutants.")
155 Figure 3.9. Sympathetic neuron differentiation is disrupted in hdac1 col mutants. All panels are later views stained by in situ hybridization for the expression of zash1a, hand2 and phox2a. A,C and E are wild type embryos (wt); B, D and F are hdac1 col mutants. White arrowheads in all panels indicate sympathetic neurons. 131
156 CHAPTER 4 ZEBRAFISH COLGATE/HDAC1 FUNCTIONS IN THE NON-CANONICAL WNT PATHWAY DURING AXIAL EXTENSION AND IN WNT-INDEPENDENT BRANCHIOMOTOR NEURON MIGRATION 3 ABSTRACT Vertebrate gastrulation involves the coordinated movements of populations of cells. These movements include cellular rearrangements in which cells polarize along their medio-lateral axes leading to cell intercalations that result in elongation of the body axis. Molecular analysis of this process has implicated the non-canonical Wnt/Frizzled signaling pathway that is similar to the planar cell polarity pathway (PCP) in Drosophila. Here we describe a zebrafish mutant, colgate (col), which displays defects in the extension of the body axis and the migration of branchiomotor neurons. Activation of the non-canonical Wnt/PCP pathway in these mutant embryos by overexpressing Ndishevelled, rho kinase2 and van gogh-like protein 2 (vangl2) rescues the extension defects suggesting that col acts as a positive regulator of the non-canonical Wnt/PCP 3 Reprinted from Mechanisms of Development, Volume 124; Nambiar, R. M., Ignatius, M. S. and Henion, P. D., Zebrafish colgate/hdac1 functions in the non-canonical Wnt pathway during axial extension and in Wnt-independent branchiomotor neuron migration, , Copyright 2007, with permission from Elsevier. Contributions of M. S. Ignatius to this work includes Table 4.1 and
157 pathway. Further, we show that col normally regulates the caudal migration of nvii facial hindbrain branchiomotor neurons and that the mutant phenotype can be rescued by misexpression of vangl2 independent of the Wnt/PCP pathway. We cloned the col locus and found that it encodes histone deacetylase1 (hdac1). Our previous results and studies by others have implicated hdac1 in repressing the canonical Wnt pathway. Here, we demonstrate novel roles for zebrafish hdac1 in activating non-canonical Wnt/PCP signaling underlying axial extension and in promoting Wnt-independent caudal migration of a subset of hindbrain branchiomotor neurons. Keywords: Wnt signaling; Histone deacetylase; Convergent extension; Migration; PCP; Zebrafish. INTRODUCTION The basic vertebrate body plan consists of the three germ layers that emerge during gastrulation. Carefully orchestrated movement of groups of cells relative to each other culminates in the transformation of an unstructured monolayered blastula into a gastrula with germ layers. Cell intercalations result in the elongation of the body axis. An important driving force for these cell movements is a process known as convergent-extension (CE). Studies suggest that CE in zebrafish has at least two distinct components (Kane and Warga, 1994; Solnica- Krezel et al., 1995; Wallingford et al., 2000). The first involves directed migration of cells towards the dorsal side of the gastrula, termed dorsal convergence. 133
158 Convergence is a migratory event not involving cell rearrangements. This is followed by cellular rearrangements where cells converging at the dorsal midline become polarized along the medio-lateral axis resulting in cell intercalations and elongation of the body axis. The dissociation of convergence and medio-lateral intercalation and extension is evident from zebrafish mutants affecting CE movements differently. For example, in silberblick (slb) mutants, both convergence and extension movements are defective (Heisenberg et al., 2000), whereas in no tail (ntl) and somitabun (sbn) mutants convergence is significantly affected with extension occurring almost normally (Myers et al., 2002; Solnica-Krezel et al., 1996). In knypek (kny) mutants, mediolateral intercalations that underlie CE movements are impaired (Topczewski et al., 2001). The molecular basis for CE movements in vertebrates is incompletely understood. The polarization of cells within the plane of tissues undergoing CE in vertebrate embryos is akin to the polarization of epithelial cells in the insect cuticle. In Drosophila, the orientation of cells in a plane, planar cell polarity (PCP), is regulated by a non-canonical Wnt signaling cascade. As in the case of the canonical Wnt signaling pathway, this pathway also uses the Frizzled receptor and Dishevelled (Dsh). Other proteins, such as Inversin, (Simons et al., 2005), Diversin, (Schwarz-Romond et al., 2002), Naked and Casein Kinase 1 (Yan et al, 2001; McKay et al., 2001), all of which either interact directly with Dsh or with Dsh-associated proteins, have been shown to regulate both Wnt pathways. However, downstream of Dsh, PCP signaling recruits a different set of 134
159 molecules including Van gogh-like protein 2, Prickle, and JNK (Shulman et al, 1998; Boutros and Mlodzik, 1999; Adler and Lee, 2001). Recent studies have revealed that the orthologs of PCP pathway molecules control CE during gastrulation in Xenopus and zebrafish (Park and Moon, 2002; Kibar et al., 2001; Carreira-Barbosa et al., 2003). Mutant versions of Dsh have implicated the PCP signaling pathway as a regulator of CE movements in vertebrates (Heisenberg et al., 2000; Tada and Smith, 2000; Wallingford et al., 2000). A construct of Dsh that specifically disrupts PCP signaling in Drosophila, but does not affect the canonical Wnt pathway was able to block CE movements in both Xenopus and zebrafish (Wallingford et al., 2000; Heisenberg et al., 2000). Conversely, deletion constructs of Dsh that are unable to activate the canonical Wnt pathway were shown to rescue CE in silberblick, a zebrafish wnt11 mutant, as well as the overexpression of a dominant-negative form of wnt11 in Xenopus embryos (Tada and Smith, 2000; Heisenberg et al, 2000). In addition to dsh, other PCP genes also have homologs in vertebrates. For example, the zebrafish trilobite mutant is defective in the homolog of the van gogh-like protein 2 gene and is expressed in cells undergoing CE (Park and Moon, 2002). Two homologs of prickle that regulate gastrulation movements in zebrafish have been identified recently (Veeman et al., 2003; Carreira-Barbosa et al., 2003). Additionally, other CE genes specific to vertebrates have been isolated, including the formin morphology protein daam-1, knypek/glypican 4/6 and Wnt ligands wnt5/pipetail and wnt11/silberblick (Hammerschmidt et al., 1996; Heisenberg et al., 2000; 135
160 Jessen et al., 2002; Kilian et al., 2003; Rauch et al., 1997; Solnica-Krezel et al., 1996; Topczewski et al., 2001). Chromatin modifications play a key role in regulating eukaryotic gene expression (Jenuwein and Allis, 2001). Histones have numerous sites where post-translational modifications occur, and the pattern of modification encodes the expression status of a gene (Strahl and Allis, 2000; Rice and Allis, 2001). The silencing of gene expression has been found to be associated with deacetylation, whereas acetylation of histones is associated with activation of gene expression (Allfrey, 1966). Histone deacetylases (HDACs) are primarily nuclear enzymes involved in removing acetyl groups from histone lysine tails (de Ruijter et al., 2003; Marks et al., 2003). A role for Hdac1 in repressing the expression of canonical Wnt target genes has been shown in Drosophila and vertebrates (Chen et al., 1999; Billin et al., 2000; Brantjes et al., 2001; Yamaguchi et al., 2005). Hdac1 has been shown to exert its repressive function via association with Groucho and LEF1 in the nucleus (Chen et al., 1999; Brantjes et al., 2001; Billin et al., 2000). Roles for zebrafish hdac1 in notch and sonic hedgehog signaling have also been reported (Yamaguchi et al., 2005; Cunliffe, 2004). We have shown that the zebrafish mutant colgate (col) displays defects in early dorso-ventral and brain patterning (Nambiar and Henion, 2004) that can exclusively be rescued by overexpression of canonical Wnt pathway antagonists (Nambiar and Henion, 2004). Here, we show that col mutants also display defects both in axial extension and the migration of a subset of hindbrain branchiomotor neurons that can be selectively and differentially rescued by 136
161 overexpressing molecules of the non-canonical Wnt/PCP signaling pathway. We have cloned the col locus and found that it encodes histone deacetylase 1 (hdac1). In this study we demonstrate novel roles for Hdac1 in the non-canonical Wnt/PCP pathway during axial extension as well as in Wnt/PCP-independent neuronal migration, functions not previously attributed to hdac1. RESULTS Defects in axial extension contribute to the col mutant phenotype col mutant embryos are shorter (Table 4.1) and have a downward curved body compared to wildtype embryos. The somites of 48 hpf col mutants appear rounded, unlike chevron-shaped wildtype somites (Fig. 4.1A and B). There are also fewer somite pairs in col mutants than in wildtype by 27 hpf, although no significant difference is apparent at 16 hpf (Table 4.2). The 1 2 somite pair deficit in col mutants at 27 hpf persists at 48 hpf (Table 4.2). Compared to wildtype embryos, col mutants also have abnormally wide and stunted notochords (Fig. 4.1 A D) with defects being prominent by 30 hpf. Quantification of notochord diameter in transverse sections of the trunk of col mutants and wildtype siblings at 48 hpf revealed that notochord diameter was significantly larger (15%; Table 4.3; see Section 4) in mutants (Fig. 4.1 C and D). Notochord specification and early somite development, however, appear overtly normal in col mutants as expression of ntl and myod in embryos at late gastrulation (Fig. 4.1 E and F; not shown) and at early somitogenesis (not shown) is similar to that of wildtype 137
162 embryos. Likewise, neurulation and lengthening of the neural keel as evidenced by the expression of foxd3 (Fig. 4.1 G and H) and huc (not shown) during early somitogenesis appears unaffected. It is nevertheless possible that subtle early defects are present and become accentuated over time during morphogenesis. This temporal pattern of phenotypic changes has been documented previously for anteroposterior brain patterning in col mutants (Nambiar and Henion, 2004). The components of the axis extension phenotype of col mutants described above are reminiscent of, although much less pronounced than, those observed in the zebrafish Wnt/PCP mutants silberblick and trilobite as well as prickle morphants (Heisenberg et al., 2000; Sepich et al., 2000; Carreira-Barbosa et al., 2003), suggestive of a defect in extension movements as a result of the col mutation. col mutant embryos display defects in the migration of hindbrain branchiomotor neurons The branchiomotor neurons are born in specific rhombomeres in the hindbrain and innervate muscles of the pharyngeal arches (Noden, 1983; Chandrasekhar et al., 1997). In zebrafish the facial (nvii) and the glossopharyngeal (nix) motor neurons migrate tangentially to their final destinations (Chandrasekhar et al., 1997). The trigeminal or nv neurons are specified as discrete clusters in r2 and r3. These two clusters of neurons are functionally distinct that can be attributed to the segmental origin of the motor neurons (Higashijima et al., 2000). At 21 hpf most of the facial (nvii) neurons are localized in r4 and r5, as judged by comparison to the otocyst. In the next 15 h 138
163 the nvii motor neurons migrate tangentially such that by 36 hpf most of these neurons are located in r6 and r7. In trilobite/vangl2 mutants, nvii and nix neurons do not migrate into caudal rhombomeres following induction in r4 and r6, respectively, (Bingham et al., 2002). Defects in the migration of these motor neurons are not a consequence of defective hindbrain patterning or widespread cell migration defects. Although tri/vangl2 mutants also display abnormal CE movements during gastrulation, the neuronal migration defect is not a consequence of gastrulation-associated cell movement abnormalities (Bingham et al., 2002). Similar defects are also observed in pk1 morphants (Carreira-Barbosa et al., 2003). We have found that col mutants display a branchiomotor neuron migration phenotype reminiscent of tri/vangl2 mutants and pk1 morphants. Specifically, the facial (nvii) neurons identified by islet-1 mrna and Islet1 protein expression fail to migrate caudally and remain in r4 (Fig. 4.2). Like in the case of vangl2 mutants, we observed that the general development of the hindbrain in col mutants is largely unaffected. The expression of the markers krox20, valentino and hoxb3 that are diagnostic for r3, 5 and 6 development, respectively, were comparable between wildtype and col mutant embryos (Fig. 4.3A F). Also, the patterning of other hindbrain neuronal populations such as hindbrain commissural and reticulo-spinal neurons, as identified by staining with acetylated tubulin (not shown) and RMO44 antibodies, respectively, was generally unaffected in col mutants (Fig. 4.3 G and H). However, the number of neurons 139
164 appeared to be reduced in number in col. These results suggest that the failure of facial (nvii) neuronal migration is specific to these neurons and not due to a general defect in hindbrain patterning. Canonical and non-canonical Wnt pathway phenotypes of col mutants are genetically distinguishable The embryonic patterning (Nambiar and Henion, 2004) and extension defects in col mutant embryos suggest a role for col in both canonical Wnt and non-canonical Wnt/PCP signaling. Therefore, we sought to determine the role of col in both arms of the Wnt signaling cascade. Injection of antagonists of the canonical pathway including dkk1, gsk3ß and wnt8 MO, all resulted in the rescue of canonical pathway phenotypes of col mutants (Nambiar and Henion, 2004). In contrast, these canonical pathway antagonists failed to rescue the extension defects in col mutants (Nambiar and Henion, 2004; not shown). In addition, injection of the BMP inhibitor chordin mrna and XFD, an FGF pathway antagonist also failed to rescue the extension defects in embryos (Nambiar and Henion, 2004; not shown). The persistence of extension defects in col mutants in which the patterning phenotypes were rescued is consistent with a role for col in regulating non-canonical as well as canonical Wnt signaling. In order to delineate a potential role of col in the Wnt/PCP pathway, we first examined the expression of two wnt genes, wnt11 and wnt5a, both of which are known to play roles in regulating CE movements in vertebrates, including zebrafish (Heisenberg et al., 2000; Rauch et al., 1997). The overall patterns of 140
165 embryonic expression of both genes were indistinguishable between col mutants (identified by genotyping with flanking marker Z9059) and wildtype embryos, except for an increase in wnt5a expression in the tailbud (not shown). This increased expression can be attributed to the accumulation of cells in the tailbud region as revealed by the expression of other markers such as ntl and wnt8 (Nambiar and Henion, 2004). Although we cannot rule out the existence of subtle changes, the generally unaltered expression of wnt5a and wnt11 in col mutants is consistent with a potential role of col in regulating the Wnt/PCP pathway independently of wnt5a and/or wnt11. To further test whether col functions in the Wnt/PCP pathway, misexpression experiments were performed with regulatory components of the vertebrate Wnt/PCP pathway. dsh N, a dsh construct lacking the N-terminal end that has been shown to activate the Wnt/PCP pathway and rescue CE defects in slb mutants (Heisenberg et al., 2000) and rho kinase2 RNA, which also activates the Wnt/PCP pathway (Marlow et al., 2002), were injected into embryos at 1 8 cell stage. We injected each of these RNAs independently into wildtype embryos and found that in the vast majority of individual embryos misexpression did not result in an abnormal phenotype, although a small number of injected embryos displayed variable defects in the morphogenesis of the prechordal plate and notochord (not shown). Misexpression of either RNA construct in homozygous col mutant embryos resulted in qualitatively equivalent suppression of the axial extension defects present in uninjected mutants (Fig. 4.4 A F). Injected mutant embryos (dsh N 90%, n = 50; rok2 90%, n = 82; Table 4.4) displayed 141
166 significantly longer, extended body axes (Fig. 4.4 A C) and their notochords were thinner (Table 4.3) and longer compared to uninjected mutants (Fig. 4.4 D F). dsh N and rok2 injected col mutants retained defects in the canonical Wnt signaling pathway as evidenced by persistent brain patterning defects including, for example, reduced dlx2 expression in the anterior forebrain (Fig. 4.4 G I and not shown). Homozygous col mutants in all cases were identified by genotyping with flanking marker Z9059. These results strongly suggest that col functions in the regulation of the non-canonical/pcp pathway as well as in the canonical Wnt signaling pathway. The non-canonical Wnt/PCP pathway regulator vangl2 rescues defects in extension as well as branchiomotor neuron migration in col mutants Although overexpression of dsh N and rho kinase2 RNAs rescue axial extension defects in col mutants, branchiomotor neuron migration remains defective in injected mutants with cell bodies remaining in r4 in injected col mutants (not shown). However, another Wnt/PCP pathway regulator, van goghlike protein 2 (vangl2), is known to be required for both CE movements in the gastrula and branchiomotor neuron migration (Bingham et al., 2002). We, therefore, tested the effects of vangl2 misexpression in col mutants on both axis extension and branchiomotor neuron migration. Injection of vangl2 RNA into col mutant embryos resulted in embryos with extended body axes and longer, thinner notochords when compared to uninjected mutants (Fig. 4.5A D; Tables 142
167 4.3 and 4.4). Additionally, in vangl2 injected col mutants, facial branchiomotor neurons identified by islet-1 expression migrate from r4 to r6 and r7 in a pattern indistinguishable from wildtype embryos in 80% of injected mutants (Fig. 4.5 A C; Table 4.4). As was the case upon overexpression of dsh N and rho kinase2 RNAs in col mutants (Fig. 4.4 G I), canonical Wnt signaling-dependent neural patterning defects remain defective in vangl2 injected col mutants (not shown). Phenotypic rescue of the extension defects in col mutants by vangl2 misexpression provides further evidence for the involvement of col in the regulation of the non-canonical/pcp pathway. In contrast, the rescue of branchiomotor neuron migration in vangl2 injected col mutants demonstrates an additional genetic interaction between col and vangl2 and indicates a novel role for col that is independent of Wnt signaling pathways. The col locus encodes histone deacetylase 1 The col b382 mutation was mapped to LG19 (Nambiar and Henion, 2004). Using SSLP markers it was placed approximately 0.6 cm south of Z9059 (6 recombinants out of 1004) and 1.6 cm north of Z22532 (17 recombinants out of 1004). An examination of the annotated genes between Z9059 and Z22532 revealed that the zebrafish orthologs of casein kinase 2b (ck2b), histone deacetylase1 (hdac1) and hairy/enhancer-of-split related with YRPW motif1 (hey1) lie within this interval (Fig. 4.6A). The roles of ck2b and hdac1 as negative regulators of canonical Wnt signaling have been established (Dominguez et al., 2004; Willert et al., 1997; Billin et al., 2000; Yamaguchi et al., 2005) prompting us 143
168 to sequence the cdnas of these genes. We also sequenced cdna of the hey1 gene that lies within the same critical region. The sequencing of ck2b and hey1 cdnas revealed no lesions. In order to completely rule out ck2b, we used a SNP in the gene to identify recombinants. We found two recombinants out of 1024 genomes. Using the ck2b primers we screened a bacterial artificial chromosome (BAC) library. We identified SNPs in the end sequences of two of the BACs, K206D2 and C261D24, and used them as additional markers. Sequencing of the hdac1 cdna revealed a 9bp insertion at position 405 resulting in the insertion of 3 amino acids, glutamate, phenylalanine and serine in a conserved motif potentially compromising the structural integrity of the Hdac1 protein. Sequence comparison of col mutant and wildtype hdac1 cdnas revealed that the wildtype form is absent in col mutants (Fig. 4.6 D). Since a 9 bp insertion is unlikely to result from ENU mutagenesis, we reasoned that the defect could be the result of a point mutation that causes a splicing defect. In order to test this possibility we sequenced hdac1 from mutant genomic DNA and found a T-to-G transversion in the intron sequence flanking exon 5 that creates a new splice acceptor site (Fig. 4.6 B and C). This results in the addition of 9 bases from the adjacent intron to the 5 end of exon 5 in col mutants. To determine if the expression pattern of hdac1 correlates with the development of the col mutant phenotype, we analyzed hdac1 RNA distribution. The hdac1 gene is ubiquitously expressed from the one cell stage until 18 hpf, suggesting a maternal contribution (not shown). At 24 hpf expression 144
169 predominates in the brain and eyes and at 2 dpf hdac1 expression is also seen in the pectoral fin bud, branchial arches and hindbrain (Fig. 4.6 E and G). Our results are consistent to observations by Cunliffe (2004) and Pillai et al. (2004). We have shown selective and prominent developmental defects in col mutants in all of these regions (Nambiar and Henion, 2004). Overall, col mutants do not display a noticeable reduction in the levels of hdac1 expression (Fig. 4.6 F and H), suggesting that the col mutation likely results in impaired Hdac1 protein function due to defective RNA processing. To further test whether the hdac1 gene is defective in col mutants, we assessed the ability of hdac1 RNA to rescue col mutant phenotypes. We found that all characterized phenotypic defects observed in col mutants are rescued by hdac1 RNA injection (85% n = 125 Fig. 4.7; Table 4.5; Rescued embryos identified by genotyping, see Section 4). For example, extension movements are rescued in injected embryos, leading to the development of normally elongated notochords and regular chevron shaped somites (Fig. 4.7 A and C). The forebrain is specified and patterned normally based on the pattern of dlx2 expression compared to col mutants (Fig. 4.7 D and F). Another aspect of phenotypic rescue by hdac1 RNA injections is the restored migration of branchiomotor neurons and melanophores. Hindbrain branchiomotor facial (nvii) neurons visualized by islet-1 expression migrate normally into r7 by 33 hpf in injected col mutant embryos, whereas they fail to migrate out of r4 in uninjected col mutants (Fig. 4.7 G and I). Injected col mutant embryos displayed the absence of the characteristic cluster of melanophores just posterior to the otic 145
170 vesicle, a prominent feature of the col mutant phenotype (Fig. 4.7 A and C). Lastly, we injected col b382 hdac1 RNA into wildtype embryos and observed no obvious phenotypic consequences (not shown), inconsistent with the possibility of the col mutant form of hdac1 having a dominant-negative activity. We also noted the effects of hdac1 RNA overexpression in wildtype embryos. Injection of moderate concentrations (400 pg) resulted in a mild reduction of trunk tissue, partial loss of eyes and strikingly, an enlargement of the forebrain (Fig A and B). Injection of higher doses (1 ng; 17 of 20 injected embryos = 85%) caused a significant loss of trunk tissue and eyes and a loss of forebrain (Supplemental Fig. 4.2 C and D) and enlargement of midbrain (Fig E and F) consistent with our previous data demonstrating that col is required for forebrain and midbrain patterning (Nambiar and Henion, 2004). Together, these results suggest that the col locus encodes hdac1 and that the col b382 mutation results in a reduction in or loss of hdac1 activity. To determine whether hdac1 knockdown by translational interference in wildtype embryos phenocopies col mutants, we injected wildtype embryos with morpholino oligonucleotides (MO) directed to the translational start site of hdac1. A large number of embryos injected with the MO (91.6%; n = 120; Table 4.5) very closely resembled col mutants (Fig. 4.7 B, E and H). They were defective in extension movements evidenced by short, curved body axes and thick notochords (Fig. 4.7 A and B). Like col embryos, they lacked pectoral fins, retained a cluster of melanophores posterior to the otocyst and displayed grossly truncated anterior brain development (Fig. 4.7 A and B and not shown). These 146
171 embryos also displayed the reduced domain of dlx2 expression in the telencephalon (Fig. 4.7 D and E) and migration defect of facial branchiomotor hindbrain neurons expressing islet-1 (Fig. 4.7 G and H), both characteristic phenotypes of col mutants. Embryos injected with the control MO did not show specific defects (not shown). Taken together, since the hdac1 gene contains a lesion in col mutants, the col hdac1 gene produces an RNA that is incorrectly spliced, wildtype hdac1 RNA is able to rescue col mutant phenotypes and morpholino-based hdac1 gene knockdown phenocopies col mutants, we conclude that the col locus encodes hdac1. col/hdac1 appears to function genetically upstream of vangl2 Because vangl2 misexpression rescues the axial extension and branchiomotor neuron migration phenotypes of col mutant embryos, we sought to establish a functional hierarchy between vangl2 and col/hdac1. To do so, we first injected wildtype embryos with tri/vangl2 MOs. These embryos developed highly stunted body axes with compressed somites and notochords, like tri mutants (Fig A; Jessen et al., 2002). We then coinjected hdac1 RNA with the tri/vangl2 MO in wildtype embryos. We observed that overexpression of hdac1 RNA was unable to rescue the phenotypes resulting from the injection of tri/vangl2 MOs (Fig B). This result suggests that hdac1 may be acting genetically upstream of vangl2 in the Wnt/PCP pathway, although a more detailed analysis is required to define this interaction. 147
172 Differential temporal requirements for histone deacetylase activity To further understand the requirement of histone deacetylase activity in the manifestation of col mutant phenotypes, we attenuated HDAC activity in wildtype embryos using the pharmacological agent trichostatin A (TSA), a specific and potent inhibitor of histone deacetylases. TSA inhibits the activity of both type I and type II Hdac proteins by binding to their catalytic domains (Yoshida et al., 1995). We performed two different treatments of embryos with TSA. In the first, we treated wildtype embryos continuously with 50 nm TSA from 5 hpf and fixed embryos at multiple subsequent time points. These embryos displayed specific defects that were more severe than developmental defects in col mutant embryos. We observed CE defects in these embryos starting at early somitogenesis (Fig. 4.8A and B; Table 4.6). These embryos have shorter, thicker notochords marked by ntl expression at the 6-somite stage and 24 hpf (Fig. 4.8 C F) and severely shortened body axes with compressed somites marked by myod expression at 24 hpf (Fig. 4.8 G and H). At 2 dpf these embryos have highly compressed body axes, thick notochords and narrow compressed somites (Fig. 4.9B; not shown). Like in col mutants, we also observe clustering of melanophores posterior to the otocysts (Fig. 4.9 B). We also observed the ectopic positioning of the hindbrain facial branchiomotor neurons in r4 due to lack of caudal migration as seen in col mutants (Fig. 4.9 F). These embryos additionally showed a severe reduction in islet-1 expression in these neuronal populations (Fig. 4.9 F) as well as a drastic reduction in dlx2 expression in the 148
173 forebrain (Fig. 4.9 D). Exposing embryos to higher concentrations of TSA at 5 hpf resulted in high mortality by 24 hpf. In order to determine the effect of blocking HDAC activity later in development, we continuously exposed wildtype embryos to TSA beginning at 16 hpf (Table 4.6). Embryos at this stage required a higher concentration of TSA (800 nm) to show phenotypes resembling col mutants. These embryos partially phenocopied the col mutant phenotype. Treated embryos at 2 dpf developed stunted body axes, the melanophore migration defect and had pectoral fins (Fig. 4.9 A; not shown). These embryos also displayed aberrant branchiomotor hindbrain neuronal migration (Fig. 4.9 E). In contrast to untreated col mutant embryos, dlx2 expression in the forebrain is only slightly reduced in treated wildtype embryos (Fig. 4.9 C) compared to untreated wildtype embryos. Early notochord development also appeared unaffected in treated embryos (not shown). Treatment of wildtype embryos with 1200 nm TSA resulted in widespread cell death in treated embryos by 2 dpf. Together, these results suggest an early requirement for HDAC function in brain patterning and notochord development, whereas extension of the body axis, tangential migration of hindbrain facial branchiomotor neurons, pectoral fin development and melanophore patterning, require or also require HDAC function at relatively later stages of development. 149
174 DISCUSSION We have previously shown that the zebrafish mutant col displays specific defects in early DV patterning and AP patterning of the neuroectoderm (Nambiar and Henion, 2004). Our results indicated a function for Col as an inhibitor of canonical Wnt signaling (Nambiar and Henion, 2004). Our data also showed that while the early DV patterning and the neural AP patterning defects in col mutants were rescued by blocking excessive canonical Wnt signaling, these embryos still retained compressed body axes and notochords. Blocking of wnt8 function using wnt8 MOs was able to partially rescue body curvature (Nambiar and Henion, 2004) and this may be attributed to the activation of molecules such as Stat3 that are activated by the canonical Wnt pathway and regulate the initiation of CE ( Sepich et al., 2005). These embryos, however, still are distinctly shorter than wildtype siblings. In this study, we detail the defects in the extension of the body axis and notochord as well as the caudal migration of hindbrain nvii branchiomotor neurons in col mutants. We have identified col as zebrafish histone deacetylase 1. Our results indicate novel functions for col/hdac1 in non-canonical Wnt/PCP signaling during axial extension and in Wnt-indpendent hindbrain branchiomotor neuronal migration. col encodes the histone deacetylase 1 gene The hdac1 gene in col b382 mutants harbors a T to G tranversion in the intron flanking exon 5. This creates a new splice acceptor site resulting in the 150
175 insertion of three additional amino acids in one of seven highly conserved motifs in the Hdac1 protein. Misexpression of hdac1 mrna in col / embryos rescues all aspects of the mutant phenotype and morpholino-mediated knockdown of the gene in wildtype embryos phenocopies col mutants. col mutant embryos very closely resemble other hdac1 mutants such as add and t24411 (Yamaguchi et al., 2005; Stadler et al., 2005), and correctly spliced hdac1 transcripts appear to be absent in col mutants, consistent with the possibility that col b382 locus may correspond to a null mutation of hdac1. However, we cannot rule out partial functionality of Col mutant protein or the presence of wildtype hdac1 transcripts in col mutants at levels below the detection limits of the methods we used. Thus, we cannot at present conclude that col represents a null hdac1 mutation (and see below). Histone deacetylases play an important role in maintaining equilibrium between the acetylated and deacetylated states of chromatin and thus the tissuespecific expression status of genes and can also play a critical role in regulating the extracellular microenvironment (Whetstine et al., 2005). In zebrafish, hdac1 has been shown to regulate cell cycle exit and subsequent neurogenesis in the retina (Stadler et al., 2005; Yamaguchi et al., 2005) by antagonizing both the Notch and canonical Wnt signaling pathways (Yamaguchi et al., 2005). In addition to this, data from Cunliffe (2004) implicates hdac1 in promoting neuronal specification in the developing zebrafish brain by repressing Notch target gene expression. Our data provides the first evidence, in either vertebrates or invertebrates, for the functioning of hdac1 in regulating body extension and 151
176 neuronal migration in the early embryo. Further, we show that hdac1 is involved in the regulation of these processes by means of the non-canonical Wnt/PCP pathway as well as independent of this pathway but involving genetic interaction with vangl2, respectively. The role of Hdac1 in the non-canonical Wnt/PCP pathway col mutants exhibit phenotypes characteristic of reduced non-canonical Wnt/PCP pathway signaling. By 2 dpf these mutant embryos typically develop stunted body axes, thick, short notochords and rounded somites. Similar phenotypes are observed in slb/wnt11 (Heisenberg et al., 2000), ppt/wnt5a (Rauch et al., 1997), tri/vangl2 (Sepich et al., 2000), kny/glp4 (Topczewski et al., 2001) mutants and pk morphants (Carreira-Barbosa et al., 2003). Consistent with this, activating the non-canonical pathway by overexpressing Ndsh (Heisenberg et al., 2000), rho kinase2 and vangl2 is able to completely rescue extension of the body axis and notochord and somite defects in col mutants. Our results, therefore, strongly suggest that col/hdac1 acts as a positive regulator of the noncanonical Wnt/PCP pathway. In contrast, analysis of the actin cytoskeleton of wildtype and col mutants during gastrulation revealed no discernable differences between col and wildtype embryos. This result is not consistent with compromised col/hdac1 function disrupting the cellular cytoskeleton generally and indirectly affecting cell polarity. However, it is important to note that this analysis of the cytoskeleton was not comprehensive and we cannot rule out subtle changes. It will be of considerable interest to examine potential defects in 152
177 the subcellular localization of PCP pathway components during gastrulation in col mutants when reagents become available. A major difference in the phenotypes displayed by other zebrafish Wnt/PCP mutants and col is that we do not observe an early manifestation of CE defects in col mutant embryos. Other Wnt/PCP mutants display defects in dorsal convergence and extension of the body axis starting at 9 hpf (Heisenberg et al., 2000; Rauch et al., 1997; Sepich et al., 2000; Carreira-Barbosa et al., 2003). In contrast, extension defects in col mutants become prominent only by 30 hpf. We have previously reported a similar late development of other mutant phenotypes in col such as defects in forebrain and midbrain patterning (Nambiar and Henion, 2004). Given the importance of Hdac1 as a co-repressor in yeast and mammalian systems, col mutants might be expected to display more severe patterning defects. It is possible that the persistence of maternal histone deacetylase and the activity of other Hdacs in col mutants may account for the lack of severe early CE defects in col mutants. Supporting this, we have shown that treating wildtype embryos with TSA, a potent inhibitor of all Hdacs, at different developmental time points results in different phenotypes. Early TSA treatment (5 hpf) produces embryos with CE defects similar to those observed in other zebrafish Wnt/PCP mutants and more severe than col mutants. Later treatment of embryos with TSA (16 hpf) produced embryos with milder defects that closely resembled col mutants. Since embryos exposed to TSA starting at the later time point displayed defects in extension of the body axis we suggest that persistent HDAC activity is required for extension movements during the 153
178 later stages of development. Similar to col, Drosophila null mutants for rpd3, the hdac1 homolog, also display mild embryonic defects that have been attributed to possible redundancy among Drosophila histone deacetylases (Mannervik and Levine, 1999). Interestingly, Hdac1 -null mouse ES cells show a marked compensatory increase in Hda c2 and Hdac3 expression (Lagger et al., 2002), lending further support to the possibility that functional redundancy among Hdacs and/or different maternal and zygotic functional contributions account for the phenotypes of col and other zebrafish hdac1 mutants. Nevertheless, we do observe an early DV patterning defect in col mutants attributable to disregulation of canonical Wnt signaling (Nambiar and Henion, 2004), which although not severe, suggests that neither maternal hdac1 function or the activities of other histone deacetylases can completely compensate for a requirement for early embryonic zygotic hdac1 function. col/hdac1 is involved in mediating tangential migration of hindbrain facial (nvii) branchiomotor neurons A number of genes that are required for both CE and neuronal migration have been identified so far. Amongst them are tri/vangl2 (Bingham et al., 2002; Jessen et al., 2002), pk1 (Carreira-Barbosa et al., 2003) and llk/scrb1 (Wada et al., 2005). Other signaling molecules in the non-canonical Wnt pathway such as slb/wnt11, ppt/wnt5a and kny/glypican4/6 regulate CE movements in the gastrula (Topczewski et al., 2001; Heisenberg et al., 2000; Kilian et al., 2003), but do not regulate neuronal migration (Bingham et al., 2002; Jessen et al., 2002). Also, 154
179 branchiomotor neuronal migration is unaffected by the overexpression of a dominant negative form of Dsh which is able to suppress Wnt/PCP-mediated CE movements (Bingham et al., 2002; Jessen et al., 2002). These results, therefore, support the hypothesis that vangl2, pk1 and scrb1 regulate neuronal migration via a pathway independent of the Wnt/PCP signaling cascade. In this study, we have shown that col mutants, in addition to extension defects, display aberrant migration of facial (nvii) hindbrain branchiomotor neurons. These neurons are born in the correct positions in the rhombomere 4 (Higashijima et al., 2000), but while their wildtype counterparts migrate caudally into rhombomeres 6 and 7 (Chandrasekhar et al., 1997), these neurons persist in their original positions. We were unable to test if these neurons function in their ectopic positions because of embryonic lethality. However, in a previous study it has been shown that these ectopic neurons in hdac1 / mutants form axonal projections (Cunliffe, 2004). Our studies also reveal that this migration defect is not a result of a more general effect of hdac1 on hindbrain patterning. Rhombomere formation and the development of the patterning of other hindbrain neurons are unaffected in col. Previous studies by Cunliffe (2004) also revealed no defects in segmentation of the hindbrain of hdac1 mutant embryos although he did report perturbed segmental organization of hindbrain Hu-expressing neurons. We, however, did not observe any defects in the organization of two sets of neurons arranged segmentally in the hindbrain of col mutants - the reticulospinal neurons and the commissural neurons. We did observe a decrease in the number of these 155
180 neurons that is consistent with fewer Hu-positive hindbrain neurons reported by Cunliffe in hdac1 mutants suggesting that hdac1 function is required for the specification of neurons in the hindbrain. Consistent with results published by Cunliffe we also observed fewer cell bodies in the neuronal cluster marked by islet-1 antibody making them very difficult to detect. The intensity of the signal in situ preparations from mutant and wildtype, however, were not considerably different. We were able to restore normal migration of these neurons by overexpressing vangl2/tri. Consistent with previous data, other components of the Wnt/PCP pathway such as Ndsh and rho kinase2 were unable to rescue the neuronal migration defect. This suggests that this phenotype is not a consequence of the CE defects observed in col and raises the possibility that Hdac1 functions along with Vangl2 via an independent pathway to regulate the migration of these neurons. These defects in neuronal migration are also not a consequence of aberrant canonical Wnt signaling since overexpression of negative regulators of the canonical Wnt pathway are not able to restore normal migration of the r4 neurons (not shown). We also found that defects in general patterning of the hindbrain do not contribute to the aberrant migration of these neurons since the expression patterns of segmentally expressed genes krox20, val and hoxb3 and the patterning of other hindbrain neuronal populations such as the reticulo-spinal neurons and commissural neurons are normal. We were also able to phenocopy this defect with injection of hdac1 MOs and treatment with TSA. Embryos treated with TSA during early development, in 156
181 addition to defects in the migration of branchiomotor neurons, also displayed a reduction in the islet-1 expression in these neurons. Previous data from Cunliffe (2004) has implicated hdac1 in the specification of hindbrain branchiomotor neurons, raising the possibility that the reduction in islet-1 expression in these TSA treated embryos could be due to defects in specification of this subset of neurons. We also show that treatment of wildtype embryos with TSA during later stages (at 21 and 24 hpf; not shown) resulted in aberrant neuronal migration suggesting that continued Hdac activity is required for caudal migration of the facial branchiomotor neurons. Novel functions of Hdac1 in the Wnt/PCP pathway Our studies of col mutants have revealed novel functions of Hdac1 in major signaling pathways regulating embryonic development. However, precisely how Hdac1 functions in these pathways is not fully understood. In the canonical Wnt pathway (see Nambiar and Henion, 2004), Hdac1 functions as a corepressor with molecules such as Groucho and LEF1 in the nucleus (Brantjes et al., 2001; Chen et al., 1999; Billin et al., 2000). Studies in Drosophila and vertebrates have shown that Groucho, a canonical Wnt signaling pathway repressor, readily interacts with Hdac1 forming a repressor complex that remains tethered to the promoter of Wnt target genes (Brantjes et al., 2001; Chen et al., 1999). Data also indicates that the Wnt transcription factor LEF1 can act as a repressor in the presence of Hdac1 (Billin et al., 2000). Activation of LEFdependent target genes occurs when the increasing level of β-catenin in the 157
182 nucleus is able to dissociate Hdac1 from LEF1 and itself bind to LEF1 to form a dimeric activator (Billin et al., 2000). Thus, Hdac1 appears to maintain Wnt target genes in a repressed state until replaced by activators such as β-catenin (Billin et al., 2000). In this study we have shown that col/hdac1 regulates both the noncanonical Wnt/PCP pathway that controls CE movements as well as the pathway that mediates the caudal migration of hindbrain facial motor neurons. There are a number of possible ways in which Hdac1 functions in these pathways. For example, since Hdac1 regulates both pathways, it is conceivable then that Col/Hdac1 could act by regulating the transcription of vangl2 or its interacting proteins. We examined vangl2 expression in col mutants and there appeared to be no significant difference compared to wildtype siblings (not shown). Another possible scenario for the functioning of Col/Hdac1 in this context could be via an interaction with Vangl2 and its interacting proteins such as Pk and Scribble that act at the common branchpoint. Another possibility is that Col/Hdac1 regulates the transcription of other components of the Wnt/PCP pathway and/or the targets of Wnt/PCP pathway genes. In the latter case, additional interactions of Hdac1 with Wnt/PCP signaling-independent genes or components of the pathway that also regulate branchiomotor neuron migration are possible. Further studies exploring the function of col should reveal the molecular mechanism by which col/hdac1 affects the activities of the genes involved in the morphogenetic events we have described. 158
183 MATERIALS AND METHODS Fish strains Adult zebrafish and embryos were maintained at 28.5 C and staged by hours post fertilization (hpf), days post fertilization (dpf) or morphological criteria (Kimmel et al., 1995). Mutant embryos (AB and WIK background) were collected from pair-wise matings of heterozygous adults. All phenotypic analyses of col mutants were done using embryos homozygous for the col b382 allele (Henion et al., 1996). Axis length, somite number and notochord diameter measurements To compare axis length between col mutant and wildtype embryos (Table 4.1), images of wildtype and col/hdac1 mutant embryos were taken at identical positions under a Leica compound light microscope and then measurements were made using the Leica SPOT v 4.0 software measurement tools that were calibrated with a standard stage micrometer. 20 wildtype and 20 col/hdac1 mutants were used for analysis at 25 hpf and 10 each of wildtype and col/hdac1 mutant embryos were measured at 48 and 72 hpf. The data obtained was analyzed using 2 way ANOVA and Bonferroni post hoc tests. Graph prism pad version 4.0 software was used to conduct statistical analysis. Quantification of somite numbers in time-matched (hpf) col mutant and wildtype embryos was performed at 16, 27 and 48 hpf (Table 4.2). Embryos were obtained from col heterozygous adults. Somite pairs of a clutch of live individual 159
184 embryos at 16 hpf were counted within 25 min and the embryos were allowed to develop to 27 hpf when the col phenotype is readily apparent in order to assign genotype to individual embryos. For counts at 27 and 48 hpf, embryos were anaesthetized with tricaine to immobilize them for counts. For notochord diameter quantification (Table 4.3), 10 embryos of each type (wildtype uninjected, col uninjected, Ndsh injected col and wildtype, rok2 injected col and wildtype and vangl2 injected col and wildtype) at 48 hpf were fixed and labeled with f59 antibody to provide tissue contrast. Embryos were cryosectioned (16 μm) and 6 7 mid-trunk sections per embryo were imaged. The images were then transferred to a drawing program (Adobe Photoshop 7.0) and notochord measurements were made using the scale bar. The significance of differences from observed values was assessed using the Mann Whitney U test. The increase in notochord diameter observed in col mutants compared to wildtype was found to be significant, P < Because no significant differences were observed between uninjected wildtype and all injected wildtype embryos, these data are not shown (see Section 2). Trichostatin A treatment Trichostatin A (TSA; Biovision Research Products) was dissolved in DMSO at a concentration of 1 mg/ml. This stock solution was then diluted in fish water to the concentrations indicated. 160
185 Genetic mapping and cloning For linkage analysis, AB background heterozygous col individuals were crossed to a polymorphic WIK strain and mutant and wildtype embryos were used. Genomic DNA was prepared from 1534 embryos and PCR was performed using Simple Sequence Length Polymorphic markers (SSLP; Knapik et al., 1996). Primer sequences for SSLP markers were obtained from the MGH zebrafish database. The ck2b, hdac1 and hey1 coding sequences were amplified from col b382 by RT-PCR and then directly sequenced. A single nucleotide polymorphism (T A) at position 583 in the ck2b cdna sequence was used to identify recombinants. The CHORI211 BAC library was screened by PCR using the ck2b primers to identify positive BAC clones. BAC end sequences were obtained from the Sanger Institute database ( ) and PCR primers were designed to amplify regions of these sequences from mutant and wildtype embryos. Polymorphisms were identified in these amplicons and used to check for recombinants. The splice site lesion was identified from several independently amplified fragments from col and wildtype genomic DNA using PCR primers (5 -TAACGTAGGGGAGGATTGTC-3 ) and (5 - CAGCTCCAGAATGGCCAGTAC-3 ) that amplify across intron 4 5. Mutant and wildtype spice variants were examined using RT-PCR. Plasmid constructs The full-length hdac1 gene cloned into pbs SK+ was a gift from I. Masai (RIKEN, Japan). Other constructs used in this study were vangl2/tri (Jessen et 161
186 al., 2002), rho kinase 2 (Jessen et al., 2002), Ndsh (Heisenberg et al., 2000). In situ probes for hdac1 were generated using the first 720 bp of the hdac1 cdna and cloning into the TOPO TA vector. Probes were synthesized by digesting with Pvu I followed by transcription using T7 polymerase. mrna and morpholino injections mrna was synthesized using Ambion s T7, T3 or SP6 mmessage mmachine kit (Ambion). Following transcription, the mrna was extracted using phenol/chloroform and concentrated in Microcon YM-50 (Amicon) microconcentrator filter devices. mrna quality was assayed using gel electrophoresis. mrna was diluted in 1% phenol red and pressure injected into the YSL of 1- to 8-cell stage embryos. The concentration of mrna injected into each embryo was approximately pg depending on the mrna used. The antisense hdac1 morpholino was targeted to the translational initiation site (5 -TTGTTCCTTGAGAACTCAGCGCCAT-3 ) and a modified morpholino was also used as a specificity control (5 -TTGcTCCcTGAGAtCTCAGgGCCAT-3 ). The sequence for the MO targeting vangl2 was the same as Park and Moon, All morpholinos were obtained from Gene Tools. The morpholinos were diluted with phenol red/0.2 M KCl (1:6) prior to injection and 2 8 ng was injected per embryo. Morpholinos were pressure injected into the YSL of 1- to 8-cell stage embryos. 162
187 In situ hybridization, immunohistochemistry and genotyping In situ hybridization was performed using standard protocols. The following probes were used: no tail (Schulte-Merker et al., 1992), foxd3 (Odenthal and Nusslein-Volhard, 1998), vangl2 (Park and Moon, 2002), myod (Weinberg et al., 1996), islet1 (Korzh et al., 1993), dlx2 (Akimenko et al., 1994), wnt5a (Rauch et al., 1997), krox20 (Wilkinson et al., 1989), val (Moens et al., 1996), huc (Kim et al., 1996), hoxb3 (Prince et al., 1998), wnt11 (Heisenberg et al., 2000), wnt8 ( Kelly et al., 1995). Probes were synthesized using T7, T3 or SP6 RNA polymerases and DIG labeled rntps as appropriate. For in situ hybridizations on embryos older than 24 hpf, the embryos were raised in 0.03 g/l 1-phenyl-2- thiourea (PTU) to prevent melanin synthesis which allowed clear analysis of gene expression patterns without interference from pigmented melanophores. Immunohistochemistry was performed according to Henion et al., The antibodies used were F59 (Crow and Stockdale, 1986), zn12 (Trevarrow et al., 1990), acetylated tubulin (Sigma), RMO44 (Zymed) and actin (Abcam). To determine the genotype of embryos used in experiments before a readily apparent phenotype is seen, DNA from individual embryos was obtained and PCR was performed on genomic DNA using the closely linked SSLP marker Z7235 and Z
188 TABLES AND FIGURES Hours Mean length of embryos in mm ±1 SD post fertilization Wildtype col/hdac1 P value ±0.085 n = ±0.05 n =20 P< ±0.054 n = ±0.052 n =10 P< ±0.067 n = ±0.184 n =10 P< Table 4.1. Statistical analysis of mean length of wildtype and col/hdac1 embryos at 25, 48 and 72 hpf 164
189 Hours post Number of somites ±1 SD P value fertilization Wildtype col ±0.93 n = ±0.99 n =20 P> ±0.88 n = ±1.25 n =10 P < ±0.63 n = ±0.85 n =10 P < 0.01 Table 4.2. Somite counts of wildtype and col mutants at 16, 27 and 48 hpf post fertilization. 165
190 Embryos Notochord diameter-mid trunk (m) Uninjected wildtype 40.5 ±2.5 Uninjected col mutants 46.6 ±2.3 DNdsh injected col mutants 39.7 ±3.1 rok2 injected col mutants 39.5 ±3.3 vangl2 injected col mutants 40.2 ±1.6 Table 4.3. Wnt/PCP components are able to rescue thenotochord phenotype in col mutant embryos 166
191 RNA constructs Rescue of body extension Percentage (%) Rescue of neuronal migration Percentage (%) Total (n) Ndsh 45 ± rok ± vangl ± ± Table 4.4. Components of the non-canonical Wnt/PCP pathway can rescue aspects of the col mutant phenotype 167
192 Construct injected Rescue of CE and neuronal migration defects Percentage (%) Mutant phenotype observed Percentage (%) *Abnormal Percentage (%) Total (n) hdac1 RNA ±7 85 4± ± hdac1 MO ± ± Embryos that displayed severe necrosis and severe loss of head or trunk were classified as abnormal. Data are from three separate experiments. Homozygous mutants were identified by genotyping. Three hundred and fifty picogram hdac1 mrna was used. hdac1 MO was injected into wildtype (AB*) embryos. Table 4.5. hdac1 RNA is able to rescue the col mutant phenotype while the hdac1 MO is able to phenocopy the mutants 168
193 Conc of TSA (nm) 50 nm at 5hpf 800 nm at 16hpf Defects in forebrain development, CE and neuronal migration observed Percentage Defects in CE and neuronal migration Percentage Total (%) only observed (%) (n) Table 4.6 TSA treatment is able to phenocopy the col mutant phenotype 169
194 Figure 4.1. col mutant embryos display a late axial extension phenotype. Live col mutants at 4 dpf (B) have wider notochords (n) than their wildtype siblings (A). Larger notochord diameter is observed in cross-sections of the trunk of 2 col mutants stained with antibody f59 (D) as compared to wildtype (C). col mutants also display rounded somite morphology (B) unlike chevron-shaped wildtype somites (A). In contrast, col mutants do not display prominent early CE defects. For example, ntl expression in the notochord anlage at late gastrulation of col embryos (F) is indistinguishable from wildtype embryos (E). The degree of convergence of the neural plate border at the 12-somite stage identified by foxd3 expression also appears normal in col mutants (G and H). 170

195 Figure
 as in wildtype siblings (A). In contrast, nv neurons are positioned correctly in mutants. 172")
196 Figure 4.2. Facial (nvii) hindbrain neurons in col mutants do not migrate tangentially. Hindbrain neurons are marked by islet1 expression (A and B) at 56 hpf. In col mutant, nvii neurons fail to migrate into r6 and r7 (B) as in wildtype siblings (A). In contrast, nv neurons are positioned correctly in mutants. 172
197 Figure 4.3. Gross patterning of the hindbrain is unperturbed in col mutants. Hindbrain rhombomere patterning appears undisturbed in col mutant embryos (B, D and F) as compared to wildtype (A, C and E). Krox20 (red) labels r3 and r5 and valentino (blue) marks r5 and r6 (A and B). hoxb3 also marks r5 and r6 (C and D). fgf8 (blue) labels the mid-hindbrain boundary and krox20 (red) marks r3 and r5 showing that gross development between the mid-hindbrain boundary and r3 in the hindbrain also appears normal in col mutant embryos (F as compared to E). RMO44 labels reticulospinal neurons (G and H). The patterning of this neuronal population is relatively unperturbed in col mutants although overall neuronal numbers appear to be reduced (see Section 2). 173

198 Figure
 and rok2 (C and E) were able to abolish the short body axis (B and C) and short wide notochords (E and F) observed in col mutants at 3 dpf (A and D).")
199 Figure 4.4. Regulators of the Wnt/PCP pathway are able to partially rescue col mutants. Ndsh (dsh; B and F) and rok2 (C and E) were able to abolish the short body axis (B and C) and short wide notochords (E and F) observed in col mutants at 3 dpf (A and D). However, canonical Wnt signaling regulated defects in col mutants still remain in injected embryos. dlx2 expression in the telencephalon (asterisk) remains reduced compared to wildtype (G) in rock2 injected col mutant embryos (I) as compared to uninjected col mutants (H). The persistence of this phenotype is also observed in Ndsh injected col mutants (not shown). 175
 is able to rescue the stunted trunk development and broad notochords observed in uninjected col mutants (A and C).")
200 Figure 4.5. tri/vangl2 is able to rescue extension defects and tangential migration of hindbrain branchiomotor neurons in col mutant embryos. Overexpression of tri/vangl2 in col mutants (B and D) is able to rescue the stunted trunk development and broad notochords observed in uninjected col mutants (A and C). Facial (nvii) hindbrain motor neurons labeled by islet1 expression are positioned ectopically in r4 in col mutants at 56 hpf (F) compared to wildtype (E). Overexpression of tri/vangl2 restores tangential migration of these neurons into r6 and r7 (G) as in wildtype siblings (E). nv neurons are positioned correctly in r2 in tri/vangl2 injected (G) and uninjected (F) col mutants. 176
201 Figure 4.6. The col locus encodes hdac1. col maps close to the zebrafish hdac1 locus on LG 19 (A). A schematic showing the genomic organization of the zebrafish hdac1 gene (B). The zebrafish hdac1 gene has 15 exons and 14 introns spanning 9.94 kb of the genome and a T G transversion in the intronic sequence adjacent to exon 5 causes aberrant splicing between exons 4 and 5 in col mutants (C). Aberrantly spliced hdac1 cdna fragment in col with an additional 9 bp running in lane 1 can be distinguished from the wildtype product running in lane 2 (D). hdac1 expression is unaffected in 2 dpf col mutants (F, H) compared to wildtype (E and G). 177

202 Figure
203 Figure 4.7. hdac1 morphants phenocopy col mutants and hdac1 RNA rescues col mutant phenotypes. hdac1 MO (hdac MO) injected wildtype embryos at 3 dpf (B) resemble uninjected col mutants (A). Reduced dlx2 expression (asterisk) and ectopically positioned facial hindbrain motor neurons (black arrowheads) in col mutants (D and G) are phenocopied in hdac1 morphants (E and H). The position of nv neurons in r2 are marked with arrows (G I). hdac1 RNA (hdac RNA) is able to rescue axis extension and melanophore defects in col mutants (C). Telencephalon dlx2 expression and migration of facial hindbrain motorneurons is restored in col mutants injected with hdac1 RNA (F and I compared to D and G). 179

204 Figure
 as compared to wildtype (A).")
205 Figure 4.8. CE defects in early TSA-treated wildtype embryos resembles other zebrafish Wnt/PCP mutants. foxd3 expression at the 6-somite stage in TSA-treated embryos shows defects in convergence (arrowheads; B) as compared to wildtype (A). ntl expression at the 6-somite stage (C and D) and 22 hpf (E and F) reveals shorter, thicker notochord in TSA-treated embryos (D and F) than in wildtype embryos (C and E). myod expression at 22 hpf shows compressed, laterally expanded somites in TSAtreated embryos (H) as compared to wildtype (G). 181
 while the facial hindbrain motorneurons remain in r4 (arrowhead; E) as in col mutants. The position of nv neurons are shown with black arrows.")
206 Figure 4.9. Wildtype embryos treated late with TSA phenocopy col mutants. Live wildtype embryos at 2 dpf treated with 800 nm TSA late (at 16 hpf) resemble col mutants (A, compare to Fig. 4.7 A). dlx2 expression is unaffected in these embryos (C; ) while the facial hindbrain motorneurons remain in r4 (arrowhead; E) as in col mutants. The position of nv neurons are shown with black arrows. Phenotypes observed at 2 dpf in wildtype embryos treated with 50 nm TSA early (5 hpf) appear more severe (B). The forebrain dlx2 expression domain is reduced (D; ), similar to col mutants, and facial hindbrain motorneurons remain in r4 (F) in these embryos. 182
 still display axial extension defects observed in vangl2 morphants (A).")
207 Figure hdac1 RNA does not rescue defects in vangl2 morphants. vangl2 morphants injected with hdac1 RNA (B) still display axial extension defects observed in vangl2 morphants (A). The tangential migration defect of hindbrain nv11 branchiomotor neurons in vangl2 morphants is also not rescued by hdac1 misexpression (not shown). 183
 accompanying severe loss of trunk tissues.")
208 Figure Overexpression of hdac1 in wildtype embryos, causes brain and trunk defects. Injection of hdac1 RNA causes and enlargement of the forebrain (arrows) at moderate doses (B, compare to A). At high concentration hdac1 RNA causes loss of forebrain tissue and an expansion of midbrain (D, compare to C) accompanying severe loss of trunk tissues. wnt1 expression marks the posterior edge of the midbrain (arrow E) in uninjected wildtype embryos at 2 dpf. Embryos injected with hdac1 RNA display an antero-posterior expansion of wnt1 expression (arrows). 184
209 CHAPTER 5 GENETIC INTERACTIONS BETWEEN HDAC1 AND TFAP2A IN NEURAL CREST DERIVED CRANIOFACIAL AND MELANOPHORE DEVELOPMENT 4. ABSTRACT The disruption of both hdac1 and tfap2a results in severe reductions of all craniofacial and chromatophore neural crest derived sublineages. Later by 3 dpf while xanthophore numbers and migration recovers, melanophore and craniofacial development is still disrupted. The observed neural crest defects in hdac1 col /tfap2a mutant/ morphants is more severe than either hdac1 col (colgate) or tfap2a low/mob (lockjaw/montblanc) single mutants, indicating both additive as well as synergistic loss of function effects. 4 Myron S. Ignatius 1,2, Smitha Malireddy 1, Glen R. Gallagher 1 and Paul D. Henion 1,2* 1 Center for Molecular Neurobiology, Department of Neuroscience, The Ohio State University, 105 Rightmire Hall, 1060 Carmack Rd., Columbus, OH United States. 2 Molecular, Cellular and Developmental Biology Program, The Ohio State University, 105 Rightmire Hall, 1060 Carmack Rd., Columbus, OH United States. Unpublished, incomplete project. All data described herein, unless otherwise cited, were generated by M.S. Ignatius with help from S. Malireddy and G. Gallagher under the guidance of P.D. Henion. 185
210 INTRODUCTION The neural crest is a transcient embryonic cell population that gives rise to multiple derivatives including pigment cells, craniofacial cartilages and neurons and glia of the peripheral nervous system (LeDouarin, N., Kalcheim, C., 1999). At the molecular level several genes and molecular pathways are known to be required for neural crest development. Members of the Bmp, Wnt, Fgf and Notch signaling pathway are required for the initial specification and later maintenance of neural crest cells (Barembaum and Bronner-Fraser, 2005; Cornell and Eisen, 2005; Huang and Saint-Jeannet, 2004; Steventon et al., 2005). In addition to signaling molecules several transcription factors are known to be required for neural crest cells and sublineage development. These include foxd3 (Dottori et al., 2001; Kos et al., 2001; Lister et al., 2006; Sasai et al., 2001; Stewart et al., 2006; Teng et al., 2008), pax3 (Epstein et al., 1991; Tassabehji et al., 1993), SoxE gene family members, sox9 and sox10 (Dutton et al., 2001; Kelsh and Eisen, 2000; Potterf et al., 2000; Southard-Smith et al., 1998), snail1b and tfap2 family member tfap2a (Barrallo-Gimeno et al., 2004; Brewer et al., 2002; Knight et al., 2003; Luo et al., 2003; O'Brien et al., 2004; Schorle et al., 1996; Zhang et al., 1996). Presently, our understanding of molecular requirements in neural crest development has largely focused on loss or gain of function of one gene at a time. However, more complex regulatory gene interactions likely determine the final outcome in neural crest development as well as in disease conditions. 186
211 Recently, select studies have begun to address regulatory interactions between two transcription factors in neural crest development. These studies have examined the genetic interactions between the tfap2 family members in neural crest development (Knight et al., 2005; Li and Cornell, 2007). Perturbation of both tfap2a and tfap2c results in the complete loss of neural crest cell induction (Li and Cornell, 2007). While in single tfap2a and tfap2c mutants or morphants, overall induction of neural crest is unaffected, however, tfap2a is required later for neural crest survival and in the hyoid arch, melanophore, sympathetic neuron and enteric neuron sublineages (Barrallo-Gimeno et al., 2004; Holzschuh et al., 2003; Knight et al., 2003; O'Brien et al., 2004; Schorle et al., 1996; Zhang et al., 1996). In another study, the effect of disrupting the combination of tfap2a and tfap2b resulted in severe deficits in craniofacial development as compared to milder defects resulting from single gene loss of function (Knight et al., 2005). Also, a requirement of tfap2b in the ectoderm for craniofacial development is unmasked only in a tfap2a genetic background. Recently, studies in our lab have identified a genetic interaction between tfap2a and foxd3which when disrupted together results in the abrogation of all neural crest derivatives. However, in contrast to earlier disruption of neural crest induction in tfap2a and tfap2c double mutant/ morphants, in tfap2a low-/- /foxd3 df10-/- double mutants and double mutant/ morphants, neural crest cells are induced, but subsequently they fail to express soxe genes sox9 and sox10, which are required for the specification of neural crest sublineages and survival (Arduini et al., manuscript in preparation). Thus, tfap2 transcription factor family member 187
212 tfap2a appears to be a critical regulator of neural crest development. Presently, it is not known whether additional regulatory interactions exist between tfap2a family and other genes. An important candidate to test for regulatory interactions with tfap2a is histone deacetylase 1/hdac1. hdac1 is an essential gene that is not vital for neural crest induction but has been found to be required for the specification of melanophores and posterior branchial arch precursors (Ignatius et al., 2008; Ignatius et. al., manuscript in preparation). In addition, hdac1 is required for the differentiation of melanophores, craniofacial derivatives and peripheral neurons (Ignatius et al., 2008; Ignatius et al., manuscript in preparation). Histone deacetylase/ HDAC inhibitors are being considered as drug candidates in the treatment of cancers and potentially in neurodegenerative diseases (Dokmanovic et al., 2007; Guasconi and Puri, 2008; Hockly et al., 2003; Iezzi et al., 2002; Minucci and Pelicci, 2006). We have earlier demonstrated that treatment of wild type embryos with HDAC inhibitor TSA largely mirrors the hdac1 mutant, suggesting that hdac1 might be a critical HDAC during early development (Ignatius et al., manuscript in preparation). A particular grey area in HDAC biology presently is that the effect of HDAC loss of function in the context of other mutations or treatments is unclear. In this study we explore the genetic interaction between tfap2a and hdac1 on neural crest development. Interestingly, we find that the combined loss of both tfap2a and hdac1 results in the disruption of chromatophore and craniofacial development. The defects observed are more severe that single mutants alone. 188
213 Analysis of sublineage specific gene expression reveals that fewer precursors are specified in double hdac1/tfap2a mutant/ morphant embryos. Analysis of sox10 expression which is unaffected in single tfap2a and hdac1 mutants is reduced in double hdac1 col /tfap2a mutant/ morphants at 24 hpf. The severity of reductions of sox10-positive neural crest cells is not uniform along the A-P axis in hdac1 col /tfap2a double mutant/ morphants suggesting differential requirements of hdac1 and tfap2a along the rostral-caudal axis of the developing embryo. RESULTS Severe melanophore and craniofacial defects in hdac1 col /tfap2a mutant /morphants Abrogation of hdac1 and tfap2a in hdac1 col /tfap2a mutant/ morphants produces a severe reduction in black melanin-containing melanophores at 25 hpf (hours post fertilization), 48 hpf and 3.5 dpf (days post fertilization) as compared to either hdac1 col mutants or tfap2a morphants (Fig 5.1, 5.2). At 48 hpf and later, reduced numbers of melanophores are present in the anterior trunk and in the head of hdac1 col /tfap2a mutant/ morphants, however, the posterior trunk and tail are devoid of melanophores. Similar to deficits in melanophore development, xanthophores which give embryos a yellowish-golden hue are initially reduced in hdac1 col /tfap2a mutant/ morphants and in hdac1 col mutants, however by 3 dpf and later xanthophore numbers recover and are present both in hdac1 col mutants as well as hdac1 col /tfap2a mutant/ morhpants (Fig. 5.1, 5.2). 189
214 The overall live morphology of hdac1 col /tfap2a mutant/ morhpants resembles hdac1 col mutants at all stages with the exception of melanophore and craniofacial deficits. In live hdac1 col /tfap2a mutant/ morhpants at 3.5 dpf, there is almost a total absence of tissue structures in the jaw regions when compared to hdac1 col mutants (Fig 5.2). Severe reduction in the specification of melanophpore, xanthophore and craniofacial sublineages As there is a severe reduction of melanophore and craniofacial development in hdac1 col /tfap2a mutant/ morhpants, we decided to examine the expression of genes required for neural crest sub-lineage development. mitfa is a transcription factor that is a critical regulator of melanophore development and is necessary for specification (Lister et al., 1999). In hdac1 col /tfap2a mutant/ morhpants, qualitatively, the number of mitfa-positve melanoblasts that are present at 25 hpf is highly reduced when compared to hdac1 col mutants and tfap2a morphants (Fig 5.3 A-D). We also observed that the numbers of dctpositive differentiating melanoblasts is also reduced in hdac1 mutants, tfap2a morphants and hdac1 col /tfap2a mutant/ morhpants at 24 hpf (data not shown). Later by 48 hpf, while there is an increase in differentiating melanoblasts in hdac1 col mutants and tfap2a morphants, very few differentiating melanoblasts recover in hdac1 col /tfap2a mutant/ morhpants embryos. 190
215 We also assessed the expression of xdh and dlx2, which are some of the earliest genes expressed in neural crest derived xanthoblast and craniofacial precursors (Akimenko et al., 1994; Parichy et al., 2000). We find that qualitatively, there are fewer xdh positive xanthoblasts present in hdac1 col /tfap2a mutant/ morhpants, while in tfap2a morphants, there does not appear to be a reduction in xdh expression at 25 hpf, consistent with published data (Fig 5.4 A- D). dlx2 is expressed in four out of the eventual seven pharyngeal arches in addition to the forebrain at 25 hpf. In hdac1 col /tfap2a mutant/ morhpants, there is a reduction in mandibular arch dlx2 expression and acute reduction of hyoid and branchial arch dlx2expression at 25 hpf (Fig 5.4 E-H). In contrast, in tfap2a morphants, qualitatively, there are equivalent numbers of mandibular arch precursors and reductions in hyoid and branchial arches and in hdac1 col mutants, mandibular and hyoid arch precursors are similar to wild-type embryos, while fewer branchial arch precursors are specified (Knight et al., 2003; Ignatius et al., Manuscript in preparation). Preliminary evidence on the specification of craniofacial, melanoblast and xanthoblast precursors suggests to us that the effects of loss of both hdac1 and tfap2a are additive and in the case of the mandibular arch precursors the reduction is synergistic. Abrogation of posterior trunk neural crest cells Since there is a reduction in the specification of all neural crest derivatives analyzed thus far and correspondingly drastic reductions in craniofacial and melanophore development at 3.5 dpf we decided to investigate whether 191
216 precursor neural crest cells are present at 24 hpf. We evaluated sox10 expression at 24 hpf in hdac1 col /tfap2a mutant/ morhpants (Dutton et al., 2001). We observed that in hdac1 col /tfap2a mutant/ morhpants, overall qualitatively there are fewer sox10-positive neural crest cells present. However, this reduction is more obvious in the head where fewer neural crest cells are present and in the posterior trunk and the tail where there is a complete absence of sox10-positive neural crest cells (Fig 5.5). We also examined sox10 expression at 48 hpf in hdac1 col /tfap2a mutant/ morhpants and observed that sox10 expression does not recover in the posterior trunk and tail. This data suggests to us that there are differential requirements for hdac1 and tfap2a along the rostoral-caudal axis of the embryo. DISCUSSION AND FUTURE DIRECTION Our preliminary data suggests that an important genetic interaction exists between tfap2a and hdac1 specifically in the neural crest. The effect of reducing both tfap2a and hdac1 results in the synergistic reduction of sox10-positive neural crest cells at 24 hpf and later. In contrast, in either tfap2a or hdac1 mutants, there is qualitatively only a slight, if any reduction in the number of sox10-positive neural crest cells at 24 hpf. While single gene knock outs or mutants help define essential requirement in development more complex genetic interactions most likely determine the ultimate development of the neural crest and other tissue types. Interestingly, initial experiments indicate that tfap2a regulated gene expression is an important central regulator for neural crest 192
217 development, as a combined loss of tfap2a and tfap2c or foxd3 completely abrogates neural crest cell development, although, the stages at which neural crest development fails differs in each case (Li and Cornell, 2007; Arduini et al., Manuscript in preparation). On the other hand loss of tfap2a and tfap2b results in the distruption of neural crest derived craniofacial development (Knight et al., 2005) and a combined loss of tfap2a and hdac1 abrogates posterior trunk and tail neural crest development and causes reductions in the numbers of melanophore, xanthophore and craniofacial derivative precursors specified. There is also a rostral-caudal component to the genetic interaction between tfap2a and hdac1, where in the head there is a distinguishable reduction in neural crest cells. In the anterior trunk, qualitatively, there is no difference in the number of neural crest cells present, while in the posterior trunk there is an abrogation of neural crest cells in hdac1 col /tfap2a mutant/ morhpant embryos. Thus, the trunk neural crest domain can potentially be divided into two components, the anterior trunk crest and the posterior trunk and tail neural crest. Another aspect of the genetic interaction between tfap2a and hdac1 is that in the three sublineages we have analyzed so far, there are clear reductions in the numbers of derivatives specified at 24 hpf. The consequences of loss of hdac1 and tfap2a on specification appears to be additive in the case of melanophore, xanthophore, and the hyoid and posterior branchial arches. Interestingly, reductions in the number of mandibular arch precursors specified suggest that additionally a synergestic interaction also exists between hdac1 and tfap2a. 193
218 While our preliminary evidence is promising and generates important questions which are at the core of neural crest development. The following additional experiments would be required to result in eventual publication. A first set of experiments would be to define the presence of neural crest derivedperipheral nervous system derivatives in hdac1 col /tfap2a mutant/ morphant embryos. We will use foxd3-expression to detect cranial satellite glia, and Hu expression to detect DRG, enteric, sympathetic and cranial neurons. Additionally, we will assess sympathetic neuron development by the expression of phox2b in precursors and th for cathacholaminergic differentiation. A second set of experiments that would need to be carried out would be to determine the earliest temporal stage at which both hdac1 and tfap2a are required for neural crest development. In hdac1 col mutants at the 3 and 6 s stage while equivalent numbers of neural crest cells are induced there is a reduction of foxd3 and ctn in the trunk neural crest cells. Earlier experiments in our laboratory have demonstrated that in tfap2a low-/- / foxd3 df10-/- double mutants, neural crest cells are initially induced at 3 and 6 s stages, however, subsequently neural crest gene expression fails to be maintained resulting in the loss of subsequent development (Arduini et al., manuscript in preparation). We hypothesize that hdac1, which is required for the initial trunk foxd3 expression (unpublished data), when combined with the absence of tfap2a, results in the genetic reduction of both foxd3 and tfap2a and as a consequence trunk neural crest cells are lost. An alternative explanation would be that hdac1 and tfap2a interact independently of foxd3 and a consequence of loss of both hdac1 and tfap2a there is an abrogation 194
219 of posterior trunk and tail neural crest cells with milder reductions in the cranial crest and little if any reduction in the anterior trunk neural crest. To test both hypotheses we will perform gene expression analysis of early genes expressed within the neural crest domain and assess changes in gene expression as well as numbers of neural crest cells induced. Analysis will include tfap2a, foxd3, snail1b, sox10 and sox9b at 3 and 6 and 15 s stages. We will also evaluate neural crest border marker expression with the expression of msxc and pax3 (Kim et al., 1996; Ragland and Raible, 2004). The neural crest and Rohan Beard sensory neurons form an equivalence group in the trunk neural plate border (Cornell and Eisen, 2000). Therefore we will check if there is any change in the number of Rohan Beard neurons using islet1 and HuC expression in hdac1 col /tfap2a mutant/ morphant embryos (Korzh et al., 1993; Kim et al., 1996). Analysis of neural plate border, neural crest domain and Rohan Beard sensory neuron expression combined will determine the earliest stages at which the combination of tfap2a and hdac1 are required for neural crest development. The next set of experiments we perform will test if we can rescue premigratory, migratory and neural crest sublineages with sox10 and foxd3. In these experiments we will focus mainly on the posterior trunk and the tail regions of the embryo, as in hdac1 col /tfap2a mutant/ morphant embryos there is a complete abrogation of trunk neural crest cells. We predict that with sox10, we should rescue all non ectomessenchymal derivatives in the posterior trunk and tail and will score for the rescue of melanophores, xanthophores and DRG neurons. We predict that rescue with foxd3 should rescue prmigratory and 195
220 migratory neural crest sox10 expression. Additionally, as foxd3 is required for DRG neuron development, we would expect the rescue of DRG neurons in the posterior trunk. Finally, a fourth set of experiments would evaluate whether differences in neural crest cell survival and/ or proliferation are responsible for the abrogation of posterior trunk and tail neural crest cells in hdac1 col /tfap2a mutant/ morphant embryos. We already know that both tfap2a and hdac1 are required for the survival of neural crest cells and other cell types. MATERIALS AND METHODS Zebrafish Adult zebrafish and embryos were maintained at 28.5 C and staged by hours post fertilization (hpf), days post fertilization (dpf) or morphological criteria (Kimmel et al., 1995). Mutant embryos (AB and WIK background) were collected from pair-wise matings of heterozygous adults. For our analyses we used wildtype AB*, LF and ABLF fish, the tfap2 mutant allele line tfap2a low and hdac1 mutant allele line hdac1 col (Henion et al., 1996; Knight et al., 2003). In situ hybridization In situ hybridization was carried out on staged embryos as described previously (Thisse et al., 1993) with minor modifications. Embryos over 24 hpf were raised in 0.03g/l 1-phenyl-2- thiourea (PTU) to prevent melanin synthesis. Probes used were tfap2 (Knight et al., 2003), crestin (Luo et al., 2001; Rubinstein 196
221 et al., 2000), dct (Kelsh et al., 2000), dlx2 (Akimenko et al., 1994), foxd3 (Kelsh et al., 2000; Odenthal and Nusslein-Volhard, 1998), huc (Kim et al., 1996), islet1 (Korzh et al., 1993), mitfa (Lister et al., 1999), sox9a (Yan et al., 2002), sox9b (Li et al., 2002; Yan et al., 2005b), sox10 (Dutton et al., 2001a), xdh (Parichy et al., 2000). mrna and morpholino injections mrna was synthesized using Ambion s T7, T3 or SP6 mmessage mmachine kit (Ambion). Following transcription, the mrna was extracted using phenol/chloroform and concentrated in Microcon YM-50 (Amicon) microconcentrator filter devices. mrna quality was assayed using gel electrophoresis. mrna was diluted in 1% phenol red and pressure injected into the YSL of 1- to 4-cell stage embryos. The concentration of mrna injected into each embryo was approximately pg depending on the mrna used. The antisense hdac1 morpholino was targeted to the translational initiation site (5 -TTGTTCCTTGAGAACTCAGCGCCAT-3 ). The tfap2α morpholino is a splicing blocking morpholino targeting the exon2-intron2 boundary (O'Brien et al., 2004). All morpholinos were obtained from Gene Tools. The morpholinos were diluted with phenol red/0.2 M KCl (1:6) prior to injection and 2 8 ng was injected per embryo. Morpholinos were pressure injected into the YSL of 1- to 4-cell stage embryos. 197


222 TABLES AND FIGURES Figure 5.1. Severe melanophore defects in hdac1 col /tfap2a mutant /morphants at 48 hpf. A-D lateral view of live embryos at 48 hpf. Arrowheads indicating the A-P extent of black melanin containing differentiated melanophores. 198


223 Figure 5.2. Severe melanophore and craniofacial defects in hdac1 col /tfap2a mutant /morphants at 3.5 dpf. A-D, lateral view of live embryos at 3.5 dpf. Arrowheads indicate the A-P extent of black melanin containing differentiated melanophores. Arrows pointing craniofacial tissues in 3.5 dpf embryos. 199

 and 48 hpf (E-H,")
224 Figure 5.3. Severe reductions in the specification and differentiation of melanophpores. A-H lateral view of embryos at 25 hpf (A-D, mitfa) and 48 hpf (E-H, dct); wt, wild type; wt/ tfap2a mo, wild type/ tfap2a morphant; hdac1 col /tfap2a mo, hdac1 col /tfap2a mutant/ morphant embryos. 200


225 Figure 5.4. Reductions in the specification of xanthophore and craniofacial sublineages. A-H, lateral views of embryos at 25 hpf; A-D xdh expression; E-H, dlx2 expression; Arrowheads indicating; M, mandibular arch; H, hyoid arch; BA, branchial arches; wt, wild type; wt/ tfap2a mo, wild type/ tfap2a morphant; hdac1 col /tfap2a mo, hdac1 col /tfap2a mutant/ morphant embryos. 201

226 Figure 5.5. Abrogation of posterior trunk neural crest cells in hdac1 col /tfap2a mutant/ morphants. A-D lateral view of embryos at 25 hpf. Arrowheads indicating posterior trunk and trail neural crest cells in hdac1 col and hdac1 col /tfap2a mutant/ morphant embryos; wt, wild type; wt/ tfap2a mo, wild type/ tfap2a morphant; hdac1 col /tfap2a mo, hdac1 col /tfap2a mutant/ morphant embryos. 202
Role of Organizer Chages in Late Frog Embryos
 Ectoderm Germ Layer Frog Fate Map Frog Fate Map Role of Organizer Chages in Late Frog Embryos Organizer forms three distinct regions Notochord formation in chick Beta-catenin localization How does beta-catenin
Zebrafish foxd3 is selectively required for neural crest specification, migration and survival
 Developmental Biology 292 (2006) 174 188 www.elsevier.com/locate/ydbio Zebrafish foxd3 is selectively required for neural crest specification, migration and survival Rodney A. Stewart a, Brigitte L. Arduini
Cell-Cell Communication in Development
 Biology 4361 - Developmental Biology Cell-Cell Communication in Development October 2, 2007 Cell-Cell Communication - Topics Induction and competence Paracrine factors inducer molecules Signal transduction
9/4/2015 INDUCTION CHAPTER 1. Neurons are similar across phyla Thus, many different model systems are used in developmental neurobiology. Fig 1.
 INDUCTION CHAPTER 1 Neurons are similar across phyla Thus, many different model systems are used in developmental neurobiology Fig 1.1 1 EVOLUTION OF METAZOAN BRAINS GASTRULATION MAKING THE 3 RD GERM LAYER
1. What are the three general areas of the developing vertebrate limb? 2. What embryonic regions contribute to the developing limb bud?
 Study Questions - Lecture 17 & 18 1. What are the three general areas of the developing vertebrate limb? The three general areas of the developing vertebrate limb are the proximal stylopod, zeugopod, and
Bio Section III Organogenesis. The Neural Crest and Axonal Specification. Student Learning Objectives. Student Learning Objectives
 Bio 127 - Section III Organogenesis The Neural Crest and Axonal Specification Gilbert 9e Chapter 10 Student Learning Objectives 1. You should understand that the neural crest is an evolutionary advancement
10/2/2015. Chapter 4. Determination and Differentiation. Neuroanatomical Diversity
 Chapter 4 Determination and Differentiation Neuroanatomical Diversity 1 Neurochemical diversity: another important aspect of neuronal fate Neurotransmitters and their receptors Excitatory Glutamate Acetylcholine
Genetic ablation of neural crest cell diversification
 RESEARCH ARTICLE 1987 Development 136, 1987-1994 (2009) doi:10.1242/dev.033209 Genetic ablation of neural crest cell diversification Brigitte L. Arduini 1, *,, Kevin M. Bosse 1,2, * and Paul D. Henion
Question Set # 4 Answer Key 7.22 Nov. 2002
 Question Set # 4 Answer Key 7.22 Nov. 2002 1) A variety of reagents and approaches are frequently used by developmental biologists to understand the tissue interactions and molecular signaling pathways
MCDB 4777/5777 Molecular Neurobiology Lecture 29 Neural Development- In the beginning
 MCDB 4777/5777 Molecular Neurobiology Lecture 29 Neural Development- In the beginning Learning Goals for Lecture 29 4.1 Describe the contributions of early developmental events in the embryo to the formation
Conclusions. The experimental studies presented in this thesis provide the first molecular insights
 C h a p t e r 5 Conclusions 5.1 Summary The experimental studies presented in this thesis provide the first molecular insights into the cellular processes of assembly, and aggregation of neural crest and
The formation of the neural crest has been traditionally considered a classic example of
 CHAPTER 2 Neural Crest Inducing Signals Mardn L. Basch and Marianne Bronner-Fraser* Abstract The formation of the neural crest has been traditionally considered a classic example of secondary induction,
Cell Cell Communication in Development
 Biology 4361 Developmental Biology Cell Cell Communication in Development June 25, 2008 Cell Cell Communication Concepts Cells in developing organisms develop in the context of their environment, including
Developmental Biology 3230 Midterm Exam 1 March 2006
 Name Developmental Biology 3230 Midterm Exam 1 March 2006 1. (20pts) Regeneration occurs to some degree to most metazoans. When you remove the head of a hydra a new one regenerates. Graph the inhibitor
Name. Biology Developmental Biology Winter Quarter 2013 KEY. Midterm 3
 Name 100 Total Points Open Book Biology 411 - Developmental Biology Winter Quarter 2013 KEY Midterm 3 Read the Following Instructions: * Answer 20 questions (5 points each) out of the available 25 questions
Timing and pattern of cell fate restrictions in the neural crest lineage
 Development 124, 4351-4359 (1997) Printed in Great Britain The Company of Biologists Limited 1997 DEV1236 4351 Timing and pattern of cell fate restrictions in the neural crest lineage Paul D. Henion* and
Cellular Neurobiology BIPN 140 Fall 2016 Problem Set #8
 Cellular Neurobiology BIPN 140 Fall 2016 Problem Set #8 1. Inductive signaling is a hallmark of vertebrate and mammalian development. In early neural development, there are multiple signaling pathways
Paraxial and Intermediate Mesoderm
 Biology 4361 Paraxial and Intermediate Mesoderm December 7, 2006 Major Mesoderm Lineages Mesodermal subdivisions are specified along a mediolateral axis by increasing amounts of BMPs more lateral mesoderm
THE SPECIFICATION OF DORSAL CELL FATES IN THE VERTEBRATE CENTRAL NERVOUS SYSTEM
 Annu. Rev. Neurosci. 1999. 22:261 94 Copyright c 1999 by Annual Reviews. All rights reserved THE SPECIFICATION OF DORSAL CELL FATES IN THE VERTEBRATE CENTRAL NERVOUS SYSTEM Kevin J. Lee and Thomas M. Jessell
Dynamic and Differential Regulation of Stem Cell Factor FoxD3 in the Neural Crest Is Encrypted in the Genome
 Dynamic and Differential Regulation of Stem Cell Factor FoxD3 in the Neural Crest Is Encrypted in the Genome Marcos S. Simões-Costa 1., Sonja J. McKeown 1., Joanne Tan-Cabugao 1, Tatjana Sauka-Spengler
PRACTICE EXAM. 20 pts: 1. With the aid of a diagram, indicate how initial dorsal-ventral polarity is created in fruit fly and frog embryos.
 PRACTICE EXAM 20 pts: 1. With the aid of a diagram, indicate how initial dorsal-ventral polarity is created in fruit fly and frog embryos. No Low [] Fly Embryo Embryo Non-neural Genes Neuroectoderm Genes
Questions in developmental biology. Differentiation Morphogenesis Growth/apoptosis Reproduction Evolution Environmental integration
 Questions in developmental biology Differentiation Morphogenesis Growth/apoptosis Reproduction Evolution Environmental integration Representative cell types of a vertebrate zygote => embryo => adult differentiation
Mesoderm Induction CBT, 2018 Hand-out CBT March 2018
 Mesoderm Induction CBT, 2018 Hand-out CBT March 2018 Introduction 3. Books This module is based on the following books: - 'Principles of Developement', Lewis Wolpert, et al., fifth edition, 2015 - 'Developmental
MBios 401/501: Lecture 14.2 Cell Differentiation I. Slide #1. Cell Differentiation
 MBios 401/501: Lecture 14.2 Cell Differentiation I Slide #1 Cell Differentiation Cell Differentiation I -Basic principles of differentiation (p1305-1320) -C-elegans (p1321-1327) Cell Differentiation II
Supplementary Figure 1: Mechanism of Lbx2 action on the Wnt/ -catenin signalling pathway. (a) The Wnt/ -catenin signalling pathway and its
 The Wnt/ -catenin signalling pathway and its") Supplementary Figure 1: Mechanism of Lbx2 action on the Wnt/ -catenin signalling pathway. (a) The Wnt/ -catenin signalling pathway and its transcriptional activity in wild-type embryo. A gradient of canonical
Supplementary Figure 1: Mechanism of Lbx2 action on the Wnt/ -catenin signalling pathway. (a) The Wnt/ -catenin signalling pathway and its transcriptional activity in wild-type embryo. A gradient of canonical
Biology 218, practise Exam 2, 2011
 Figure 3 The long-range effect of Sqt does not depend on the induction of the endogenous cyc or sqt genes. a, Design and predictions for the experiments shown in b-e. b-e, Single-cell injection of 4 pg
Bio 127 Section I Introduction to Developmental Biology. Cell Cell Communication in Development. Developmental Activities Coordinated in this Way
 Bio 127 Section I Introduction to Developmental Biology Cell Cell Communication in Development Gilbert 9e Chapter 3 It has to be EXTREMELY well coordinated for the single celled fertilized ovum to develop
Developmental processes Differential gene expression Introduction to determination The model organisms used to study developmental processes
 Date Title Topic(s) Learning Outcomes: Sept 28 Oct 3 1. What is developmental biology and why should we care? 2. What is so special about stem cells and gametes? Developmental processes Differential gene
Life Sciences For NET & SLET Exams Of UGC-CSIR. Section B and C. Volume-08. Contents A. BASIC CONCEPT OF DEVELOPMENT 1
 Section B and C Volume-08 Contents 5. DEVELOPMENTAL BIOLOGY A. BASIC CONCEPT OF DEVELOPMENT 1 B. GAMETOGENESIS, FERTILIZATION AND EARLY DEVELOPMENT 23 C. MORPHOGENESIS AND ORGANOGENESIS IN ANIMALS 91 0
Chapter 18 Lecture. Concepts of Genetics. Tenth Edition. Developmental Genetics
 Chapter 18 Lecture Concepts of Genetics Tenth Edition Developmental Genetics Chapter Contents 18.1 Differentiated States Develop from Coordinated Programs of Gene Expression 18.2 Evolutionary Conservation
Bi 117 Final (60 pts) DUE by 11:00 am on March 15, 2012 Box by Beckman Institute B9 or to a TA
 DUE by 11:00 am on March 15, 2012 Box by Beckman Institute B9 or to a TA") Bi 117 Final (60 pts) DUE by 11:00 am on March 15, 2012 Box by Beckman Institute B9 or to a TA Instructor: Marianne Bronner Exam Length: 6 hours plus one 30-minute break at your discretion. It should take
Bi 117 Final (60 pts) DUE by 11:00 am on March 15, 2012 Box by Beckman Institute B9 or to a TA Instructor: Marianne Bronner Exam Length: 6 hours plus one 30-minute break at your discretion. It should take
Neural crest development is regulated by the transcription factor Sox9
 Research article 5681 Neural crest development is regulated by the transcription factor Sox9 Martin Cheung and James Briscoe* Developmental Neurobiology, National Institute for Medical Research, Mill Hill,
SUPPLEMENTARY INFORMATION
 doi:10.1038/nature11589 Supplementary Figure 1 Ciona intestinalis and Petromyzon marinus neural crest expression domain comparison. Cartoon shows dorsal views of Ciona mid gastrula (left) and Petromyzon
UNIVERSITY OF YORK BIOLOGY. Developmental Biology
 Examination Candidate Number: UNIVERSITY OF YORK BSc Stage 2 Degree Examinations 2017-18 Department: BIOLOGY Title of Exam: Developmental Biology Desk Number: Time allowed: 1 hour and 30 minutes Total
Jawsfest: new perspectives on neural crest lineages and morphogenesis
 Jawsfest: new perspectives on neural crest lineages and morphogenesis Paul Trainor 1 and M. Angela Nieto 2, * 1 Stowers Institute for Medical Research, 1000 E. 50th Street, Kansas City, MO 64110, USA 2
The roles of RNA Polymerase I and III subunits Polr1a, Polr1c, and Polr1d in craniofacial development. Kristin Emily Noack Watt
 The roles of RNA Polymerase I and III subunits Polr1a, Polr1c, and Polr1d in craniofacial development BY 2016 Kristin Emily Noack Watt Submitted to the graduate degree program in Anatomy and Cell Biology
Name KEY. Biology Developmental Biology Winter Quarter Midterm 3 KEY
 Name KEY 100 Total Points Open Book Biology 411 - Developmental Biology Winter Quarter 2009 Midterm 3 KEY All of the 25 multi-choice questions are single-answer. Choose the best answer. (4 pts each) Place
Origin of mesenchymal stem cell
 Origin of mesenchymal stem cell Takumi Era Department of Cell Modulation, Institute of Molecular embryology and Genetics (IMEG) Kumamoto University Differentiation pathways of in vitro ES cell culture
Cell-Cell Communication in Development
 Biology 4361 - Developmental Biology Cell-Cell Communication in Development June 23, 2009 Concepts Cell-Cell Communication Cells develop in the context of their environment, including: - their immediate
INDUCTION OF THE NEURAL CREST: A MULTIGENE PROCESS
 INDUCTION OF THE NEURAL CREST: A MULTIGENE PROCESS Anne K. Knecht and Marianne Bronner-Fraser In the embryo, the neural crest is an important population of cells that gives rise to diverse derivatives,
Lecture 7. Development of the Fruit Fly Drosophila
 BIOLOGY 205/SECTION 7 DEVELOPMENT- LILJEGREN Lecture 7 Development of the Fruit Fly Drosophila 1. The fruit fly- a highly successful, specialized organism a. Quick life cycle includes three larval stages
THE PROBLEMS OF DEVELOPMENT. Cell differentiation. Cell determination
 We emphasize these points from Kandel in Bi/CNS 150 Bi/CNS/NB 150: Neuroscience Read Lecture Lecture Friday, October 2, 2015 Development 1: pp 5-10 Introduction Brains evolved All higher animals have brains
Neural development its all connected
 Neural development its all connected How do you build a complex nervous system? How do you build a complex nervous system? 1. Learn how tissue is instructed to become nervous system. Neural induction 2.
Developmental Biology Lecture Outlines
 Developmental Biology Lecture Outlines Lecture 01: Introduction Course content Developmental Biology Obsolete hypotheses Current theory Lecture 02: Gametogenesis Spermatozoa Spermatozoon function Spermatozoon
Developmental Zoology. Ectodermal derivatives (ZOO ) Developmental Stages. Developmental Stages
 Developmental Stages. Developmental Stages") Developmental Zoology (ZOO 228.1.0) Ectodermal derivatives 1 Developmental Stages Ø Early Development Fertilization Cleavage Gastrulation Neurulation Ø Later Development Organogenesis Larval molts Metamorphosis
Developmental Zoology (ZOO 228.1.0) Ectodermal derivatives 1 Developmental Stages Ø Early Development Fertilization Cleavage Gastrulation Neurulation Ø Later Development Organogenesis Larval molts Metamorphosis
Exam 1 ID#: October 4, 2007
 Biology 4361 Name: KEY Exam 1 ID#: October 4, 2007 Multiple choice (one point each) (1-25) 1. The process of cells forming tissues and organs is called a. morphogenesis. b. differentiation. c. allometry.
NIH Public Access Author Manuscript Histochem Cell Biol. Author manuscript; available in PMC 2013 August 01.
 NIH Public Access Author Manuscript Published in final edited form as: Histochem Cell Biol. 2012 August ; 138(2): 179 186. doi:10.1007/s00418-012-0999-z. Formation and migration of neural crest cells in
7.013 Problem Set
 7.013 Problem Set 5-2013 Question 1 During a summer hike you suddenly spot a huge grizzly bear. This emergency situation triggers a fight or flight response through a signaling pathway as shown below.
Paraxial and Intermediate Mesoderm
 Biology 4361 Paraxial and Intermediate Mesoderm December 6, 2007 Mesoderm Formation Chick Major Mesoderm Lineages Mesodermal subdivisions are specified along a mediolateral axis by increasing amounts of
Formation of the Cortex
 Formation of the Cortex Neuronal Birthdating with 3 H-thymidine 3H-thymidine is incorporated into the DNA during the S-phase (replication of DNA). It marks all mitotic cells Quantitative technique. (you
MOLECULAR CONTROL OF EMBRYONIC PATTERN FORMATION
 MOLECULAR CONTROL OF EMBRYONIC PATTERN FORMATION Drosophila is the best understood of all developmental systems, especially at the genetic level, and although it is an invertebrate it has had an enormous
NEURAL CREST SPECIFICATION: MIGRATING INTO GENOMICS
 NEURAL CREST SPECIFICATION: MIGRATING INTO GENOMICS Laura S. Gammill and Marianne Bronner-Fraser The bones in your face, the pigment in your skin and the neural circuitry that controls your digestive tract
In ovo time-lapse analysis after dorsal neural tube ablation shows rerouting of chick hindbrain neural crest
 In ovo time-lapse analysis after dorsal neural tube ablation shows rerouting of chick hindbrain neural crest Paul Kulesa, Marianne Bronner-Fraser and Scott Fraser (2000) Presented by Diandra Lucia Background
presumptiv e germ layers during Gastrulatio n and neurulation Somites
 Vertebrate embryos are similar at the phylotypic stage Patterning the Vertebrate Body Plan II: Mesoderm & Early Nervous System Wolpert L, Beddington R, Jessell T, Lawrence P, Meyerowitz E, Smith J. (2001)
10/15/09. Tetrapod Limb Development & Pattern Formation. Developing limb region is an example of a morphogenetic field
 Tetrapod Limb Development & Pattern Formation Figure 16.5(1) Limb Bud Formation derived from lateral plate (somatic) & paraxial (myotome) Fig. 16.2 Prospective Forelimb Field of Salamander Ambystoma maculatum
Why Flies? stages of embryogenesis. The Fly in History
 The Fly in History 1859 Darwin 1866 Mendel c. 1890 Driesch, Roux (experimental embryology) 1900 rediscovery of Mendel (birth of genetics) 1910 first mutant (white) (Morgan) 1913 first genetic map (Sturtevant
!!!!!!!! DB3230 Midterm 2 12/13/2013 Name:
 1. (10 pts) Draw or describe the fate map of a late blastula stage sea urchin embryo. Draw or describe the corresponding fate map of the pluteus stage larva. Describe the sequence of gastrulation events
Nature Neuroscience: doi: /nn.2662
 Supplementary Figure 1 Atlastin phylogeny and homology. (a) Maximum likelihood phylogenetic tree based on 18 Atlastin-1 sequences using the program Quicktree. Numbers at internal nodes correspond to bootstrap
Sonic hedgehog (Shh) signalling in the rabbit embryo
 signalling in the rabbit embryo") Sonic hedgehog (Shh) signalling in the rabbit embryo In the first part of this thesis work the physical properties of cilia-driven leftward flow were characterised in the rabbit embryo. Since its discovery
Sonic hedgehog (Shh) signalling in the rabbit embryo In the first part of this thesis work the physical properties of cilia-driven leftward flow were characterised in the rabbit embryo. Since its discovery
lockjaw encodes a zebrafish tfap2a required for early neural crest
 Research article 5755 lockjaw encodes a zebrafish tfap2a required for early neural crest development Robert D. Knight 1, Sreelaja Nair 1, Sarah S. Nelson 1, Ali Afshar 1, Yashar Javidan 1, Robert Geisler
Unicellular: Cells change function in response to a temporal plan, such as the cell cycle.
 Spatial organization is a key difference between unicellular organisms and metazoans Unicellular: Cells change function in response to a temporal plan, such as the cell cycle. Cells differentiate as a
Paraxial and Intermediate Mesoderm
 Biology 4361 Paraxial and Intermediate Mesoderm December 6, 2007 Mesoderm Formation Chick Major Mesoderm Lineages Mesodermal subdivisions are specified along a mediolateral axis by increasing amounts of
Unit 4 Evaluation Question 1:
 Name: Unit 4 Evaluation Question 1: /7 points A naturally occurring dominant mutant in mice is the Doublefoot (Dbf) mutant. Below is an image of the bones from a wildtype (wt) and Doublefoot mutant mouse.
Neural Crest Development and Craniofacial Morphogenesis Is Coordinated by Nitric Oxide and Histone Acetylation
 Article Neural Crest Development and Craniofacial Morphogenesis Is Coordinated by Nitric Oxide and Histone Acetylation Yawei Kong, 1,2,3 Michael Grimaldi, 1,2,3 Eugene Curtin, 1,2 Max Dougherty, 1,2 Charles
JCB Article. Lineage-specific requirements of -catenin in neural crest development
 JCB Article Lineage-specific requirements of -catenin in neural crest development Lisette Hari, 1 Véronique Brault, 2 Maurice Kléber, 1 Hye-Youn Lee, 1 Fabian Ille, 1 Rainer Leimeroth, 1 Christian Paratore,
Cell Migration I: Neural Crest Cell Migration. Steven McLoon Department of Neuroscience University of Minnesota
 Cell Migration I: Neural Crest Cell Migration Steven McLoon Department of Neuroscience University of Minnesota 1 Types of Cell Movement passive: active: cell sheets flow cilia or flagella ameboid adhesion
Regulation of gene Expression in Prokaryotes & Eukaryotes
 Regulation of gene Expression in Prokaryotes & Eukaryotes 1 The trp Operon Contains 5 genes coding for proteins (enzymes) required for the synthesis of the amino acid tryptophan. Also contains a promoter
Chapter 11. Development: Differentiation and Determination
 KAP Biology Dept Kenyon College Differential gene expression and development Mechanisms of cellular determination Induction Pattern formation Chapter 11. Development: Differentiation and Determination
Developmental Biology Biology Ectodermal Organs. November 22, 2005
 Developmental Biology Biology 4361 Ectodermal Organs November 22, 2005 Germinal neuroepithelium external limiting membrane neural tube neuroepithelium (stem cells) Figure 13.3 Figure 13.4 Neuroepithelial
Axis Specification in Drosophila
 Developmental Biology Biology 4361 Axis Specification in Drosophila November 2, 2006 Axis Specification in Drosophila Fertilization Superficial cleavage Gastrulation Drosophila body plan Oocyte formation
HHS Public Access Author manuscript Science. Author manuscript; available in PMC 2016 December 24.
 Reprogramming of avian neural crest axial identity and cell fate Marcos Simoes-Costa 1 and Marianne E. Bronner 1 1 Division of Biology and Biological Engineering, California Institute of Technology, Pasadena,
Neural crest stem cell maintenance by combinatorial Wnt and BMP signaling
 Published Online: 18 April, 2005 Supp Info: http://doi.org/10.1083/jcb.200411095 Downloaded from jcb.rupress.org on December 24, 2018 JCB: ARTICLE Neural crest stem cell maintenance by combinatorial Wnt
Exam 3 (Final Exam) December 20, 2007
 December 20, 2007") Biology 4361 Exam 3 (Final Exam) December 20, 2007 Name: ID: Multiple choice (1 point each. Indicate the best answer.) 1. During Drosophila gastrulation, mesoderm moves in through the a. primitives streak.
Biology 4361 Exam 3 (Final Exam) December 20, 2007 Name: ID: Multiple choice (1 point each. Indicate the best answer.) 1. During Drosophila gastrulation, mesoderm moves in through the a. primitives streak.
Maternal Control of GermLayer Formation in Xenopus
 Maternal Control of GermLayer Formation in Xenopus The zygotic genome is activated at the mid-blastula transition mid-blastula fertilized egg Xenopus gastrulae early-gastrula 7 hrs 10 hrs control not VP
BIS &003 Answers to Assigned Problems May 23, Week /18.6 How would you distinguish between an enhancer and a promoter?
 Week 9 Study Questions from the textbook: 6 th Edition: Chapter 19-19.6, 19.7, 19.15, 19.17 OR 7 th Edition: Chapter 18-18.6 18.7, 18.15, 18.17 19.6/18.6 How would you distinguish between an enhancer and
Sarah Bashiruddin Georgina Lopez Jillian Merica Sarah Wardlaw
 Sarah Bashiruddin Georgina Lopez Jillian Merica Sarah Wardlaw Introduction: Dr. Carol Erickson and her lab study the cellular and molecular mechanisms by which neural crest cells differentiate and migrate
Making Headway: The Roles of Hox Genes and Neural Crest Cells in Craniofacial Development
 Mini-Review TheScientificWorldJOURNAL (2003) 3, 240 264 ISSN 1537-744X; DOI 10.1100/tsw.2003.11 Making Headway: The Roles of Hox Genes and Neural Crest Cells in Craniofacial Development Paul A Trainor
A direct role for Sox10 in specification of neural crestderived
 RESEARCH ARTICLE 4619 Development 133, 4619-4630 (2006) doi:10.1242/dev.02668 A direct role for Sox10 in specification of neural crestderived sensory neurons Thomas J. Carney 1, Kirsten A. Dutton 1, Emma
Specification of neural crest cell formation and migration in mouse embryos
 Seminars in Cell & Developmental Biology 16 (2005) 683 693 Review Specification of neural crest cell formation and migration in mouse embryos Paul A. Trainor Stowers Institute for Medical Research, 1000
2/23/09. Regional differentiation of mesoderm. Morphological changes at early postgastrulation. Segments organize the body plan during embryogenesis
 Regional differentiation of mesoderm Axial Paraxial Intermediate Somatic Splanchnic Chick embryo Morphological changes at early postgastrulation stages Segments organize the body plan during embryogenesis
Tsukushi Modulates Xnr2, FGF and BMP Signaling: Regulation of Xenopus Germ Layer Formation
 Tsukushi Modulates Xnr2, FGF and BMP Signaling: Regulation of Xenopus Germ Layer Formation Samantha A. Morris 1 *, Alexandra D. Almeida 1, Hideaki Tanaka 2, Kunimasa Ohta 2, Shin-ichi Ohnuma 1 * 1 Department
The role of FGF2 in craniofacial skeletogenesis
 The role of FGF2 in craniofacial skeletogenesis P. Ferretti, S. Sarkar, R. Moore, A. Petiot, C. J. Chan and A. Copp Summary E vidence that the major craniosynostosis syndromes are caused by mutations in
Gene Duplication of the Zebrafish kit ligand and Partitioning of Melanocyte Development Functions to kit ligand a
 Gene Duplication of the Zebrafish kit ligand and Partitioning of Melanocyte Development Functions to kit ligand a Keith A. Hultman 1, Nathan Bahary 2, Leonard I. Zon 3,4, Stephen L. Johnson 1* 1 Department
Axis Specification in Drosophila
 Developmental Biology Biology 4361 Axis Specification in Drosophila November 6, 2007 Axis Specification in Drosophila Fertilization Superficial cleavage Gastrulation Drosophila body plan Oocyte formation
Introduction. Gene expression is the combined process of :
 1 To know and explain: Regulation of Bacterial Gene Expression Constitutive ( house keeping) vs. Controllable genes OPERON structure and its role in gene regulation Regulation of Eukaryotic Gene Expression
Neural crest induction by paraxial mesoderm in Xenopus embryos requires FGF signals
 Development 130, 3111-3124 2003 The Company of Biologists Ltd doi:10.1242/dev.00531 3111 Neural crest induction by paraxial mesoderm in Xenopus embryos requires FGF signals Anne-Hélène Monsoro-Burq*, Russell
Chapter 10 Development and Differentiation
 Part III Organization of Cell Populations Chapter Since ancient times, people have wondered how organisms are formed during the developmental process, and many researchers have worked tirelessly in search
Plant Molecular and Cellular Biology Lecture 10: Plant Cell Cycle Gary Peter
 Plant Molecular and Cellular Biology Lecture 10: Plant Cell Cycle Gary Peter 9/10/2008 1 Learning Objectives Explain similarities and differences between fungal, mammalian and plant cell cycles Explain
Developmental potential of trunk neural crest cells in the mouse
 Development 120, 1709-1718 (1994) Printed in Great Britain The Company of Biologists Limited 1994 1709 Developmental potential of trunk neural crest cells in the mouse George N. Serbedzija 1,, Marianne
Maternal VegT and b-catenin: Patterning the Xenopus Blastula
 CHAPTER 1 Maternal VegT and b-catenin: Patterning the Xenopus Blastula Matthew Kofron, Jennifer Xanthos, and Janet Heasman 1 1.1 Introduction Loss of the maternal T-box transcription factor VegT has a
16 CONTROL OF GENE EXPRESSION
 16 CONTROL OF GENE EXPRESSION Chapter Outline 16.1 REGULATION OF GENE EXPRESSION IN PROKARYOTES The operon is the unit of transcription in prokaryotes The lac operon for lactose metabolism is transcribed
b. The maximum binding will decrease.
 Cell Signaling Receptors are a. proteins that change conformation upon interaction with a stimulus b. genes that change expression in response to a stimulus c. phosphorylation cascades that control cellular
AP2-dependent signals from the ectoderm regulate craniofacial development in the zebrafish embryo
 Research article 3127 AP2-dependent signals from the ectoderm regulate craniofacial development in the zebrafish embryo Robert D. Knight, Yashar Javidan, Tailin Zhang, Sarah Nelson and Thomas F. Schilling*
craniofacial development and WNT signaling. Shachi Bhatt
 MED23: a Mediator subunit's role in global gene transcription, regulation of craniofacial development and WNT signaling. BY 2013 Shachi Bhatt Submitted to the graduate degree program in Anatomy and Cell
RNA Synthesis and Processing
 RNA Synthesis and Processing Introduction Regulation of gene expression allows cells to adapt to environmental changes and is responsible for the distinct activities of the differentiated cell types that
Chapter 2 Embryological Origins and the Identification of Neural Crest Cells
 Chapter 2 Embryological Origins and the Identification of Neural Crest Cells Neural Crest This chapter seeks to answer a twofold question: When and by what mechanisms do the neural crest (NC) and neural
Cell Death & Trophic Factors II. Steven McLoon Department of Neuroscience University of Minnesota
 Cell Death & Trophic Factors II Steven McLoon Department of Neuroscience University of Minnesota 1 Remember? Neurotrophins are cell survival factors that neurons get from their target cells! There is a
Exam 2 ID#: November 9, 2006
 Biology 4361 Name: KEY Exam 2 ID#: November 9, 2006 Multiple choice (one point each) Circle the best answer. 1. Inducers of Xenopus lens and optic vesicle include a. pharyngeal endoderm and anterior neural
Requirement for endoderm and FGF3 in ventral head skeleton formation
 Development 129, 4457-4468 (2002) Printed in Great Britain The Company of Biologists Limited 2002 DEV1810 4457 Requirement for endoderm and FGF3 in ventral head skeleton formation Nicolas B. David 1, Laure
Axis Specification in Drosophila
 Developmental Biology Biology 4361 Axis Specification in Drosophila July 9, 2008 Drosophila Development Overview Fertilization Cleavage Gastrulation Drosophila body plan Oocyte formation Genetic control