Hominin cranial base evolution and genes implicated in basioccipital. development:
|
|
|
- Darrell Benson
- 5 years ago
- Views:
Transcription
1 Hominin cranial base evolution and genes implicated in basioccipital development: Role of Pax7, Fgfr3 and Disp1 in basioccipital development and integration By Lisa Nevell B.A. 1997, Beloit College M.A. 2003, Northern Illinois University A Dissertation submitted to The Faculty of the Columbian College of Arts and Sciences of The George Washington University in partial satisfaction of the requirements for the degree of Doctor of Philosophy January 31, 2009 Dissertation directed by Bernard Wood University Professor of Human Origins
2 The Columbian College of Arts and Sciences of The George Washington University certifies that Lisa Nevell has passed the Final Examination for the degree of Doctor of Philosophy as of September 24, This is the final and approved form of the dissertation. Hominin cranial base evolution and genes implicated in basioccipital development: Role of Pax7, Fgfr3 and Disp1 in basioccipital development and integration Lisa Nevell Dissertation Research Committee: Bernard Wood, University Professor of Human Origins, Dissertation Director Robin M. Bernstein, Assistant Professor of Anthropology, Committee Member Brian G. Richmond, Associate Professor of Anthropology, Committee Member Charles Keller, Assistant Professor of Cellular and Structural Biology at The University of Texas Health Sciences Center at San Antonio Greehey Children's Cancer Research Institute, Committee Member ii
3 Acknowledgements The successful completion of this dissertation would not have been possible without the kind support of the entire dissertation committee. LN would like to express heartfelt appreciation to Bernard Wood, Robin Bernstein, Brian Richmond, Peter Lucas, Chet Sherwood, and Charles Keller. LN would also like to thank Alison Brooks and Fred Smith for their encouragement. LN was supported by a George Washington University Academic Excellence Graduate Fellowship, a George Washington University Graduate Teaching Assistantship, the Henry Luce Foundation, and NSF grant number The participation of BW in this project was supported by GW s Academic Excellence initiative, the GW VPAA, the GW University Professorship in Human Origins, and NSF grant number This research was generously supported by Keller Laboratory Startup Funds at The University of Texas Health Sciences Center at San Antonio Greehey Children's Cancer Research Institute. Correspondence point analysis was conducted in close collaboration with Josh Cates and Ross T. Whitaker at the University of Utah Scientific Computing Institute. LN would like to thank each of the members of the Keller Laboratory, the Center for the Advanced Study of Hominid Paleobiology, the Dmanisi research team, and colleagues from Northern Illinois University for many informative discussions that contributed to this dissertation. LN would also like to thank Derek Mayhew for assistance with illustrations, archiving data, and for being the model of a patient husband. iii
4 Abstract Cranial base morphology features in some hominin species diagnoses. One of the unsolved puzzles of the hominin cranial base is the evolutionary history of the apparent convergence seen in the cranial base morphology of two hominin subclades, Homo and Paranthropus. Both subclades apparently share the same suite of cranial base characters, namely, a reduction in anteroposterior length of the cranial base, more coronally-orientated long axes of the petrous component of the temporal bones of the cranial base, and a more centrally-located foramen magnum. Did the two subclades inherit this morphology from a recent common ancestor, or is the morphology homoplasic in the two subclades? This thesis had two main aims. The first was to provide a better comparative context for the study of hominin cranial base evolution; this forms Chapter 2 of the thesis. The second was to use animal models to investigate A) the extent to which the cranial base is affected by morphological integration, and B) whether three genes that have been implicated in one way, or another, in the development of the cranial base, affect its development in ways that are analogous to the differences between the cranial base of modern humans and our close living relatives, chimpanzees, bonobos and gorillas. Disruption of Disp1, Pax7, or FGFr3 each resulted in an increase on the length of the basioccipital bone in newborn mice. The basioccipital responded in a highly integrated fashion to various perturbations of normal growth. Morphological integration may facilitate apparent homoplasy in the hominin cranial base. iv
5 Table of Contents Acknowledgements Abstract Table of Contents List of Figures List of Tables iii iv v vi ix Chapter 1: Introduction 1 Chapter 2: Cranial base evolution within the hominin clade 6 Chapter 3: A genetically defined role of Pax7 in patterning the basioccipital bone in mice 44 Chapter 4: Basioccipital development and morphological integration 98 Chapter 5: Discussion and Conclusions 127 Bibliography 143 v
6 List of Figures Chapter 2: Figure 1: Cranial base morphology in Homo sapiens and Pan troglodytes 9 Figure 2: Proposed hominin phylogeny based on cranial and dental characters 15 Figure 3: Proposed hominin phylogeny based on marginally less parsimonious trees 17 Figure 4: Hominin cranial base morphological grades 40 Chapter 3: Figure 5: Morphology of the ventral neonatal mouse cranial base 45 Figure 6: Schematic representation of muscle development 50 Figure 7: Anatomical landmarks describing the shape of the basioccipital 54 Figure 8: Regression analysis statistical power and sample size 56 Figure 9: Pax7-deficient mice differ from the wildtype 63 Figure 10a: Pax7 lacz/lacz basioccipital bone is larger than Pax7 wt/wt 67 Figure 10b: Pax7 lacz/lacz basioccipital bone is longer than Pax7 wt/wt 68 Figure 11: Pax7-deficient mice differ from the wildtype with respect to basioccipital shape 70 Figure 12: Pax7-deficient phenotype cannot be attributed to the effects of size 72 Figure 13: Pax7 basioccipital morphology through post-natal development 76 Figure 14: Correspondence point models of Pax7 WT/WT and Pax7 LacZ/LacZ 78 vi
7 Figure 15: Principal components results of correspondence point analysis comparing Pax7 WT/WT and Pax7 LacZ/LacZ 80 Figure 16: Principal components results of correspondence point analysis comparing Pax7 WT/WT and Pax7 LacZ/WT 81 Figure 17: Correspondence point comparison of the Pax7 WT/WT and Pax7 LacZ/LacZ basioccipitals seen in superior view 83 Figure 18: Correspondence point comparison of the Pax7 WT/WT and Pax7 LacZ/LacZ basioccipitals in posterior view 84 Figure 19: Correspondence point comparison of the Pax7 WT/WT and Pax7 LacZ/LacZ basioccipitals in lateral view 85 Figure 20: Correspondence point comparison of Pax7 WT/WT and Pax7 LacZ/LacZ basioccipitals in oblique view 86 Figure 21: Correspondence point comparison of Pax7 WT/WT and Pax7 LacZ/WT basioccipitals in superior view 88 Figure 22: Correspondence point comparison of Pax7 WT/WT and Pax7 LacZ/WT basioccipitals in posterior view 89 Figure 23: Correspondence point comparison of Pax7 WT/WT and Pax7 LacZ/WT basioccipitals in lateral view 90 Figure 24: Correspondence point comparison of Pax7 WT/WT and Pax7 LacZ/WT basioccipitals in oblique view 91 Chapter 4: Figure 25: Cranial base morphology in Homo sapiens and Pan troglodytes 101 vii
8 Figure 26: Hominin grades and cranial base morphology 102 Figure 27: Hominin phylogeny based on cranial and dental characters 103 Figure 28: Hominin phylogeny based on cranial base characters 103 Figure 29: Anatomical landmarks describing the shape of the basioccipital 111 Figure 30: Pax7-deficient mice differ from the wildtype in size 116 Figure 31: Pax7-deficient mice differ from the wildtype in shape 117 Figure 32: Fgfr3-deficient mice differ from the wildtype 118 Figure 33: Disp1-deficient mice differ from the wildtype 119 Figure 34: Mantel Test results for significance of morphological integration 120 viii
9 List of Tables Chapter 2: Table 1: Specimens included in the hypodigms of early hominin species 11 Table 2: Eight synapomorphies differentiate Pan-Homo LCA from extant hominoids 31 Table 3: Predicted cranial base and cranial base-related morphology of the Pan-Homo LCA compared with the predominant character states seen in H. sapiens and P. troglodytes 32 Table 4: Comparison between the Pan-Homo LCA and a hypothetical stem hominin 37 Chapter 3: Table 5: Selected variables representing the basioccipital bone length width and height compared between Pax7 lacz/lacz and Pax7 wt/wt mice 65 Table 6: Pax7 lacz/lacz basioccipital bone is longer than Pax7 wt/wt 69 Table 7: A) Correlation between the overall size of the basioccipital and selected variables. B) Relationship between the overall size of the basioccipital and a ratio between parasagittal length and height 74 Chapter 4: Table 8: Length of the basioccipital in the midline among newborn mice 115 ix
10 Table 9: Morphological integration within effected regions 121 Table 10: Degree of similarity between covariance structures 122 x
11 Chapter 1: Introduction The word cranium comes from the Greek word kranion, which means brain case. The three major components of the cranium are A) the part that covers the top and sides of the brain, called the cranial vault (or the calotte), B) the part that covers the front of the brain, called the face, and C) the part beneath the brain, called the cranial base, or basicranium. Another way of dividing up the cranium recognizes two components, the neurocranium and the viscerocranium. The neurocranium is the combination of the calotte and the basicranium; the viscerocranium is equivalent to the face. The cranial base has an internal or endocranial surface, and an external surface. Its internal, or endocranial, surface is divided into three hollowed areas called cranial fossae, each of which is occupied by major components of the brain. The anterior cranial fossa lies beneath the frontal lobes of the cerebral cortex, the middle beneath the temporal lobes of the cerebral cortex, and the posterior beneath the cerebellum. The single un-paired bones that contribute to the cranial base are, from front to back, all or parts of the ethmoid, sphenoid and occipital bones. Only one paired bone, the temporal, contributes to the cranial base. The features of the external surface of the cranial base are those that can be seen when viewing the cranium from below; this view of the cranium is called the norma basilaris. 1
12 Most of the bones contributing to the cranial base develop via a process called endochondral ossification. In the second month of modern human intrauterine life hyaline cartilage appears beneath the developing brain. This hyaline cartilage is in the form of pairs of symmetrical elements. From posterior to anterior they are four pairs of occipital cartilages that give rise to the adult occipital bone except for the occipital squame, a pair of parachordal cartilages that lie either side of the anterior end of the notochord and which eventually contribute to the body of the sphenoid, a pair of otic cartilages that surround the inner ear and that later develop into the petrous component of the temporal bone, a pair of hypophyseal cartilages that surround the pituitary and eventually also contribute to the body of the sphenoid, two pairs of laterally-situated sphenoid cartilages, the orbitosphenoids that form the lesser wings of the sphenoid and the alisphenoids that form the greater wings of the sphenoid, two pairs of trabecular cartilages that contribute to the ethmoid and the nasal skeleton, and finally a pair of components that contribute to the presphenoid. All the cartilages anterior to, and including, the orbitosphenoids derive from neural crest cells, whereas the paired cartilaginous elements posterior to, and including, the hypophyseal cartilages derive primarily from mesoderm in the form of somites. Bone formation within the chondrocranium begins at its caudal (i.e., the posterior or inferior) end. Endochondral bone formation involves many ossification centers, 2
13 and results in most of the occipital bone, the petrous part of the temporal bone, and the sphenoid and ethmoid bones. Comparative studies of the cranial base in primates in general, and in higher primates in particular, have usually either considered its sagittal or parasagittal morphology. The former studies have focused on the lengths and angular relationships of the midline structures that form the floors of the anterior and the middle cranial fossae; relatively few have included the posterior cranial fossa. The studies that have considered the parasagittal morphology of the cranial base have tended to focus on the distances between landmarks (e.g., major nervous or vascular foramina), or on the distances between coronal planes defined by pairs of landmarks, or on the angles subtended to the midline by the long axes of structures like the petrous component of the temporal bone. Some parts of the cranial base such as the petrous component of the temporal bone are relatively well represented in the hominin fossil record because of their hardness and durability (N.B., L. petrous = rock-like; it has the same root as petroleum which means literally rock oil ), but well-preserved examples of the cranial base in the early hominin fossil record are relatively rare. Nonetheless, researchers have investigated what fossil evidence there is of the cranial base, and cranial base morphology features in some hominin species diagnoses. Most attention has been paid to the cranial base morphology that differs between modern humans and chimpanzees and bonobos. These include differences in the 3
14 anteroposterior length of the cranial base, in the angle subtended by the long axes of the floors of the anterior and middle cranial fossae (as captured by one or other versions of the external cranial base angle), in the morphology and angular relationships of the petrous component of the temporal bone, in the location of the foramen magnum, and in the orientation of the plane of the foramen magnum. One of the unsolved puzzles of the hominin cranial base is the evolutionary history of the apparent convergence seen in the cranial base morphology of two hominin subclades, Homo and Paranthropus. Both subclades apparently share the same suite of cranial base characters, namely, a reduction in anteroposterior length of the cranial base, more coronally-orientated long axes of the petrous component of the temporal bones of the cranial base, and a more centrally-located foramen magnum. Did the two subclades inherit this morphology from a recent common ancestor, or is the morphology homoplasic in the two subclades? This thesis had two main aims. The first was to provide a better comparative context for the study of hominin cranial base evolution; this forms Chapter 2 of the thesis. The second was to use animal models to investigate A) the extent to which the cranial base is affected by morphological integration, and B) whether three genes that have been implicated in one way, or another, in the development of the cranial base, affect its development in ways that are analogous to the differences between the cranial base of modern humans and our close living 4
15 relatives, chimpanzees, bonobos and gorillas. The studies related to these questions form Chapters 3 and 4 of the thesis. Chapter 5 summarizes the results and suggests ways in which these topics might be pursued in future research. 5
16 Chapter 2: Cranial base evolution within the hominin clade Abstract The base of the cranium (i.e., the basioccipital, the sphenoid and the temporal bones) is of particular interest because it undergoes significant morphological change within the hominin clade, and because basicranial morphology features in several hominin species diagnoses (Wood and Richmond, 2000). We use a parsimony analysis of published cranial and dental data (Strait and Grine, 2004) to predict the cranial base morphology expected in the hypothetical last common ancestor (LCA) of the Pan-Homo clade. We also predict the primitive condition of the cranial base for the hominin clade, and document the evolution of the cranial base within the major subclades within the hominin clade. This analysis suggests that cranial base morphology has continued to evolve in the hominin clade, both before and after the emergence of the genus Homo. This analysis indicates a number of homoplastic cranial base traits between two subclades; one of these subclades includes the genus Homo and the other subclade includes the genus Paranthropus. Both subclades apparently share the same suite of cranial base characters, namely, a reduction in anteroposterior length of the cranial base, more coronally-orientated long axes of the petrous component of the temporal bones, and a more centrally-located foramen magnum. 6
17 Introduction The base of the cranium (i.e., the basioccipital, the sphenoid and the temporal bones) undergoes significant morphological change within the hominin lineage, and basicranial distinctions feature in several hominin species diagnoses (Wood and Richmond, 2000). The cranial base is relatively well represented in the hominin fossil record. One of the reasons is that one of its components, the petrous part of the temporal bone, is apart from the teeth the densest part of the cranial skeleton. Paradoxically, it is better represented in the early part of the hominin fossil record than in parts of the Homo subclade. This is because the cranial base is damaged in many of the Homo erectus specimens recovered from the Indonesian sites on the island of Java. This damage is almost certainly anthropogenic and is linked with the extraction of the brain of the deceased. The cranial base is the only part of the skeleton where so many important functions (e.g., respiration, feeding and ingestion, posture, and balance) converge. This has led to the hypothesis that the cranial base must be a highly integrated structure, for modifications that might benefit one of these functions may well be detrimental to another (Lieberman et al. 2000). However, despite all these reasons to study it, compared with the face and the cranial vault the cranial base has been relatively neglected by paleoanthropologists. This has changed since imaging methods have enabled researchers to non-destructively access information about the structure of the 7
18 bony labyrinth, and from these data inferences can be made about the form of the membranous labyrinth. Researchers have shown that even in a group as small as the extant higher primates, quite modest differences in the relative size of the semicircular canals are linked with differences in habitual posture and locomotor mode. These findings, and the use of CT and more recently micro-ct to extract information about the bony labyrinth from intact petrous bones (reviewed by Spoor et al., 2000) has rekindled interest in the cranial base, but the form of the bony labyrinth will not be considered in this contribution. Studies of the external morphology of the cranial base can be divided into those that have concentrated on the midline (or sagittal) morphology and those that focus on the cranial base as a whole. Traditional (as opposed to threedimensional geometric morphometric) sagittal studies have mainly focused on the relative lengths and angular relationships of the components of the midline of the cranial base (Ross and Ravosa, 1993, Ross and Henneberg, 1995, Lieberman and McCarthy, 1999, Strait, 1999, McCarthy, 2001, Bookstein et al., 2003, Jeffery, 2005, Jeffery and Spoor, 2002, Jeffery and Spoor, 2004). Traditional studies of the cranial base as whole have concentrated on the gross morphology that can be seen not from the endocranial surface, but from below (this aspect of the cranium is known as the norma basilaris). These studies mostly used linear variables to compare the antero-posterior proportions of the parasagittal components of the cranial base, the distances between bilateral structures such as vascular or neural foramina to compare the relative widths of the components, and angular variables 8
19 to compare the orientation of the petrous bones and the tympanic components of the temporal bones (Dean and Wood, 1981, Dean and Wood, 1982, Dean and Wood, 1984, Lockwood et al., 2002, Bastir et al., 2004) (Figure 1). Figure 1: Cranial base morphology in Homo sapiens and Pan troglodytes Photo of the cranial base in norma basilaris (above) and in sagittal section (below). The cranial base is highlighted in sagittal section. Note the greater width of the sphenoid in H. sapiens. Sagittal section of Homo sapiens is adapted with permission from Bookstein et al. (2003), and the sagittal section of Pan troglodytes is adapted with permission from (2008). 9
20 We use a parsimony analysis of published cranial and dental data (Strait and Grine, 2004) to predict the cranial base morphology expected in the hypothetical last common ancestor (LCA) of the Pan-Homo clade. We also predict the primitive condition of the cranial base for the hominin clade and document the evolution of the cranial base within the major subclades within the hominin clade. Methods Fourteen fossil hominin taxa (Ardipithecus ramidus, Australopithecus anamensis, Kenyanthropus platyops, Australopithecus garhi, Sahelanthropus tchadensis, Australopithecus afarensis, Australopithecus africanus, Paranthropus aethiopicus, Paranthropus boisei, Paranthropus robustus, Homo habilis, Homo rudolfensis, Homo ergaster, and Homo sapiens) were included in these cladistic analyses (se also Table 1). We excluded three taxa (Ardipithecus kadabba, Orrorin tugenensis, Australopithecus bahrelghazali) from detailed consideration because there is no, or very limited, cranial base data available for these taxa. The extant hominoid samples include Homo sapiens, Pan troglodytes, Gorilla gorilla, Pongo pygmaeus and a mixed sample of Hylobates lar and Hylobates hoolock. Two more distant outgroups, Colobus guereza and a mixed sample of Papio anubis and Papio ursinus, were included in the study in order to determine character state polarity. 10
21 Table 1: Specimens included in the hypodigms of early hominin species Sahelanthropus tchadensis: TM Ardipithecus ramidus: ARA-VP 6/1, 1/128, 1/500 KNM-TH KNM-LT 329 Australopithecus anamensis: KNM-KP 29181, 29283, Australopithecus afarensis: A.L , 58-22, , , , 188-1, 198-1, 199-1, 200-1, , 266-1, 277-1, 288-1, 311-1, 333-1, 333-2, , , 333w-1, 333w-12, 333w-60, 400-1a, 417-1, Garusi 1 KNM-ER 2602 LH 4 MAK-VP 1/12 Australopithecus garhi: BOU-VP 12/130 Australopithecus africanus: MLD 1, 2, 6, 9, 12, 22, 29, 34, 37/38, 40, 45 Sts 5, 7, 17, 20, 26, 36, 52a and b, 67, 71 Stw 13, 73, 252, 384, 404, 498, 505, 513 Taung 1 TM 1511, 1512 Kenyanthropus platyops: KNM-WT 38350, Paranthropus aethiopicus: KNM-WT 16005, L 55s-33, 338y-6, Omo , , Paranthropus robustus: DNH 7 SK 6, 12, 13/14, 23, 34, 46, 47, 48, 49, 52, 55, 65, 79, 83, 848, 1586 SKW 5, 8, 11, 29, 2581, SKX 265, 4446, 5013 TM 1517 Paranthropus boisei: OH 5 KGA , KNM-CH 1 KNM-ER 403, 404, 405, 406, 407, 725, 727, 728, 729, 732, 733, 801, 805, 810, 818, 1468, 1469, 1483, 1803, 1806, 3229, 3230, 3729, 3954, 5429, 5877, 13750, 15930, KNM-WT 16841, L 7a-125, 74a-21 Natron Omo Homo habilis: A.L L OH 7, 13, 24, 62 KNM-ER 1478, 1501, 1502, 1805, 1813, 3735 SK 15, 27, 45, 847 Sts 19 Stw 53 Homo rudolfensis: KNM-ER 819, 1470, 1482, 1483, 1590, 1801, 1802, 3732, 3891 UR 501 Homo ergaster: KNM-ER 730, 820, 992, 1507, 3733, 3883 KNM-WT
22 Cercopithecoid phylogeny is beyond the scope of this paper. Details of all these samples are previously published (Strait and Grine, 2004). A relatively recent comprehensive cladistic analysis of fossil hominins (Strait and Grine, 2004) used metric and non-metric characters taken from the following sources (Delson and Andrews, 1975, Wood, 1975, Schwartz, 1984, Andrews and Martin, 1987, Chamberlain and Wood, 1987, Groves and Eaglen, 1988, Braga, 1995, Strait et al., 1997, Shoshani et al., 1996, Collard and Wood, 2000). The character matrix is made up of 198 characters, of which 89 are metric. Like Strait and Grine (2004) we excluded 40 characters because missing data meant that shape indices could not be calculated for many of the fossil hominin specimens, and like Strait and Grine (2004) we excluded redundant characters (i.e., characters that are components of more inclusive characters, or measurements that are included within another more inclusive measurement) from the published literature for such characters violate the assumption of character independence and can obscure true relationships (Farris, 1983, Kluge, 1989). Qualitative character states were assigned as absent, variable, or present (Strait and Grine, 2004). Traditional quantitative character states are determined by a range-based method where taxa are assigned different states when ranges are discontinuous or exhibited minimal overlap (Almeida and Bisby, 1984). Craniometric character states are determined using homogeneous subset coding (HSC). In HSC taxa may share the same state when they meet two criteria: first, two taxa share a state when they are not significantly different from one another; 12
23 second, two taxa share a state when they differ significantly from a common set of taxa (Simon, 1983, Rae, 1997). This paper departs from Strait and Grine (2004) with respect to character weighting. Character independence is a fundamental assumption of cladistic analysis (Farris, 1983, Kluge, 1989), however characters that share some aspect of function or development are likely to covary in a non-independent fashion ( Olson and Miller, 1958, Cheverud, 1982, Zelditch, 1987, Zelditch, 1988, Cheverud, 1995, Cheverud, 1996, Chernoff and Magwene, 1999, Ackermann and Cheverud, 2000, Strait, 2001). Strait and Grine (2004) identified hypothesized character complexes and reduced the weight of characters within these complexes in order to more closely approximate character independence. The authors assigned all of the characters in each hypothesized complex equal to the weight of one independent character and assigned equal weights to each character within that complex. Testing the validity of the hypothesized character complexes is beyond the scope of the present paper. In the absence of an empirically tested hypothesis of non-independence, equal weighting of all characters is a more conservative approach (Eldredge and Cracraft, 1980, Wheeler, 1986). In this study we give equal weight to all of the characters. Cladistic analysis was performed using the maximum parsimony and bootstrap search option of Winclada (Nixon, 1999) and NONA 2.0 (Goloboff, 2007). In a bootstrap analysis a data set is resampled with replacement and each resulting new data set is subjected to parsimony analysis (Felsenstein, 1985, 2004). Characters were treated as unordered, the distant outgroups were not 13
24 constrained to be monophyletic and the trees were unrooted. In all analyses, 10,000 replicates are performed. We report the most parsimonious trees, and in a separate analysis we report an analysis that includes trees that are marginally less parsimonious (i.e., trees that are within 1% of the shortest tree length). A majority rules consensus cladogram of the most parsimonious trees is reported, the percentage of trees supporting a given branch in the consensus cladogram are reported at each node. This consensus tree cladogram is the phylogenetic hypothesis used in the subsequent character analysis. Note that the tree topology is determined by characters from the whole cranium, but the character analysis is confined to characters that are based on cranial base morphology. Results A 10,000 replicate bootstrap analysis resulted in 112 most parsimonious trees out of possible trees. [Tree Length (TL) =1007; Consistency Index (CI) = 0.71; Retention Index (RI) = 0.55]. A majority-rule consensus of the most parsimonious trees is shown in Figure 2; the percentage of trees supporting a particular node is reported on each branch. A majority rules consensus diagram of marginally less parsimonious trees is reported in Figure 3 [Tree Length (TL) = 1059, Consistency Index CI = 0.68 and Retention Index RI = 0.47]. The tree topology resulting from the most parsimonious trees is discussed in further detail below and resembles the topology resulting from marginally less parsimonious trees. 14
25 Figure 2: Majority-rule consensus based on the most parsimonious trees from a 10,000 bootstrapped replicate analysis A 10,000 replicate bootstrap analysis resulted in 112 most parsimonious trees out of possible trees. [Tree Length (TL) =1007; Consistency Index (CI) = 0.71; Retention Index (RI) = 0.55]. A majority-rule consensus of the most parsimonious trees is shown with the percentage of trees supporting a particular node reported on each branch. In the consensus tree generated from the most parsimonious trees (Figure 2), there is support for the hypothesis that hominins form a clade to the exclusion of other hominoids (82%), and Pan troglodytes shares a sister taxa relationship with hominins in the majority of our most parsimonious tree topologies (77%). The results of this analysis are consistent with many of the most widely used taxonomic schemes for the Pan-Homo clade. For example, all of our tree topologies placed H. sapiens and H. ergaster as sister taxa, H. habilis as the sister 15
26 taxon to that subclade, and there is strong support for the genus Homo being a monophyletic group, or subclade. There is even stronger support for the genus Paranthropus forming a monophyletic group, for 100% of the most parsimonious trees generated by the present analysis support this interpretation. Within the hominin clade, a substantial majority of the most parsimonious trees (91%) support a (Au. garhi, Paranthropus) and a (Homo, Au. africanus, K. platyops) grouping. Likewise, a substantial majority of our tree topologies (91%) also support Au. afarensis as the sister taxon to a ((Au. garhi, Paranthropus) (Homo, Au. africanus, K. platyops)) grouping. A majority of our tree topologies (82%) also suggest that S. tchadensis is the sister taxon of a clade comprising all other hominin taxa. In addition 79% of our tree topologies suggest that K. platyops is the sister clade of a (Homo, Au. africanus) grouping and 76% of the tree topologies support Au. africanus as the sister taxon to the Homo clade. In contrast the phylogenetic relationships of Au. anamensis and Au. afarensis are more variable in our most parsimonious tree topologies. The results of this analysis are consistent with widely accepted hypotheses of the phylogenetic relationships within the hominin clade (reviewed in Kimbel et al. 2004). A majority rules consensus diagram of marginally less parsimonious trees is reported in Figure 3. The analysis reported in Figure two resulted in trees within 1% of the most parsimonious tree (TL < 1107). The consensus topology of marginally less parsimonious trees has a TL= 1059, CI = 0.68, and RI =
27 Figure 3: Majority-rule consensus of marginally less parsimonious trees A majority rules consensus diagram of marginally less parsimonious trees is reported above. The analysis reported in Figure 1 resulted in10086 trees within 1% of the most parsimonious tree (TL < 1107). [The consensus topology has a TL= 1059, CI = 0.68, and RI = 0.47.] Character Analysis 17
28 In addition to characters involved in the cranial base as seen in norma basilaris we also include discussions of characters that relate to the non-cranial base parts of the parietal bones and the occipital (i.e., the squamous parts of the two parietal bones and the squamous part, or upper scale, of the occipital). Temporal Bone Petrous The primitive hominoid condition is to have a sagittally-orientated long axis of the petrous bone, and this is the probable condition of the Pan-Homo LCA and the stem panin. The long axis of the petrous bone of S. tchadensis is relatively sagittal, the orientation of the long axis of the petrous of Au. afarensis and Au. africanus is intermediate, and P. aethiopicus, P. robustus, P. boisei, H. habilis, H. rudolfensis, H. ergaster, and H. sapiens all possess more coronallyorientated petrous bones. Data are not available for Ar. ramidus, Au anamensis, Au. garhi, or K. platyops. There is an obvious morphocline towards a coronallyorientated petrous long axis in the genus Homo and in Paranthropus, but it seems that coronally-orientated petrous bones arose independently within the Paranthropus and Homo subclades. The primitive condition among hominoids is for the apex of the petrous bone to be ossified anterior to the sphenoccipital synchondrosis. The Pan-Homo LCA, the stem panin, and the stem hominin most likely had the primitive condition of an ossified petrous apex. The first appearance of an un-ossified petrous apex occurs in H. sapiens. P. aethiopicus, P. boisei, Au. africanus, and H. 18
29 habilis show the primitive condition of ossification anterior to the sphenoccipital synchondrosis. Data are not available with respect to this character for H. ergaster, P. robustus, H. rudolfensis, S. tchadensis, Au. afarensis, Ar. ramidus, Au anamensis, Au. garhi, and K. platyops. Mastoid and TMJ A large and anteriorly-placed postglenoid process is the primitive condition for hominoids, and the primitive condition is expected to be shared by the Pan-Homo LCA, the stem panin and the stem hominin. A trend towards a reduction in the size of the postglenoid process and increasing frequency of fusion between the tympanic bone and petrous bone is shared by the Paranthropus- Kenyanthropus-Australopithecus-Homo subclade, but according to the proposed topology this trend is followed independently within Paranthropus and Homo. Both S. tchadensis and Au. afarensis share the primitive condition and data are not available for Ar. ramidus, Au. anamensis, Au. garhi, K. platyops. A small or absent vaginal process is primitive among hominoids and this state is also likely to be shared by the Pan-Homo LCA, the stem panin and the stem hominin. A trend towards a more substantial vaginal process is seen independently in early Homo and Paranthropus. The first appearance of a substantial bony vaginal process occurs as a synapomorphy in the (H. ergaster, H. sapiens) subclade. None of the proposed stem hominins, plus Au. afarensis, share the derived state of a larger vaginal process. Note, however, that information 19
30 about the size of the vaginal process is not available for S. tchadensis, Ar. ramidus, Au. anamensis, Au. garhi, or K. platyops. A broad and shallow attachment of the posterior digastric muscle is the primitive condition for hominoids, the Pan-Homo LCA, the stem panin and the stem hominin. Missing data and homoplasy obscure the earliest appearance of the modern human character state. Au. afarensis has the primitive state, and Ar. ramidus has a deeper origin; no data are not available for S. tchadensis, Au. anamensis, Au. garhi, or K. platyops. A deeper origin of the posterior digastric is seen in P. robustus (but not in the other taxa within the Paranthropus subclade), and a deeper origin of the posterior digastric is seen in the Homo subclade. Apparently three independent acquisition or reversal events occurred within the hominin clade. A wide supraglenoid gutter width is the primitive condition among hominoids, and it is likely to have been shared by the Pan-Homo LCA, and the stem panin. The stem hominin condition is ambiguous with respect to supraglenoid gutter width. There is limited information on the character for the earliest members of the hominin clade, for data are not available for S. tchadensis, Ar. ramidus, Au. anamensis, Au. garhi, or K. platyops. Au. afarensis has a modern human-like narrow supraglenoid gutter and the Paranthropus clade has the primitive condition of a wide supraglenoid gutter. The primitive condition for hominoids is to lack lateral inflation of the mastoid process relative to the supramastoid crest. The Pan-Homo LCA, the stem panin, and the stem hominin are expected to have expressed the primitive 20
31 condition. Au. afarensis has the primitive condition; data are not available for S. tchadensis, Ar. ramidus, Au. anamensis, Au. garhi, or K. platyops. Lateral inflation of the mastoid relative to the supramastoid crest is shared by each taxon within Paranthropus. Homo sapiens, H. ergaster, and H. rudolfensis share the primitive condition. The variable presence of this character state in H. habilis raises the possibility that this trait might have arisen before Paranthropus diverged, in which case the trait was lost within Homo. However, there is strong support for Au. africanus as the sister taxon to Homo and this taxon expresses the primitive character state. Consequently, an independent acquisition of the trait in H. habilis is a more parsimonious hypothesis. The lateral inflation of the mastoid process relative to the supramastoid crest may be a synapomorphy of Paranthropus. Tympanic A tubular tympanic bone (or a weak tympanic crest) is the primitive state among hominoids, and it is inferred to be the condition in the Pan-Homo LCA, and in the stem panin. The primitive condition is seen in S. tchadensis, Ar. ramidus, Au. anamensis, Au. afarensis, and K. platyops; data are not available for Au. garhi. Consequently, the stem hominin was likely to have expressed the primitive condition. The modern human-like condition of a tympanic crest with a vertical tympanic plate is seen in P. aethiopicus, P. robustus, Au. africanus, H. habilis, H. ergaster. Note that P. boisei has an autapomorphic tympanic crest with an inclined plane. If the proposed topology is correct, at least one homoplastic 21
32 event occurred within the hominin lineage. In one scenario, Kenyanthropus evolved the primitive condition of a tubular tympanic, alternatively Paranthropus and (Au. africanus, Homo) may have independently developed a tympanic crest with a vertical plate. The mediolateral placement of the external auditory meatus (EAM) expresses a complex phylogenetic distribution. A medial placement of the EAM is observed in Au. anamensis, Au. afarensis, K. platyops, P. aethiopicus, Au. africanus, H. rudolfensis, H. ergaster, and H. sapiens. A lateral position of the EAM is shared by Ar. ramidus, P. robustus, and P. boisei. H. habilis has a variable placement of the EAM. No data are available for S. tchadensis or A. garhi. A medial external auditory meatus is present in Pan, Pongo, and Hylobates, while a lateral position is present in Gorilla, and Papio. Consequently, the outgroup taxa provide modest support for the hypothesis that the primitive condition among hominoids is a medial position of the EAM. The stem panin was likely to have retained a medial EAM. The character state of the stem hominin is ambiguous due to extensive homoplasy; according to the proposed topology at least three independent acquisitions of a more lateral external auditory meatus have occurred within Homo, Paranthropus and Ardipithecus. A small external auditory meatus is the primitive state among hominoids, and is shared by the Pan-Homo LCA, the stem panin, and the stem hominin. A large EAM is shared by many hominins including: Au. afarensis, Au. africanus, 22
33 Paranthropus, and Homo. Note that Ar. ramidus, Au. anamensis, K. platyops have the primitive state; data are not available for S. tchadensis or Au. garhi. A prominent eustachian process of the tympanic is the primitive condition among hominoids; the Pan-Homo LCA and the stem panin retain the primitive condition. A prominent eustachian process is shared by S. tchadensis, Au. africanus, and P. robustus. The eustachian process is absent or slight in Au. afarensis, P. aethiopicus, P. boisei, H. habilis, H. ergaster, and H. sapiens. Data are not available for Ar. ramidus, Au. anamensis, Au. garhi, K. platyops, and H. rudolfensis. These data predict that the stem hominin shared the primitive condition of a prominent eustachian process. Note, however, that this conclusion is supported by just one character state change, the morphologies of a number of taxa remain unknown, and that this trait is characterized by high a level of homoplasy. There is homoplasy in Paranthropus; neither P. aethiopicus nor P. boisei have a marked eustachian process, but P. robustus does. The first appearance of the modern human pattern cannot be determined without additional fossil material, and different types of character optimizations result in equally parsimonious trees. A fast character optimization suggests that the reduced eustachian morphology seen in modern humans can be traced as far back as Au. afarensis. However, a slow character optimization suggests that the evolution of a reduced eustachian morphology occurred later, within the genus Homo. Squamous temporal bone 23
34 The presence of an asterionic notch in the squamosal portion of the temporal bone is a hominoid synapomorphy. The Pan-Homo LCA, the stem panin, and the stem hominin are each predicted to have had the primitive condition of an asterionic notch. As do Au. afarensis, and P. aethiopicus. Hominin taxa lacking an asterionic notch include P. robustus, P. boisei, Au. africanus, and Homo. Data are not available for S. tchadensis, Ar. ramidus, Au. anamensis, K. platyops, and Au. garhi. Several evolutionary scenarios are consistent with these data. The presence of an asterionic notch may represent an autapomorphic character within P. aethiopicus, in which case the absence of the notch among the more derived Paranthropus taxa could represent a primitive retention. Alternatively, the absence of an asterionic notch may have evolved in parallel in the (P. robustus, P. boisei) and (Au. africanus, Homo) clades. The absence of overlap between the parietal bone and the occipital bone at asterion is the primitive condition among hominoids. The Pan-Homo LCA, the stem panin, the stem hominin and Au. afarensis, Au. africanus, P. robustus, and Homo share the primitive condition. Both P. aethiopicus, and P. boisei have an overlap at asterion. Data are not available for S. tchadensis, Ar. ramidus, Au. anamensis, Au. garhi, or K. platyops. Given the strength of the general support for a (P. aethiopicus, P. boisei, P. robustus) clade at least two character state changes within the hominin clade are required to account for the observations about the parieto-occipital relationships at asterion. The primitive condition among hominoids is to lack extensive parietal overlap at the parietosquamosal suture. We predict that the Pan-Homo LCA, the 24
35 stem panin, and the stem hominin had the primitive condition. Australopithecus afarensis, Au. africanus, and Homo share the primitive condition, whereas P. aethiopicus, P. boisei and P. robustus express the derived condition of extensive overlap. Data are not available for S. tchadensis, Ar. ramidus, Au. anamensis, Au. garhi, or K. platyops. Modern humans express the primitive condition and extensive overlap appears to be a Paranthropus synapomorphy. The primitive condition among hominoids is to have extensive pneumatization of the temporal squama. The Pan-Homo LCA, the stem panin, and the stem hominin are predicted have shared the primitive condition. Sahelanthropus tchadensis, Ar. ramidus, Au. anamensis, Au. afarensis, P. aethiopicus, and Au. africanus each have the primitive condition. A reduction in the degree of pneumatization of the temporal squama is observed among P. robustus and Homo; P. boisei shows a variable degree of pneumatization. Data are not available for Au. garhi or K. platyops. Apparently there were two independent morphoclines of reduction in the degree of pneumatization of the temporal squama, on in Paranthropus, the other within Homo. External cranial base flexion External cranial base flexion is reduced among hominoids and we predict that this condition was shared by the Pan-Homo LCA and the stem panin. The morphology of the stem hominin with respect to external cranial base flexion remains ambiguous. A flat external cranial base angle is present in P. aethiopicus. A moderate degree of flexion is present in Au. africanus. A flexed 25
36 external cranial base angle is seen in P. robustus, P. boisei, H. habilis, H. ergaster and H. sapiens. Data are not available for S. tchadensis, Au. afarensis, Ar. ramidus, Au. anamensis, Au. garhi, K. platyops, or H. rudolfensis. Based on the proposed reference tree topology, a flexed external cranial base angle appears to have developed independently within Paranthropus and the (Australopithecus, Homo) clade. Occipital bone The foramen magnum is posteriorly-situated among hominoids, and that is inferred to be the condition for the Pan-Homo LCA and the stem panin. The anterior margin of the foramen magnum is located at the bi-tympanic line in S. tchadensis, Ar. ramidus, P. aethiopicus, Au. africanus, H. ergaster, H. erectus, and H. sapiens. In H. habilis the anterior margin of the foramen magnum is located at the bi-tympanic line, or anterior to it, in Au. afarensis P. robustus and P. boisei it is placed well in advance of the bi-tympanic line. Data are not available for Au. anamensis, Au. garhi, K. platyops, or H. rudolfensis. The modern human condition, where the anterior margin of the foramen magnum is at the bi-tympanic line can be traced back possibly to S. tchadensis and Ar. ramidus. The placement of the foramen magnum in a hypothetical stem hominin remains ambiguous; a posterior placement, or placement at the bi-tympanic line are equally parsimonious hypotheses. A posteriorly-inclined foramen magnum is a state that is shared among hominoids, the Pan-Homo LCA, the stem panin, and Au. africanus. A more 26
37 horizontally-orientated foramen magnum is seen in P. robustus, P. boisei, H. habilis, and H. sapiens. In H. ergaster the foramen magnum is inclined anteriorly; no data are available for S. tchadensis, Ar. ramidus, Au. anamensis, Au. garhi, K. platyops, Au. afarensis, P. aethiopicus, or H. rudolfensis. Two evolutionary scenarios are consistent with these data. In the first scenario, modern humans trace their horizontal foramen magnum back at least as far as the common ancestor of Paranthropus and Homo, in which case the primitive condition observed in Au. africanus would be an autapomorphic reversal. In a second scenario, the horizontal foramen magnum orientation evolved independently within Paranthropus and Homo. Additional fossil evidence is required in order to predict the morphology of the stem hominin, but on the current evidence, a posteriorly-inclined and a horizontal foramen magnum are equally parsimonious. An ovoid rather than a heart-shaped foramen magnum is the predicted character state for the Pan-Homo LCA, the stem panin and the stem hominin. Hominin taxa lacking a heart-shaped foramen magnum include, S. tchadensis, K. platyops, Au. afarensis, Au. africanus, P. robustus, H. habilis, and H. sapiens. Paranthropus aethiopicus and P. boisei both have a heart-shaped foramen magnum, and it is also seen in some H. ergaster cranial bases. Data are not available for Ar. ramidus, Au. anamensis, Au. garhi, or H. rudolfensis. Modern humans probably inherited their ovoid foramen magnum from the last common ancestor shared with hominoids. Note however that the sister taxon to the later Homo clade, H. ergaster, has a variable expression of the foramen magnum 27
38 outline. Within the hominin clade a heart-shaped foramen magnum is only seen in the Paranthropus subclade, and even then there was an apparent reversal of this feature in P. robustus. The primitive condition among hominoids is to have a steep and posteriorly-inclined nuchal plane and we infer this to be the morphology shared by the Pan-Homo LCA and the stem panin. A steep and posteriorly-inclined nuchal plane is also seen in Au. africanus. A more horizontal nuchal plane is seen in P. robustus, P. boisei, H. habilis, and H. sapiens; the only early hominin taxon to have a mildly anteriorly-inclined nuchal plane is H. ergaster. Data about the inclination of the nuchal plane are not available for S. tchadensis, Ar. ramidus, Au. anamensis, Au. garhi, K. platyops, Au. afarensis, P. aethiopicus, or H. rudolfensis. Two equally parsimonious scenarios are consistent with these data. In one scenario, Au. africanus inherits the primitive condition of a steep and posteriorly-inclined nuchal plane from hominoids, with a horizontal orientation evolving independently within both the Paranthropus and Homo clades. In this scenario the stem hominin would have a steep and posteriorly-inclined nuchal plane. In the alternative scenario, a horizontally-oriented nuchal plane arose in the hypothetical common ancestor of Paranthropus and Homo, and then Au. africanus subsequently reverted its character state back to a steep and posteriorlyinclined nuchal plane. In this scenario, a horizontal or a steep and posteriorlyinclined nuchal plane are equally parsimonious character states for the stem hominin. 28
39 A large longus capitus insertion is the primitive state for hominoids, is inferred to be the condition in the Pan-Homo LCA and the stem panin, and it is seen in Au. africanus. A smaller longus capitus insertion is seen in P. aethiopicus, P. robustus, P. boisei, H. habilis, H. ergaster, and H. sapiens; data are not available for S. tchadensis, Ar. ramidus, Au. anamensis, Au. afarensis, Au. garhi, and K. platyops. The character state distribution of the size of the longus capitus insertion matches that of nuchal plane orientation. Two scenarios are consistent with these data. In one scenario, modern humans inherit a small longus capitus insertion from the LCA of Paranthropus and Homo, and the large insertion area seen in Au. africanus is an autapomorphic feature. According to this scenario, the stem hominin could have had either a primitive (or large) longus capitus insertion, or the derived (or small) condition. In an alternative scenario, a small insertion of longus capitus might have arisen in parallel in the Paranthropus and early Homo clades. In this scenario a large (or primitive) insertion of longus capitus is predicted for the stem hominin. An occipital marginal (OM) sinus is relatively rare in hominoids, and we predict that the Pan-Homo LCA and the stem panin shared this inferred primitive condition. Hominin taxa with a low OM sinus frequency include K. platyops, P. aethiopicus, H. habilis, and H. rudolfensis. An intermediate frequency is seen in Au. africanus and H. sapiens. The OM sinus occurs in a higher frequency in Au. afarensis, P. robustus, and P. boisei; data are not available for S. tchadensis, Ar. ramidus, Au. anamensis, Au. garhi, or H. ergaster. These observations suggest that the evolution of the endocranial venous sinus system in the posterior cranial 29
40 fossa is complex. In the most parsimonious scenario an increase in the frequency of an OM sinus evolved on four separate occasions and we predict that the stem hominin had a low frequency of an OM sinus pattern. Male hominoids have a well-developed compound temporonuchal crest, and we predict this would have been the case in the Pan-Homo LCA, the stem panin, and in the stem hominin. This feature is seen in the presumed male specimens of S. tchadensis, Au. afarensis, P. aethiopicus, and K. platyops, and in some, but not all, of the probable male fossils attributed to P. boisei and H. habilis. This morphology is not seen in Au. africanus, H. rudolfensis, H. ergaster, and H. sapiens. Data are not available for Ar. ramidus, Au. anamensis Au. garhi, or P. robustus. There is a morphocline towards reducing the size and the frequency of the compound temporonuchal crest in the more recent part of the hominin clade. Diagnostic Characters The results of comparing the observed and inferred distributions of the characters reviewed above in extant hominoids and in the LCA of the Pan-Homo clade are reported in Table 2. This analysis results in the hypothesis that the Pan- Homo LCA had eight cranial base synapomorphies. Several character states are ambiguous at the Pan-Homo-LCA node; the position of the articular eminence above the occlusal plane may stay high or be reduced, the distance between the mandibular fossae may be reduced, and the distance between the mastoid processes may increase or may preserve the primitive condition for hominoids. 30
41 We suggest that the stem hominin would have differed from the Pan-Homo LCA in the following ways: - a shorter posterior skull length, a narrower supraglenoid gutter, greater bi-jugular foramen and bi-carotid widths, and an increase in the distance between the apices of the right and left temporal bones. Additional character states whose expression might change at the Pan-Homo-LCA node include the position of the articular eminence above the occlusal plane (it may stay high, or be reduced), the distance between the mandibular fossae (it may be reduced), and the distance between the mastoid processes (it may increase). In Table 3 we compare the morphology of the cranial base seen in norma basilaris of the LCA of the Pan-Homo clade with the equivalent morphology of modern humans and chimpanzees. Traits reported in bold indicate a character state difference between that taxon and the LCA of the Pan-Homo clade. Finally, we identify character state changes that might distinguish the LCA of the Pan-Homo clade from a stem hominin (Table 4). In this analysis there is one unambiguous character state change and as many as 15 possible character state changes at this node. Table 2) Eight synapomorphies differentiate Pan-Homo LCA from extant hominoids Extant hominoids Posterior skull length - longer. Pan-Homo LCA Posterior skull length -shorter. Supraglenoid gutter - wider. Supraglenoid gutter -narrower. 31
42 Articular eminence above occlusal plane. Inter-mandibular fossa distance - larger. Inter- mastoid process distance - smaller. Bi-carotid canal distance larger. Bi-jugular foramen distance smaller Distance between the apices of the Petrous temporal bones - smaller. Articular eminence close to the occlusal plane. Inter-mandibular fossa distance - smaller. Inter- mastoid process distance larger. Bi-carotid canal distance smaller. Bi-jugular foramen distance larger Distance between the apices of the petrous Petrous temporal bones - larger. Table 3) Predicted cranial base and cranial base-related morphology of the Pan-Homo LCA compared with the predominant character states seen in H. sapiens and P. troglodytes. Bold text indicates a character state change from the state expressed by the Pan-Homo LCA. Pan-Homo LCA Homo sapiens Pan troglodytes Variable frequency of contact between the ethmoid bone and the lacrimal bone. High frequency of contact between the ethmoid bone and the lacrimal bone. Variable frequency of contact between the ethmoid bone and the lacrimal bone. Contact between the ethmoid bone and the sphenoid bone present in the majority (i.e., 50-75% Contact between the ethmoid bone and the sphenoid bone present in ca. 100 % of cases. Contact between the ethmoid bone and the sphenoid bone present in most (i.e., >75% of cases). of cases). Ovoid foramen magnum. Ovoid foramen magnum. Ovoid foramen magnum. 32
43 Anterior boundary of the foramen magnum well behind the bi-tympanic line. Anterior boundary of the foramen magnum at the bi-tympanic line. Anterior boundary of the foramen magnum well behind the bi-tympanic line.. Flat external cranial base. Flexed external cranial Flat external cranial base. base. Posteriorly-inclined foramen magnum. Horizontal foramen magnum. Posteriorly-inclined foramen magnum. Anteroposterior length of the foramen magnum - ambiguous. Anteroposterior length of the foramen magnum - long. Anteroposterior length of the foramen magnum - short. Foramen magnum width - ambiguous. Foramen magnum width - wide. Foramen magnum width - narrow. Steeply-inclined and posterior facing nuchal plane. Horizontal nuchal plane. Steeply-inclined and posterior facing nuchal plane. Broad and shallow posterior digastric attachment. arrow and deep posterior digastric Broad and shallow posterior digastric attachment. attachment. Attachment of longus capitus - large. Attachment of longus capitus - small. Attachment of longus capitus - large. Asterionic notch present. Asterionic notch absent. Asterionic notch present. No overlap between the parietal bone and the occipital bone at asterion. No overlap between the parietal bone and the occipital bone at asterion. No overlap between the parietal bone and the occipital bone at asterion. Occipital marginal sinus - low incidence. Occipital marginal sinus variable incidence. Occipital marginal sinus - low incidence. Cerebellar morphology - lateral flare and posterior protrusion. Cerebellar morphology tucked. Cerebellar morphology - lateral flare and posterior protrusion. 33
44 Opisthion to inion distance large. Opisthion to inion distance small. Opisthion to inion distance large. Posterior skull length - short. Posterior skull length - long. Posterior skull length short. Opisthion to infratemporal subtense - large. Opisthion to infratemporal subtense Opisthion to infratemporal subtense - large. small. Cranial base long. Cranial base short. Cranial base long. Occipital sagittal chord - long. Occipital sagittal chord - long. Occipital sagittal chord - short. Occipital sagittal arc - large. Occipital sagittal arc - large. Occipital sagittal arc - small. Bi-foramen ovale distance - small. Bi-foramen ovale distance large. Bi-foramen ovale distance - small. Bi-infratemporal crest distance - small. Bi-infratemporal crest distance - small. Bi-infratemporal crest distance - small. Middle ear - deep. Middle ear - deep. Middle ear - deep. Axis of ear bones - >90 0. Axis of ear bones - >90 0. Axis of ear bones - >90 0. Area of inner ear - large. Area of inner ear - large. Area of inner ear - large. Vaginal process - small or absent. Vaginal process present and substantial. Vaginal process - small or absent. Supraglenoid gutter - narrow. Supraglenoid gutter - narrow. Supraglenoid gutter - narrow. Horizontal distance between the TMJ and the M2/ M3 boundary - long. Horizontal distance between the TMJ and the M2/ M3 boundary - short. Horizontal distance between the TMJ and the M2/ M3 boundary - long. Large anteriorly placed postglenoid process. Small postglenoid process fused to the tympanic. Large anteriorly placed postglenoid process. 34
45 Articular eminence above the occlusal plane. Inter-mandibular fossa distance - large. Infratemporal fossa - short. Temporal fossa varies in width. Lateral inflation of the mastoid process relative to the supramastoid crest - none. Mastoid process length medium. Inter-mastoid distance - medium. Petrous orientation - sagittal. Petrous apex - ossified with projection. Bi-carotid canal distance - small. Distance between the apices of the right and left petrous temporal bones - small. Petrous portion of the tympanic - long. Little or no overlap of the squamosal portion of the Articular eminence close to the occlusal plane. Inter-mandibular fossa distance small. Infratemporal fossa very short. Temporal fossa narrow. Lateral inflation of the mastoid process relative to the supramastoid crest - none. Mastoid process length long. Inter-mastoid distance - small. Petrous orientation coronal. Petrous apex not ossified with projection. Bi-carotid canal distance - large. Distance between the apices of the right and left petrous temporal bones large. Petrous portion of the tympanic short. Little or no overlap of the squamosal portion of the Articular eminence close to the occlusal plane. Inter-mandibular fossa distance - large. Infratemporal fossa - short. Temporal fossa varies in width. Lateral inflation of the mastoid process relative to the supramastoid crest - none. Mastoid process length medium. Inter-mastoid distance - large. Petrous orientation - sagittal. Petrous apex - ossified with projection. Bi-carotid canal distance - small. Distance between the apices of the right and left petrous temporal bones - small. Petrous portion of the tympanic - long. Little or no overlap of the squamosal portion of the 35
46 temporal bone. temporal bone. temporal bone. Pneumatization of the temporal squama - extensive. Compound temporonuchal crest in males present and marked. Tympanic - tubular with a weak crest. Pneumatization of the temporal squama less extensive. Compound temporonuchal crest in males absent. Tympanic - plate-like and inclined. Pneumatization of the temporal squama - extensive. Compound temporonuchal crest in males present and marked. Tympanic - tubular with a weak crest. External auditory meatus medial. External auditory meatus medial. External auditory meatus medial. Eustachian process - marked. Eustachian process - marked. Eustachian process marked. External auditory meatus small. External auditory meatus large. External auditory meatus small. Bi-porionic breadth - Bi-porionic breadth small. Bi-porionic breadth small. ambiguous. Bi-jugular foramen width large. Bi-jugular foramen width small. Bi-jugular foramen width large. Bi-tympanic breadth - large. Bi-tympanic breadth - Bi-tympanic breadth - large. small. Tympanic length - large. Tympanic length - small. Tympanic length - large. Very low auricular height. High auricular height. Low auricular height. 36
47 Table 4) Comparison between the Pan-Homo LCA and a hypothetical stem hominin. Bold text is an unambiguous character state change in the stem hominin. Pan-Homo LCA Stem Hominin Anterior boundary of the foramen magnum well behind the bi-tympanic line. Flat external cranial base. Steeply-inclined and posterior facing nuchal plane. Attachment of longus capitus large. Posterior skull length - short. Anterior boundary of the foramen magnum at the bi-tympanic line. Flat external cranial base or a more flexed cranial base. Steeply-inclined and posterior facing nuchal plane or horizontal nuchal plane. Attachment of longus capitus large or small. Posterior skull length long. Opisthion to infratemporal subtense - large. Cranial base long. Opisthion to infratemporal subtense large or small. Cranial base long or short. Bi-foramen ovale distance - small. Mastoid process length - medium. Bi-foramen ovale distance - small or medium. Mastoid process length medium or long. Inter-mastoid distance medium or large. Inter-mastoid distance medium. Petrous orientation - sagittal. Petrous orientation - sagittal or intermediate. 37
48 Bi-carotid canal distance - smaller. Tympanic - tubular with a weak crest. Bi-porionic breadth - ambiguous. Bi-carotid canal distance smaller or larger. Tympanic - tubular with a weak crest or plate-like and inclined. Bi-porionic breadth small. Discussion Interest in the morphology of the cranial base as seen in norma basilaris can be divided into studies that are concerned with identifying relatively discrete, small scale, taxonomically-distinctive morphological features, and studies that are more concerned with larger scale changes in the size and shape of the major components of the cranial base. The former studies are exemplified by the observations of Weidenreich (1943) and by Rightmire (1990) suggesting that the shape and the relationships of the tympanic are distinctive in H. erectus. Larger scale studies have focused more on the relative and absolute contributions of the sphenoid and the temporal bones to the width of the cranial base and on the orientation of the tympanic and petrous components of the temporal bone. This analysis considers both detailed morphology and larger scale relationships. There is now substantial agreement among molecular biologists that the Pan-Homo divergence occurred between 4-8 Ma (for a review of this evidence see Bradley, 2008). Considerable effort is now being expended to identify and survey fossiliferous deposits within this time span in order to expand the early hominin hypodigm. Because of the paucity of the fossil evidence for many of the 38
49 pre-1.5 Ma taxa recognized in speciose interpretations of the early hominin record the phylogenetic relationships represented in Figure 2 must be considered provisional. However, this is probably the best we can do with the existing evidence, so we have used the results of this parsimony analysis to predict the expected cranial base morphology of the LCA of the Pan-Homo clade and in Table 3 we compare these predictions with the observed expressions of the same characters in modern humans and in common chimpanzees. Eight potential cranial base synapomorphies (i.e., differences between the states observed in extant hominoids and our predictions) are noted for the Pan-Homo last common ancestor (Table 2) and at least one synapomorphy, a reduction in posterior skull length, together with ambiguity in several other characters is expected to distinguish the Pan-Homo LCA and the stem hominin (Table 4). Evolutionary trends in the Paranthropus subclade Whereas the total evidence analysis suggests a close relationship between P. aethiopicus and (P. robustus, P. boisei), the cranial base characters do not provide support for a close relationship among these taxa. This lack of support from the cranial base evidence for a Paranthropus clade is also manifest in the results of the character state analyses presented above, for these consistently found evidence of homoplasy in Paranthropus cranial base morphology. However, a number of cranial base characters are synapomorphic for the Paranthropus clade and do not show evidence of homoplasy (based on the cranial and dental data set). For example, lateral inflation of the mastoid process relative 39
50 to the supramastoid crest is shared among Paranthropus. Similarly, all the Paranthropus taxa share a laterally-placed external auditory meatus, overlap between the parietal bone and occipital bone at asterion, and overlap of the parietal where it articulates with the squamosal portion of the temporal squama. At least 14 cranial base traits suggest parallel evolution within Paranthropus and Homo. Despite many apparently homoplastic cranial base characters, major grades within the hominin lineage have unique combinations of selected cranial base features (Figure 4). Figure 4: Hominin cranial base morphological grades This figure shows early hominin taxa plotted against a vertical axis of time. The columns for each taxon are the best current estimate of the time of its first and last appearance, so the height of the columns represents their temporal span. The horizontal axis is an 40
51 approximate reflection of the phenotype, with hominins with large brains, small chewing teeth and obligate bipedalism to the left and hominins with relatively small brains and/or large chewing teeth, to the right. The taxa are color coded according to whether they do, or do not, have the cranial base attributes set out in the key to the figure. Evolutionary trends in the Homo subclade A number of characters unite the genus Homo including a more coronal orientation of the petrous bone, a deep and narrow posterior digastric notch, reduced pnuematization of the temporal squama, a more flexed cranial base, anterior inclination of the foramen magnum, and a reduced insertion of longus capitus. Among the characters supporting a (H. habilis (H. ergaster, H. sapiens)) grouping is a reduction in the distance between the TMJ and the occlusal plane, the presence of a prominent vaginal process links H. ergaster and H. sapiens, and modern humans are autapomorphic in that the apex of the petrous bone is not ossified anterior to the sphenoccipital synchondrosis. Cranial base characters figured prominently in the analysis of KNM-ER 42700, the calvaria of a young adult that was recovered in 2000 from Ileret, east of Lake Turkana, in Kenya (Spoor et al., 2007). In H. habilis the TMJ retains the primitive condition of being mediolaterally and relatively broad, and both the tympanic and the petrous are relatively sagittally-orientated (as measured by the tympanomedian angle and the petromedian angles, respectively), so that they are 41
52 similarly aligned. In contrast, in H. erectus the TMJ is narrow mediolaterally, the tympanic is relatively coronally-orientated and the petrous is more sagittallyorientated, so that contra the condition in H. habilis, the tympanic and the petrous components of the temporal bone meet at an angle (Spoor et al., 2007). The cranial base is relatively well-represented in the intriguing collection of hominins recovered from Dmanisi, and this review of the polarity of characters based on the macromorphology of the cranial base as seen in norma basilaris will help in the assessment of this material. A companion study of patterns of intraspecific variation in the cranial base of the extant higher primates (Nevell and Wood, in preparation) will also aid in the ongoing discussions about the taxonomy of the Dmanisi cranial fossils. Conclusion Cranial base morphology has played a prominent role in hominin systematics since the earliest investigators began looking at the hominin record. When Raymond Dart assigned the Taung skull to Au. africanus in 1925 the placement and orientation of the foramen magnum featured in his decision to assign that specimen to a novel species and genus. Cranial base morphology continues to contribute prominently to recent hominin diagnoses for Ar. ramidus and S. tchadensis. The importance of cranial base morphology can be attributed to its taphonomic as well as its morphological characteristics. The petrous bones are dense, well protected, and they are evidently not preferred by carnivores. The cranial base is well-represented in the hominin record and fossils recovered over 42
53 the past 20 years have further expanded the geographic and temporal range of hominin fossil evidence of the cranial base (e.g., White et al., 1994, Gabunia et al., 2000, Brunet et al., 2002, Vekua et al., 2002, Brown et al., 2005; Spoor et al., 2007). We used a parsimony analysis of published cranial and dental data (Strait and Grine, 2004) to predict the cranial base morphology expected in the hypothetical last common ancestor (LCA) of the Pan-Homo clade. We also predicted the primitive condition of the cranial base for the hominin clade, and documented the evolution of the cranial base within the major subclades within the hominin clade. This analysis suggests that cranial base morphology has continued to evolve in the hominin clade, both before, and after, the emergence of the genus Homo. Acknowledgements A similar article based on this chapter has been recently published in the Journal of Anatomy (Nevell and Wood, 2008). We are grateful to Nick Lonergan and Rui Diogo for their constructive and insightful comments on previous versions of the manuscript. LN is supported by a George Washington University Academic Excellence Graduate Fellowship. The participation of BW was supported by GW s Academic Excellence initiative, the GW VPAA, the GW University Professorship in Human Origins, and by the ASGB&I. 43
54 Chapter 3: A genetically defined role of Paired box gene 7 (Pax7) in patterning the basioccipital in mice. Introduction The adult mouse cranial base is comprised of bones that arise from distinct cartilaginous precursors. From caudal to rostral the cranial base is comprised of the basioccipital, basisphenoidal, presphenoid, and ethmoid in the midline as well as the paired petrous portions of the temporal bones and the paired exoccipital bones (Figure 5). The basioccipital forms the anterior margin of the foramen magnum and is the first midline component of the chondrocranium to commence ossification. Mutations affecting growth and maturation of cartilage in the sphenoccipital synchondrosis are associated with syndromes characterized by craniofacial defects throughout the face and vault (e.g., Pfeiffer syndrome, Crouzon syndrome, Apert syndrome, and achondroplasia). Many studies have examined how the cranial base influences the development of the cranium as a whole, either by influencing growth at the synchondroses (Lei et al., 2008; Rukkulchon and Wong, 2008; Nagayama et al., 2008; Cendekiawan et al., 2008; Perlyn et al., 2006; Young et al., 2006; Rice et al., 2003), or through interactions between the cranial base and the brain or face (Lieberman et al., 2008; Bastir et al., 2008; Mitteroeker and Bookstein 2008; Jeffery et al., 2007; McCarthy 2001; Strait 1999, Rosenberg et al., 1997; Moss, 1997; Ross and Ravosa 1993). 44
55 Genetically-modified mice represent a tractable system to examine the contribution of individual genes to cranial base patterning and development. Figure 5: Morphology of the ventral neonatal mouse cranial base The line drawing above represents the morphology of a neonatal mouse cranial base in ventral view. The cranial base is comprised 45
56 of, from caudal to rostral, the basioccipital (BO), basisphenoidal (BS), presphenoid (PS), and ethmoid (ET) in the midline superior to the palate as well as the paired petrous parts of the temporal bones (OC), and the paired exoccipital bones (EO). The sphenooccipital synchondrosis (SO), intra-sphenoidal synchondrosis (IS), and the paired intraoccipital synchondroses (IO) are labeled. Previous studies (Mansouri et al., 1996; Seale et al., 2000) have demonstrated that Pax7 is required for the normal developmental patterning of the brain, the neural crest-derived portions of the face, and postnatal muscle growth. We hypothesize that Pax7 may be required for the normal development of the basioccipital bone (hereafter referred to as 'the basioccipital'). This paper compares the basioccipital morphology of newborn mice deficient in Pax7 with age-matched wildtype mice. The morphology of the basioccipital is altered in newborn mice deficient in Pax7. Shape differences between normal mice and mice deficient in Pax7 are compared through traditional landmark analysis and through correspondence point analysis. The basioccipital bones of newborn Pax7- deficient mice are larger overall than those of their wildtype counterparts. The Pax7-deficient basioccipital bones are relatively and absolutely elongated. The increase in length is not observed at the midline, but is observed parasagittally. Much of the shape difference is concentrated on the sphenoccipital synchondorsis and the anterior aspect of the interoccipital synchondrosis. 46
57 Background The literature suggests several possible pathways by which Pax7 might influence basioccipital development. Each of these possible mechanisms are described below. The neural crest is a distinct population of cells in bands lateral to the developing neural tube. Neural crest-derived cells give rise to many structures such as the neurons and glia in the peripheral nervous system, the melanocytes, and portions of the face (Thain and Hickman, 1994). Pax7 is required for neural crest formation during gastrulation (Basch et al., 2006), and later in development populations of Pax7-expressing cranial neural crest cells migrate to the nasal prominence and to the epithelium adjacent to the eye (Basch et al., 2006; Kawakami et al., 1997). Interruption of Pax7 by insertion of neomycin into the first exon of the paired box and insertion of a reporter gene named LacZ (i.e. Pax7 LacZ/LacZ ) results in naso-maxillary regional defects including an anteriorposteriorly shorter maxilla (Mansouri et al., 1996). Previous studies demonstrated correlation between the length of the cranial base and the length of the face in different mouse strains (Lieberman et al., 2008; Hallgrimsson et al., 2007). One possible mechanism for covariance between cranial base length and facial length is that tensile force applied to the mouse spheno-occipital synchondrosis stimulates growth (Cendekiawan et al., 2007). The timing of growth in midline structures of the cranial base and the face in human fetal samples also suggests a correlation between cranial base length and facial length (Jeffery and Spoor, 47
58 2004). Thus, Pax7 may play a role in the integration of facial and cranial base morphology. Cranial neural crest cells may contribute directly to the mouse basioccipital (McBratney-Owen et al., 2008). The anterior cranial base cartilage is predominantly neural crest-derived and the posterior cartilage is predominantly paraxial mesenchyme-derived. A recent study showed that osteoblasts derived from neural crest cells were found in the predominantly paraxial mesenchymederived basioccipital cartilage (McBratney-Owen et al., 2008). Furthermore, both mesenchyme and neural crest cells contribute to the perichondrium surrounding the basioccipital cartilage (McBratney-Owen et al., 2008), and Pax7 is expressed in the basioccipital perichondrium ( at mid gestation. Finally, whereas the caudal portion of the spheno-occipital synchondrosis comprises just mesenchyme, both mesenchyme and neural crest derived cells contribute to the rostal portion (McBratney-Owen et al., 2008). Wnt is a cellular marker of neural crest cells. When Wnt/beta catenin is knocked out in cartilage, endochondral ossification of the spheno-occipital synchondrosis is delayed. Conversely, precocious chondrocyte growth takes place within poorly-organized growth plates when Wnt/beta catenin is over-expressed in cartilage (Nagayama et al., 2008). These data support a role for neural crest-derived cells in the timing and rate of growth in the spheno-occipital synchondrosis. Thus, Pax7 may be required for the normal development of the neural crest contribution to the basioccipital and its surrounding perichondrium. 48
59 Striated muscle stem cells are described as satellite cells because these cells are located between a muscle fiber and the surrounding basal lamina. Satellite cells are normally quiescent in adulthood until striated muscle is injured, and then Pax7-expressing satellite cells are the principal mechanism for postnatal muscle growth and repair (Seale et al., 2000; Kuang et al., 2006; Philippe et al., 2008). When activated, a satellite cell divides asymmetrically; one daughter cell replenishing the pool of satellite cells, while the other differentiates into a myogenic progenitor cell which will later differentiate into a myotube and ultimately fuse with a myofiber (Figure 6). Pax7-deficient newborn mice have normal muscles and a normal number of satellite cells, but one week post-partum Pax7-deficient mice experience a one-third to two-thirds reduction in muscle fiber diameter and a dramatic reduction in the number of satellite cells (Seale et al., 2000). Pax3 shares a degree of functional redundancy with Pax7. Pax3 and Pax7 expression domains show extensive overlap during early muscle patterning, but probably not in postnatal muscle growth and repair (Kuang et al., 2006; Buckingham, 2007). Prenatal functional redundancy between Pax7 and Pax3 may explain why Pax7-deficient mice do not show muscle abnormalities until well after birth. The postnatal reduction of muscle in Pax7-deficient mice may be the result of a reduction in the rate of proliferation of satellite cells, or of an increase in the rate of apoptosis (Oustanina et al., 2004; Relaix et al., 2006). The cranial base may respond to muscle generated loads in a manner that resembles the response of limbs or mandibular corpus to altered loads (see Ravosa et al., 2007 for a recent review of the interaction between muscle activity and cranial 49

60 shape). Thus, the Pax7-deficient mouse phenotype provides an opportunity to examine the degree to which cranial shape is affected when striated muscle is well-patterned, but its myofiber diameter and its postnatal growth rate are reduced. Figure 6: Schematic representation of muscle development Major stages in muscle development among prenatal mice and post natal mice. Pax7 is highly expressed in satellite cells and is involved in post natal muscle growth (Adapted with permission from an unpublished figure by Charles Keller). Pax7 is required for normal brain development. Early in development Pax7 is involved in establishing a dorsal-ventral axis in the neural tube (Mansouri and Gruss, 1998), and Pax7 may play a role in specification of the midbrain/hindbrain boundary (White and Ziman, 2008). Pax7 expression in the midbrain continues through adult life, and Pax7 may play a role in maintaining neural cells and neural patterning (Thompson et al., 2007; Stoykova and Gruss, 50
61 1994; Matsunaga et al., 2001; Nomura et al., 1998; Araki and Nakamura, 1999, Watanabe and Nakamura, 2000, Fogel et al., 2008, White and Ziman, 2008). Additional studies are required to consider whether the gross morphology of the midbrain is altered in the absence of Pax7, and whether, and to what degree if any, midbrain morphology influences or covaries with cranial base morphology in Pax7 deficient mice. However, Pax7 may be required for normal interactions between the developing brain and cranial base. To investigate whether the absence of Pax7 affects the morphology of the basioccipital we compared homozygous Pax7 knockout, heterozygote, and wildtype mice at birth. Methods Animals Twelve Pax7 LacZ/LacZ, twelve Pax7 LacZ/WT, and twelve Pax7 WT/WT newborn mice were included in the study. Hereafter these mice are referred to as P0 to indicate that these mice were scanned on the first day after parturition. A cross-sectional ontogenetic sample was made up of weaning age (Pax7 LacZ/WT P28; N=7), sexually mature (Pax7 LacZ/WT P42; N=5), and older adult (Pax7 LacZ/WT P180; N=5) individuals. Every effort was made to collect weaning age or adult Pax7 LacZ/LacZ mice, but these mice rarely survive to these ages (Mansouri et al., 1996; Seale et al., 2000). All mice were obtained in accordance with appropriate institutional and governmental animal use guidelines and approvals in operation at The University of Texas Health Science Center at San Antonio and/or The George 51
62 Washington University. Mice are on a C57Bl/6 predominant mixed strain background. Embryonic staging was assessed such that the appearance of a vaginal plug was considered to reflect embryonic post-conception day 0.5 (E0.5). Pregnant dams were checked daily for the birth of pups. Preparation of mice Mice at postnatal day 0 (P0) were euthanized by Isoflurane inhalation. To improve fixation of tissues and improve subsequent histological preparations, skin was removed by blanching and a series of small incisions were made in the lung pleura, the peritoneum from the umbilicus to the manubrium, and in the cranial vault and dura mater. Postcranial incisions were made with micro-scissors (.05 mm), and cranial incision was made with a surgical blade taking care not to deform the vault or penetrate the brain. The mice were preserved in 10% buffered formalin. PCR protocol Tail tips were collected at the time of death or at weaning, whichever occurred earlier. DNA was extracted using the HotShot for Tail DNA Extracts protocol (adapted from Truett et al BioTechniques 29: 52-54). The lysis solution included 25mM NaOH; 0.2mM Na 2 EDTA. The neutralizing solution included 40 mm Tris Acid. For PCR based genotyping the following primers were used to test for the Pax7 deletion: 5 - GTCGGGTCTTCATCAACGGTC -3 52
63 5 - GGGCTTGCTGCCTCCGATAGC CGCGCTCGAGATGTGCTGCAAGGCGATTAA -3 The thermocycling protocol was 95 ºC for 5min, 95 ºC for 30sec, 58 ºC for 30sec, 72 ºC for 50sec, repeat cycle (n=30), 72 ºC for 7min, 10 ºC thereafter. Samples were analyzed on a 1X TAE 2.5% agarose gel by electrophoresis and visualization with ethidium bromide. The Pax7 LacZ allele band size is (240 bp), the wildtype band size is (200 bp). MicroCT scan A GE explore Locus RS-9 in vivo microct Scanner (GE Healthcare, London, Ontario, Canada) provided 27 µm resolution scans. Newborn pups were packed in 10% PBS solution and were scanned in accordance with an optimized protocol (Vasquez et al., 2008). Scan details were as follows: resolution 27 µm, 720 views, 10 frames per view, 55 kvp energy, 500 ua current, and 2500 ms exposure time. Anatomical landmarks The basioccipital has an anterior process and paired posterolateral processes (Figure 7). The anterior process articulates with the basisphenoid at the spheno-occipital synchondrosis, and the lateral processes articulate with the paired exoccipitals. Twenty anatomical landmarks are included in this study, ten on the superior surface (nos. 1-10) and ten on the inferior surface (nos ). 53
64 These landmarks were selected in order to describe the size and shape of the basioccipital. Six landmarks (nos. 1-3 and 11-13) namely, in frontal view, the left and right most lateral superior and inferior points as well as the superior and inferior points on the midline describe the shape of the anterior process. An equivalent set of landmarks was defined on the left (nos. 7, 9, 10, 17, 19, 20) and right (nos. 4-6, 14-16) lateral processes, and two additional points (nos. 8 and 18) were taken in the midline on the superior and inferior surfaces, respectively, of the part of the basioccipital that forms the anterior margin of the foramen magnum. (.B., Basion, an osteometric landmark which is located on the basioccipital between landmarks nos. 8 and 18 will be referred to later in the paper). Figure 7: Anatomical landmarks describing the shape of the basioccipital A wire frame model depicts the basioccipital from the superior view. Landmarks numbers 1-10 are on the superior surface (white 54
65 polygon), and numbers are marked on the inferior surface (grey polygon). Estimating measurement error An estimate of measurement error at each landmark was undertaken on five adult mice. The same mouse was measured thirty times over ten consecutive days. The estimate of within-observer error matched the theoretical prediction based on scan resolution of ~0.027 mm. A second observer measured one individual six times on five consecutive days; the average within-observer error was <0.02 mm. The average variance across 1170 measurements was mm. An estimate of the theoretical limit of a 27 micron scan is 0.02 mm based on a minimum of a ten voxel gradient at the bone/soft tissue boundary. Sample size and power study Sample sizes required to test for differences in means were predicted using a power study (Dupont and Plummer, 1990, 1998), and we then used power analysis software to reassess the necessary sample size based on this empirical estimate of within observer error (ibid). When we compared means between two samples with 100% power, alpha=0.05, a sample size=12, we detected a 0.09mm difference in sample means, with a sample variance equivalent to our empirical observation of 0.023, and with an equal sample size in the control and test group. Sample size and observed variance effect the statistical power of Pearson s correlation analysis. Based on a sample size of 12 and the observed level of 55
.")
66 variance, we estimate that we can detect a strongly positive or strongly negative correlation (P>0.8) with a power of 0.8, in other words we will observe high levels of correlation with 80% accuracy (Figure 8). Figure 8: Estimating statistical power of regression analysis and sample size Differences in mean with respect to size To compare the shape of the basioccipital bone in wildtype and Pax7 deficient mice, the three-dimensional coordinates of each landmark were measured. The distance between each pair of points in each individual was measured. This comparison generated 190 pair-wise distances for each individual. The natural log was taken of each interlandmark distance, interlandmark distances were log transformed in order to ensure a closer approximation of a normal distribution and to scale the total variance to a -1, 1 range (Sokal and Slice, 1983). A two-tailed independent samples t-test was performed on each logged interlandmark distance. Note that the number of variables exceeds the number of cases being compared. A Bonferoni adjustment 56
67 was employed to account for repeated measures (0.05/190) such that a difference in means with a P value smaller than was considered significant (Sokal and Slice, 1983). In the results section a wireframe model similar to Figure 7 is used to represent interlandmark distances that differ significantly between wildtype and Pax7 deficient mice. Red lines depict variables that differ significantly between the control and test group; the absence of a line between two landmarks indicates there was no significant difference. Differences in mean values with respect to shape: univariate The geometric mean was calculated as the n th root of the product of all variables, and this measure was used as a proxy for the overall size of the basicranium. A geometric mean shape ratio (GMR) generates a dimensionless shape variable, and GMR values reflect the degree to which a particular aspect of shape contributes to the overall size of the form. The GMR does not remove all of the influence of size, because certain aspects of shape can correlate with overall size via allometry, but in a comparison of 14 different methods for scaling for size, the GMR was most effective at the identification of isometric variants of forms (Jungers et al., 1995). In the results section a wireframe model similar to Figure 7 is used to show the GMR shape variables that differ significantly between wildtype and Pax7-deficient mice. Red lines depict variables that differ significantly between the control and the test group; the absence of a line between two landmarks indicates there was no significant difference. Note that GMR values are not entirely independent of one another, and independence is a 57
68 presumption of a Bonferoni adjustment of an independent samples t-test. For this reason two stringency levels are reported; a P<0.05 result is prone to false positive error and a P< is prone to a false negative error rate (Sokal and Slice, 1983). Differences in mean values with respect to shape: multivariate To further assess shape differences, we conducted an analysis using an automated, three-dimensional, point-based modeling methodology. Point-based shape models (Brechbühler et al., 1995; Davies et al., 2003; Styner et al., 2004; J Cates et al., 2007) measure shape variation within and between populations by automatically assigning landmarks, which we will call correspondence points, on a surface. The relative positional information of the correspondences is then used for statistical analysis (e.g., hypothesis tests for group difference). Shape models based on correspondence points provide a higher-resolution representation of shape compared to models based on traditional landmarks which require strict homology between anatomical landmarks. For this study we used the correspondence optimization framework described by Cates et al. (2007, 2006). This maximizes both the geometric accuracy and the statistical simplicity of the shape model in accordance with the principle of parsimony. The general strategy of this method is to represent correspondences as point sets that are distributed across the ensemble of similar shapes by a gradient descent optimization of an energy function. The optimization function consists of two terms. The first term is formulated to ensure a good 58
69 representation of the shape data (geometric accuracy) by maximizing the entropy associated with point-set distributions on the sample shape surfaces. The second term seeks to produce a compact model of the shape variation by minimizing the entropy associated with the distribution of samples in the vector space of the correspondences. Point sets are modeled non-parametrically as dynamic particle systems so that the method operates without any free parameters (Meyer, et al., 2005). The correspondence point model of shape shares some similarities with semilandmark and sliding landmark models of shape. However, sliding landmarks fix one axis and allow the other two to slide along a surface, where correspondence points slide over a three dimensional structure. In either semilandmark or sliding landmark models of shape the placement of landmarks is not sensitive to shape variation within the sample or the degree of shape complexity. In contrast, correspondence points can be set to oversample areas of high curvature. For a full description of the correspondence point optimization method, the reader is referred to (Cates et al., 2007). The high dimensionality of the correspondence-point shape space, coupled with the relatively low sample size of our data, precludes the use of traditional statistical metrics for hypothesis testing directly in the full space of the correspondences. Instead, as described by Cates et al. (2008a,b), we use a standard, data-driven approach to dimensionality-reduction and project the correspondence positions into a lower dimensional space determined by choosing a number of basis vectors from principal component analysis (PCA). Ideally, we would like to choose only PCA modes that account for variance that cannot be 59
70 explained by random noise. Parallel analysis is commonly recommended for this purpose (Horn, 1965; Glorfeld, 1995). Parallel analysis works by comparing the percent variances of each of the PCA modes with the average percent variances obtained via PCA of Monte Carlo simulations of samplings from isotropic, multivariate, unit Gaussian distributions. We choose only modes with a greater variance than the simulated modes for the dimensionality-reduction, and use a standard, parametric Hotelling T2 test to test for group differences, with the null hypothesis that the two groups are drawn from the same distribution. To visualize the group differences that are driving the statistical result, we compute the linear discriminant vector implicit in the Hotelling T2 statistic, which is the line along which the between-class variance is maximized with respect to the within-class variance. This line is also known as Fisher s linear discriminant, and is given by w = (_a + _b) 1(µa µb), (1) where µ are the group means for groups a and b, and _ are their covariance matrices. Vector w can be rotated back from PCA space into the full dimensional shape space, and then mapped onto the mean group shape visualizations to give an indication of the significant morphological differences between groups. For this study, we performed volumetric segmentations of each the basioccipital bones from the CT image volumes, which are suitable inputs for the correspondence computation outlined above. The basioccipital bones were manually segmented by several expert observers using the open source Seg3D image processing tool (Center for Integrative Biomedical Computing, Scientific 60
71 Computing and Imaging Institute, and University of Utah). Segmentations were performed under the supervision of the author to ensure accuracy. To remove the aliasing artifacts commonly seen in volumetric segmentations, we applied the r- tightening algorithm (Williams and Rossignac, 2005), which removes aliasing without compromising the precision of the segmentation. The anti-aliasing step was followed by a very slight Gaussian blurring to remove the high-frequency artifacts that can occur as a result of numerical approximations. For the correspondence optimization, segmentations must also be aligned within a common coordinate frame. For the basioccipital bones, we first automatically aligned the segmentations with respect to their centers of mass and the orientation of their first and second principal eigenvectors. This rough alignment was then refined with respect to rotation and translation using a Procrustes registration on the correspondence positions, which is an approach generally recommended by the shape analysis literature (Goodall, 1991). The Procrustes alignment was updated at regular intervals during the correspondence optimization. We refer to the differences in correspondences that remain in the population after Procrustes alignment as differences in shape, which can be analyzed with, or without, normalizing for Procrustes scale. For the statistical analysis of correspondence points, it is important that correspondences be computed without knowledge of the genetic classification of the shapes. For a given hypothesis test, we therefore compute correspondence 61
72 models using the combined samples from both of the groups to be compared. To test for shape differences between the Pax7 LacZ/LacZ and the Pax7 WT/WT populations, for example, we would compute a single correspondence model from both the Pax7 LacZ/LacZ samples and the Pax7 WT/WT samples. For this study, we therefore computed two correspondence models: one with the combined data from the Pax7 LacZ/LacZ and the Pax7 WT/WT and a second with the combined data from Pax7 LacZ/LacZ and Pax7 WT/WT. Each model was computed with 1024 correspondence positions. We used the curvature-adaptive sampling strategy described in (Cates et al., 2007) to allow for oversampling in regions of higher curvature, and thus a more detailed representation of bone shape features. Run times for each optimization using a C++ implementation on standard 2GHz PC desktop hardware were approximately one hour. Results: Pax7 LacZ/LacZ and Pax7 WT/WT at P0 differ with respect to a number of dimensions of the basioccipital (Figure 9). Each red line represents a logged distance measure that differs significantly (P=0.0002) between Pax7 WT/WT and Pax7 LacZ/LacZ mice. Disruption of Pax7 is associated with highly significant changes in the length of the basioccipital, but this is not observed in the midline but it is observed in parasagittal planes. The Pax7 LacZ/LacZ basioccipital is larger than that of Pax7 WT/WT. The heterozygous knock out condition has a qualitatively similar effect, but fewer variables were significantly longer compared to the wildtype. 62
 between A) Pax7 WT/WT and Pax7 LacZ/LacZ mice, and B) Pax7 WT/WT and Pax7 LacZ/WT.")
73 Figure 9: Pax7-deficient mice differ from the wildtype Each red line represents a logged distance measure that differs significantly (P=0.0002) between A) Pax7 WT/WT and Pax7 LacZ/LacZ mice, and B) Pax7 WT/WT and Pax7 LacZ/WT. These variables reflect both size and shape. 63
74 The mean values for selected variables in Pax7 LacZ/LacZ and Pax7 WT/WT newborn mice are reported in Table 5. Four variables reflecting the parasagittal length and parasagittal height of the basioccipital as well as the length and height of the basioccipital in the midline were selected. The means of the logged data are provided along with standard deviations and the results of a Levene test of homogeneity of the means. The parasagittal basioccipital length of the Pax7 LacZ/LacZ mice is longer than that of Pax7 WT/WT mice, and the height of the basioccipital is also greater. 64
75 Table 5: Selected variables representing the basioccipital bone length width and height compared between Pax7 lacz/lacz and Pax7 wt/wt mice. Mean Pax7 lacz/lacz Mean Pax7 wt/wt Size GEOMEAN Midline length LN Height length LN Lateral length LN Lateral height LN Lateral length and height LN Relative midline length GMR Relative height length GMR Relative lateral length GMR Relative lateral height GMR Relative lateral length and height GMR L/Hratio LN3-5/LN L/Lhratio LN3-5/LN t-value df p Std.Dev. Pax7 lacz/lacz Std.Dev. Pax7 wt/wt Levene p 65
76 The geometric mean (which reflects the overall size of an object) is calculated as the n th root of the product of all variables and it is larger in Pax7 LacZ/LacZ mice than in Pax7 WT/WT mice (Figure 10a). However the sagittal length of the basioccipital does not differ (Figure 10b; Table 6). Dividing each linear measurement by the geometric mean yields a shape ratio that is a dimensionless representation of shape. If two forms have the same shape, but differ in size, the geometric mean shape ratio will yield the same value (Jungers et al., 1995). Geometric mean shape ratios do not necessarily remove all the effects of size, for some aspects of shape may be allometrically correlated with overall size. Note also that geometric mean shape ratios are not independent variables, and a Bonferoni adjustment for repeated measures assumes independent variables. In Figure 11 we report two sets of significant shape variables based on both more and less stringent significance criteria. The first is based on a significance of 0.05 and is likely to convey false positive results, whereas the second conveys a Bonferoni-adjusted significance level of which is likely to convey false negative results. Pax7 LacZ/LacZ newborn mice have a larger basioccipital bone based on the geometric mean compared to Pax7 WT/WT newborn mice. 66

77 Figure 10a: Pax7 lacz/lacz basioccipital bone is larger than Pax7 wt/wt 67


78 Figure 10b: Pax7 lacz/lacz basioccipital bone is longer than Pax7 wt/wt Pax7 lacz/lacz Pax7 wt/wt Pax7 LacZ/LacZ newborn mice have a larger basioccipital bone compared to Pax7 WT/WT newborn mice. The head length from nasion to opisthion was measured in each cranium. The median specimen was determined for Pax7 LacZ/LacZ and Pax7 WT/WT. An isosurface rendering was generated of the sagittal plane and the head length and length of the basioccipital for the median case is depicted. Note that this image was generated in Microview which uses perspective in its renderings. This image illustrates the length of the basioccipital relative to head length. 68

79 Table 6: Pax7 lacz/lacz basioccipital bone is longer than Pax7 wt/wt 69


80 Figure 11: Pax7-deficient mice differ from the wildtype with respect to basioccipital shape 70
81 The relationship between overall size and parasagittal length differs between Pax7 LacZ/LacZ and Pax7 WT/WT mice (Figure 11). A geometric mean shape ratio was used to investigate the relative size of particular dimensions of shape with respect to the overall size of the basioccipital. Midline length in absolute terms, and in relation to overall size, does not differ between Pax7 LacZ/LacZ and Pax7 WT/WT mice. A chord was measured reflecting the parasagittal length and height of the basioccipital from the superior lateral anterior point to the inferior lateral posterior point. This length/ height chord was longer in Pax7 LacZ/LacZ mice when compared with Pax7 WT/WT mice, both in absolute terms and relative to overall size. The height of the basioccipital in Pax7 LacZ/LacZ mice (as measured from the lateral anterior superior to inferior points) was larger absolutely, but the relationship between height and overall basioccipital size did not differ between Pax7 LacZ/LacZ and Pax7 WT/WT mice, whereas the midline height of the basioccipital did not differ absolutely, or in relation to overall size. Taken together these data suggest that interruption of Pax7 resulted in absolutely and relatively longer basioccipital, but only parasagittally, and that the absolute, but not the relative, height of the bone is larger in Pax7 LacZ/LacZ newborn mice. We assessed whether the Pax7 LacZ/LacZ phenotype was affected by overall size, or whether the absence of Pax7 has a specific effect on the shape of the basioccipital. A ratio between the natural log of the parasagittal length of the basioccipital and the natural log of the height of the basioccipital did not differ between the groups. Pax7 WT/WT mice do not differ with respect to the length/height ratio (P=0.05) and the two groups do not differ in terms of the 71
 and the length/height ratio (Y axis) is reported in Figure 12.")
82 variance of the mean value for this ratio. A ratio between the parasagittal length of the basioccipital and the parasagittal length and height of the basioccipital did not differ between the groups. A plot comparing size (X axis) and the length/height ratio (Y axis) is reported in Figure 12. Pax7 WT/WT mice and Pax7 LacZ/LacZ have overlapping ranges in this graph, suggesting that there is no allometric trend among the Pax7 WT/WT newborn mice and no difference between the groups in terms of the relationship between length and height. Figure 12: Pax7-deficient phenotype cannot be attributed to the effects of size A shape ratio was generated by dividing the parasagittal length of the basioccipital by its height. We plotted the geometric mean on the X axis and the L/H shape ratio on the Y axis. No scaling relationship between size and shape is apparent. 72
83 There is a significant correlation between basioccipital overall size and relative parasagittal length and height among wildtype mice, but the correlation is not significant in a mixed sample of wildtype and Pax7-deficient mice (Table 7a). Moreover, the length/height ratio has an adjusted r 2 of.016 (Table 7b). If there was no relationship between the geometric mean and the length/height shape ratio, then the residual variability of the Y variable to the original variance in the X variable would be equal to 1.0. If geometric mean and the length/height shape ratio were perfectly related, there would be no residual variance, and the ratio of variance would be 0.0. The length/height ratio accounts for less than 2% of the variation, while the parasagittal length accounts for 21% and the parasagittal height accounts for 10% of the variation in residuals from the prediction line. Thus, the Pax7 LacZ/LacZ basioccipital phenotype cannot be attributed to any scaling relationship between the parasagittal length and the height of the basioccipital and its overall size. 73
 Relationship between the overall size of the basioccipital and a ratio between parasagittal length and height.")
84 Table 7: A) Correlation between the overall size of the basioccipital and selected variables. B) Relationship between the overall size of the basioccipital and a ratio between parasagittal length and height. We further investigated whether the significance of the differences noted in the parasagittal length of the basioccipital could be attributed to increased levels of variance in the Pax7 LacZ/LacZ mice relative to wildtype mice. A Levene test on the logged inter landmark distances was employed to test for homogeneity of variance between the Pax7 LacZ/LacZ mice and the Pax7 WT/WT mice. Fifteen of 190 total variables tested show a significant difference in variance. Among the 15 variables for which the Pax7-deficient mice and the wildtype mice differed with respect to the degree of variance, none involved variables that differed significantly with respect to the mean values. Note that when the significance 74
85 level was relaxed to ignore the effects of repeated measures (i.e., P= 0.05), 20% of the variables whose means differ between these groups also differ with respect to the variance. Thus, the increase in parasagittal basioccipital length in the Pax7- deficient newborn mice cannot be attributed to differences in variance. There are some significant shape differences between the phenotypes resulting from the homozygous and heterozygous interruptions of Pax7. Homozygous interruption of the Pax7 results in a basioccipital phenotype that shows more shape differences compared to the wildtype than does the heterozygous condition. Thus, one active wildtype allele of Pax7 is not sufficient to recover a wildtype basioccipital shape. This effect of gene dosage on phenotype is an increasingly appreciated theme in developmental biology (Cook et al., 1998). We examined whether there were any significant differences in multivariate shape between newborn (P0) Pax7 LacZ/LacZ, Pax7 LacZ/WT, and Pax7 WT/WT mice, and whether any differences seen in the newborns were also seen later in ontogeny. Principal components analysis (based on 191 variables - the 190 logged interlandmark distances plus the geometric mean) was performed in order to test for differences between groups based on age class and genotype. Twelve newborn mice for each of the following genotypes: Pax7 LacZ/LacZ, Pax7 LacZ/WT, Pax7 WT/WT were considered as well as a sample of postnatal mice at weaning age (N=7), sexual maturity (N=5), and older adults (N=5). The first three components describe 72% of the variance. Figure 13 is a plot of PC1 (which represents 43% of the variation) and PC2 (which represents ca. 22% of the 75
86 variance). The geometric mean was included in the analysis and accounts for 6% of the variance to PC1 and 0.4% of the variance in PC2. Figure 13: Pax7 basioccipital morphology through post-natal development Newborn mice cluster together in multivariate space apart from older mice. Weaning age Pax7 LacZ/LacZ and Pax7 WT/WT basioccipital morphology does not appear to differ by this method of analysis. Newborn pups form a distinct cluster separated from postnatal mice. Pax7 LacZ/LacZ, Pax7 LacZ/WT, and Pax7 WT/WT newborn pups show significant differences in PC2. Pax7 LacZ/LacZ and Pax7 WT/WT newborn pups show significant differences on PC1. The newborn pups show significant differences between means among different genotypes, but the ranges overlap. A Levene test confirms there are no significant differences in the amount of variance between Pax7 WT/WT newborn pups and Pax7 LacZ/LacZ in multivariate space, likewise there is no significant 76
87 difference in the amount of variance between Pax7 WT/WT newborn pups and Pax7 LacZ/WT newborn pups. No significant difference was detected between weaning age and adult Pax7 LacZ/WT mice and Pax7 WT/WT. However, there are significant differences between newborn Pax7 WT/WT mice and weaning age Pax7 WT/WT mice, as well as between newborn Pax7 WT/WT mice and Pax7 WT/WT mice at sexual maturity. Likewise, significant differences were noted between newborn Pax7 LacZ/WT mice and weaning age Pax7 LacZ/WT mice, as well as between newborn Pax7 LacZ/WT mice and Pax7 LacZ/WT mice at sexual maturity. A Levene test of homogeneity of variance found that the absolute amount of variance was not constant through development, Pax7 LacZ/WT weaning age mice have a high variance in the first principal component. Thus, the differences between the Pax7 deficient phenotype and the wildtype phenotype is most apparent early in development and it reduces later in ontogeny. Correspondence point analysis was employed in order to further assess shape differences (Figure 14). An average form was generated for the control Pax7 WT/WT (right) and test group Pax7 LacZ/LacZ (left), the average forms were represented without adjusting for scale (top) and with scale adjusted so that both forms are the same size (bottom). The Pax7 WT/WT sphenoccipital synchondrosis has a rounded and a pronounced double arch. The Pax7 LacZ/LacZ sphenoccipital synchondrosis has a sharper corner a single arch. 77
 and test group Pax7 LacZ/LacZ (left), the average forms were represented")

88 Figure 14: Correspondence point models of Pax7 WT/WT and Pax7 LacZ/LacZ An average form was generated using correspondence analysis for the control Pax7 WT/WT (right) and test group Pax7 LacZ/LacZ (left), the average forms were represented without adjusting for scale (top) and with scale adjusted so that both forms are the same size (bottom). Principal components analysis reduced the dimensionality of the data and allowed for the hypothesis testing of group differences. Parallel analysis 78
89 identified four principal componants that provide more information than random noise. Figure 15 reports the results of the PCA comparing Pax7 WT/WT and Pax7 LacZ/LacZ basioccipital shape among newborn mice. Figure 16 reports the results of the PCA comparing Pax7 WT/WT and Pax7 LacZ/WT basioccipital shape among newborn mice. 79
90 Figure 15: Principal components results of correspondence point analysis comparing Pax7 WT/WT and Pax7 LacZ/LacZ Principal component analysis shows differences between the Pax7 LacZ/LacZ (triangles) and Pax7 WT/WT (circles) in multivariate space. The data are normalized to the Procrustes size. 80
91 Figure 16: Principal components results of correspondence point analysis comparing Pax7 WT/WT and Pax7 LacZ/WT Principal component analysis shows differences between the Pax7 LacZ/WT (triangles) and Pax7 WT/WT (circles) in multivariate space. The data are normalized to the Procrustes size. Any global shape difference between Pax7 LacZ/LacZ and Pax7 WT/WT average forms was assessed by performing a Hotelling s T2 test on the PCA components. First Pax7 LacZ/LacZ was compared with Pax7 WT/WT. The PCA found good separation between the groups (p = ) and 4 principal components chosen by parallel analysis. When the same forms were normalized for 81
92 Procrustes size the PCA found better separation between the groups (p = ) and the 4 principal components chosen by parallel analysis. Similarly, when Pax7 LacZ/WT was compared with Pax7 WT/WT the PCA found good separation between the groups (p = ) and 4 principal components chosen by parallel analysis. When the Pax7 LacZ/WT and Pax7 WT/WT average forms were normalized for Procrustes size the groups were less well separated in multivariate space (p = ) and 4 principal components were chosen by parallel analysis. There is no significant difference in terms of the size between Pax7 LacZ/LacZ and Pax7 WT/WT correspondence models, as measured by a Welch Two Sample t-test assuming a null hypothesis that the means are equal (p = ). However, Pax7 LacZ/WT and Pax7 WT/WT do differ in size (p = 0.02). Figures 17 through 20 depict statistically significant shape differences between the Pax7 LacZ/LacZ and Pax7 WT/WT average forms. These differences were visualized using a Fisher s linear discriminant function. In these figures the vectors shown in blue represent correspondence points moving away from the center of the bone and yellow vectors represent points that are moving towards the center. The size of each vector represents the relative contribution of that correspondence point to the principal component. These shape differences represent the aspects of shape that best differentiate the two groups. 82

93 Figure 17: Correspondence point comparison of the Pax7 WT/WT and Pax7 LacZ/LacZ basioccipitals seen in superior view Statistically significant shape differences between the Pax7 LacZ/LacZ and Pax7 WT/WT average basioccipital forms in superior view. Vectors shown in blue represent correspondence points moving away from the center of the bone and yellow vectors represent points that are moving towards the center. Normalized to remove the effects of size. 83
94 Figure 18: Correspondence point comparison of the Pax7 WT/WT and Pax7 LacZ/LacZ basioccipitals in posterior view Statistically significant shape differences between the Pax7 LacZ/LacZ and Pax7 WT/WT basioccipital average forms in posterior view. Vectors shown in blue represent correspondence points moving away from the center of the bone and yellow vectors represent points that are moving towards the center. Normalized to remove the effects of size. 84
95 Figure 19: Correspondence point comparison of the Pax7 WT/WT and Pax7 LacZ/LacZ basioccipitals in lateral view Statistically significant shape differences between the Pax7 LacZ/LacZ and Pax7 WT/WT average basioccipital forms in lateral view; anterior corresponds to the top of the diagram and superior to the left. Vectors shown in blue represent correspondence points moving away from the center of the bone and yellow vectors represent points that are moving towards the center. Normalized to remove the effects of size. 85

96 Figure 20: Correspondence point comparison of Pax7 WT/WT and Pax7 LacZ/LacZ basioccipitals in oblique view Statistically significant shape differences between the Pax7 LacZ/LacZ and Pax7 WT/WT average basioccipital forms in oblique view. Vectors shown in blue represent correspondence points moving away from the center of the bone and yellow vectors represent points that are moving towards the center. Normalized to remove the effects of size. 86
97 The Pax7 LacZ/LacZ model shows significant differences in the shape of the sphenoccipital synchondrosis resulting in a single arch as opposed to a double arch. The length of the basioccipittal along the midline is affected by this change. The lateral aspect of the synchondrosis is also expanded which in turn influences interlandmark distance measures along parasagittal planes. There is significant growth on the inter-occipital synchondrosis, particularly at the anterior aspect of the growth plate. The width of the basioccipital is reduced between the sphenooccipital synchondrosis and the interoccipital synchondrosis. Basion takes a more anterior position relative to the most posterior aspect of the basioccipital and the height of the basioccipital is reduced along the foramen magnum. The posterior view, lateral and oblique views show increased concavity on the superior surface, achieved primarily around the anterior aspect of the interoccipital synchondrosis. The lateral view in Pax7 deficient mice also shows that the inferior edge of the spheno-occipital synchondrosis is more anterior than the superior edge. Similar results were obtained when the Pax7 WT/WT and Pax7 LacZ/WT basioccipital bones were compared (Figures 21-24). 87

98 Figure 21: Correspondence point comparison of Pax7 WT/WT and Pax7 LacZ/WT basioccipitals in superior view Statistically significant shape differences between the Pax7 LacZ/WT and Pax7 WT/WT average basioccipital forms in superior view. Vectors shown in blue represent correspondence points moving away from the center of the bone and yellow vectors represent points that are moving towards the center. Normalized to remove the effects of size. 88

99 Figure 22: Correspondence point comparison of Pax7 WT/WT and Pax7 LacZ/WT basioccipitals in posterior view Statistically significant shape differences between the Pax7 LacZ/WT and Pax7 WT/WT average basioccipital forms in posterior view. For this image the superior-inferior axis is shown from top to bottom and the medial-lateral axis is depicted right to left. Vectors shown in blue represent correspondence points moving away from the center of the bone and yellow vectors represent points that are moving towards the center. Normalized to remove the effects of size. 89

100 Figure 23: Correspondence point comparison of Pax7 WT/WT and Pax7 LacZ/WT basioccipitals in lateral view Statistically significant shape differences between the Pax7 LacZ/WT and Pax7 WT/WT average basioccipital forms in lateral view; anterior corresponds to the top of the diagram and superior to the left. Vectors shown in blue represent correspondence points moving away from the center of the bone and yellow vectors represent points that are moving towards the center. Normalized to remove the effects of size. 90
101 Figure 24: Correspondence point comparison of Pax7 WT/WT and Pax7 LacZ/WT basioccipitals in oblique view Statistically significant shape differences between the Pax7 LacZ/WT and Pax7 WT/WT average forms in lateral view. In this image the superior surface of the bone is shown. The posterior to anterior axis runs from bottom left to top right. Vectors shown in blue represent correspondence points moving away from the center of the bone and yellow vectors represent points that are moving towards the center. Normalized to remove the effects of size. 91
102 Discussion Genetically-modified mice provide a tractable model for studying the contribution of specific genes to growth and development. Mutations affecting growth and maturation of the basioccipital component of the occipital bone are associated with syndromes characterized by craniofacial defects throughout the face and vault. The basioccipital also undergoes dramatic changes through hominin evolution. This paper describes the role of Paired box gene 7 (Pax7) in patterning in the mouse basioccipital. The use of transgenic organisms as a model for understanding embryology and evolution requires a careful consideration of whether the structures and processes under investigation are homologous. Two structures are homologous when they share a similar form, are derived through similar developmental process, are heritable, and when the phenotypes are shared due to their inheritance from a recent common ancestor. In contrast, phenocopies are not shared because of the presence of the phenotype in the most recent common ancestor. For example, the larval/pupal environment of the African butterfly Bicyclus induces either cryptic or predator-deterring wing color by season (Beldade & Brakefield, 2002). Transgenic mice with disruption in specific candidate genes sometimes mimic evolutionary morphological changes found in unrelated taxa, and in this respect they can be considered a phenocopy. In this paper we hypothesized that Pax7 plays a role in basioccipital development. We further hypothesized that a Pax7-deficient mouse strain might act as a phenocopy in which the biological 92
103 basis of determining the length of the basioccipital, and thus the placement of the foramen magnum, in extinct hominin taxa might be interrogated. A review of previous work suggests a number of possible pathways by which Pax7 might contribute to the development of the basioccipital. Interruption of Pax7 results in a reduction in the cross-sectional diameter of muscle (Seale et al., 2000). Muscle activity generates mechanical strain on bones which in turn stimulates growth at endochondral growth plates. Muscles involved in swallowing and head flexion and extension are active in utero, but a muscle-mediated role of Pax7 in basioccipital development is not supported by our data, for even though every effort was made to collect weaning age and adult Pax7-deficent mice our small sample size and the greater variance observed within our weaning age Pax7 LacZ/WT sample, suggest that these results should be considered preliminary. Also the presence of the Pax7-deficient phenotype in newborn mice strongly suggests that Pax7 deficiency is not being mediated via muscle interactions. Pax7 plays a role in postnatal muscle growth and repair, but the phenotype of muscle reduction is not pronounced among newborns. Additional scenarios include a midbrain-mediated role of Pax7 in the development of the basioccipital. Pax7 plays a role in the development of the midbrain (Fogel et al., 2008; Matsunaga et al., 2001). Our data do not support a midbrain-mediated role, but nor do they definitively refute the scenario. A Pax7 Cre lineage trace suggests that Pax7 expression is restricted to cells that adopt a more dorsal than ventral midbrain fate (Keller, 2008 personal communication). The dorsal expression pattern of Pax7 limits the possibility of paracrin cellular 93
104 interactions with the development of the basioccipital. Likewise, the dorsal expression pattern of Pax7 means that any interaction between a possible midbrain phenotype and the basioccipital via size differences and differences in intracranial pressure are not achieved through adjacent structures. Furthermore, no size or shape difference of the midbrain is reported in the Pax7 LacZ/LacZ mice relative to Pax7 WT/WT. Another model by which Pax7 might play a role in the development of the basioccipital is via the face. Pax7 plays a primary/direct role in reducing facial length in the nasal prominence, and facial length reduction has a secondary/indirect role in the development of the basioccipital. In the absence of Pax7, portions of the maxilla and nasal prominence express a short phenotype in regions occupied by cranial neural crest cells. Growth in the face is related to growth in the cranial base (Biegert 1963; Enlow 1990; Lieberman and McCarthy 1999). In hominoids, an open, extended, cranial base angle is associated with a longer cranial base, and a closed, flexed, cranial base is associated with a shorter cranial base. In hominoids, an extended cranial base angle is associated with a long face, and a flexed cranial base is associated with a short face. The Pax7- deficient phenotype includes both a short maxilla and a long cranial base. Pax7 is highly expressed in neural crest cells, and the neural crest cell lineage contributes to the basioccipital (McBratney-Owen et al., 2008). A mixture of mesenchyme and neural crest-derived osteoblast cells are observed in the P0 ossification center, which lies along the chord between the anterior edges of the intraoccipital synchondroses. Both mesenchyme and neural crest derived 94
105 cells contribute to the rostral portion of the spheno-occipital synchondrosis, and to the perichondrium surrounding the basioccipital. Furthermore, ossification was delayed in the spheno-occipital synchondrosis when a cellular marker for neural crest cells, namely Wnt/beta catenin, was interrupted (Nagayama et al., 2008). Perhaps the larger basioccipital phenotype in Pax7 LacZ/LacZ mice is associated with neural crest cell failures resulting in delayed ossification at the sphenooccipital synchondrosis and at the interoccipital synchondrosis. Conclusion Interruption of Pax7 results in a larger and differently-shaped basioccipital component of the mouse occipital. The shape differences are greatest in parasagittal length, but the mechanism by which Pax7-deficiency causes this morphology remains unclear. Several possible explanatory models are consistent with these data. For example, 1) Pax7 may play a neural crest cell-mediated role in the development of the basioccipital, or 2) Pax7 may play a primary role in reducing facial length and thus play a secondary role in the development of the basioccipital, or 3) Pax7 may play a muscle-mediated role in basiocciptal development in newborns, 4) Pax7 may play a midbrain-mediated role in basioccipital development. Future studies should involve a lineage trace of Pax7- expressing cells to interrogate whether the lineage contributes directly to the basioccipital, and if the lineage contributes to chondrocytes or osteocytes. This could be achieved with a serial examination of Pax7 LacZ/WT at embryonic day 12 95
106 through newborn pups P0 stained for LacZ. This could also be achieved through the mating of Pax7 IC /WT sire with a Rosa26 LacZ dam. A Pax7-deficient phenotype is observed in Pax7 LacZ/WT newborn mice, but no statistical difference is observed for weaning age or adult mice. There are two possible explanations for this observation. First, our sample size was insufficient to detect a difference between the groups. Second, the Pax7-deficient basioccipital phenotype may represent a change in the timing and rate of growth that is compensated for later in development. The results of this study have broader implications for understanding craniofacial growth and development. A number of inherited genetic conditions involve abnormal growth in the cranial base synchondroses. These data suggest that normal Pax7 function may be required for growth within basicranial growth plates. Because Pax7 is implicated in the development of the face, midbrain, muscle, and in the length of the basioccipital, the Pax7-deficient mouse may provide a useful model for understanding craniofacial integration. Future studies should examine whether the affected regions in this model play a significant role in the pattern of morphological integration within the cranium. Acknowledgements This paper was generously supported by Keller Laboratory Startup funds at The University of Texas Health Science Center at San Antonio Greehey Children's Cancer, by NSF IGERT grant number , and by The George Washington University Selective Excellence Program. The authors would like to thank Robin 96
107 Bernstein for her thoughtful reading of earlier drafts. The authors would like to thank Derek Mayhew for assistance with figures. This paper was prepared in collaboration with Josh Cates, Ross Whitaker, Jerry Cheng, Bernard Wood and Charles Keller. 97
108 Chapter 4: Morphological integration in the mouse basicranium - a model for the evolution of the cranial base in early hominins Abstract The base of the cranium undergoes significant morphological change within the hominin clade, and basicranial morphology features in several hominin species diagnoses. The basioccipital component of the occipital bone contributes to cranial base length which in turn covaries with many other aspects of cranial form, such as the degree of cranial base flexion, the placement of the foramen magnum relative to the long axis of the cranial base, and the orientation of the long axis of the petrous component of the temporal bone (Lieberman et al., 2008; Strait, 1999). The latter traits are also part of a larger group of cranial base traits that apparently evolved in parallel within two hominin subclades, Paranthropus and Homo (Dean and Wood, 1982; Nevell and Wood, 2008). This paper examines the morphology of the basioccipital in three experimental mouse models in which genes implicated in basioccipital development are interrupted. One gene, Disp1, is implicated in early pattern formation, another, Fgfr3, is implicated in cartilage maturation. The third, Pax7, is implicated in development of the neural crest, midbrain, craniofacial development in the maxilla, and post-natal skeletal muscle growth. Disruption of all three of these genes results in an anteroposteriorly-elongated basioccipital phenotype in newborn mouse pups, but each transgenic strain results in a different 98
109 basioccipital shape. Previous studies using different transgenic mouse strains indicate high levels of morphological integration within the cranial base and cranial base shape is sensitive to a variety of epigenetic signals (Lieberman et al., 2008). The region of the basioccipital altered by disruption of either Pax7 or Fgfr3 is more highly correlated that the unaffected region, in other words there is a significant degree of morphological integration within these regions. However did not differ between the Pax7 or Fgfr3-deficient mice. The differences in basioccipital did not result in any significant differences in the pattern of covariance. Morphological integration may have facilitated the apparent parallel evolution of a short basioccipital within Homo and Paranthropus. In the present study, the basioccipital responded to two different genetic perturbations in a similar and highly integrated fashion. This raises the possibility that cranial base morphology in Homo and Paranthropus may not necessarily be developmentally homologous, and the same integrating processes may have facilitated cranial base character state reversals among other hominins. Disruption of either Pax7 or Fgfr3 increased the length of the basioccipital bone in a predictable and highly integrated manner, and the pattern of covariance within the basioccipital was stable across these transgenic strains. These results suggest there are several developmental mechanisms by which the length of the basioccipital might be increased and its shape modified in a predictable and integrated fashion. Key Words: 99
110 Cranial base, basioccipital development, morphological integration, character independence, developmental homology, homoplasy, Paranthropus, Homo Introduction This paper examines the morphology of the basioccipital in three experimental mouse models in which genes implicated in basioccipital development are interrupted. One gene, Disp1, is implicated in early pattern formation within the chondrocranium, Fgfr3 is implicated in cartilage maturation, and the third gene, Pax7, is implicated in development of the neural crest, midbrain, craniofacial development, and in post-natal skeletal muscle growth. We also use the mouse models to investigate whether the interruption of these genes results in significant changes in the pattern of morphological integration. The results of this study have the potential to contribute to the discussion concerning the apparent homoplasy in the hominin cranial base. For example, are the complex shape changes observed within the Homo and Paranthropus cranial base the result of a large number of independent influences on evolutionary changes in cranial base development, or is it possible to achieve these morphological changes by altering relatively few developmental processes? Does the shape of the basioccipital respond in an integrated and predictable fashion to different genetic perturbations, in which case morphological similarity would not necessarily indicate developmental homology? The basioccipital component of the occipital bone contributes to cranial base length which in turn covaries with other aspects of basicranial morphology such as cranial base flexion, the location of the foramen magnum, and the 100
 (Figure 25).")


111 orientation of the long axis of the petrous part of the temporal bone as seen in norma basilaris (Strait et al., 1999; Lieberman et al., 2008) (Figure 25). These trends are evident among the earliest hominins and are part of a larger group of cranial base traits that appear to have evolved in parallel within two hominin subclades, Paranthropus and Homo (Wood and Dean, 1984; Nevell and Wood, 2008) (Figure 26). A total evidence analysis strongly supports Paranthropus monophyly, whereas analyses restricted to the cranial base is not compatible with a hypothesis of Paranthropus monophyly (Figure 27 and 28) (Nevell and Wood, 2008). Figure 25: Cranial base morphology in Homo sapiens and Pan troglodytes Photo of the cranial base in norma basilaris (above) and in sagittal section (below). The cranial base is highlighted in sagittal section. Note the greater width of the sphenoid in Homo sapiens. Adapted from Nevell and Wood (2008). 101
112 Figure 26: Hominin grades and cranial base morphology Figure 26 shows hominin taxa plotted against a vertical axis of time. The columns for each taxon are the best current estimate of the time of its first and last appearance, so the height of the columns represents their temporal span. The horizontal axis is an approximate reflection of the phenotype, with hominins with large brains, small chewing teeth and obligate bipedalism to the left and hominins with relatively small brains and/or large chewing teeth, to the right. The taxa are color coded according to whether they do, or do not, have the cranial base attributes set out in the key to the figure. Adapted with permission from Nevell and Wood (2008). 102
113 Figure 27: Hominin phylogeny based on cranial and dental characters A majority-rule consensus depiction of the most parsimonious tree. The percentage of trees supporting a particular node is reported on each branch. A 10,000 replicate bootstrap analysis resulted in 112 most parsimonious trees out of possible trees. [Tree Length (TL) =1007; Consistency Index (CI) = 0.71; Retention Index (RI) = 0.55]. Figure 28: Hominin phylogeny based on cranial base characters A majority-rule consensus depiction of the most parsimonious tree. The percentage of trees supporting a particular node is reported on each branch. 103
114 Many of the traits that support Paranthropus monophyly are related to mastication (Chamberlain and Wood, 1985), and this has led some to suggest that the derived cranial and dental traits of Paranthropus may not meet an important prerequisite of parsimony analysis, namely character independence. If this is the case, then the importance of mastication-related traits may be exaggerated in total evidence hominin cladistic analyses, resulting in spuriously strong support for Paranthopus monophyly. High levels of masticatory-related homoplasy have been reported in other mammalian groups (Constantino and Wood, 2007; Vrba, 1979), and one study found that cladistic analysis that was not limited to characters from the face, mandible and dentition did not result in a well-supported hypothesis of Paranthopus monophyly (Skelton and Mchenry, 1992). Yet, when another study excluded dental characters it still recovered a strongly-supported monophyletic relationship among Paranthopus taxa (Strait et al., 1997). Moreover, a study that examined the prevalence of homoplasy in regions of the cranium that were hypothesized to be subject to high levels of strain related to mastication found no evidence of higher levels of homoplasy in the parts of the cranium involved dynamically with mastication (Wood and Lieberman, 2001). In contrast to the reputation that masticatory-related hard tissue morphology is prone to homoplasy, the cranial base has a reputation, deserved or not, for being evolutionarily conserved. The cranial base is the only part of the skeleton where so many important functions (e.g., respiration, feeding and ingestion, posture, and balance) converge. Some researchers have argued that the 104
115 cranial base must be a highly integrated structure that is resistant to evolutionary change because modifications that might benefit one of the functions listed above may well be detrimental to one, or more, of the others (Lieberman et al., 2000a; Lieberman et al., 2000b). A number of studies have investigated the degree of morphological integration within the cranial base. Goswami (2005) carried out an analysis across placental and marsupial mammals and found that the oro-nasal region, the basicranium, and the postcanine dentition exhibit strong levels of morphological integration. A study that explored character integration in primate cranial base morphology found five characters that correlate with cranial base length, and when these five characters were treated as a single trait it affected the topology of the hominin tree (Strait, 1999). A high level of integration was observed between the morphology of the mandibular ramus and the morphology of the petrous bone among modern humans (Bastir and Rosas, 2006). Cranial base flexion may correlate with the length of the face and brain size in relation to cranial base length (Lieberman et al., 2008; Strait, 1999). The incongruence between cranial and dental bata and cranial base data suggests that either the tree topology supporting Paranthropus monophyly should be reconsidered, or that cranial base characters may not be independent, or the selective pressures acting on hominins have caused similar complex changes in the cranial base to have occurred in parallel in at least two hominin subclades. Improving our understanding of the biological basis of integration in the cranial base may influence the manner with which characters drawn from the cranial base are coded in future analyses. 105
116 Materials and methods: Animals This paper examines the morphology of the basioccipital in three experimental mouse models in which genes implicated in basioccipital development are interrupted. Each mouse model is described briefly below. The gene sequence for dispatched homolog 1 (Disp1) contains 13 amino acid differences between modern humans and chimpanzees. Disruption of Disp1 (Tian et al., 2005) in the Shh expression domain results in changes to the cranial base morphology of a mouse that include a reduction in the anteroposterior length of the cranial base, reduction of the presphenoid and anterior placement of the foramen magnum. Hedgehog (Hh) proteins are required for the development of the ventral midline vertebrate chondrocranium, in the absence of Hh signal the chondrocytes in the primordial cranial base undergo apoptosis (Kimmel et al., 2001). Disp1 is required in order for a processed form of the sonic hedgehog protein (ShhNp) to be released from the cell where it is synthesized (Caspary et al., 2002; Kawakami et al., 2002; Ma et al., 2002). The long-distance effect of the cholesterol-free protein (ShhN) is independent of ShhNp activity and dispatched function (Li et al., 2006). The Disp1 del2/del2 conditional mouse model has been described by Tian et al. (2005) and in the present study Disp1 del2/del2 dams were crossed with an HPRT cre+ sire. Fibroblast growth factor receptor 3 (Fgfr3) is essential for normal endochondral ossification and inner ear development (Colvin et al., 1996). Fgfr3 106
117 is expressed in developing bone, cochlea, brain and spinal cord. Achondroplasia, which is associated with short broad limbs and disorganization in endochondral growth plates, the most common genetic form of dwarfism, is caused by mutations in Fgfr3. The basioccipital bone includes three endochondral growth plates that behave in a manner similar to long bones, consequently we hypothesize that disruption of Fgfr3 will be associated with a distinctive basioccipital phenotype. The Fgfr3 tm1 mouse model has been described by Colvin et al. (1996). Paired Box gene 7 (Pax7) is implicated in development of the maxilla, midbrain, and in the muscles of the head and neck. There are two amino acid differences between modern humans and chimpanzees with respect to Pax7 and mutations in this locus are linked to a children's muscle cancer. The Pax7 LacZ/LacZ mouse model has been described by (Mansouri et al., 1996). Homozygous Pax7 null mice had a dramatic reduction in numbers of satellite cells and muscle diameter starting one week after birth (Seale et al., 2000). Homozygous null Pax7 mice have an anteroposteriorly- shortened maxilla in a manner consistent with neural crest defects (Mansouri et al., 1996). Chapter 3 of this dissertation describes a phenotype that includes an increase in basioccipital length in Pax7 LacZ/LacZ and Pax7 LacZ/WT newborn mice. Sample 107
118 Twelve Pax7 LacZ/LacZ, 12 Pax7 LacZ/WT, 12 Pax7 WTWT, 10 Fgfr3 tm1/wt and three Disp1 del2/del2 X HPRT cre+ newborn (i.e., P0) mice were included in the study. All mice were obtained in accordance with appropriate institutional and governmental animal use guidelines and approvals at The University of Texas Health Sciences Center at San Antonio or at The George Washington University. Mice are bred on a C57Bl/6 mixed strain background. Embryonic staging was assessed such that the appearance of a vaginal plug was considered to reflect E0.5. Cages were checked daily for pups. Preparation of mice P0 mice: P0 pups were killed using Isoflurin inhalation. To improve fixation of tissues and improve subsequent histological preparations, the skin was removed and a series of small incisions were made in the lung pleura, the peritoneum from the umbilicus to the manubrium, and in the cranial vault and dura mater. Postcranial incisions were made with micro-scissors (.05 mm), and the cranial incision was made with a surgical blade taking care not to deform the vault or penetrate the brain. The mice were preserved in 10% buffered formalin. PCR protocol Tail tips were collected at the time of death or at weaning, whichever occurred earlier. DNA was extracted using the HotShot for Tail DNA Extracts protocol (adapted from Truett et al BioTechniques 29: 52-54). The lysis solution included 25mM NaOH; 0.2mM Na 2 EDTA.. The neutralizing solution included 108
119 40 mm Tris Acid. For PCR based genotyping the following primers were used to test for the Pax7 deletion: 5 - GTCGGGTCTTCATCAACGGTC GGGCTTGCTGCCTCCGATAGC CGCGCTCGAGATGTGCTGCAAGGCGATTAA -3 The thermocycling protocol was 95 ºC for 5min, 95 ºC for 30sec, 58 ºC for 30sec, 72 ºC for 50sec, repeat cycle (n=30), 72 ºC for 7min, 10 ºC thereafter. Samples were analyzed on a 1X TAE 2.5% agarose gel by electrophoresis and visualization with ethidium bromide. The Pax7 LacZ allele band size is (240 bp), the wildtype band size is (200 bp). The following primers were used to test for the Fgfr3 deletion: 5 -GGG CTC CTT ATT GGA CTC GC-3 5 -TGC TAA AGC GCA TGC TCC AGA CTG C-3 5 -AGG TAT AGT TGC CAC GAT CGG AGG G-3 The thermocycling protocol was 95 ºC for 5min, 95 ºC for 30sec, 66 ºC for 30sec, 72 ºC for 2 minutes, repeat cycle (n=30), 72 ºC for 7min, 10 ºC thereafter. The following primers were used to test for the Disp1 hypomorphic knock down: 5 - TGT GAG CAT GTG TGG GTT TT TGT TCT TGG GGT TTC TCT GG
120 The thermocycling protocol was 95 ºC for 5min, 95 ºC for 30sec, 56 ºC for 30sec, 72 ºC for 50sec, repeat cycle (n=32), 72 ºC for 7min, 10 ºC thereafter. The Disp1 del2 allele positive band size is (800 bp), the BL6 wild type allele band size is (850 bp). The following primers were used to test for the HPRT cre+ : 5 -GGA TTT CCG TCT CTG GTG TAG C ACC ATT GCC CCT GTT TCA CTA TC-3 5 -ACGGCAAATTCAACGGCACAG-3 5 -TTGAAGTCGCAGGAGACAACCTG-3 MicroCT scan A GE explore Locus RS-9 in vivo microct Scanner (GE Healthcare, London, Ontario, Canada) provided 27 µm resolution scans. Newborn pups and postnatal crania in PBS were scanned in accordance with an optimized protocol (Vasquez et al., 2008). Scan details were as follows: resolution 27 µm, 720 views, 10 frames per view, 55 kvp energy, 500 ua current, and 2500 ms exposure time. Anatomical landmarks The basioccipital bone has a single anterior process and paired posterolateral processes. (Figure 29) The anterior process articulates with the basisphenoid at the spheno-occipital synchondrosis, and the lateral processes 110
, were selected in order to describe the size and shape of the basioccipital. Six landmarks (nos.")
121 articulate with the paired exoccipitals. The 20 measurement landmarks, ten on the superior surface (nos. 1-10) and ten on the inferior surface (nos ), were selected in order to describe the size and shape of the basioccipital. Six landmarks (nos. 1-3 and 11-13) namely, in frontal view, the left and right most lateral superior and inferior points as well as the superior and inferior points on the midline describe the shape of the anterior process. An equivalent set of landmarks was defined on the left (nos. 7, 9, 10, 17, 19, 20) and right (nos. 4-6, 14-16) lateral processes, and two additional points (nos. 8 and 18) were taken in the midline on the superior and inferior surfaces, respectively, of the part of the basioccipital that forms the anterior margin of the foramen magnum. Figure 29: Anatomical landmarks describing the shape of the basioccipital A wire frame model depicts the basioccipital from the superior view. Landmarks numbers 1-10 are on the superior surface (white 111
122 polygon), and numbers are marked on the inferior surface (grey polygon). Estimating measurement error An estimate of measurement error at each landmark was undertaken on five adult mice. The same mouse was measured thirty times over a period of ten consecutive days. The estimate of within-observer error matched the theoretical prediction based on scan resolution of ~0.02 mm. The results of a power study conducted to estimate the sample size required to detect a correlation with a significance level of (0.05) given this level of measurement error suggested that a sample size of 12 was adequate for a covariance analysis. When a second observer measured one individual six times on five consecutive days, the average within-observer error was <0.02 mm. Thus, the study design limits any conclusions with respect to morphological integration to aspects of morphology that exhibit levels of correlation of Pearsons correlation of 0.8 or higher. Comparing shape The 20 landmarks generated 190 pair-wise interlandmark distances, which were converted into natural logarithms. A two-tailed student s T test compare the control group to the test group for each of the 190 interlandmark distances. A Bonferoni adjustment was employed to account for repeated measures (0.05/190= ) (Sokal and Rolf, 2000). Wire frame models were generated in which the red lines depict variables significantly different between the control and test groups, thus identifying the regions of the newborn basioccipital that were altered 112
123 in the transgenic strains. The geometric mean was calculated for each bone and acted as a proxy for the overall size of the bone. A ratio was calculated between the geomentric mean and each of the 190 inter-landmark distances in order to produce a dimensionless representation of shape (Jungers et al., 1995). Morphological integration was investigated using previously described and validated methods (Cheverud et al., 1989). A hypothetical matrix of correspondences was generated that assumed complete correspondence within an affected region, and complete discordance outside that region. A correlation matrix compares the variables in an analysis and reports the degree of covariation between these measures normalized by the standard deviation in each measure. The strength of association between matrices varies from -1.0 to +1.0, with a matrix correlation of +1.0 indicating identical correlation patterns (although the overall magnitude of correlation may still differ). A matrix correlation of zero indicates no structural similarity between the matrices, and a matrix correlation of -1.0 indicates that the matrices are mirror images. Significance is assessed by randomly reordering the rows of one matrix and investigating the strength of the correlation between the randomized matrix and the observed matrix (Cheverud et al., 1989). If the correlation between the observed matrix and the hypothetical matrix exceeds 95% of the correlations between the observed correlation and the randomized matrices, the affected region was assumed to show significant levels of morphological integration (MI). In addition to testing the presence or absence of a significant level of integration within the affected region for each strain, we also tested for the degree 113
124 of similarity in pattern of MI between each strain. Variance/covariance matrices were compared using a modification of a random skewers method. In this method the simulated phenotypic responses to random vectors imitating epigenetic signals, or developmental perturbations, are compared between each pair of matrices (Cheverud, 1996; Manly and Elliott, 1991; Pielou, 1984). Marroig and Cheverud (2002) employed a similar method to model evolutionary selection vectors among New World monkeys (Marroig and Cheverud, 2001). In this procedure, a random selection gradient vector is generated and normalized to a length of one. The vector represents a perturbation in development and is applied to a pair of covariance matrices that will be compared. The resulting covariance matrix represents a predicted multivariate response to selection. Because each multivariate dimension specified by a given selection differential could produce different results, the procedure is repeated to randomly sample the dimensions of multivariate morphometric space. The average vector correlation between responses to 1000 random selection vectors is used here as a measure of the similarity among the matrices. This analysis provides a measure of the degree of similarity among covariance matrix patterns. Vector correlations will be 1.0 when matrices are identical or proportional, and will decrease to zero when matrices lack any common structure. The vector correlation is a measure of association, not a significance test. The statistical significance of the vector correlation is determined by the distribution of correlations among random vectors. The significance tests performed here assume a null model of no similarity among the matrices. 114
125 Results Disruption of Pax7, Fgfr3, or Disp1 results in a longer basioccipital component of the occipital bone (Table 8). Table 8: Length of the basioccipital in the midline among newborn mice LN of length in mm sample size variance C57bl6 WTWT Pax7 LacZ/LacZ Pax7 LacZ/WT Fgfr3 TM1/WT DISP DEL2/Cre The basiocccipitals of Pax7-deficient mice differ from the wildtype in a number of dimensions (Figure 30). Each red line in Figure 30 represents a logged distance measure that differs significantly (P=0.0002) between the control and the transgenic sample. Disruption of Pax7 is associated with highly significant changes in the parasagittal length of the basioccipital bone, so that Pax7 LacZ/LacZ newborn mice have a bilaterally longer basioccipital at P0 than Pax7 WT/WT pups. There were no significant differences in basioccipital length measured in the sagittal plane. Disruption of Pax7 also results in significant difference in the shape of the basioccipital (Figure 31). 115


126 Figure 30: Pax7-deficient mice differ from the wildtype in size 116


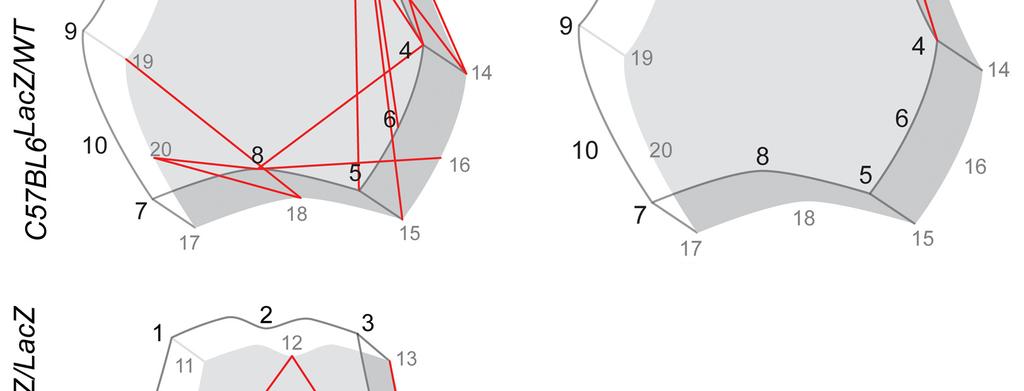

127 Figure 31: Pax7-deficient mice differ from the wildtype in shape 117
 between Fgfr3 TM1/WT and Fgfr3 WT/WT mice.")
.")
128 Fgfr3 TM1/WT and wildtype mice differ with respect to a number of basioccipital dimensions (Figure 32) at birth. Each red line represents a logged distance measure that differs significantly (P=0.0002) between Fgfr3 TM1/WT and Fgfr3 WT/WT mice. Fgfr3 TM1/WT is associated with highly significant changes in the length of the basioccipital bone, but these differences are more pronounced parasagittaly. The length of the basioccipital in the heterozygote form Fgfr3 TM1/WT is greater than in the wildtype Pax7 LacZ/LacZ newborn mice (P = 0.001). Figure 32: Fgfr3-deficient mice differ from the wildtype Disp1 DEL2/WT X HPRT Cre+ and wildtype newborn mice differ with respect to a number of dimensions of the basioccipital component of the occipital, with the Disp1 DEL2/WT X HPRT Cre+ newborns having significantly longer parasagittal basioccipital dimensions, but the differences are less pronounced in the midline (Figure 33). Each red line represents a logged distance measure that differs 118


129 significantly (P=0.0002) between Disp1 DEL2/WT and Disp1 WT/WT mice. The basioccipitals of Disp1 DEL2/WT newborn mice are also longer than in the wildtype. Figure 33: Disp1-deficient mice differ from the wildtype Significance testing of MI within the affected regions Correlation-pattern similarity among matrices within each affected region was measured by matrix correlation using a Mantel s test for statistical significance. We found a significant level of correlation between a hypothetical matrix suggesting complete correspondence between the measures affected in Pax7-deficient and Fgfr3-deficient (Figure 34) newborn mice, and complete discordance elsewhere (Table 9). Disruption of Disp1 affected the largest number 119


130 of variables, most of which involved parasagittal length, and the unaffected region had a significantly higher level of correlation among wildtype mice than the affected region. Figure 34: Mantel Test results for significance of morphological integration Pax7 LacZ/LacZ 120
Surprise! A New Hominin Fossil Changes Almost Nothing!
 Surprise! A New Hominin Fossil Changes Almost Nothing! Author: Andrew J Petto Table 1: Brief Comparison of Australopithecus with early Homo fossils Species Apes (outgroup) Thanks to Louise S Mead for comments
Early primates and hominins
 Early primates and hominins 1 Wild Card slide part deux 2 Hominins ~7-6 mya split from chimpanzees and bonobos -emerged and stayed in Africa until later Homo Mosaic evolution - these characteristics evolved
CRANIAL SIZE VARIATION AND LINEAGE DIVERSITY IN EARLY PLEISTOCENE HOMO
 doi:10.1111/evo.12215 CRANIAL SIZE VARIATION AND LINEAGE DIVERSITY IN EARLY PLEISTOCENE HOMO Jeremiah E. Scott 1,2 1 Department of Anthropology, Southern Illinois University, Carbondale, Illinois, 62901
Cranial Size Variation and Lineage Diversity in Early Pleistocene Homo
 Southern Illinois University Carbondale OpenSIUC Publications Department of Anthropology -0 Cranial Size Variation and Lineage Diversity in Early Pleistocene Homo Jeremiah E. Scott Southern Illinois University
Quantifying temporal bone morphology of great apes. and humans: an approach using geometric morphometrics
 J. Anat. (2002) 201, pp447 464 Quantifying temporal bone morphology of great apes Blackwell Science, Ltd and humans: an approach using geometric morphometrics Charles A. Lockwood, 1 John M. Lynch 2 and
Relative dating methods. Paleoanthropology. Chronometric dating methods. Dating as probability statement
 Relative dating methods Paleoanthropology Fossil Man and Fossil Men Stratigraphy: based on superposition of geologic and cultural deposition More recent deposits lie on top of older deposits Biostratigraphy:
Biological Anthropology
 Biological Anthropology Sample Exam 3 Fall 2017 This sample exam, which contains questions from exams given sometime in the past, will provide you with an idea of the types of questions you will face on
Exploring morphological phylogenetics of fossil hominins
 Exploring morphological phylogenetics of fossil hominins by Mana Dembo M.A., University of British Columbia, 2007 H.B.Sc., University of Toronto, 2005 Thesis Submitted in Partial Fulfillment of the Requirements
Algorithms in Bioinformatics
 Algorithms in Bioinformatics Sami Khuri Department of Computer Science San José State University San José, California, USA khuri@cs.sjsu.edu www.cs.sjsu.edu/faculty/khuri Distance Methods Character Methods
Since the advent of genetic investigations of hominoid diversity
 Morphometrics and hominoid phylogeny: Support for a chimpanzee human clade and differentiation among great ape subspecies Charles A. Lockwood*, William H. Kimbel*, and John M. Lynch* *Institute of Human
Announcements. Today. Chapter 8 primate and hominin origins. Keep in mind. Quiz 2: Wednesday/Thursday May 15/16 (week 14)
") Announcements Today Chapter 8 primate and hominin origins Keep in mind Quiz 2: Wednesday/Thursday May 15/16 (week 14) Essay 2: Questions are up on course website 1 Recap the main points of ch 6 and 7 Evolutionary
Announcements Today Chapter 8 primate and hominin origins Keep in mind Quiz 2: Wednesday/Thursday May 15/16 (week 14) Essay 2: Questions are up on course website 1 Recap the main points of ch 6 and 7 Evolutionary
Hominin Evolution Overview
 Genotype and Phenotype: - Each individual has a genotype (which genes they have) and a phenotype (the way in which those genes are expressed) - Some phenotypic traits will be beneficial for survival, some
Lesson Topic Learning Goals
 Unit 2: Evolution Part B Lesson Topic Learning Goals 1 Lab Mechanisms of Evolution Cumulative Selection - Be able to describe evolutionary mechanisms such as genetic variations and key factors that lead
8 Defining the Genus Homo
 Defining the Genus Homo Mark Collard. Bernard Wood Abstract The definition of the genus Homo is an important but under researched topic. In this chapter, we show that interpretations of Homo have changed
Phylogenetic Trees. Phylogenetic Trees Five. Phylogeny: Inference Tool. Phylogeny Terminology. Picture of Last Quagga. Importance of Phylogeny 5.
 Five Sami Khuri Department of Computer Science San José State University San José, California, USA sami.khuri@sjsu.edu v Distance Methods v Character Methods v Molecular Clock v UPGMA v Maximum Parsimony
Human Evolution
 http://www.pwasoh.com.co Human Evolution Cantius, ca 55 mya The continent-hopping habits of early primates have long puzzled scientists, and several scenarios have been proposed to explain how the first
Human Evolution. Darwinius masillae. Ida Primate fossil from. in Germany Ca.47 M years old. Cantius, ca 55 mya
 http://www.pwasoh.com Human Evolution Cantius, ca 55 mya The continent-hopping habits of early primates have long puzzled scientists, and several scenarios have been proposed to explain how the first true
(Stevens 1991) 1. morphological characters should be assumed to be quantitative unless demonstrated otherwise
 1. morphological characters should be assumed to be quantitative unless demonstrated otherwise") Bot 421/521 PHYLOGENETIC ANALYSIS I. Origins A. Hennig 1950 (German edition) Phylogenetic Systematics 1966 B. Zimmerman (Germany, 1930 s) C. Wagner (Michigan, 1920-2000) II. Characters and character states
Bot 421/521 PHYLOGENETIC ANALYSIS I. Origins A. Hennig 1950 (German edition) Phylogenetic Systematics 1966 B. Zimmerman (Germany, 1930 s) C. Wagner (Michigan, 1920-2000) II. Characters and character states
Homo habilis males feeding in East Africa. Two robust australopithecines are approaching. ( Myr ago) The Homo radiation
 The Homo radiation") The Homo radiation Homo habilis males feeding in East Africa. Two robust australopithecines are approaching. (1.5-2.0 Myr ago) Average 640cm 3 brain compared to 500cm 3 in the Australopithecines 1965-Louis
The Homo radiation Homo habilis males feeding in East Africa. Two robust australopithecines are approaching. (1.5-2.0 Myr ago) Average 640cm 3 brain compared to 500cm 3 in the Australopithecines 1965-Louis
Classification, Phylogeny yand Evolutionary History
 Classification, Phylogeny yand Evolutionary History The diversity of life is great. To communicate about it, there must be a scheme for organization. There are many species that would be difficult to organize
Anatomy of a tree. clade is group of organisms with a shared ancestor. a monophyletic group shares a single common ancestor = tapirs-rhinos-horses
 Anatomy of a tree outgroup: an early branching relative of the interest groups sister taxa: taxa derived from the same recent ancestor polytomy: >2 taxa emerge from a node Anatomy of a tree clade is group
POPULATION GENETICS Winter 2005 Lecture 17 Molecular phylogenetics
 POPULATION GENETICS Winter 2005 Lecture 17 Molecular phylogenetics - in deriving a phylogeny our goal is simply to reconstruct the historical relationships between a group of taxa. - before we review the
Examples of Phylogenetic Reconstruction
 Examples of Phylogenetic Reconstruction 1. HIV transmission Recently, an HIV-positive Florida dentist was suspected of having transmitted the HIV virus to his dental patients. Although a number of his
Biosc 41 Announcements 12/1
 Biosc 41 Announcements 12/1 Review: evolution (chapters 22, 23) Today s lecture: speciation and human evolution Today s lab: work on group presentations for Wed Wed s lecture: conservation biology Wed
HUMAN EVOLUTION 17 APRIL 2013
 HUMAN EVOLUTION 17 APRIL 2013 Lesson Description In this lesson, we: Consider the following aspects of Human Evolution: - Interpretation of a phylogenetic tree to show the place of the family Hominidae
Biology 211 (2) Week 1 KEY!
 Week 1 KEY!") Biology 211 (2) Week 1 KEY Chapter 1 KEY FIGURES: 1.2, 1.3, 1.4, 1.5, 1.6, 1.7 VOCABULARY: Adaptation: a trait that increases the fitness Cells: a developed, system bound with a thin outer layer made of
Biology 211 (2) Week 1 KEY Chapter 1 KEY FIGURES: 1.2, 1.3, 1.4, 1.5, 1.6, 1.7 VOCABULARY: Adaptation: a trait that increases the fitness Cells: a developed, system bound with a thin outer layer made of
Hominid Evolution What derived characteristics differentiate members of the Family Hominidae and how are they related?
 Hominid Evolution What derived characteristics differentiate members of the Family Hominidae and how are they related? Introduction. The central idea of biological evolution is that all life on Earth shares
Lecture 11 Friday, October 21, 2011
 Lecture 11 Friday, October 21, 2011 Phylogenetic tree (phylogeny) Darwin and classification: In the Origin, Darwin said that descent from a common ancestral species could explain why the Linnaean system
Human Evolution. Becoming Human. Objectives 9/13/2010. Carl Sagan s Universe Calendar. How old is the universe? How old is the earth?
 Human Evolution Becoming Human (A) Pan troglodytes, chimpanzee, modern (B) Australopithecus africanus, STS 5, 2.6 My (C) Australopithecus africanus, STS 71, 2.5 My (D) Homo habilis, KNM-ER 1813, 1.9 My
Lecture V Phylogeny and Systematics Dr. Kopeny
 Delivered 1/30 and 2/1 Lecture V Phylogeny and Systematics Dr. Kopeny Lecture V How to Determine Evolutionary Relationships: Concepts in Phylogeny and Systematics Textbook Reading: pp 425-433, 435-437
Phylogenetic analysis. Characters
 Typical steps: Phylogenetic analysis Selection of taxa. Selection of characters. Construction of data matrix: character coding. Estimating the best-fitting tree (model) from the data matrix: phylogenetic
Date Hominin Significance
 Date Hominin Significance 7.0 mya Sahelanthropus tchadensis Oldest possible hominin ancestor - foramen magnum suggests bipedalism 6.0 mya Orrorin tugenensis Earliest known hominin, CT scans of the proximal
Biologists have used many approaches to estimating the evolutionary history of organisms and using that history to construct classifications.
 Phylogenetic Inference Biologists have used many approaches to estimating the evolutionary history of organisms and using that history to construct classifications. Willi Hennig developed d the techniques
The Tree of Life. Phylogeny
 The Tree of Life Phylogeny Phylogenetics Phylogenetic trees illustrate the evolutionary relationships among groups of organisms, or among a family of related nucleic acid or protein sequences Each branch
8/23/2014. Phylogeny and the Tree of Life
 Phylogeny and the Tree of Life Chapter 26 Objectives Explain the following characteristics of the Linnaean system of classification: a. binomial nomenclature b. hierarchical classification List the major
The Evolution of Primates
 The Evolution of Primates Bởi: OpenStaxCollege Order Primates of class Mammalia includes lemurs, tarsiers, monkeys, apes, and humans. Non-human primates live primarily in the tropical or subtropical regions
Systematics Lecture 3 Characters: Homology, Morphology
 Systematics Lecture 3 Characters: Homology, Morphology I. Introduction Nearly all methods of phylogenetic analysis rely on characters as the source of data. A. Character variation is coded into a character-by-taxon
ANTHROPOLOGY 150: EVOLUTION AND HUMAN EMERGENCE NM HED Area III: Laboratory Science Competencies UNM Core Area 3: Physical and Natural Sciences
 ANTHROPOLOGY 150: EVOLUTION AND HUMAN EMERGENCE NM HED Area III: Laboratory Science Competencies UNM Core Area 3: Physical and Natural Sciences Student Learning Objectives: At the end of the course, the
Diversity and Human Evolution. Homo neanderthalensis. Homo neanderthalensis. Homo neanderthalensis. Homo neanderthalensis. Part II
 Diversity and Human Evolution Part II Neanderthal 1 La Chapelle-aux-Saints Photograph byrheinisches LandesmuseumBonn Photographs by John Reader Mount Circeo Photograph by Ministry of Culture, Italy An
CHAPTER 26 PHYLOGENY AND THE TREE OF LIFE Connecting Classification to Phylogeny
 CHAPTER 26 PHYLOGENY AND THE TREE OF LIFE Connecting Classification to Phylogeny To trace phylogeny or the evolutionary history of life, biologists use evidence from paleontology, molecular data, comparative
Introduction to characters and parsimony analysis
 Introduction to characters and parsimony analysis Genetic Relationships Genetic relationships exist between individuals within populations These include ancestordescendent relationships and more indirect
Evolution of human diversity. The history of Homo sapiens
 Evolution of human diversity The history of Homo sapiens!1 The primates Gibbon Orangutan Gorilla Bonobo Chimpanzee Human Human Chimpanzee Gorilla Orangutan Gibbon Macaque Millions years ago!2 Macaque Orangutan
Chapter 16: Reconstructing and Using Phylogenies
 Chapter Review 1. Use the phylogenetic tree shown at the right to complete the following. a. Explain how many clades are indicated: Three: (1) chimpanzee/human, (2) chimpanzee/ human/gorilla, and (3)chimpanzee/human/
ANTH 3412 FALL 2014 SYLLABUS
 ANTH 3412 FALL 2014 SYLLABUS Instructors: Bernard Wood, GW University Professor of Human Origins, HAH, 2110 G St NW 201A and Cassandra Turcotte, HOMPAL Graduate Student, 2114 G St NW 101 Lectures: T &
PHYLOGENY & THE TREE OF LIFE
 PHYLOGENY & THE TREE OF LIFE PREFACE In this powerpoint we learn how biologists distinguish and categorize the millions of species on earth. Early we looked at the process of evolution here we look at
Integrating Fossils into Phylogenies. Throughout the 20th century, the relationship between paleontology and evolutionary biology has been strained.
 IB 200B Principals of Phylogenetic Systematics Spring 2011 Integrating Fossils into Phylogenies Throughout the 20th century, the relationship between paleontology and evolutionary biology has been strained.
Homo habilis. Classification as Homo
 Homo habilis Homo habilis is a species of the tribe Hominini, during the Gelasian and early Calabrian stages of the Pleistocene period, between roughly 2.8 and 1.5 million years ago. In its appearance
Evolution Problem Drill 10: Human Evolution
 Evolution Problem Drill 10: Human Evolution Question No. 1 of 10 Question 1. Which of the following statements is true regarding the human phylogenetic relationship with the African great apes? Question
Craniodental Variation in Paranthropus boisei: A Developmental and Functional Perspective
 AMERICAN JOURNAL OF PHYSICAL ANTHROPOLOGY 116:13 25 (2001) Craniodental Variation in Paranthropus boisei: A Developmental and Functional Perspective Bernard Wood 1 * and Daniel E. Lieberman 2 1 Department
31/10/2012. Human Evolution. Cytochrome c DNA tree
 Human Evolution Cytochrome c DNA tree 1 Human Evolution! Primate phylogeny! Primates branched off other mammalian lineages ~65 mya (mya = million years ago) Two types of monkeys within lineage 1. New World
Chapter 26 Phylogeny and the Tree of Life
 Chapter 26 Phylogeny and the Tree of Life Biologists estimate that there are about 5 to 100 million species of organisms living on Earth today. Evidence from morphological, biochemical, and gene sequence
C3020 Molecular Evolution. Exercises #3: Phylogenetics
 C3020 Molecular Evolution Exercises #3: Phylogenetics Consider the following sequences for five taxa 1-5 and the known outgroup O, which has the ancestral states (note that sequence 3 has changed from
Classification and Phylogeny
 Classification and Phylogeny The diversity it of life is great. To communicate about it, there must be a scheme for organization. There are many species that would be difficult to organize without a scheme
Name: Class: Date: ID: A
 Class: _ Date: _ Ch 17 Practice test 1. A segment of DNA that stores genetic information is called a(n) a. amino acid. b. gene. c. protein. d. intron. 2. In which of the following processes does change
Name. Ecology & Evolutionary Biology 245 Exam 1 12 February 2008
 Name 1 Ecology & Evolutionary Biology 245 Exam 1 12 February 2008 1. Use the following list of fossil taxa to answer parts a through g below. (2 pts each) 2 Aegyptopithecus Australopithecus africanus Diacronis
Classification and Phylogeny
 Classification and Phylogeny The diversity of life is great. To communicate about it, there must be a scheme for organization. There are many species that would be difficult to organize without a scheme
Reconstructing the history of lineages
 Reconstructing the history of lineages Class outline Systematics Phylogenetic systematics Phylogenetic trees and maps Class outline Definitions Systematics Phylogenetic systematics/cladistics Systematics
How should we organize the diversity of animal life?
 How should we organize the diversity of animal life? The difference between Taxonomy Linneaus, and Cladistics Darwin What are phylogenies? How do we read them? How do we estimate them? Classification (Taxonomy)
Macroevolution Part I: Phylogenies
 Macroevolution Part I: Phylogenies Taxonomy Classification originated with Carolus Linnaeus in the 18 th century. Based on structural (outward and inward) similarities Hierarchal scheme, the largest most
9/15/2014. Rock types. The fossil record. A dynamic planet. Tectonic processes
 Rock types The fossil record Chapter 4 Three major rock classifications: Igneous Solidified magma Most common type of rock Sedimentary Sediment that becomes compacted into rock Usually distinctly layered
The Cell Theory, Evolution & Natural Selection. A Primer About How We Came To Be
 The Cell Theory, Evolution & Natural Selection A Primer About How We Came To Be The Forces That Created Life Physics Chemistry - Time 13.8 billion years ago 4.5 billion years ago 3.5 billion years ago
Unit 4 Evolution (Ch. 14, 15, 16)
") Ch. 16 - Evolution Unit 4 Evolution (Ch. 14, 15, 16) 1. Define Evolution 2. List the major events that led to Charles Darwin s development of his theory of Evolution by means of Natural Selection 3. Summarize
Ch. 16 - Evolution Unit 4 Evolution (Ch. 14, 15, 16) 1. Define Evolution 2. List the major events that led to Charles Darwin s development of his theory of Evolution by means of Natural Selection 3. Summarize
An Evaluation of Homo naledi and Early Homo from a Young-Age Creationist Perspective
 OPEN ACCESS Article An Evaluation of Homo naledi and Early Homo from a Young-Age Creationist Perspective T.C. Wood Core Academy of Science, Dayton, TN Abstract Fossils of early Homo have become some of
Homework. Guided Reading Recent Hominids (#22-31) Need ear buds/headphones for Monday!!
 Need ear buds/headphones for Monday!!") Homework Guided Reading Recent Hominids (#22-31) Need ear buds/headphones for Monday!! Learning Target I can explore various hominids from the skull lab and describe the evolution of hominids. What are
Homework Guided Reading Recent Hominids (#22-31) Need ear buds/headphones for Monday!! Learning Target I can explore various hominids from the skull lab and describe the evolution of hominids. What are
ESS 345 Ichthyology. Systematic Ichthyology Part II Not in Book
 ESS 345 Ichthyology Systematic Ichthyology Part II Not in Book Thought for today: Now, here, you see, it takes all the running you can do, to keep in the same place. If you want to get somewhere else,
What is Phylogenetics
 What is Phylogenetics Phylogenetics is the area of research concerned with finding the genetic connections and relationships between species. The basic idea is to compare specific characters (features)
Lecture 6 Phylogenetic Inference
 Lecture 6 Phylogenetic Inference From Darwin s notebook in 1837 Charles Darwin Willi Hennig From The Origin in 1859 Cladistics Phylogenetic inference Willi Hennig, Cladistics 1. Clade, Monophyletic group,
PHYSICS & BIOLOGY IN MEDICINE 218 RADIOLOGIC FUNCTIONAL ANATOMY. Fall 2017
 PHYSICS & BIOLOGY IN MEDICINE 218 RADIOLOGIC FUNCTIONAL ANATOMY Fall 2017 INSTRUCTORS Allan MacKenzie-Graham, PhD Jeff Alger, PhD Neuroscience Research Building 225Z 635 Charles Young Drive Email: amg@ucla.edu
Human Evolution Comparing Primates
 Human Evolution Comparing Primates Background According to the theory of evolution, all species are are related and linked to a common ancestor. Species that are more closely related have common ancestor
Grade 12 Term Use the following diagram and list the characteristics we share with other African apes. 12 and 13 (13)
") Grade 1 Term 3 Total: 100 Time: hours Assignment: Hominid evolution Objectives To list the characteristics that humans and African apes share To compare the skulls of human ancestors, cousins and other
Grade 1 Term 3 Total: 100 Time: hours Assignment: Hominid evolution Objectives To list the characteristics that humans and African apes share To compare the skulls of human ancestors, cousins and other
Phylogeny and systematics. Why are these disciplines important in evolutionary biology and how are they related to each other?
 Phylogeny and systematics Why are these disciplines important in evolutionary biology and how are they related to each other? Phylogeny and systematics Phylogeny: the evolutionary history of a species
Biology 1B Evolution Lecture 2 (February 26, 2010) Natural Selection, Phylogenies
 Natural Selection, Phylogenies") 1 Natural Selection (Darwin-Wallace): There are three conditions for natural selection: 1. Variation: Individuals within a population have different characteristics/traits (or phenotypes). 2. Inheritance:
1 Natural Selection (Darwin-Wallace): There are three conditions for natural selection: 1. Variation: Individuals within a population have different characteristics/traits (or phenotypes). 2. Inheritance:
Review sheet for Mendelian genetics through human evolution. What organism did Mendel study? What characteristics of this organism did he examine?
 Review sheet for Mendelian genetics through human evolution WARNING: I have tried to be complete, but I may have missed something. You are responsible for all the material discussed in class. This is only
Outline. Classification of Living Things
 Outline Classification of Living Things Chapter 20 Mader: Biology 8th Ed. Taxonomy Binomial System Species Identification Classification Categories Phylogenetic Trees Tracing Phylogeny Cladistic Systematics
"PRINCIPLES OF PHYLOGENETICS: ECOLOGY AND EVOLUTION" Integrative Biology 200B Spring 2009 University of California, Berkeley
 "PRINCIPLES OF PHYLOGENETICS: ECOLOGY AND EVOLUTION" Integrative Biology 200B Spring 2009 University of California, Berkeley B.D. Mishler Jan. 22, 2009. Trees I. Summary of previous lecture: Hennigian
ANTHROPOLOGY 202 October 6, 2014 An Introduction to World Prehistory. VI. Out of Africa: Middle Homo
 ANTHROPOLOGY 202 October 6, 2014 An Introduction to World Prehistory VI. Out of Africa: Middle Homo ANT 202 Wednesday October 6, 2014 STUDENTS WITH LAST NAMES S-Z PLEASE STAY FOR A DEMONSTRATION AT THE
(2) The drawings show stages in the evolution of the human skeleton.
 The drawings show stages in the evolution of the human skeleton.") GENETICS AND EVOLUTION. Thornton College NAME.. Q. Charles Darwin proposed the theory of natural selection. (a) What is meant by natural selection? (b) The drawings show stages in the evolution of the
GENETICS AND EVOLUTION. Thornton College NAME.. Q. Charles Darwin proposed the theory of natural selection. (a) What is meant by natural selection? (b) The drawings show stages in the evolution of the
The Evolution of Speech
 The Evolution of Speech Q: How did speech arise in humans? A: We don t know. 1 How did speech arise in humans? scholars: interminable, acrimonious debates limited scientific data 1860: Paris Linguistic
Phylogenetic Affinities of Homo floresiensis incorporating postcranial characters
 City University of New York (CUNY) CUNY Academic Works School of Arts & Sciences Theses Hunter College Summer 8-10-2017 Phylogenetic Affinities of Homo floresiensis incorporating postcranial characters
Review sheet for the material covered by exam III
 Review sheet for the material covered by exam III WARNING: Like last time, I have tried to be complete, but I may have missed something. You are responsible for all the material discussed in class. This
Ch. 19 The Neogene World
 Ch. 19 The Neogene World Neogene Period includes Miocene, Pliocene and Pleistocene epochs Beginning of Holocene was approx. 12,000 years ago 12,000 years Cenozoic 1.8 5.3 Neogene 24 Paleogene 65 Holocene
Although there is much disagreement about the taxonomic
 Detecting genetic drift versus selection in human evolution Rebecca Rogers Ackermann* and James M. Cheverud *Department of Archaeology, University of Cape Town, Private Bag, Rondebosch 7701, South Africa;
Phylogenies & Classifying species (AKA Cladistics & Taxonomy) What are phylogenies & cladograms? How do we read them? How do we estimate them?
 What are phylogenies & cladograms? How do we read them? How do we estimate them?") Phylogenies & Classifying species (AKA Cladistics & Taxonomy) What are phylogenies & cladograms? How do we read them? How do we estimate them? Carolus Linneaus:Systema Naturae (1735) Swedish botanist &
Phylogenies & Classifying species (AKA Cladistics & Taxonomy) What are phylogenies & cladograms? How do we read them? How do we estimate them? Carolus Linneaus:Systema Naturae (1735) Swedish botanist &
ANTH 3412 Hominin Evolution
 ANTH 3412 Hominin Evolution Course time and location Course: ANTH 3412 Hominin Evolution Semester: Lectures (section 3412.10): Tuesdays and Thursdays, 9.35am 10.50am. Monroe Hall, room 114. Labs (sections
Phylogeny 9/8/2014. Evolutionary Relationships. Data Supporting Phylogeny. Chapter 26
 Phylogeny Chapter 26 Taxonomy Taxonomy: ordered division of organisms into categories based on a set of characteristics used to assess similarities and differences Carolus Linnaeus developed binomial nomenclature,
Paleoanthropology. The dawn of Homo floresiensis
 Paleoanthropology The dawn of Homo floresiensis New fossil findings from the Mata Menge site demonstrate that Homo floresiensis lived on the Indonesian island of Flores at least 700,000 years ago, and
Journal of Human Evolution (2001) 40, doi: /jhev Available online at on
 40, doi: /jhev Available online at on") Robert C. McCarthy Doctoral Program in Hominid Paleobiology, Department of Anthropology, The George Washington University, 2110 G St., NW Washington, DC 20052, U.S.A. E-mail: mccart@gwu.edu Received 25
Robert C. McCarthy Doctoral Program in Hominid Paleobiology, Department of Anthropology, The George Washington University, 2110 G St., NW Washington, DC 20052, U.S.A. E-mail: mccart@gwu.edu Received 25
Lab #9. Trends in the evolution of Homo, early "modern" H. sapiens
 Lab #9. Trends in the evolution of Homo, early "modern" H. sapiens NOTE: There are 3 goals to this lab. First, you have an opportunity to review various fossil Homo specimens and take notes on their morphology.
Homework Assignment, Evolutionary Systems Biology, Spring Homework Part I: Phylogenetics:
 Homework Assignment, Evolutionary Systems Biology, Spring 2009. Homework Part I: Phylogenetics: Introduction. The objective of this assignment is to understand the basics of phylogenetic relationships
PHYLOGENY WHAT IS EVOLUTION? 1/22/2018. Change must occur in a population via allele
 PHYLOGENY EXERCISE 1 AND 2 WHAT IS EVOLUTION? The theory that all living organisms on earth are related and have a common ancestor. These organism have changed over time and are continuing to change. Changes
I. Short Answer Questions DO ALL QUESTIONS
 EVOLUTION 313 FINAL EXAM Part 1 Saturday, 7 May 2005 page 1 I. Short Answer Questions DO ALL QUESTIONS SAQ #1. Please state and BRIEFLY explain the major objectives of this course in evolution. Recall
Cladistics and Bioinformatics Questions 2013
 AP Biology Name Cladistics and Bioinformatics Questions 2013 1. The following table shows the percentage similarity in sequences of nucleotides from a homologous gene derived from five different species
--Therefore, congruence among all postulated homologies provides a test of any single character in question [the central epistemological advance].
![--Therefore, congruence among all postulated homologies provides a test of any single character in question [the central epistemological advance].](/thumbs/86/93197257.jpg "--Therefore, congruence among all postulated homologies provides a test of any single character in question [the central epistemological advance].") Integrative Biology 200A "PRINCIPLES OF PHYLOGENETICS" Spring 2008 University of California, Berkeley B.D. Mishler Jan. 29, 2008. The Hennig Principle: Homology, Synapomorphy, Rooting issues The fundamental
Integrative Biology 200A "PRINCIPLES OF PHYLOGENETICS" Spring 2008 University of California, Berkeley B.D. Mishler Jan. 29, 2008. The Hennig Principle: Homology, Synapomorphy, Rooting issues The fundamental
Taxonomical uses of the species concept in the human lineage
 Human Origins Research 2012; volume 2:e1 Taxonomical uses of the species concept in the human lineage Camilo J. Cela-Conde, Marcos Nadal Laboratory of Human Systematics, University of the Balearic Islands,
Human Evolution. Chapter Learning objectives Laboratory exercises Primates. Sebastián Vélez and Eli Minkoff
 Chapter 12 Human Evolution Sebastián Vélez and Eli Minkoff 12.1 Learning objectives 1. Understand the evolutionary relationships among primates. 2. Describe the evolutionary relationships between chimps,
Characterizing the Evolutionary Path(s) to Early Homo
 to Early Homo") RESEARCH ARTICLE Characterizing the Evolutionary Path(s) to Early Homo Lauren Schroeder 1, Charles C. Roseman 2, James M. Cheverud 3, Rebecca R. Ackermann 1 * 1. Department of Archaeology, University of
RESEARCH ARTICLE Characterizing the Evolutionary Path(s) to Early Homo Lauren Schroeder 1, Charles C. Roseman 2, James M. Cheverud 3, Rebecca R. Ackermann 1 * 1. Department of Archaeology, University of
Introduction to Human Evolution Anthropology 102 KY150
 Introduction to Human Evolution Anthropology 102 KY150 Professor: Kate Pechenkina, Ph. D. Office: Powdermaker Hall 312A Telephone: (718) 997-5529 Fax: (718) 997-2885 E-mail: ekaterina.pechenkina@qc.cuny.edu
Phylogenetics: Bayesian Phylogenetic Analysis. COMP Spring 2015 Luay Nakhleh, Rice University
 Phylogenetics: Bayesian Phylogenetic Analysis COMP 571 - Spring 2015 Luay Nakhleh, Rice University Bayes Rule P(X = x Y = y) = P(X = x, Y = y) P(Y = y) = P(X = x)p(y = y X = x) P x P(X = x 0 )P(Y = y X
Evolution and Taxonomy Laboratory
 Evolution and Taxonomy Laboratory 1 Introduction Evolution refers to the process by which forms of life have changed through time by what is described as descent with modification. Evolution explains the
Cladistic Analysis of Juvenile and Adult Hominoid Cranial Shape Variables. Thomas A. DiVito II. A Thesis Submitted to the Faculty of
 Cladistic Analysis of Juvenile and Adult Hominoid Cranial Shape Variables by Thomas A. DiVito II A Thesis Submitted to the Faculty of The Dorothy F. Schmidt College of Arts and Letters in Partial Fulfillment