W I N D R E S O U R C E A S S E S S M E N T
|
|
|
- Bertram Walters
- 6 years ago
- Views:
Transcription


1 W I N D R E S O U R C E A S S E S S M E N T Annual Energy Production Project: Hundhammer_WS_Express Layout: Layout1 Customer: WindSim WindSim AS Fjordgaten 15, N Tønsberg, Norway phone.: info@windsim.com Page of
2 1. Executive Summary This report provides the wind resource assessment and the Annual Energy Production (AEP) for the project: Hundhammer_WS_Express. These data have been derived from numerical flow modeling which has been weighted against the local wind climate. The local wind climate is either obtained from on-site measurements or from reanalysis datasets, in any case it is representing the long-term average wind climate at the site and it is referred to as a climatology object. The following climatology objects have been provided: Climatology name Climatology1 Table 1.1 File name Representative period Hundhammer_83m 27/04/ :56-30/04/ :36 Key climatology object characteristics Measurement height (m) Average wind speed(m/s) The above climatology objects have been used in the estimation of the gross AEP, the full load hours and capacity factor. The average wind speed for the wind farm is the average of the wind speeds at all turbine positions at hub height without wake effects. No losses of any kind have been included, except the wake losses which has been applied in the estimation of "AEP with wake losses". Turbine Type Hub Height (m) No. of turbines Capacity (MW) Gross AEP (GWh/y) Average wind speed (m/s) Wake losses (%) AEP with wake losses (GWh/y) Full load hours (hours) Capacity factor(%) Table 1.2 Key wind farm and production characteristics 1.1 Disclaimer This report represents, to the best of our knowledge, the state-of-art within wind resource assessment methods and annual energy production estimation. Efforts have been made to secure reliable results, although customer supplied input data is out of our control. WindSim AS affirms that the software has been tested with due care. However, this software, like all software products, may show deficiencies during use, which have escaped detection. WindSim AS cannot in any way be held responsible neither to the use of the findings in this report nor for any direct or indirect losses arising from such use or from errors of any kind in the report content. Page 2 of 29
3 Table of Contents 1. Executive Summary 1.1. Disclaimer Table of Contents 2. Preamble 3. Local wind climate 4. Wind farm layout and turbines 5. Numerical simulations 5.1. Digital Terrain Model D model setup 5.3. Simulations 6. Annual Energy Production AEP 6.1. Wind resource map 6.2. Energy production estimation Appendix 1 Methodology Appendix 2 - Online digital terrain models Page 3 of 29
4 2. Preamble This report provides the wind resource assessment and the Annual Energy Production (AEP) for the wind farm project: Hundhammer_WS_Express. These data have been derived using WindSim Express; a CFD (Computational Fluid Dynamics) based micrositing software operated in three simple steps. First, name the project. Second, position the turbines and introduce the local wind climate through so called climatology objects. WindSim Express automatically downloads a terrain model of the area of interest. Finally, the resolution of the numerical model is set in accordance with the available computer resources. WindSim Express can be run on a local computer or on a remote server, so called Cloud Computing; visit This report is automatically generated after the execution of the above described three steps. For a more details description of the methodology see Appendix 1. Figure 2.1 Definition sketch of WindSim Express procedure, 1) Name the project, 2) introduce turbines and local wind climate, 3) set resolution and run wind field simulations Page 4 of 29
5 3. Local wind climate The average wind condition at the site is used in calibration of the wind resources and in the annual energy production estimation. A wind climatology is presented as a wind rose, giving the average wind speed distribution divided in velocity intervals (bins) and wind directions (sectors). The original wind speed data are divided in 50 bins, whereas in the graphical wind rose presentation all occurrences of wind speeds above 16 m/s have been accumulated in the bin above 16 m/s. Incoming wind directions are divided in 36 sectors, where the first sector is centered around north. The frequency distribution has been fitted to a Weibull distribution. Page 5 of 29

 and frequency distribution with Weibull fitting (right) for all sectors 1 2 3 4 5 6 7 8 9 10 11 12 Average wind speed (m/s) 5.91 4.92 4.70 4.30 4.68 4.15 4.02 3.82 5.07 6.34 6.83 8.")
 9.07 10.31 9.08 7.90 7.86 7.86 7.23 6.75 6.33 8.01 9.98 10.01 Frequency (%) 5.94 7.42 5.86 5.68 5.72 4.")
6 3.1 Climatology: Hundhammer_83m File name Hundhammer_83m Period, # records 27/04/ :56-30/04/ : Position: easting, northing, z (agl) Average wind speed, Weibull k, A Table 3.1 Climatology characteristics including average wind speed (m/s) for all sectors, Weibull shape (k) and scale (A) parameters for all sectors Figure 3.1 Wind rose (left) and frequency distribution with Weibull fitting (right) for all sectors Average wind speed (m/s) Frequency (%) Weibull shape, k Weibull scale, A Average wind speed (m/s) Frequency (%) Weibull shape, k Weibull scale, A Average wind speed (m/s) Frequency (%) Weibull shape, k Weibull scale, A Table 3.1a Average wind speed, frequency and Weibull shape (k) and scale (A) parameters versus sectors Page 6 of 29
7 4. Wind farm layout and turbines The wind farm consists of 19 turbines. The layout is presented in figure 4.1 and the turbine positions are given in table 4.1. The technical specifications of the wind turbines proposed to be used in the wind farm project are given in table 4.2. Figure 4.1 Wind farm layout; triangles represent turbines, dots represent climatologies Turbine name Turbine type Hub height Easting Northing z Turbine Turbine Turbine Turbine Turbine Turbine Turbine Turbine Turbine Turbine Turbine Turbine Turbine Page 7 of 29

8 Turbine Turbine Turbine Turbine Turbine Turbine Table 4.1 Turbine type Turbine names, types and positions mode0_hubheight100_105.2db( Wind Speed (m/s) Power (kw) Thrust coefficient Rated wind speed (m/s) Cut-in wind speed (m/s) Cut-off wind speed (m/s) Diameter (m) Air density (kg/m3) kg/m Table 5.2 Turbine characteristics with power coefficient and thrust coefficient for air density of Page 8 of 29


9 5. Numerical simulations A numerical wind database is established by simulations CFD. The numerical wind database is used to transfer the wind conditions from the measurement point to the wind turbine hub positions. This chapter describes how the numerical model is set up, simulated and validated. 5.1 Digital Terrain Model A digital terrain model containing elevation and roughness data has been established for the area given in table 5.1 and figure 5.1. The coordinate system is UTM, Zone: 33, Datum: WGS_84, which is the coordinate system referred to whenever coordinates are used in this report. Note that the underlying datasets for elevation and roughness might have different resolution. The following online sources have been used for elevation: ASTER GDEM Worldwide Elevation Data (1.5-arc-second Resolution) and for roughness: CORINE Land Cover Europe (100 m Resolution), see appendix 2 for details. Min (m) Max (m) Extension (m) Resolution Terrain Data (m) Easting (m) Northing (m) Table 5.1 Coordinates, extensions and resolution of the digital terrain model referring to coordinate system: UTM, Zone: 33, Datum: WGS_84 Figure 5.1 Terrain elevation (m) (left) and roughness (m) (right) The complexity at the site depends on the changes in elevation and roughness. The complexity in elevation is visualized by the inclination angles, which are derived quantities expressing the first order derivatives of the elevation. Page 9 of 29
 (left) and")
10 Figure 5.2 Terrain inclination (deg) (left) and logarithmic roughness (m) (right) Page 10 of 29

 and schematic view of the vertical grid resolution (right) Easting Northing z Total Grid spacing (m) 18.2-225.2 18.2-282.")
11 5.2 3D model setup The elevation and roughness data defined above is used to define the ground level of a three-dimensional domain divided in cells with a variable horizontal and vertical resolution. The grid is generated and optimized from the digital terrain model. Horizontally the grid is refined around the wind farm with expansions towards the outer borders. Vertically the resolution is uniform from ground level to the top of the rotor followed by an expansion towards the top border, as seen in figure 5.3. Figure 5.3 Horizontal grid resolution (left) and schematic view of the vertical grid resolution (right) Easting Northing z Total Grid spacing (m) Variable - Number of cells Table 5.2 Grid spacing and number of cells The grid extends 947 (m) above the point in the terrain with the highest elevation. The grid is refined towards the ground. The left and right columns display a schematic view of the distribution at the position with maximum and minimum elevation respectively. The nodes, where results from the simulations are available, are situated in the cell centers indicated by dots z-dist. max (m) z-dist. min (m) Table Simulations Distribution of the first 10 nodes in z-direction, relative to the ground, at the position with maximum and minimum elevation The digital model represents the computational domain where the Reynolds averaged Navier Stokes equations have been numerically solved. In total 36 simulations have been performed in order to have a 3D wind field for every 10 degree sector. The simulation time and the number of iteration to reach a converged Page 11 of 29
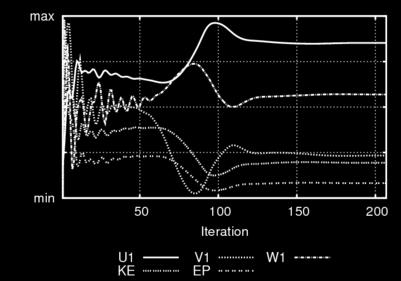
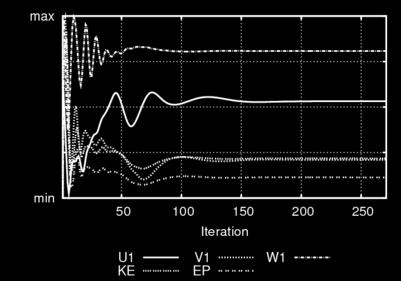
12 solution for each sector is given in table 5.5. The column "Status" should display a "C" indicating that the numerical procedure has converged, which means that the found solution actually is a solution of our specified problem. If the solution procedure don't find a solution the "Status" will display a "D" for divergence, or a "-" indicating that the solution procedure reach the maximum set number of iterations before a converged solution was found. Height of boundary layer (m) Speed above boundary layer (m/s) 10.0 Boundary condition at the top Potential temperature Turbulence model Solver fix pres. No Standard Maximum iterations 500 Table 5.4 Solver settings Sectors Simulation time Iterations Status Sectors Simulation time Iterations Status :09: C :31: C :39: C :33: C :54: C :02: C :44: C :00: C :09: C :45: C :53: C :50: C :39: C :52: C :13: C :46: C :23: C :44: C :00: C :48: C :56: C :49: C :44: C :51: C :33: C :13: C :29: C :50: C :19: :18: :50: C :44: C :21: :56: C :18: :22: Table 5.5 Simulation time, number of iterations and convergence status GCV Page 12 of 29
. All variables are scaled according to the minimum and maximum values obtained during the simulation.")
 and spot values (right) for sector 000 Figure 5.2 Residuals (left) and spot values (right) for sector 010 Figure 5.")
13 The convergence of the wind field simulations is evaluated by inspection of the spot and residual values for the velocity components (U1,V1,W1), the turbulent kinetic energy (KE) and its dissipation rate (EP). All variables are scaled according to the minimum and maximum values obtained during the simulation. The simulation stops automatically when the solution falls below a certain convergence criteria and then the solution is said to be converged. Figure 5.1 Residuals (left) and spot values (right) for sector 000 Figure 5.2 Residuals (left) and spot values (right) for sector 010 Figure 5.3 Residuals (left) and spot values (right) for sector 020 Figure 5.4 Residuals (left) and spot values (right) for sector 030 Page 13 of 29
 and spot values (right) for")
 for sector 050 7 Residuals (left) and")
 and spot values (right) for sector 070")
14 Figure 5.5 Residuals (left) and spot values (right) for sector 040 Figure 5.6 Residuals (left) and spot values (right) for sector 050 Figure 5.7 Residuals (left) and spot values (right) for sector 060 Figure 5.8 Residuals (left) and spot values (right) for sector 070 Page 14 of 29
 and spot values")
 and spot values (right) for")

15 Figure 5.9 Residuals (left) and spot values (right) for sector 080 Figure 5.10 Residuals (left) and spot values (right) for sector 090 Figure 5.11 Residuals (left) and spot values (right) for sector 100 Figure 5.12 Residuals (left) and spot values (right) for sector 110 Page 15 of 29
 and spot values (right) for")
 for sector 130 15 Residuals (left) and")
 and spot values (right) for sector 150")
16 Figure 5.13 Residuals (left) and spot values (right) for sector 120 Figure 5.14 Residuals (left) and spot values (right) for sector 130 Figure 5.15 Residuals (left) and spot values (right) for sector 140 Figure 5.16 Residuals (left) and spot values (right) for sector 150 Page 16 of 29
 and spot values")
 and spot values (right) for")

17 Figure 5.17 Residuals (left) and spot values (right) for sector 160 Figure 5.18 Residuals (left) and spot values (right) for sector 170 Figure 5.19 Residuals (left) and spot values (right) for sector 180 Figure 5.20 Residuals (left) and spot values (right) for sector 190 Page 17 of 29
18 Figure 5.21 Residuals (left) and spot values (right) for sector 200 Figure 5.22 Residuals (left) and spot values (right) for sector 210 Figure 5.23 Residuals (left) and spot values (right) for sector 220 Figure 5.24 Residuals (left) and spot values (right) for sector 230 Page 18 of 29
 and spot values (right) for sector 240 26 Residuals")
 for sector 260 28 Residuals (left) and spot values")
19 Figure 5.25 Residuals (left) and spot values (right) for sector 240 Figure 5.26 Residuals (left) and spot values (right) for sector 250 Figure 5.27 Residuals (left) and spot values (right) for sector 260 Figure 5.28 Residuals (left) and spot values (right) for sector 270 Page 19 of 29
 and spot values (right) for sector 280 30 Residuals")
 for sector 300 32 Residuals (left) and spot values")
20 Figure 5.29 Residuals (left) and spot values (right) for sector 280 Figure 5.30 Residuals (left) and spot values (right) for sector 290 Figure 5.31 Residuals (left) and spot values (right) for sector 300 Figure 5.32 Residuals (left) and spot values (right) for sector 310 Page 20 of 29
 and spot values (right) for sector 330 Figure 5.35 Residuals (left) and spot values (right) for sector 340 Figure 5.")
21 Figure 5.33 Residuals (left) and spot values (right) for sector 320 Figure 5.34 Residuals (left) and spot values (right) for sector 330 Figure 5.35 Residuals (left) and spot values (right) for sector 340 Figure 5.36 Residuals (left) and spot values (right) for sector 350 Page 21 of 29

22 6. Annual Energy Production - AEP The wind resource map and the annual energy production have been calculated based upon the long term on-site wind conditions and CFD results. 6.1 Wind resource map The wind resource map is used to identify the high wind speed area based on the average wind speed. The wind resource map is established by weighting the CFD results against the expected average conditions given as input. If several climatologies are available the wind resource map is based on them all, by weighting based on the inverse radial distance to each climatology. Figure 6.1 The wind resource map with average wind speed (m/s) at a hub height of 80 meters. Triangle: wind turbine, Dot: climatology Page 22 of 29
23 6.2 Energy production estimation The gross energy production is the energy production of the wind farm calculated by predicted free stream wind speed distribution at the hub height of each turbine location and the turbine s power curve provided by manufacturers. The free stream wind speed distribution is obtained by the WindSim flow model and the long term on-site wind conditions. Wind turbines extract energy from the wind. The wind speed downstream from the wind turbine is therefore reduced. As the flow proceeds further, the wake is spreading and recovers towards free stream conditions. The wake effect is calculated by the WindSim wake model. Then the potential energy production is obtained by taken into account of the wake losses, using the Jensen wake model [Katic, I., Højstrup, J., Jensen, N.O. "A Simple Model for Cluster Efficiency" EWEC Proceedings, 7-9 October 1986, Rome, Italy]. Turbine Type Hub Height (m) No. of turbines Capacity (MW) Gross AEP (GWh/y) Average wind speed (m/s) Wake losses (%) AEP with wake losses (GWh/y) Full load hours (hours) Capacity factor(%) mode0_hubheigh t100_105.2db(a) Table 6.1 Key wind farm and production characteristics Climatology name Gross AEP (GWh/y) AEP with wake losses (GWh/y) Wake losses (GWh/y) Wake losses (%) Climatology Table 6.2 Energy production in GWh/y based on climatology represented by the frequency distribution Turbine name Turbine1 Turbine2 Turbine3 Turbine4 Turbine5 Turbine6 Turbine7 Turbine8 Turbine9 Turbine10 Turbine11 Turbine12 Turbine13 Turbine type Air density (kg/m3) Average wind speed (m/s) Gross AEP (GWh/y) Wake Losses (%) AEP with wake losses (GWh/y) Full load hours (hours) Page 23 of 29
24 Turbine Turbine Turbine Turbine Turbine Turbine Table 6.3 Annual energy production per turbine Page 24 of 29


 equations are numerically solved.")
25 Appendix 1 - Methodology Numerical flow modeling, based on Computational Fluid Dynamics (CFD), is used to transfer the wind conditions from a measurement point to the wind turbine positions at hub height. These chapters describe how a digital terrain model is used to establish the 3D numerical flow model. How the wind fields are simulated within the 3D numerical flow model, and finally how the numerical results are scaled against the local wind climate giving the wind resource map and estimates of the Annual Energy Production, AEP. The local wind climate can be obtained from on-site measurements or alternatively from reanalysis datasets, which uses observational data and a Numerical Weather Prediction (NWP) model over an extended historical period. Figure 1.1 The Wind Resource Assessment procedure including the AEP estimation consists of the following steps: Digital terrain model - 3D numerical flow model - Wind field simulations - Local wind climate - Wind resource map - Annual Energy Production, AEP. The following site specific analyses are presented: Location of the site Expected average wind conditions at the site Wind farm configuration Used input terrain data Selected configuration of the model Modeled wind resource Energy yield assessment Modeling is needed in order to transfer the measured wind distribution at mast position to any other position within the wind farm, and thereby obtain a high resolution three dimensional wind resource map. The local wind field is affected by the terrain. This information is given to the software through a digital terrain model which includes terrain height and roughness data. Publicly available terrain data are used to establish a domain where the RANS (Reynolds Averaged Navier Stokes) equations are numerically solved. 36 RANS simulations are performed in order to have a 3D wind field for every wind direction. The expected average wind conditions at the site are used to scale the simulations and obtain the wind resource in the 3D domain. Wind measurements at different height/position are used also as a means to quality check the results from the CFD simulations in terms of horizontal/vertical extrapolation of wind speed and turbulence. The gross energy production is the energy production of the wind farm calculated by predicted free stream wind speed distribution at hub height of each turbine location and the turbine s power curve provided by the manufacturer. The power curve is individually corrected based on the average air density at every Page 25 of 29

26 turbine site. The free stream wind speed distribution is obtained by the WindSim flow model and long term on-site wind conditions. The power curve is adjusted by the difference of the predicted long term annual onsite air density and the air density stated in the manufacture s power curve. Wind turbines extract energy from the wind. The wind speed downstream from the wind turbine is therefore reduced. As the flow proceeds further, the wake is spreading and recovers towards free stream conditions. The wake effect is calculated by an analytical wake model and then the potential annual energy production is obtained taking into account the wake losses. The overview of the three processes is shown in Figure 1.2. Figure 1.2 Flow chart for AEP assessment using WindSim Express. Page 26 of 29
27 Appendix 2 - Online digital terrain models Various online digital terrain and roughness models are available. The coverage varies from local to global and the resolution varies from 500 to 30 m. ASTER GDEM Worldwide Elevation data set (1.5 Arc-Second Resolution) SRTM Worldwide Elevation Data (3 Arc-Second Resolution) United States Elevation Data (NED) (10 or 30 m Resolution) Roughness is based upon Corine Land Cover Europe (100 m resolution) VCF Tree Cover Worldwide 2005 (500 m Resolution) NLCD 2006 (US National Land Cover Database (30 m Resolution) Land Cover Roughness length (m) Continuous urban fabric 2.0 Discontinuous urban fabric 1.0 Industrial or commercial units 0.8 Road and rail networks and associated land 0.3 Port areas 0.8 Airports 0.03 Mineral extraction sites 0.1 Dump sites 0.1 Construction sites 0.1 Green urban areas 0.3 Sport and leisure facilities 0.5 Non-irrigated arable land 0.01 Permanently irrigated land 0.01 Rice fields 0.01 Vineyards 0.25 Fruit trees and berry plantations 0.25 Olive groves 0.25 Pastures 0.03 Annual crops associated with permanent crops 0.05 Complex cultivation patterns 0.05 Land principally occupied by agriculture 0.1 Agro, forestry areas 0.8 Broad, leaved forest 0.8 Coniferous forest 0.8 Page 27 of 29
28 Mixed forest 0.8 Natural grasslands 0.03 Moors and heathland 0.02 Sclerophyllous vegetation 0.02 Transitional woodland, shrub 0.5 Beaches, dunes, sands Bare rocks Sparsely vegetated areas 0.2 Burnt areas 0.1 Glaciers and perpetual snow Inland marshes 0.1 Peat bogs 0.03 Salt marshes 0.01 Salines 0.01 Intertidal flats 0.01 Water courses 0.01 Water Bodies Coastal lagoons 0.01 Estuaries 0.01 Sea and ocean Table A2.1 Corine Land Cover Europe Land Cover Roughness length (m) No Data Value, Alaska Zones Only Open Water 0.03 Perennial Ice/Snow Developed, Open Space 0.4 Developed, Low Intensity 0.6 Developed, Medium Intensity 1 Developed, High Intensity 1.5 Barren Land (Rock/Sand/Clay) 0.1 Unconsolidated Shore 0.05 Deciduous Forest 1.4 Evergreen Forest 1.4 Mixed Forest 1.4 Dwarf Scrub 0.05 Shrub/Scrub 1 Grassland/Herbaceous 0.05 Grassland/Herbaceous 0.05 Lichens 0.2 Moss 0.2 Page 28 of 29
29 Pasture/Hay 0.03 Cultivated Crops 0.01 Woody Wetlands 1 Palustrine Forested Wetland 1 Palustrine Scrub/Shrub Wetland 1 Estuarine Forested Wetland 1 Estuarine Scrub/Shrub Wetland 1 Emergent Herbaceous Wetlands 0.1 Table A2.2 NLCD 2006 Page 29 of 29
SIF_7.1_v2. Indicator. Measurement. What should the measurement tell us?
 Indicator 7 Area of natural and semi-natural habitat Measurement 7.1 Area of natural and semi-natural habitat What should the measurement tell us? Natural habitats are considered the land and water areas
Geometric and Landcover Signatures of Local Authorities in Peloponnesus
 Geometric and Landcover Signatures of Local Authorities in Peloponnesus GEORGE CH. MILIARESIS Department of Geology University of Patras Geology Department, University of Patras, Rion 265-04 GREECE gmiliar@upatras.gr
CORINE LAND COVER CROATIA
 CORINE LAND COVER CROATIA INTRO Primary condition in making decisions directed to land cover and natural resources management is presence of knowledge and high quality information about biosphere and its
Utility of National Spatial Data for Conservation Design Projects
 Utility of National Spatial Data for Conservation Design Projects Steve Williams Biodiversity and Spatial Information Center North Carolina State University PIF CDW St. Louis, MO April 11, 2006 Types of
Estimating Probability of Success Rate
 Estimating Probability of Success Rate Don Ferguson, PhD A member of Appalachian Search and Rescue Conference Objective Provide SAR planners with a tool to help optimize effort allocation based on a number
Wake modeling with the Actuator Disc concept
 Available online at www.sciencedirect.com Energy Procedia 24 (212 ) 385 392 DeepWind, 19-2 January 212, Trondheim, Norway Wake modeling with the Actuator Disc concept G. Crasto a *, A.R. Gravdahl a, F.
Effects of input DEM data spatial resolution on Upstream Flood modeling result A case study in Willamette river downtown Portland
 Effects of input DEM data spatial resolution on Upstream Flood modeling result A case study in Willamette river downtown Portland By Hue Duong GEOG 593 Fall 2015 Digital Terrain Analysis Photo: Anh Duc
The HSMU approach in CAPRI-DYNASPAT (Homogeneous Spatial Mapping Units)
") CAP Regional Impact Assessment - DYNAmic and SPATial dimension The HSMU approach in CAPRI-DYNASPAT (Homogeneous Spatial Mapping Units) Adrian Leip, Giulio Marchi Climate Change Unit / Joint Research Centre
CAP Regional Impact Assessment - DYNAmic and SPATial dimension The HSMU approach in CAPRI-DYNASPAT (Homogeneous Spatial Mapping Units) Adrian Leip, Giulio Marchi Climate Change Unit / Joint Research Centre
Alexander Abboud, Jake Gentle, Tim McJunkin, Porter Hill, Kurt Myers Idaho National Laboratory, ID USA
 Dynamic Line Ratings and Wind Farm Predictions via Coupled Computational Fluid Dynamics and Weather Data Alexander Abboud, Jake Gentle, Tim McJunkin, Porter Hill, Kurt Myers Idaho National Laboratory,
South Florida Coastal Storm Surge and Mapping Study
 South Florida Coastal Storm Surge and Mapping Study Presented by Christopher Bender, Ph.D., P.E., D.CE June 2, 2015 Presentation Overview FEMA risk studies outline Overview South Florida surge study Work
Generating Virtual Wind Climatologies through the Direct Downscaling of MERRA Reanalysis Data using WindSim
 Generating Virtual Wind Climatologies through the Direct Downscaling of MERRA Reanalysis Data using WindSim WindSim Americas User Meeting December 4 th, 2014 Orlando, FL, USA Christopher G. Nunalee cgnunale@ncsu.edu
The stability of ecological corridors as illustrated by examples from Poland
 Gerlée A., 11. The stability of ecological corridors as illustrated by examples from Poland. The Problems of Landscape Ecology. Vol. XXX. 371-376. The stability of ecological corridors as illustrated by
Global Land Cover Mapping
 Global Land Cover Mapping and its application in SDGs Prof. Chen Jun 1, Dr. He Chaoying 2 1 National Geomatics Center of China (NGCC) 2 Ministry of Natural Resources, P.R.China May 30, 2018, Copenhagen
Spatial Disaggregation of Land Cover and Cropping Information: Current Results and Further steps
 CAPRI CAPRI Spatial Disaggregation of Land Cover and Cropping Information: Current Results and Further steps Renate Koeble, Adrian Leip (Joint Research Centre) Markus Kempen (Universitaet Bonn) JRC-AL
NATIONAL VEGETATION CLASSIFICATION STANDARD, VERSION 2 WORKING DRAFT
 NATIONAL VEGETATION CLASSIFICATION STANDARD, VERSION 2 WORKING DRAFT Subcommittee Federal Geographic Data Committee SUMMMARY NatureServe version 31 August 2006 INTRODUCTION The United States Federal Geographic
CHAPTER 1 THE UNITED STATES 2001 NATIONAL LAND COVER DATABASE
 CHAPTER 1 THE UNITED STATES 2001 NATIONAL LAND COVER DATABASE Collin Homer*, Jon Dewitz, Joyce Fry, and Nazmul Hossain *U.S. Geological Survey (USGS) Center for Earth Resources Observation and Science
Sensitivity of AERSURFACE Results to Study Area and Location. Paper 2009-A-127-AWMA
 Sensitivity of AERSURFACE Results to Study Area and Location Paper 2009-A-127-AWMA Prepared by: Anthony J. Schroeder, CCM Senior Consultant George J. Schewe, CCM, QEP Principal Consultant Trinity Consultants
Urban-Rural spatial classification of Finland
 Urban-Rural spatial classification of Finland Finnish Environment Institute SYKE The geographical information-based area classification system has been created by the Finnish Environment Institute and
An Internet-based Agricultural Land Use Trends Visualization System (AgLuT)
") An Internet-based Agricultural Land Use Trends Visualization System (AgLuT) Second half yearly report 01-01-2001-06-30-2001 Prepared for Missouri Department of Natural Resources Missouri Department of
An Internet-based Agricultural Land Use Trends Visualization System (AgLuT) Second half yearly report 01-01-2001-06-30-2001 Prepared for Missouri Department of Natural Resources Missouri Department of
Extent. Level 1 and 2. October 2017
 Extent Level 1 and 2 October 2017 Overview: Extent account 1. Learning objectives 2. Review of Level 0 (5m) 3. Level 1 (Compilers): Concepts (15m) Group exercise and discussion (15m) 4. Level 2 (Data Providers)
2.1.2 Land cover data
 2.1.2 Land cover data Land cover data was used as an approximate measure of the different habitat groupings throughout Britain. Land cover data was obtained from three sources The European Environment
Targeted LiDAR use in Support of In-Office Address Canvassing (IOAC) March 13, 2017 MAPPS, Silver Spring MD
 March 13, 2017 MAPPS, Silver Spring MD") Targeted LiDAR use in Support of In-Office Address Canvassing (IOAC) March 13, 2017 MAPPS, Silver Spring MD Imagery, LiDAR, and Blocks In 2011, the GEO commissioned independent subject matter experts (Jensen,
Targeted LiDAR use in Support of In-Office Address Canvassing (IOAC) March 13, 2017 MAPPS, Silver Spring MD Imagery, LiDAR, and Blocks In 2011, the GEO commissioned independent subject matter experts (Jensen,
Appendix E: Cowardin Classification Coding System
 Appendix E: Cowardin Classification Coding System The following summarizes the Cowardin classification coding system and the letters and numbers used to define the USFWS NWI wetland types and subtypes:
Interim (5 km) High-Resolution Wind Resource Map for South Africa
 High-Resolution Wind Resource Map for South Africa") Interim (5 km) High-Resolution Wind Resource Map for South Africa Metadata and further information October 2017 METADATA Data set name Interim (5 km) High-Resolution Wind Resource Map for South Africa
Interim (5 km) High-Resolution Wind Resource Map for South Africa Metadata and further information October 2017 METADATA Data set name Interim (5 km) High-Resolution Wind Resource Map for South Africa
Lesson Plan 3 Land Cover Changes Over Time. An Introduction to Land Cover Changes over Time
 An Introduction to Land Cover Changes over Time This lesson plan builds on the lesson plan on Understanding Land Use and Land Cover Using Google Earth. Please refer to it in terms of definitions on land
Miami-Dade County Technical Update Meeting South Florida Coastal Study. May 11, 2016
 Miami-Dade County Technical Update Meeting South Florida Coastal Study May 11, 2016 Welcome and Introductions FEMA Region IV Christina Lindemer Technical Lead Production and Technical Services (PTS) Contractor
Yaneev Golombek, GISP. Merrick/McLaughlin. ESRI International User. July 9, Engineering Architecture Design-Build Surveying GeoSpatial Solutions
 Yaneev Golombek, GISP GIS July Presentation 9, 2013 for Merrick/McLaughlin Conference Water ESRI International User July 9, 2013 Engineering Architecture Design-Build Surveying GeoSpatial Solutions Purpose
June 2011 Wind Speed Prediction using Global and Regional Based Virtual Towers in CFD Simulations
 June 2011 Wind Speed Prediction using Global and Regional Based Virtual Towers in CFD Simulations Master of Science in Wind Power Project Management By Roger Moubarak Energy Technology at Gotland University
Geography Teach Yourself Series Topic 4: Global Distribution of Land Cover
 Geography Teach Yourself Series Topic 4: Global Distribution of Land Cover A: Level 14, 474 Flinders Street Melbourne VIC 3000 T: 1300 134 518 W: tssm.com.au E: info@tssm.com.au TSSM 2016 Page 1 of 7 Contents
Land cover types and ecological conditions of the Estonian coast
 Journal of Coastal Conservation 8: 109-117, 2002 EUCC; Opulus Press Uppsala. - Land cover types and ecological conditiond of the Estonian coast - 109 Land cover types and ecological conditions of the Estonian
Land accounting in Québec: Pilot project for a sub-provincial area
 Land accounting in Québec: Pilot project for a sub-provincial area Stéphanie Uhde 8th meeting of the London Group on Environmental Accounting Ottawa, 2 October, 2012 Province of Québec Area: 1 667 441
Principals and Elements of Image Interpretation
 Principals and Elements of Image Interpretation 1 Fundamentals of Photographic Interpretation Observation and inference depend on interpreter s training, experience, bias, natural visual and analytical
Validation of the ASTER Global Digital Elevation Model (GDEM) Version 2 over the Conterminous United States
 Version 2 over the Conterminous United States") Validation of the ASTER Global Digital Elevation Model (GDEM) Version 2 over the Conterminous United States U.S. Geological Survey Earth Resources Observation Science (EROS) Center Sioux Falls, South Dakota,
Validation of the ASTER Global Digital Elevation Model (GDEM) Version 2 over the Conterminous United States U.S. Geological Survey Earth Resources Observation Science (EROS) Center Sioux Falls, South Dakota,
UK NEA Economic Analysis Report Cultural services: Mourato et al. 2010
 Appendix A Hedonic regressions: Further data description The environmental data used to construct variables for the hedonic regressions come from the Centre for Ecology and Hydrology, the Generalised Land
An Integrated Storm Surge, Hurricane Wave, Salinity and Sediment Transport Modeling System for Breton Sound, LA
 An Integrated Storm Surge, Hurricane Wave, Salinity and Sediment Transport Modeling System for Breton Sound, LA Q. Jim Chen Department of Civil and Environmental Engineering qchen@lsu.edu Acknowledgements
Comparing CORINE Land Cover with a more detailed database in Arezzo (Italy).
.") Comparing CORINE Land Cover with a more detailed database in Arezzo (Italy). Javier Gallego JRC, I-21020 Ispra (Varese) ITALY e-mail: javier.gallego@jrc.it Keywords: land cover, accuracy assessment, area
Comparing CORINE Land Cover with a more detailed database in Arezzo (Italy). Javier Gallego JRC, I-21020 Ispra (Varese) ITALY e-mail: javier.gallego@jrc.it Keywords: land cover, accuracy assessment, area
A comparative and quantitative assessment of South Africa's wind resource the WASA project
 A comparative and quantitative assessment of South Africa's wind resource the WASA project Jens Carsten Hansen Wind Energy Division Risø DTU Chris Lennard Climate Systems Analysis Group University of Cape
DNV GL s empirical icing map of Sweden and methodology for estimating annual icing losses
 ENERGY DNV GL s empirical icing map of Sweden and methodology for estimating annual icing losses An update with further Nordic data Till Beckford 1 SAFER, SMARTER, GREENER Contents Experience from operational
Managing uncertainty when aggregating from pixels to parcels: context sensitive mapping and possibility theory
 Department of Geography Managing uncertainty when aggregating from pixels to parcels: context sensitive mapping and possibility theory Dr Lex Comber ajc36@le.ac.uk www.le.ac.uk/gg/staff/academic_comber.htm
Field validation of the RIX performance indicator for flow in complex terrain
 Downloaded from orbit.dtu.dk on: Sep 22, 2018 Field validation of the RIX performance indicator for flow in complex terrain Mortensen, Niels Gylling; Tindal, Andrew; Landberg, Lars Publication date: 2008
AERMOD Sensitivity to AERSURFACE Moisture Conditions and Temporal Resolution. Paper No Prepared By:
 AERMOD Sensitivity to AERSURFACE Moisture Conditions and Temporal Resolution Paper No. 33252 Prepared By: Anthony J Schroeder, CCM Managing Consultant TRINITY CONSULTANTS 7330 Woodland Drive Suite 225
Treatment of Land-Use and Urbanization
 Treatment of Land-Use and Urbanization LECTURE 9 Alexander Mahura Danish Meteorological Institute, DMI, Copenhagen, Denmark NetFAM Summer School on Integrated Modelling 7-12 July 2008, Zelenogorsk, Russia
Integration of WindSim s Forecasting Module into an Existing Multi-Asset Forecasting Framework
 Chad Ringley Manager of Atmospheric Modeling Integration of WindSim s Forecasting Module into an Existing Multi-Asset Forecasting Framework 26 JUNE 2014 2014 WINDSIM USER S MEETING TONSBERG, NORWAY SAFE
GENERALISATION OF THE TWO-SCALE MOMENTUM THEORY FOR COUPLED WIND TURBINE/FARM OPTIMISATION
 25 th National Symposium on Wind Engineering, Tokyo, Japan, 3-5 December 2018 第 25 回風工学シンポジウム (2018) GENERALISATION OF THE TWO-SCALE MOMENTUM THEORY FOR COUPLED WIND TURBINE/FARM OPTIMISATION Takafumi
Keanahalululu Gulch, Hawaiÿi
 DAR Watershed Code: 85021 WATERSHED FEATURES Keanahalululu Gulch watershed occurs on the island of Hawaiÿi. The Hawaiian meaning of the name is unknown. The area of the watershed is 4.1 square mi (10.6
Supplementary material: Methodological annex
 1 Supplementary material: Methodological annex Correcting the spatial representation bias: the grid sample approach Our land-use time series used non-ideal data sources, which differed in spatial and thematic
Global Biogeography. Natural Vegetation. Structure and Life-Forms of Plants. Terrestrial Ecosystems-The Biomes
 Global Biogeography Natural Vegetation Structure and Life-Forms of Plants Terrestrial Ecosystems-The Biomes Natural Vegetation natural vegetation is the plant cover that develops with little or no human
AGOG 485/585 /APLN 533 Spring Lecture 5: MODIS land cover product (MCD12Q1). Additional sources of MODIS data
. Additional sources of MODIS data") AGOG 485/585 /APLN 533 Spring 2019 Lecture 5: MODIS land cover product (MCD12Q1). Additional sources of MODIS data Outline Current status of land cover products Overview of the MCD12Q1 algorithm Mapping
AGOG 485/585 /APLN 533 Spring 2019 Lecture 5: MODIS land cover product (MCD12Q1). Additional sources of MODIS data Outline Current status of land cover products Overview of the MCD12Q1 algorithm Mapping
CHAPTER 4 OPTIMIZATION OF COEFFICIENT OF LIFT, DRAG AND POWER - AN ITERATIVE APPROACH
 82 CHAPTER 4 OPTIMIZATION OF COEFFICIENT OF LIFT, DRAG AND POWER - AN ITERATIVE APPROACH The coefficient of lift, drag and power for wind turbine rotor is optimized using an iterative approach. The coefficient
FOREST CHANGE DETECTION BY MEANS OF REMOTE SENSING TECHNIQUES FROM THE EU PROJECT CORINE LAND COVER
 FORESTRY IDEAS, 2010, vol. 16, 1 (39) FOREST CHANGE DETECTION BY MEANS OF REMOTE SENSING TECHNIQUES FROM THE EU PROJECT CORINE LAND COVER Youlin Tepeliev and Radka Koleva* University of Forestry, Faculty
ANCILLARY DATA VARIABLES
 ANCILLARY DATA VARIABLES PROCESSING INFORMATION AND MODELING USES Version 1.0 1 BACKGROUND The ancillary data component of the project included creation of a core dataset of 58 variables, of which 24 variables
Numerical Modelling for Optimization of Wind Farm Turbine Performance
 Numerical Modelling for Optimization of Wind Farm Turbine Performance M. O. Mughal, M.Lynch, F.Yu, B. McGann, F. Jeanneret & J.Sutton Curtin University, Perth, Western Australia 19/05/2015 COOPERATIVE
Application of the wind atlas for Egypt
 Downloaded from orbit.dtu.dk on: Dec 19, 2017 Application of the wind atlas for Egypt Mortensen, Niels Gylling Publication date: 2005 Document Version Peer reviewed version Link back to DTU Orbit Citation
Classification of Erosion Susceptibility
 GEO327G: GIS & GPS Applications in Earth Sciences Classification of Erosion Susceptibility Denali National Park, Alaska Zehao Xue 12 3 2015 2 TABLE OF CONTENTS 1 Abstract... 3 2 Introduction... 3 2.1 Universal
AN ASSESSMENT OF THE DISCREPANCY BETWEEN OPERATIONAL ASSESSMENT AND WIND RESOURCE ASSESSMENT FOR A WIND FARM IN IRELAND
 AN ASSESSMENT OF THE DISCREPANCY BETWEEN OPERATIONAL ASSESSMENT AND WIND RESOURCE ASSESSMENT FOR A WIND FARM IN IRELAND Thesis in partial fulfilment of the requirements for the degree of MASTER OF SCIENCE
Vindkraftmeteorologi - metoder, målinger og data, kort, WAsP, WaSPEngineering,
 Downloaded from orbit.dtu.dk on: Dec 19, 2017 Vindkraftmeteorologi - metoder, målinger og data, kort, WAsP, WaSPEngineering, meso-scale metoder, prediction, vindatlasser worldwide, energiproduktionsberegninger,
Semester Project Final Report. Logan River Flood Plain Analysis Using ArcGIS, HEC-GeoRAS, and HEC-RAS
 Semester Project Final Report Logan River Flood Plain Analysis Using ArcGIS, HEC-GeoRAS, and HEC-RAS Kedric Curtis, Josh Hogge, Jordan Jarrett, Jared Justensen May 6, 2016 CEE 6190 GIS for Civil Engineers
Puakea, Hawaiÿi. Puakea, Hawaiÿi WATERSHED FEATURES
 Puakea, Hawaiÿi DAR Watershed Code: 85046 Puakea, Hawaiÿi WATERSHED FEATURES Puakea watershed occurs on the island of Hawaiÿi. The Hawaiian meaning of the name is white blossom. The area of the watershed
Field descriptors for Historic Carpathian Land Use
 Field descriptors for Historic Carpathian Land Use This document describes the dataset that contains historic land use for the Carpathians. The data file contains a total of 91935 data points, arranged
Kimberly J. Mueller Risk Management Solutions, Newark, CA. Dr. Auguste Boissonade Risk Management Solutions, Newark, CA
 1.3 The Utility of Surface Roughness Datasets in the Modeling of United States Hurricane Property Losses Kimberly J. Mueller Risk Management Solutions, Newark, CA Dr. Auguste Boissonade Risk Management
Effects of Climate and Location on Traffic Signs Deterioration: A LiDAR-Based Study in Utah
 Effects of Climate and Location on Traffic Signs Deterioration: A LiDAR-Based Study in Utah By: Majid Khalilikhah A Term Project Paper CEE 6440 / GIS in Water Resources Dr. David Tarboton Instructors:
Quality Assessment of Shuttle Radar Topography Mission Digital Elevation Data. Thanks to. SRTM Data Collection SRTM. SRTM Galapagos.
 Quality Assessment of Shuttle Radar Topography Mission Digital Elevation Data Third International Conference on Geographic Information Science College Park, Maryland, October 20-23 Ashton Shortridge Dept.
Appendix 1. Supplementary information on methodology and chorus projections Location matters: evaluating Greater Prairie-Chicken (Tympanuchus cupido)
") Appendix 1. Supplementary information on methodology and chorus projections Location matters: evaluating Greater Prairie-Chicken (Tympanuchus cupido) boom chorus propagation Supplemental Methods Study
Appendix 1. Supplementary information on methodology and chorus projections Location matters: evaluating Greater Prairie-Chicken (Tympanuchus cupido) boom chorus propagation Supplemental Methods Study
Southern California Earthquake Center
 Southern California Earthquake Center By: Mark Slothower Geog 406 Final Report Dr. Sun Table of Contents Introduction Page 3 Hypothesis and research questions Page 3 Methods and flowchart Page 4 Data Page
WGIA7 9th July, Noriko KISHIMOTO
 Utilizing Global Map for addressing Climate Change WGIA7 9th July, 2009 Seoul, Republic of Korea Noriko KISHIMOTO n-kishimoto@gsi.go.jp Geographic Survey Institute, JAPAN Outline of the Global Map What
AUTOMATED DATA PROCESSING FOR MARITIME AND FLOODS APPLICATIONS
 YOUR HUB FOR GEOSPATIAL APPLICATIONS AUTOMATED DATA PROCESSING FOR MARITIME AND FLOODS APPLICATIONS Angelucci Maria, Daffina Filippo, Grandoni Domenico, Quattrociocchi Dino Automated Data Processing (Smart
Problems arising during the implementation of CLC2006
 Problems arising during the implementation of CLC2006 George Büttner, Barbara Kosztra ETC-LUSI / FÖMI (HU) EIONET WG meeting on Land Monitoring IGN Portugal, 10-12 March 2010 Contents of presentation Present
Notice on a Case Study on the Utilization of Wind Energy Potential on a Remote and Isolated Small Wastewater Treatment Plant
 Chemical Eng. Dept., ISEL From the SelectedWorks of João F Gomes August, 2011 Notice on a Case Study on the Utilization of Wind Energy Potential on a Remote and Isolated Small João F Gomes Available at:
Environmental Science
 Environmental Science A Study of Interrelationships Cui Jiansheng Hebei University of Science and Technology CH06 Kinds of Ecosystems and Communities Chapter Objectives After reading this chapter, you
Accounting Units for Ecosystem Accounts Paper prepared by Alessandra Alfieri, Daniel Clarke, and Ivo Havinga United Nations Statistics Division
 DEPARTMENT OF ECONOMIC AND SOCIAL AFFAIRS STATISTICS DIVISION UNITED NATIONS Expert Meeting on Ecosystem Accounts London, UK 5-7 December 2011 Accounting Units for Ecosystem Accounts Paper prepared by
Sustainability indicators for socio-ecological systems
 Paul Cézanne: Montaigne Sainte-Victoire, 1886-1890 Sustainability indicators for socio-ecological systems Felix Müller Dept. of Ecosystem Management Institute for Natural Resource Conservation University
Deep Thunder. Local Area Precision Forecasting for Weather-Sensitive Business Operations (e.g. Electric Utility)
") 1 Deep Thunder Local Area Precision Forecasting for Weather-Sensitive Business Operations (e.g. Electric Utility) Dipl. Ing. Helmut Ludwar Chief Technologist Wien, im Oktober 2010 Forecasts for Weather-Sensitive
1 Deep Thunder Local Area Precision Forecasting for Weather-Sensitive Business Operations (e.g. Electric Utility) Dipl. Ing. Helmut Ludwar Chief Technologist Wien, im Oktober 2010 Forecasts for Weather-Sensitive
Kommerciel arbejde med WAsP
 Downloaded from orbit.dtu.dk on: Dec 19, 2017 Kommerciel arbejde med WAsP Mortensen, Niels Gylling Publication date: 2002 Document Version Peer reviewed version Link back to DTU Orbit Citation (APA): Mortensen,
Data Visualization and Evaluation
 Data Visualization and Evaluation Juan Paulo Ramírez, Ph.D. University of Nebraska 5th Annual Environmental Evaluators Networking Forum June 2010 Purpose and Objectives Purpose Introduce to program evaluators
CORINE Land Cover 2000: semiautomated updating of CORINE Land Cover in the UK Phase II: Map Production in the UK Final Report
 CENTRE FOR ECOLOGY AND HYDROLOGY (NATURAL ENVIRONMENT RESEARCH COUNCIL) Project. C02041A CORINE Land Cover 2000: semiautomated updating of CORINE Land Cover in the UK Phase II: Map Production in the UK
Sea Level Rise Providing Nature A-Right-of Way
 Sea Level Rise Providing Nature A-Right-of Way Study Area Site 2: Skagit Bay Initial Condition 11.2 Inches by 2050 No Dikes 27.3 Inches by 2100 No Dikes The Problem Loss of coastal wetlands due to submergence
Land cover/land use mapping and cha Mongolian plateau using remote sens. Title. Author(s) Bagan, Hasi; Yamagata, Yoshiki. Citation Japan.
 Bagan, Hasi; Yamagata, Yoshiki. Citation Japan.") Title Land cover/land use mapping and cha Mongolian plateau using remote sens Author(s) Bagan, Hasi; Yamagata, Yoshiki International Symposium on "The Imp Citation Region Specific Systems". 6 Nove Japan.
Title Land cover/land use mapping and cha Mongolian plateau using remote sens Author(s) Bagan, Hasi; Yamagata, Yoshiki International Symposium on "The Imp Citation Region Specific Systems". 6 Nove Japan.
Implementation of the NCEP operational GLDAS for the CFS land initialization
 Implementation of the NCEP operational GLDAS for the CFS land initialization Jesse Meng, Mickael Ek, Rongqian Yang NOAA/NCEP/EMC July 2012 1 Improving the Global Land Surface Climatology via improved Global
SEEA Experimental Ecosystem Accounting
 SEEA Experimental Ecosystem Accounting Sokol Vako United Nations Statistics Division Training for the worldwide implementation of the System of Environmental Economic Accounting 2012 - Central Framework
Ms. A. Mormando's Class *
 8 th Grade Science Essential Standard: 8.E.1.1 Explain the structure of the hydrosphere including: Water distribution on Earth; Local river basin and water availability Stream - A stream is a body of water
The elevations on the interior plateau generally vary between 300 and 650 meters with
 11 2. HYDROLOGICAL SETTING 2.1 Physical Features and Relief Labrador is bounded in the east by the Labrador Sea (Atlantic Ocean), in the west by the watershed divide, and in the south, for the most part,
Wind Resource Assessment Practical Guidance for Developing A Successful Wind Project
 December 11, 2012 Wind Resource Assessment Practical Guidance for Developing A Successful Wind Project Michael C Brower, PhD Chief Technical Officer Presented at: What We Do AWS Truepower partners with
4. Land use database generation
 32 Towards an urban atlas 4. Land use database generation The understanding of urban dynamics is basic for planning the sustainable development of urban areas and the conservation of natural resources.
The Use of Geographic Information Systems to Assess Change in Salt Marsh Ecosystems Under Rising Sea Level Scenarios.
 The Use of Geographic Information Systems to Assess Change in Salt Marsh Ecosystems Under Rising Sea Level Scenarios Robert Hancock The ecological challenges presented by global climate change are vast,
Name Date Class. well as the inland, found near the Tropics. 4. In the, or the regions near the Equator, you may find a lush
 WATER, CLIMATE, AND VEGETATION Vocabulary Activity DIRECTIONS: Fill in the Blanks Select a term from below to complete each of the following sentences. CHAPTER 1. The constant movement of water, a process
Wind Flow Modeling The Basis for Resource Assessment and Wind Power Forecasting
 Wind Flow Modeling The Basis for Resource Assessment and Wind Power Forecasting Detlev Heinemann ForWind Center for Wind Energy Research Energy Meteorology Unit, Oldenburg University Contents Model Physics
APPENDIX. Normalized Difference Vegetation Index (NDVI) from MODIS data
 from MODIS data") APPENDIX Land-use/land-cover composition of Apulia region Overall, more than 82% of Apulia contains agro-ecosystems (Figure ). The northern and somewhat the central part of the region include arable lands
APPENDIX Land-use/land-cover composition of Apulia region Overall, more than 82% of Apulia contains agro-ecosystems (Figure ). The northern and somewhat the central part of the region include arable lands
Site Data. WTG type Power curve Annual Energy Valid Manufact. Type-generator Power, Rotor Hub Creator Name Result Result-10,0% Mean Capacity
 ishek AsP interface - Main Result Calculation: AsP Interface ame ite data for AsP - no long-term correction ite coordinates UTM G Zone: 1 ast:.3 orth:.11.713 MD International A/ iels Jernes Vej 1 DK-9
J17.3 Impact Assessment on Local Meteorology due to the Land Use Changes During Urban Development in Seoul
 J17.3 Impact Assessment on Local Meteorology due to the Land Use Changes During Urban Development in Seoul Hae-Jung Koo *, Kyu Rang Kim, Young-Jean Choi, Tae Heon Kwon, Yeon-Hee Kim, and Chee-Young Choi
Why WASA an introduction to the wind atlas method and some applications
 Why WASA an introduction to the wind atlas method and some applications Jens Carsten Hansen and Niels G. Mortensen DTU Wind Energy (Dept of Wind Energy, Technical University of Denmark) Eugene Mabille,
LATE REQUEST FOR A SPECIAL PROJECT
 LATE REQUEST FOR A SPECIAL PROJECT 2014 2016 MEMBER STATE: ITALY Principal Investigator 1 : Affiliation: Address: E-mail: Other researchers: Prof. Luca G. Lanza WMO/CIMO Lead Centre B. Castelli on Precipitation
What is a wind atlas and where does it fit into the wind energy sector?
 What is a wind atlas and where does it fit into the wind energy sector? DTU Wind Energy By Hans E. Jørgensen Head of section : Meteorology & Remote sensing Program manager : Siting & Integration Outline
A Comparative Study of virtual and operational met mast data
 Journal of Physics: Conference Series OPEN ACCESS A Comparative Study of virtual and operational met mast data To cite this article: Dr Ö Emre Orhan and Gökhan Ahmet 2014 J. Phys.: Conf. Ser. 524 012120
Streams in the Ranching Country of South Texas
 Streams in the Ranching Country of South Texas Watershed Analysis of HUC 12110207 Sandranell Moerbe CE GIS in Water Resources Fall 2015 INTRODUCTION This project investigates the portion of South Texas
Environmental Statement South Kyle Wind Farm August Appendix 12.9: The Habitat Loss and Disturbance Calculations
 Appendix 12.9: The Habitat and Disturbance Calculations 1.1 Introduction 1 This appendix details the approach, assumptions and results of the process adopted to quantify habitat loss and degradation as
Increasing Transmission Capacities with Dynamic Monitoring Systems
 INL/MIS-11-22167 Increasing Transmission Capacities with Dynamic Monitoring Systems Kurt S. Myers Jake P. Gentle www.inl.gov March 22, 2012 Concurrent Cooling Background Project supported with funding
Wind Forecasts in Complex Terrain Experiences with SODAR and LIDAR
 Wind Forecasts in Complex Terrain René Cattin, Saskia Bourgeois, Silke Dierer, Markus Müller, Sara Koller Meteotest, Switzerland Private company founded in 1981 28 employees Any kind of meteorological
Representivity of wind measurements for design wind speed estimations
 Representivity of wind measurements for design wind speed estimations Adam Goliger 1, Andries Kruger 2 and Johan Retief 3 1 Built Environment, Council for Scientific and Industrial Research, South Africa.
EO Information Services. Assessing Vulnerability in the metropolitan area of Rio de Janeiro (Floods & Landslides) Project
 Project") EO Information Services in support of Assessing Vulnerability in the metropolitan area of Rio de Janeiro (Floods & Landslides) Project Ricardo Armas, Critical Software SA Haris Kontoes, ISARS NOA World
EO Information Services in support of Assessing Vulnerability in the metropolitan area of Rio de Janeiro (Floods & Landslides) Project Ricardo Armas, Critical Software SA Haris Kontoes, ISARS NOA World
Effect of Wind Turbine Wakes on the Performance of a Real Case WRF-LES Simulation
 Effect of Wind Turbine Wakes on the Performance of a Real Case WRF-LES Simulation Paula Doubrawa 1, A. Montornès 2, R. J. Barthelmie 1, S. C. Pryor 1, G. Giroux 3, P. Casso 2 1 Cornell University, Ithaca,