Targeted LiDAR use in Support of In-Office Address Canvassing (IOAC) March 13, 2017 MAPPS, Silver Spring MD
|
|
|
- Amos Allison
- 5 years ago
- Views:
Transcription
1 Targeted LiDAR use in Support of In-Office Address Canvassing (IOAC) March 13, 2017 MAPPS, Silver Spring MD
2 Imagery, LiDAR, and Blocks In 2011, the GEO commissioned independent subject matter experts (Jensen, Guptil, Cowen) to evaluate change detection technology resulting in the Change Detection Technology Evaluation, FY2012 Report The report identified using LiDAR and Imagery technologies to help detect change in the landscape particularly as it applies to new structures. When the report came out, the GEO did not have sufficient in house expertize to mount operations using remote sensing technologies. Five years later this has changed..
3 Change Detection Developments Analog Change Detection prove useful: e.g. isimple ( )and Interactive Review (IR) step of IOAC (2015->) In 2015 the Census Bureau submitted an RFI on Structure, Address and Street Centerline Change Detection Respondents provided a variety of approaches usually emphasizing their area of expertise.
4 isimple Project Overview What is isimple? Cell-based change detection (CD) analysis where Missing and Misaligned Features are quickly identified and coded. Rapid-Interactive CD Prioritize areas for updating Latest iteration occurred during benchmarking (June 2 July 2, 2014).
5 Missing and Misaligned Cell Values A user reviews for Missing and Misaligned features per cell using following score values: How Many Problems? # of Problem Features Score High 6 or more 2 Low - Medium None 0 0

6 isimple: Example of a Good Cell All the features of this cell are appropriate and spatially accurate, with no missing features. This cell would be coded 0 in all categories

7 isimple: Misaligned Features Nearly every feature in this cell is misaligned, easily more than 6 features. Score=2
8 What is Address Canvassing (AC)? AC is an operation that assures the completeness and accuracy of the Census Bureau s address inventory. In previous censuses, address canvassing occurred entirely in the field. Imagery combined with related address and geospatial data replicate AC in an office environment.
 Master Address File (MAF); and is an integral part of the Census Bureau s reengineered Address Canvassing (AC) process for the")
9 In-Office Address Canvassing (IOAC) In-Office Address Canvassing (IOAC) is a multi-step project that will assess the accuracy and completeness of address and related information in the Geography Division s (GEO) Master Address File (MAF); and is an integral part of the Census Bureau s reengineered Address Canvassing (AC) process for the 2020 Census.
10 IOC Components Interactive Review (IR) Compare Decennial Census baseline imagery to the latest available imagery by tabulation block. Active Block Review (ABR) Review blocks identified by IR as active, e.g. have HU under-coverage or over-coverage
11 Block Assessment Research and Classification Application (BARCA) An in-office block-based data review system using visual inspection of two high resolution imagery vintages to identify stability or change BARCA identifies roughly 80% of the blocks requiring updates by GEO Division staff Reduce in-field work, focus on on-going update work Interactive, requiring large number of analysts to review 11 million blocks Significant savings, however only identifies differences from baseline

12 Title13 BARCA Interface
13 Can IOAC/IR be automated? IR process is ideally suited for automation Replicate what the reviewer is observing Determine whether a block is active or passive Results consistent with or better than IR
14 Can LiDAR Help? Reconcile areas where imagery is not enough to determine change or lack of change. LiDAR coverage is increasing but not yet available everywhere. Validate the existence of a housing unit (structure). Enhance feature extraction & validation (structures; roads; etc.) Produce control points for road network & address location assessment (building footprints) Use to validate existence of feature/structure. Use in HU/Population estimation using structure volume (Dr. Qiu)
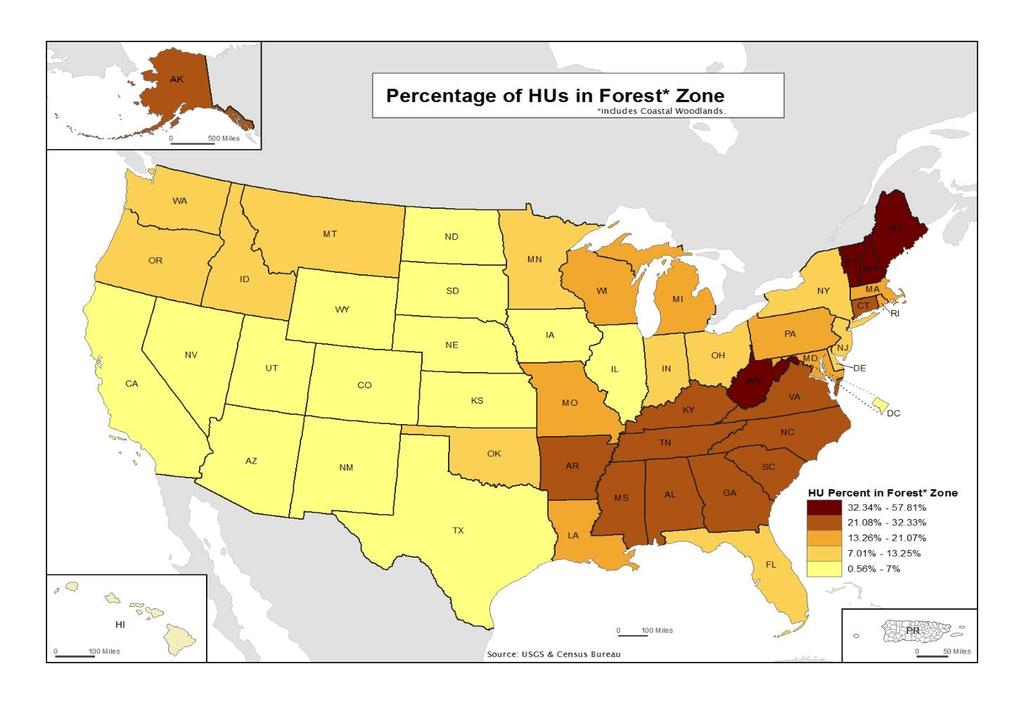
15 Preliminary thoughts Could LiDAR penetrate tree canopy to reveal potential housing units? Could it resolve street feature fidelity issues where tree canopy obscures visibility? As tree canopy maximum affects less than 3% of housing inventory, is it cost effective to use LiDAR? Focus on automating IR (Change Detection) instead.
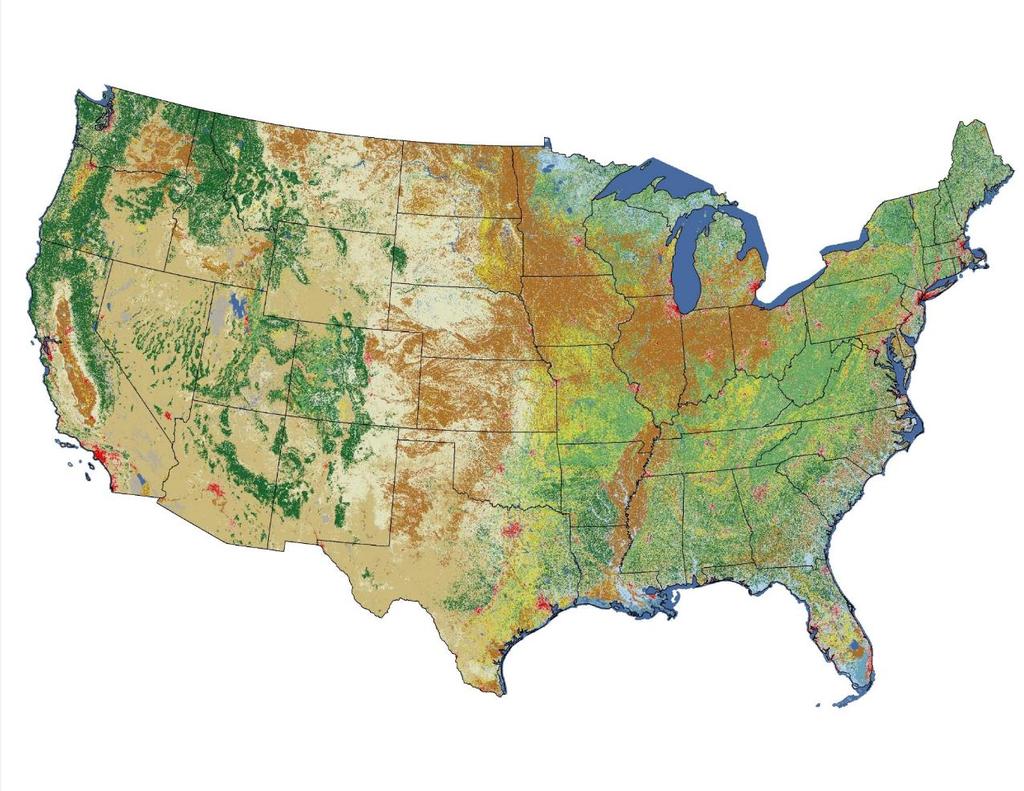
16 NLCD


17 Land Cover by NLCD Zone 43 Mixed Forest 1% 31 Barren Land 2% 90 Woody Wetlands 4% 51 Dwarf Scrub 4% 21 Developed, Open 1% 12 Perennial Ice/Snow 1% 72 Sedge Herbaceous 1% 95 Emerging Herbaceous Wetlands 22 Developed, Low 1% 1% 23 Developed, Medium 0% 11 Open Water 0% 24 Developed, High 0% 81 Pasture/Hay 6% 52 Shrub/Scrub 25% 41 Deciduous Forest 12% 71 Grassland Herbaceous 12% 42 Evergreen Forest 15% 82 Cultivated Crops 16%


18 Distribution of Housing Units by 90 Woody Wetlands 2% 42 Evergreen Forest 3% 81 Pasture/Hay 4% 82 Cultivated Crops 4% 24 Developed, High 6% NLCD Zone 52 Shrub/Scrub 2% 71 Grassland Herbaceous 2% 99 Misc 1% 22 Developed, Low 29% 41 Deciduous Forest 9% 21 Developed, Open 14% 23 Developed, Medium 24%
19 Housing Unit Density by Zone HU DENSITY BY NLCD ZONE DEVELOPED, MEDIUM DEVELOPED, HIGH DEVELOPED, LOW DEVELOPED, OPEN MOSS DECIDUOUS FOREST PASTURE/HAY MIXED FOREST WOODY WETLANDS EMERGING HERBACEOUS WETLANDS CULTIVATED CROPS EVERGREEN FOREST GRASSLAND HERBACEOUS BARREN LAND SHRUB/SCRUB SEDGE HERBACEOUS DWARF SCRUB

20
21
22 Project Objective Create a geoprocessing tool using a combination of aerial imagery, LiDAR, and Census data to identify Census blocks that experienced change. Prioritize the blocks by amount and type of change. Potentially reduce operational costs Potentially improve Census housing & population accuracy
23 Data Sources Must Be Available nationally. No to Low cost Vintages need to line up with Census objectives High resolution/block level
24 U.S Interagency Elevation Inventory
25 Study Area Central Kent County, Delaware Mixed development and vegetation types Large areas of agricultural land Contains the City of Dover Experiencing growth at its urban fringes as well as within the existing urban footprint
26 Data Sources Source Type Format U.S. Census Bureau Census Tabulation Block polygons Geodatabase Census road centerlines Census State/County Boundary polygons Housing unit location points (MSPs) Geodatabase Geodatabase Geodatabase ESRI/NAIP Aerial imagery (1 meter or better) Image Service NOAA COAST Data Access viewer/ USGS CMGP (Delaware) LiDAR point clouds ESRI LAS dataset

27 Python Processing Flow


28 Processing - NDVI Once extent is set for a connected groups of Census blocks, NDVI data is pulled from the image service.


29 Processing - NDVI An NDVI data threshold for Built/Not-Built cover is stored to a layer for each date. The resulting layers are combined into a single raster layer from which change can be calculated. Multi-date Built layer


30 Processing - LiDAR LiDAR point cloud queried for ground points Points converted to raster Expanded to fill small gaps LiDAR point cloud LiDAR Ground points Expanded Ground raster layer Ground points as raster layer


31 Processing LiDAR Buildings Expanded Ground raster used as mask to remove low areas of Built/Not Built layer for latest year (NDVI) Resultant raster layer represents primarily buildings Ground points as raster layer 2015 Built layer Buildings raster layer

32 Processing LiDAR Buildings Building raster converted to polygons Small polygons deleted, other noise filtered Buildings Polygons
33 Processing LiDAR Buildings Building polygons spatially joined to housing unit points to identify points that do not intersect building footprints Misaligned points written to output geodatabase Building footprints and approximate heights written to output geodatabase Title13 Buildings Polygons

34 Processing LiDAR Roads Building layer and nonground portion of LiDAR based ground raster are subtracted from Built/Not Built layer of latest year Buildings raster layer Resultant layer primarily represents roads, driveways, and parking lots Built/Not Built layer Paved area layer


35 Processing LiDAR Roads Contraction and dilation used to separate roads from parking lots Small road segments eliminated Paved area layer Resulting road layer intersected with Census road layer Census road polylines on roadbed Misaligned road segments written to output database Bad road polylines identified

36 Title13 Building Footprints

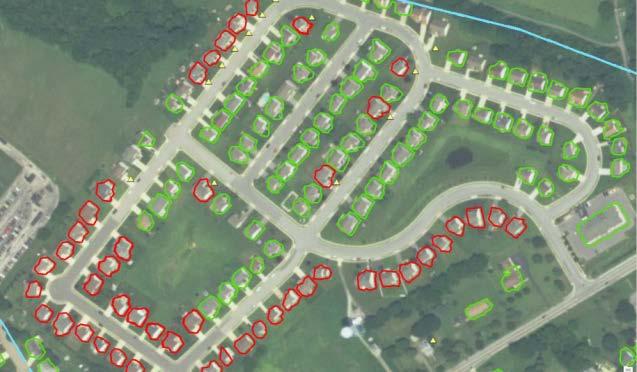
37 Parcel Centroids over building footprints Title13

38 Parcel Centroids not in building footprint Title13
39 Title13 New Construction

40 Title13 Suburban

41 Title13 Townhomes
42 IOAC/IR Block Product For each census (tabulation) block, calculate and report to geodatabase: the number of misaligned features; the total number of building features found by tool; tally MSPs from the MAF/TIGER database (buildings match MSP; MSPs notmatching building footprint, etc.) Total and relative amount of area change per census tabulation block is also reported to assist analyst with assignment prioritization.
43 Preliminary Results Building and road errors are identified at rates similar to human analyst More new buildings and roads are detected by the tool than human analyst. Most are not relevant to Census Locations of buildings and roads is more information than is currently collected by the BARCA analysts Vegetation change is over represented in agricultural regions Imagery and LiDAR date mismatch plus data vintage is a significant problem.
44 Additional Benefits from Automating IR Releases analysts to work on other operations like Active Block Review. Run as-needed or on-going basis, triggered by updated imagery or other operational needs. Use the building footprints/road extracts to assess and eventually improve the spatial quality of MAF Structure Points as well as road features.
45 Additional Work Analysis of nearby features Neighboring houses and addresses Streets Add parcel boundary to analysis where available Targeted processing based on lower resolution dataset triggers Image only analysis
46 Other Benefits In addition to identifying structure locations it can also provide attributes like area, height and volume Volume & height can be used to differentiate between single-family & multi-unit structures; as well as trailer homes/parks, high-rises, or row-houses. If necessary it can identify other physical features including roads, railroads, hydrography, etc.
47 Downstream Possibilities Develop new Quality Indicators Use the resulting building footprints to expand existing coverage (metro) to national coverage Evaluate different approaches to improve quality and process throughput. Research population estimation (Dr. Qiu)

48 Title
49 Title
50 Title Address points

51 Title13 Quality Indicators: Hierarchical Geocode Quality
52 Sample HGQ Analysis Block/Tract Level Census Tract Block A Block B Block C Block D Block E Block F Count Mean Distance (in meters) StDev Low (Shortest distance to structure centroid) High (Longest distance to structure centroid) Gold (in Structure) Silver (in parcel) Bronze (in block) Diff Parcel 27 1 No Match 4 No Structure 5
53
54


55
Globally Estimating the Population Characteristics of Small Geographic Areas. Tom Fitzwater
 Globally Estimating the Population Characteristics of Small Geographic Areas Tom Fitzwater U.S. Census Bureau Population Division What we know 2 Where do people live? Difficult to measure and quantify.
Estimating Probability of Success Rate
 Estimating Probability of Success Rate Don Ferguson, PhD A member of Appalachian Search and Rescue Conference Objective Provide SAR planners with a tool to help optimize effort allocation based on a number
Utility of National Spatial Data for Conservation Design Projects
 Utility of National Spatial Data for Conservation Design Projects Steve Williams Biodiversity and Spatial Information Center North Carolina State University PIF CDW St. Louis, MO April 11, 2006 Types of
Chapter 6. Fundamentals of GIS-Based Data Analysis for Decision Support. Table 6.1. Spatial Data Transformations by Geospatial Data Types
 Chapter 6 Fundamentals of GIS-Based Data Analysis for Decision Support FROM: Points Lines Polygons Fields Table 6.1. Spatial Data Transformations by Geospatial Data Types TO: Points Lines Polygons Fields
2010 Census Data Release and Current Geographic Programs. Michaellyn Garcia Geographer Seattle Regional Census Center
 2010 Census Data Release and Current Geographic Programs Michaellyn Garcia Geographer Seattle Regional Census Center 2010 Center of Population Located approximately 2.7 miles northeast of Plato, Missouri
Semester Project Final Report. Logan River Flood Plain Analysis Using ArcGIS, HEC-GeoRAS, and HEC-RAS
 Semester Project Final Report Logan River Flood Plain Analysis Using ArcGIS, HEC-GeoRAS, and HEC-RAS Kedric Curtis, Josh Hogge, Jordan Jarrett, Jared Justensen May 6, 2016 CEE 6190 GIS for Civil Engineers
Census Geography, Geographic Standards, and Geographic Information
 Census Geography, Geographic Standards, and Geographic Information Michael Ratcliffe Geography Division US Census Bureau New Mexico State Data Center Data Users Conference November 19, 2015 Today s Presentation
Link to USGS Phase 6 Land Use Viewer website:
 Chesapeake Bay Program Phase 6 Land Use Review Frequently Asked Questions (FAQ) Link to USGS Phase 6 Land Use Viewer website: http://chesapeake.usgs.gov/phase6/ Sections: 1. Data Review and Production
NR402 GIS Applications in Natural Resources
 NR402 GIS Applications in Natural Resources Lesson 1 Introduction to GIS Eva Strand, University of Idaho Map of the Pacific Northwest from http://www.or.blm.gov/gis/ Welcome to NR402 GIS Applications in
The 2020 Census Geographic Partnership Opportunities
 The 2020 Census Geographic Partnership Opportunities Web Adams Geographer, U.S. Census Bureau New York Regional Office 1 Geographic Partnership Opportunities The 2020 Census Local Update of Census Addresses
New Land Cover & Land Use Data for the Chesapeake Bay Watershed
 New Land Cover & Land Use Data for the Chesapeake Bay Watershed Why? The Chesapeake Bay Program (CBP) partnership is in the process of improving and refining the Phase 6 suite of models used to inform
Evaluating Urban Vegetation Cover Using LiDAR and High Resolution Imagery
 Evaluating Urban Vegetation Cover Using LiDAR and High Resolution Imagery Y.A. Ayad and D. C. Mendez Clarion University of Pennsylvania Abstract One of the key planning factors in urban and built up environments
Phase 6 Land Use Database version 1
 Phase 6 Land Use Database version 1 Peter Claggett, Fred Irani, Quentin Stubbs, and Renee Thompson. June 11, 2015 Modeling Workgroup Meeting USGS MD-DE-DC Water Science Center U.S. Department of the Interior
The Road to Data in Baltimore
 Creating a parcel level database from high resolution imagery By Austin Troy and Weiqi Zhou University of Vermont, Rubenstein School of Natural Resources State and local planning agencies are increasingly
Introduction. Project Summary In 2014 multiple local Otsego county agencies, Otsego County Soil and Water
 Introduction Project Summary In 2014 multiple local Otsego county agencies, Otsego County Soil and Water Conservation District (SWCD), the Otsego County Planning Department (OPD), and the Otsego County
Effects of input DEM data spatial resolution on Upstream Flood modeling result A case study in Willamette river downtown Portland
 Effects of input DEM data spatial resolution on Upstream Flood modeling result A case study in Willamette river downtown Portland By Hue Duong GEOG 593 Fall 2015 Digital Terrain Analysis Photo: Anh Duc
SWAMP GIS: A spatial decision support system for predicting and treating stormwater runoff. Michael G. Wing 1 * and Derek Godwin
 Journal of Spatial Hydrology Vol. 11, No. 2 Fall 2011 SWAMP GIS: A spatial decision support system for predicting and treating stormwater runoff Michael G. Wing 1 * and Derek Godwin Abstract SWAMP GIS
CHAPTER 1 THE UNITED STATES 2001 NATIONAL LAND COVER DATABASE
 CHAPTER 1 THE UNITED STATES 2001 NATIONAL LAND COVER DATABASE Collin Homer*, Jon Dewitz, Joyce Fry, and Nazmul Hossain *U.S. Geological Survey (USGS) Center for Earth Resources Observation and Science
Acknowledgments xiii Preface xv. GIS Tutorial 1 Introducing GIS and health applications 1. What is GIS? 2
 Acknowledgments xiii Preface xv GIS Tutorial 1 Introducing GIS and health applications 1 What is GIS? 2 Spatial data 2 Digital map infrastructure 4 Unique capabilities of GIS 5 Installing ArcView and the
Geographic Products and Data. Improvements in Spatial Accuracy and Accessing Data
 Geographic Products and Data Improvements in Spatial Accuracy and Accessing Data How it Began TIGER was internally developed to support the 1990 Decennial Census operations Used data sources such as USGS
Phase 6 Land Use Database version 2
 Phase 6 Land Use Database version 2 Peter Claggett, Fred Irani, Quentin Stubbs, and Renee Thompson. October 5, 2015 Modeling Workgroup Quarterly Annapolis, Maryland U.S. Department of the Interior U.S.
Lesson Plan 3 Land Cover Changes Over Time. An Introduction to Land Cover Changes over Time
 An Introduction to Land Cover Changes over Time This lesson plan builds on the lesson plan on Understanding Land Use and Land Cover Using Google Earth. Please refer to it in terms of definitions on land
Streams in the Ranching Country of South Texas
 Streams in the Ranching Country of South Texas Watershed Analysis of HUC 12110207 Sandranell Moerbe CE GIS in Water Resources Fall 2015 INTRODUCTION This project investigates the portion of South Texas
John Laznik 273 Delaplane Ave Newark, DE (302)
") Office Address: John Laznik 273 Delaplane Ave Newark, DE 19711 (302) 831-0479 Center for Applied Demography and Survey Research College of Human Services, Education and Public Policy University of Delaware
Office Address: John Laznik 273 Delaplane Ave Newark, DE 19711 (302) 831-0479 Center for Applied Demography and Survey Research College of Human Services, Education and Public Policy University of Delaware
Louisiana Transportation Engineering Conference. Monday, February 12, 2007
 Louisiana Transportation Engineering Conference Monday, February 12, 2007 Agenda Project Background Goal of EIS Why Use GIS? What is GIS? How used on this Project Other site selection tools I-69 Corridor
Inclusion of Non-Street Addresses in Cancer Cluster Analysis
 Inclusion of Non-Street Addresses in Cancer Cluster Analysis Sue-Min Lai, Zhimin Shen, Darin Banks Kansas Cancer Registry University of Kansas Medical Center KCR (Kansas Cancer Registry) KCR: population-based
Validation of the ASTER Global Digital Elevation Model (GDEM) Version 2 over the Conterminous United States
 Version 2 over the Conterminous United States") Validation of the ASTER Global Digital Elevation Model (GDEM) Version 2 over the Conterminous United States U.S. Geological Survey Earth Resources Observation Science (EROS) Center Sioux Falls, South Dakota,
Validation of the ASTER Global Digital Elevation Model (GDEM) Version 2 over the Conterminous United States U.S. Geological Survey Earth Resources Observation Science (EROS) Center Sioux Falls, South Dakota,
Summary Description Municipality of Anchorage. Anchorage Coastal Resource Atlas Project
 Summary Description Municipality of Anchorage Anchorage Coastal Resource Atlas Project By: Thede Tobish, MOA Planner; and Charlie Barnwell, MOA GIS Manager Introduction Local governments often struggle
2011 Land Use/Land Cover Delineation. Meghan Jenkins, GIS Analyst, GISP Jennifer Kinzer, GIS Coordinator, GISP
 2011 Land Use/Land Cover Delineation Meghan Jenkins, GIS Analyst, GISP Jennifer Kinzer, GIS Coordinator, GISP History O Key Points O Based on Anderson s Land Use and Land Cover Classification System O
Quality Assessment of Shuttle Radar Topography Mission Digital Elevation Data. Thanks to. SRTM Data Collection SRTM. SRTM Galapagos.
 Quality Assessment of Shuttle Radar Topography Mission Digital Elevation Data Third International Conference on Geographic Information Science College Park, Maryland, October 20-23 Ashton Shortridge Dept.
Welcome to NR502 GIS Applications in Natural Resources. You can take this course for 1 or 2 credits. There is also an option for 3 credits.
 Welcome to NR502 GIS Applications in Natural Resources. You can take this course for 1 or 2 credits. There is also an option for 3 credits. The 1st credit consists of a series of readings, demonstration,
NATIONAL VEGETATION CLASSIFICATION STANDARD, VERSION 2 WORKING DRAFT
 NATIONAL VEGETATION CLASSIFICATION STANDARD, VERSION 2 WORKING DRAFT Subcommittee Federal Geographic Data Committee SUMMMARY NatureServe version 31 August 2006 INTRODUCTION The United States Federal Geographic
Quality and Coverage of Data Sources
 Quality and Coverage of Data Sources Objectives Selecting an appropriate source for each item of information to be stored in the GIS database is very important for GIS Data Capture. Selection of quality
CUYAHOGA COUNTY URBAN TREE CANOPY & LAND COVER MAPPING
 CUYAHOGA COUNTY URBAN TREE CANOPY & LAND COVER MAPPING FINAL REPORT M IKE GALVIN S AVATREE D IRECTOR, CONSULTING GROUP P HONE: 914 403 8959 E MAIL: MGALVIN@SAVATREE. COM J ARLATH O NEIL DUNNE U NIVERSITY
PLANNING FOR THE FUTURE: THE GEOGRAPHIC SUPPORT SYSTEM INITIATIVE FOR THE U.S. CENSUS BUREAU
 PLANNING FOR THE FUTURE: THE GEOGRAPHIC SUPPORT SYSTEM INITIATIVE FOR THE U.S. CENSUS BUREAU Tim Trainor Geography Division, U.S. Census Bureau, Washington, DC. 20233 timothy.f.trainor@census.gov KEY WORDS:
GIS at the Purdue Center for Regional Development: Some Examples
 GIS at the Purdue Center for Regional Development: Some Examples Indraneel Kumar SHaPE Brownbag Seminar February 1st, 2008 Regional Development for Local Success GIS Tools ESRI ArcGIS suite (ArcInfo-Workstation)
USGS Hydrography Overview. May 9, 2018
 + 1 USGS Hydrography Overview May 9, 2018 + 2 The National Geospatial Program Provides the geospatial baseline of the Nation s topography, natural landscape and built environment through The National Map,
ZIP Code Tabulation Areas For Census 2000
 ZIP Code Tabulation Areas For Census 2000 NCHS, CDC Andrew Flora June 13, 2000 TIGER Operations Branch Geography Division U S C E N S U S B U R E A U Helping You Make Informed Decisions ZIP Code Tabulations
Natalie Cabrera GSP 370 Assignment 5.5 March 1, 2018
 Network Analysis: Modeling Overland Paths Using a Least-cost Path Model to Track Migrations of the Wolpertinger of Bavarian Folklore in Redwood National Park, Northern California Natalie Cabrera GSP 370
Providing Public Access to King County GIS Data. Presented by: Michael Jenkins King County GIS Center Seattle, WA
 Providing Public Access to King County GIS Data Presented by: Michael Jenkins King County GIS Center Seattle, WA King County, Washington Microsoft Boeing Amazon.Com Starbucks Port of Seattle Weyerhauser
Scripting and Geoprocessing for Raster Analysis Multiyear Crop Analysis
 Authors: David T. Hansen and Barbara Simpson Scripting and Geoprocessing for Raster Analysis Multiyear Crop Analysis Presented by David T. Hansen and Barbara Simpson at the ESRI User Conference, 2012,
Development and Land Use Change in the Central Potomac River Watershed. Rebecca Posa. GIS for Water Resources, Fall 2014 University of Texas
 Development and Land Use Change in the Central Potomac River Watershed Rebecca Posa GIS for Water Resources, Fall 2014 University of Texas December 5, 2014 Table of Contents I. Introduction and Motivation..4
Southern California Earthquake Center
 Southern California Earthquake Center By: Mark Slothower Geog 406 Final Report Dr. Sun Table of Contents Introduction Page 3 Hypothesis and research questions Page 3 Methods and flowchart Page 4 Data Page
SRJC Applied Technology 54A Introduction to GIS
 SRJC Applied Technology 54A Introduction to GIS Overview Lecture of Geographic Information Systems Fall 2004 Santa Rosa Junior College Presented By: Tim Pudoff, GIS Coordinator, County of Sonoma, Information
ArcGIS for Desktop. ArcGIS for Desktop is the primary authoring tool for the ArcGIS platform.
 ArcGIS for Desktop ArcGIS for Desktop ArcGIS for Desktop is the primary authoring tool for the ArcGIS platform. Beyond showing your data as points on a map, ArcGIS for Desktop gives you the power to manage
Accuracy assessment of Pennsylvania streams mapped using LiDAR elevation data: Method development and results
 Accuracy assessment of Pennsylvania streams mapped using LiDAR elevation data: Method development and results David Saavedra, geospatial analyst Louis Keddell, geospatial analyst Michael Norton, geospatial
State GIS Update. Master Address Repository (MAR) IMAGIN 2016 Everett Root May 16, 2016
 IMAGIN 2016 Everett Root May 16, 2016") State GIS Update Master Address Repository (MAR) IMAGIN 2016 Everett Root roote@michigan.gov May 16, 2016 Master Address Repository Mark Holmes GeoSpatial Services Manager (MAR) Josh Ross Framework Manager
State GIS Update Master Address Repository (MAR) IMAGIN 2016 Everett Root roote@michigan.gov May 16, 2016 Master Address Repository Mark Holmes GeoSpatial Services Manager (MAR) Josh Ross Framework Manager
Harrison 1. Identifying Wetlands by GIS Software Submitted July 30, ,470 words By Catherine Harrison University of Virginia
 Harrison 1 Identifying Wetlands by GIS Software Submitted July 30, 2015 4,470 words By Catherine Harrison University of Virginia cch2fy@virginia.edu Harrison 2 ABSTRACT The Virginia Department of Transportation
Satellite Imagery: A Crucial Resource in Stormwater Billing
 Satellite Imagery: A Crucial Resource in Stormwater Billing May 10, 2007 Carl Stearns Engineering Technician Department of Public Works Stormwater Services Division Sean McKnight GIS Coordinator Department
Aerial Photography and Imagery Resources Guide
 Aerial Photography and Imagery Resources Guide Cheyenne and Laramie County Cooperative GIS Created and Maintained by the GIS Coordinator for the Cooperative GIS Program March 2011 CHEYENNE / LARAMIE COUNTY
Hennepin GIS. Tree Planting Priority Areas - Analysis Methodology. GIS Services April 2018 GOAL:
 Hennepin GIS GIS Services April 2018 Tree Planting Priority Areas - Analysis Methodology GOAL: To create a GIS data layer that will aid Hennepin County Environment & Energy staff in determining where to
GEOGRAPHIC INFORMATION SYSTEMS Session 8
 GEOGRAPHIC INFORMATION SYSTEMS Session 8 Introduction Geography underpins all activities associated with a census Census geography is essential to plan and manage fieldwork as well as to report results
MARYLAND S LAND USE/LAND COVER MAP AND ASSOCIATED ANALYSIS
 MARYLAND S LAND USE/LAND COVER MAP AND ASSOCIATED ANALYSIS Maryland Department of Planning Daniel Baldwin Stephanie Martins November 19, 2012 http://www.planning.maryland.gov/ PURPOSE The primary purpose
Analyzing Suitability of Land for Affordable Housing
 Analyzing Suitability of Land for Affordable Housing Vern C. Svatos Jarrod S. Doucette Abstract: This paper explains the use of a geographic information system (GIS) to distinguish areas that might have
GEOCODING SELF-REPORTED ADDRESSES: LESSONS LEARNED. Karyn Backus CT Department of Public Health
 GEOCODING SELF-REPORTED ADDRESSES: LESSONS LEARNED Karyn Backus CT Department of Public Health GEOCODING ADDRESSES The process of assigning a location to an address Collect the address information Use
Regional GIS Initiatives Geospatial Technology Center
 Regional GIS Initiatives Geospatial Technology Center Mr. Bobby Lear GIS Coordinator St. James Parish & Dr. Balaji Ramachandran Contractors Educational Trust Fund Endowed Professor Geomatics Program, Department
FR Exam 2 Substitute Project!!!!!!! 1
 FR5131 - Exam 2 Substitute Project!!!!!!! 1 Goal We seek to identify county lands that both protect vernal pools and riparian corridors, and that provide open space and recreation within easy reach of
Geospatial Data Sources. SLO GIS User Group June 8, 2010
 Geospatial Data Sources SLO GIS User Group June 8, 2010 Presenters Drew Decker USGS Southern California Geospatial Liaison Kelly Bobbitt Mike Bobbitt & Associates Joe Larson Cal Fire Peter Meertens Regional
Evaluating Community Analyst for Use in School Demography Studies
 Portland State University PDXScholar Publications, Reports and Presentations Population Research Center 7-2013 Evaluating Community Analyst for Use in School Demography Studies Richard Lycan Portland State
Digitization in a Census
 Topics Connectivity of Geographic Data Sketch Maps Data Organization and Geodatabases Managing a Digitization Project Quality and Control Topology Metadata 1 Topics (continued) Interactive Selection Snapping
A Comprehensive Inventory of the Number of Modified Stream Channels in the State of Minnesota. Data, Information and Knowledge Management.
 A Comprehensive Inventory of the Number of Modified Stream Channels in the State of Minnesota Data, Information and Knowledge Management Glenn Skuta Environmental Analysis and Outcomes Division Minnesota
McHenry County Property Search Sources of Information
 Disclaimer: The information in this system may contain inaccuracies or typographical errors. The information in this system is a digital representation of information derived from original documents; as
Introduction to GIS I
 Introduction to GIS Introduction How to answer geographical questions such as follows: What is the population of a particular city? What are the characteristics of the soils in a particular land parcel?
How to Construct Urban Three Dimensional GIS Model based on ArcView 3D Analysis
 How to Construct Urban Three Dimensional GIS Model based on ArcView 3D Analysis Ko Ko Lwin Division of Spatial Information Science Graduate School of Life and Environmental Sciences University of Tsukuba
Overlay Analysis II: Using Zonal and Extract Tools to Transfer Raster Values in ArcMap
 Overlay Analysis II: Using Zonal and Extract Tools to Transfer Raster Values in ArcMap Created by Patrick Florance and Jonathan Gale, Edited by Catherine Ressijac on March 26, 2018 If you have raster data
Chesapeake Bay Remote Sensing Pilot Executive Briefing
 Chesapeake Bay Remote Sensing Pilot Executive Briefing Introduction In his Executive Order 13506 in May 2009, President Obama stated The Chesapeake Bay is a national treasure constituting the largest estuary
Exelis and Esri Technologies for Defense and National Security. Cherie Muleh
 Exelis and Esri Technologies for Defense and National Security Cherie Muleh Cherie.Muleh@exelisinc.com ENVI IMAGERY AND DATA BECOME KNOWLEDGE > Add information from imagery to your GIS > Automated workflows
GIS ADMINISTRATOR / WEB DEVELOPER EVANSVILLE-VANDERBURGH COUNTY AREA PLAN COMMISSION
 GIS ADMINISTRATOR / WEB DEVELOPER EVANSVILLE-VANDERBURGH COUNTY AREA PLAN COMMISSION SALARY RANGE INITIATION $43,277 SIX MONTHS $45,367 POSITION GRADE PAT VI The Evansville-Vanderburgh County Area Plan
Aerial Photography and Imagery Resources Guide
 Aerial Photography and Imagery Resources Guide Cheyenne and Laramie County Cooperative GIS Created and Maintained by the GIS Coordinator for the Cooperative GIS Program May 2016 CHEYENNE / LARAMIE COUNTY
STEREO ANALYST FOR ERDAS IMAGINE Stereo Feature Collection for the GIS Professional
 STEREO ANALYST FOR ERDAS IMAGINE Stereo Feature Collection for the GIS Professional STEREO ANALYST FOR ERDAS IMAGINE Has Your GIS Gone Flat? Hexagon Geospatial takes three-dimensional geographic imaging
Getting to know GIS. Chapter 1. Introducing GIS. Part 1. Learning objectives
 Part Getting to know GIS Chapter Introducing GIS Learning objectives Learn the uses of geographic information systems (GIS) Learn how GIS layers work Differentiate between GIS features and surfaces Obtain
Office of Geographic Information Systems
 Office of Geographic Information Systems Print this Page Spring 2008 - Desktop GIS: Collecting Features from Orthos By Joe Sapletal, GISP Keeping up with the growth of our area over the last ten years
Modeling the Rural Urban Interface in the South Carolina Piedmont: T. Stephen Eddins Lawrence Gering Jeff Hazelton Molly Espey
 Modeling the Rural Urban Interface in the South Carolina Piedmont: T. Stephen Eddins (teddins@clemson.edu) Lawrence Gering Jeff Hazelton Molly Espey ABSTRACT Continuing growth of America s cities has created
SPATIAL ANALYSIS. Transformation. Cartogram Central. 14 & 15. Query, Measurement, Transformation, Descriptive Summary, Design, and Inference
 14 & 15. Query, Measurement, Transformation, Descriptive Summary, Design, and Inference Geographic Information Systems and Science SECOND EDITION Paul A. Longley, Michael F. Goodchild, David J. Maguire,
Great California Delta Trail Blueprint for Contra Costa and Solano Counties GIS AND MAPPING MEMORANDUM JULY 2010
 Great California Delta Trail Blueprint for Contra Costa and Solano Counties GIS AND MAPPING MEMORANDUM JULY 2010 {DRAFT} July 2010 Introduction Geographic Information Systems (GIS) are computer-based
Spatial Process VS. Non-spatial Process. Landscape Process
 Spatial Process VS. Non-spatial Process A process is non-spatial if it is NOT a function of spatial pattern = A process is spatial if it is a function of spatial pattern Landscape Process If there is no
Lesson Plan 3 Google Earth Tutorial on Land Use for Middle and High School
 An Introduction to Land Use and Land Cover This lesson plan builds on the lesson plan on Understanding Land Use and Land Cover Using Google Earth. Please refer to it in terms of definitions on land use
Maryland Transit Administration (MTA) Bus Accident Mapping and Analysis Application
 Bus Accident Mapping and Analysis Application") Maryland Transit Administration (MTA) Bus Accident Mapping and Analysis Application Ralign Wells, MTA Administrator Bernadette Bridges, MTA Chief Safety Officer Office of Safety, Quality Assurance, and
Maryland Transit Administration (MTA) Bus Accident Mapping and Analysis Application Ralign Wells, MTA Administrator Bernadette Bridges, MTA Chief Safety Officer Office of Safety, Quality Assurance, and
Houston Plat Tracker puts the GIS in Land Development
 Houston Plat Tracker puts the GIS in Land Development Abstract: The Plat Tracker supports Houston's land development approval process. This home grown web-based system includes GIS research tools and a
StreBanD DSS: A Riparian Buffer Decision Support System for Planners
 StreBanD DSS: A Riparian Buffer Decision Support System for Planners Dharmendra Saraswat Assoc. Prof,/Ext. Engineer- Geospatial 501-681-5987 (mobile) dsaraswat@uaex.edu Acknowledgment Project Team: Dr.
Introducing GIS analysis
 1 Introducing GIS analysis GIS analysis lets you see patterns and relationships in your geographic data. The results of your analysis will give you insight into a place, help you focus your actions, or
Preparing GIS Data for NG9-1-1 in the Commonwealth of Virginia
 Preparing GIS Data for NG9-1-1 in the Commonwealth of Virginia Brian Crumpler Regional Coordinator Virginia Information Technologies Agency (VITA) February 28, 2017 1 1 Overview: Sharing ways Virginia
2018 NASCIO Award Submission Category: Cross-Boundary Collaboration and Partnerships. Project Title: Tennessee Wildfires: A Coordinated GIS Response
 2018 NASCIO Award Submission Category: Cross-Boundary Collaboration and Partnerships Project Title: Tennessee Wildfires: A Coordinated GIS Response Sevier County, Tennessee State of Tennessee, Emergency
Utilizing Data from American FactFinder with TIGER/Line Shapefiles in ArcGIS
 Utilizing Data from American FactFinder with TIGER/Line Shapefiles in ArcGIS Web Adams, GISP Data Dissemination Specialist U.S. Census Bureau New York Regional Office 1 What We Do Decennial Census Every
GIS for the Non-Expert
 GIS for the Non-Expert Ann Forsyth University of Minnesota February 2006 GIS for the Non-Expert 1. Definitions and problems 2. Measures being tested in Twin Cities Walking Study Basic approach, data, variables
USING HYPERSPECTRAL IMAGERY
 USING HYPERSPECTRAL IMAGERY AND LIDAR DATA TO DETECT PLANT INVASIONS 2016 ESRI CANADA SCHOLARSHIP APPLICATION CURTIS CHANCE M.SC. CANDIDATE FACULTY OF FORESTRY UNIVERSITY OF BRITISH COLUMBIA CURTIS.CHANCE@ALUMNI.UBC.CA
Urban Tree Canopy Assessment Purcellville, Virginia
 GLOBAL ECOSYSTEM CENTER www.systemecology.org Urban Tree Canopy Assessment Purcellville, Virginia Table of Contents 1. Project Background 2. Project Goal 3. Assessment Procedure 4. Economic Benefits 5.
STAR COMMUNITY RATING SYSTEM OBJECTIVE EE-4: EQUITABLE SERVICES & ACCESS COMMUNITY LEVEL OUTCOMES FOR KING COUNTY, WA
 STAR COMMUNITY RATING SYSTEM OBJECTIVE EE-4: EQUITABLE SERVICES & ACCESS COMMUNITY LEVEL OUTCOMES FOR KING COUNTY, WA OUTCOME I: EQUITABLE ACCESS AND PROXIMITY Background: This analysis has been developed
Introduction to Geographic Information Systems (GIS): Environmental Science Focus
: Environmental Science Focus") Introduction to Geographic Information Systems (GIS): Environmental Science Focus September 9, 2013 We will begin at 9:10 AM. Login info: Username:!cnrguest Password: gocal_bears Instructor: Domain: CAMPUS
Introduction to Geographic Information Systems (GIS): Environmental Science Focus September 9, 2013 We will begin at 9:10 AM. Login info: Username:!cnrguest Password: gocal_bears Instructor: Domain: CAMPUS
Miami-Dade County Technical Update Meeting South Florida Coastal Study. May 11, 2016
 Miami-Dade County Technical Update Meeting South Florida Coastal Study May 11, 2016 Welcome and Introductions FEMA Region IV Christina Lindemer Technical Lead Production and Technical Services (PTS) Contractor
Urban Dispersion and Data Handling in JEM
 Urban Dispersion and Data Handling in JEM Ian Griffiths, David Brook & Paul Cullen (Dstl) Tim Dudman & Russell Mills (RiskAware Ltd) Rick Fry (DTRA) Those parts produced by Dstl authors are Crown Copyright
Trimble s ecognition Product Suite
 Trimble s ecognition Product Suite Dr. Waldemar Krebs October 2010 Trimble Geospatial in the Image Processing Chain Data Acquisition Pre-processing Manual/Pixel-based Object-/contextbased Interpretation
the Clinch/Hidden Valley study site were used in this mountainous classification.
 the Clinch/Hidden Valley study site were used in this mountainous classification. Deciduous forest was present on over half of the image (Table 97). Coniferous forest and herbaceous were the only other
Error propagation models dlto examine the effects of geocoding quality on spatial analysis of individual level datasets
 Error propagation models dlto examine the effects of geocoding quality on spatial analysis of individual level datasets P.A. Zandbergen 1, T.C. Hart 2, K.E. Lenzer 1 and M.E. Camponovo 1 1 Department tof
Geodatabase An Introduction
 2013 Esri International User Conference July 8 12, 2013 San Diego, California Technical Workshop Geodatabase An Introduction David Crawford and Jonathan Murphy Session Path The Geodatabase What is it?
GIS CONCEPTS ARCGIS METHODS AND. 3 rd Edition, July David M. Theobald, Ph.D. Warner College of Natural Resources Colorado State University
 GIS CONCEPTS AND ARCGIS METHODS 3 rd Edition, July 2007 David M. Theobald, Ph.D. Warner College of Natural Resources Colorado State University Copyright Copyright 2007 by David M. Theobald. All rights
Geospatial Assessment in Support of Urban & Community Forestry Programs
 Geospatial Assessment in Support of Urban & Community Forestry Programs Funded by the USDA Forest Service, State and Private Forestry, under Cooperative Agreement # 06-CA-112244225-338 with the University
The 2010 Census Successful Because of GIS
 The 2010 Census Successful Because of GIS Timothy F. Trainor Chief, Geography Division, U.S. Census Bureau Vice President, International Cartographic Association Establishing the Framework of the Operation
Kimberly J. Mueller Risk Management Solutions, Newark, CA. Dr. Auguste Boissonade Risk Management Solutions, Newark, CA
 1.3 The Utility of Surface Roughness Datasets in the Modeling of United States Hurricane Property Losses Kimberly J. Mueller Risk Management Solutions, Newark, CA Dr. Auguste Boissonade Risk Management
The Road to Improving your GIS Data. An ebook by Geo-Comm, Inc.
 The Road to Improving your GIS Data An ebook by Geo-Comm, Inc. An individual observes another person that appears to be in need of emergency assistance and makes the decision to place a call to 9-1-1.