Disaster Risk Reduction and Response from a NASA Perspective
|
|
|
- Emery McDaniel
- 6 years ago
- Views:
Transcription


1 Disaster Risk Reduction and Response from a NASA Perspective Dr. David Green Disaster Program Manager Science Mission Directorate Earth Science Division Silver Jackets 6/13/2017 1


2 Overview Science Mission Directorate Earth Science Division Disaster Response


3 Application Themes & Societal Benefit Areas Programmatic Focus on: Health & Air Quality Disasters Water Resources Wildfires Ecological Forecasting Support ad hoc opportunities in additional areas: Agriculture & Food Security Aviation Safety Climate & Weather Energy Socioeconomic Impacts 3


4 Overview NASA Earth Science Disasters Risk Reduction and Response Earth Observations and Partnerships Case Studies and Workflows Opportunities and Next Steps 4


5 Challenge: Flash Flood Situation Heavy rain creates very fast rate of water rise. Important to know the flash flood guidance since most streams are not gauged


6 Radar data collected by NASA Reveals where the Ground is Sinking.. Subsidence Subsidence rates in the area of Norco, Louisiana, as well as the flood protection levees (the white lines). Location of water wells and local industry. The highest subsidence forms a bowl within the industrial site to the south of the river. Jefferson Parish, Louisiana, and how much subsidence has occurred in some areas. The measurements combine movement of the ground and structures. 6
7 Is there Timely and Relevant Remote Sensing Data and Information? Limitations for using remote sensing (satellite and airborne) due to Discovery and access to data Latency and frequency of measurements Spatial Resolution Variety of data and information products Need to consider if there is a timely flyover, rapid processing and mapping - if yes, data could prove useful. It all comes down to the questions being asked, knowing what is needed or available, and can it be applied against the time information is needed for action or decisions 7

8 Accurate Flood Hazard Identification - Require Innovation Solution Driven!* * J. Dorman, North Carolina Public Safety 8
9 Flood Response 9

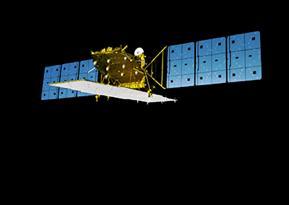
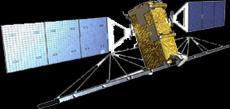
10 NASA Operating Missions
11 (Pre)Formulation Implementation Primary Ops Extended Ops Sentinel-6A/B (2020, 2025) Earth Science Instruments on ISS: CATS, (2020) LIS, (2017) SAGE III, (2017) TSIS-1, (2018) ECOSTRESS, (2018) GEDI, (2019) OCO-3, (2018) CLARREO-PF, (2021) TSIS-2 (2020) NASA Missions and Instruments Suomi NPP (NOAA) (>2022) Landsat 8 (USGS) (>2022) MAIA (~2021) TROPICS (~2021) GeoCarb (~2022) SMAP (>2022) ICESat-2 (2018) CYGNSS (2016) ISS SORCE, (2017) TCTE (NOAA) Terra (>2021) Aqua(>2022) JPSS-2 (NOAA) RBI, OMPS-Limb (2018) GRACE-FO (2) (2018) NISTAR, EPIC (2019) (NOAA S DSCOVR) QuikSCAT (2017) CloudSat (~2018) Landsat 7 (USGS) (~2022) CALIPSO (>2022) EO-1 (2017) Landsat 9 (2020 PACE (2022) NISAR (2022) SWOT (2021) TEMPO (2018) InVEST/Cubesats MiRaTA (2017) RAVAN (2016) IceCube (2017) HARP (2017) TEMPEST-D (2018) RainCube (2018*) CubeRRT (2018*) CIRiS (2018*) CIRAS (2018*) LMPC (----) *Target date, not yet manifested GPM (>2022) OCO-2 (>2022) Aura (>2022) GRACE (2) (2018) OSTM/Jason 2 (>2022) (NOAA)

12 Airborne 12


13 NASA provides a unique perspective


14 International Coordination and Data Sharing Group on Earth Observations Committee of Earth Observing Satellites International Charter. GEO Flood Task: Supporting access to a unified system of space data acquisition and delivery, models and mapping to support those affected by natural or man-made disasters CEOS Flood Dashboard


15 From Data to Modeling to Mapping Tools for Decision Support


16 Socio-Economic Data and Applications Center (SEDAC) People and Place The sheer number of people in that situation is challenging to manage, said Kytt MacManus from the Center for International Earth Science Information Network at Columbia University, who developed the localized maps from a NASA Socioeconomic Data and Applications Center (SEDAC) data set. Population Density Below 5m Evacuation would push millions of people over gridlocked roads and through choked bridges and tunnels. And many people are unwilling to evacuate, MacManus said, alluding to research showing about half of people ordered to evacuate refuse to or are reluctant to leave, or face barriers to leaving such as age, illness, or poverty. Without making policymakers aware of elevation issues, and making the connection to the number of people impacted, it is hard to get their attention. The data broaden the community that registers on their radar, MacManus said. Landscape Change and Storm Surge 16
17 Risk Reduction Global to local reach for substantive events Monitoring and observation of the earth as a system 24x7, with constellation of satellites, airborne assets, ground systems free and open to all Capacity building in person, online, train-the-training to improve discovery, usability and demonstration Harvesting and exploiting data NASA and Non-NASA data and processing systems Infrastructure and natural resource impact maps and models Near real-time and direct readout data/product access and visualization systems Geospatial platform, GIS and web services EOSDIS Distributed Active Archive Centers (DAACs) 17

18 Risk Reduction Convergent and integrated research Basic and applied, technology and flight Human Capital Disaster and Data Coordinators, Event and Engagement Leads Integrated workforce of scientists, technologists, communication and emergency management specialists Principal Investigators, Users, and Volunteer Networks Partnerships Assistance in selecting and obtaining data Access to data-handling and visualization tools Notification of data-related news Technical support and referrals 18


19 NASA Data Centers of Interest 19
20 Other Data Resources of Interest The 3DEP program has the national mandate for digital elevation. can be used to search, preview, and download individual LIDAR files. The collection is located under the Digital Elevation and Radar categories. 20

21 NASA s Tiered Response

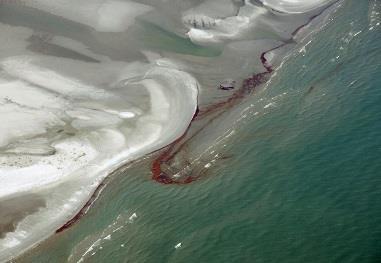
22 Deepwater Horizon Oil Spill


23 NASA Tier 1 Response to Record Flooding Mapping a Disaster from Illinois to Mississippi December 29, 2015 January 15, 2016 Consolidated flood and waterindex maps GIS-capable web-mapping, visualization and decision tools Inundation and Damage proxy maps/assessments Imagery and interpretive support Prioritized, shared, ingested and processed SAR and optical data over areas of interest and disseminated products to stakeholders


24 NASA Coordinates Synchronized Space-Air-Ground Observations for Louisiana Floods ALOS 2 Sentinel 1A COSMO-SkyMed RADARSAT 2 NOAA NASA coordinated synchronized observations of spaceborne SAR sensors, high-resolution airborne optical sensor, and field crews on the ground. 24
 of rainfall was estimated in large areas of southeastern Louisiana and extreme southern Mississippi.")
25 NASA Observes Historic Rainfall in Louisiana NASA's IMERG data from Aug. 8 to Aug. 15, 2016 showed over 20 inches (508 mm) of rainfall was estimated in large areas of southeastern Louisiana and extreme southern Mississippi. Even greater rainfall totals of 30 inches (762 mm) were indicated in a small area of Louisiana west of Lake Pontchartrain. Credits: NASA/JAXA, Hal Pierce 25
 of rainfall was estimated in large areas of southeastern Louisiana and extreme southern Mississippi.")
26 NASA Global Precipitation Mission GPM IMERG NASA's IMERG data from Aug. 8 to Aug. 15, 2016 showed over 20 inches (508 mm) of rainfall was estimated in large areas of southeastern Louisiana and extreme southern Mississippi. Even greater rainfall totals of 30 inches (762 mm) were indicated in a small area of Louisiana west of Lake Pontchartrain. Credits: NASA/JAXA, Hal Pierce 26
")


27 Global Flood Mapping System GFMS Satellite precipitation estimates merged via the GPM product are utilized as a key Input into the Global Flood Monitoring System (GFMS) utilizing land surface and routing models at 12 and 1 km resolution to estimate the occurrence and intensity of floods. The hydrological calculations are extended into the future (out to five days) using GEOS-5 rainfall predictions. Global Flood Monitoring System (GFMS) Adler/Wu University of Maryland VIIRS-based Inundation Estimate GFMS-based Inundation Estimate GFMS showing current conditions and forecasts (3-hr resolution) provided to help plan their response to estimate number of structures and homes impacted. Credit: Bob Adler and Huan WU, UMD 27


28 NPP Suomi VIIRS Flood Maps August 15-17, 2016 VIRRS Flood maps courtesy of Sanmei Li, GMU


29 NASA EO-1 Imagery August 16, m EO-1 imagery courtesy of Stu Frye, NASA GSFC. 29

30 International Space Stations (ISS) Handheld Digital Camera Photography ISS USOS crew acquired imagery of flooding area on Aug 16, 17, 23 in response to target requests from JSC Crew Earth Observations ops team Downlinked imagery reviewed and manually georeferenced prior to delivery to USGS HDDS team Data potentially useful for validation of SAR and flood extent model products 30

 and by DHS/FEMA in helping to restore power after Hurricane Sandy.")
31 Suomi NPP VIIRS Day-Night Band Detects Power Outages VIIRS DNB Image During Flood Event, August 15 th, 2016 NASA Night time optical data for assessing impact of the Louisiana floods at the request of FEMA. Image Before Flooding, May 7 th, 2016 Data was used for determining power outages as a means of mapping impact zones. (NASA Direct Readout Lab) and by DHS/FEMA in helping to restore power after Hurricane Sandy. Credit: Dalia Kirschbaum and Miguel Roman, NASA GSFC 31 31

32


33 ARIA Flood Proxy Map Derived from ALOS-2 SAR Data and Calibrated with Independent Observations NOAA 4-band Aerial Image Red Pixels: ARIA Flood Proxy Map Yellow Pushpins: USGS Water Edge 33
")
34 ARIA Flood Proxy Map Derived from ALOS-2 SAR Data and USGS Ground Observations (Water Edge Survey) 34
 delivered over 5 inches of rainfall")

.")
35 GPM Observes Pineapple Express rainfall, causing flooding in California January 2017 An atmospheric river ( Pineapple Express ) delivered over 5 inches of rainfall in parts of California in early January, 2017 (bottom) as viewed by GPM s IMERG data. The 30-day rainfall anomalies ending Jan. 10 th show TRMM Multisatellite Precipitation Analysis from 2017 (top right) and 2016 (bottom, right). Rainfall anomalies, Jan 10 th, 2017 Rainfall anomalies, Jan 10 th, 2016 Image credit: Hal Pierce, SSAI/GSFC
 shows >35% change in some areas meaning higher runoff/flood potential, consistent with other high-profile flood events SPoRT Soil Moisture")
 from the same day show very high soil moisture values in CA SPoRT has completed assimilation of the L2 SMAP soil moisture into the real-time LIS and is currently")
36 MSFC/SPoRT runs a real-time version of the NASA Land Information System (LIS) to output soil moisture products used in identifying areal flood potential during CA floods in January Surface soil moisture one-week change product from LIS (upper right) shows >35% change in some areas meaning higher runoff/flood potential, consistent with other high-profile flood events SPoRT Soil Moisture Products Highlight California Flood Potential January 2017 Select NOAA/National Weather Service offices have been using these products for identifying flood potential since early 2014 Level 2 SMAP soil moisture products (lower right) from the same day show very high soil moisture values in CA SPoRT has completed assimilation of the L2 SMAP soil moisture into the real-time LIS and is currently validating this offline run Working with to bring SMAP data 1) into the National Water Model and 2) to evaluate impacts on regional numerical weather prediction forecasts Bradley Zavodsky (NASA/MSFC), Jonathan Case (ENSCO, Inc.), Clay Blankenship (USRA)
 and during-the-event (2017-01-08 6 PM PST) Synthetic Aperture Radar (SAR) amplitude images.")

37 Synthetic Aperture Radar Uncovers Flooding in NV Radar image difference pre-event Flood Proxy Map (FPM) (12/15/16) and during event (1/8/17) covering an area of 155- by-224 miles (250-by-360 km), derived from Sentinel-1's pre- ( PM PST) and during-the-event ( PM PST) Synthetic Aperture Radar (SAR) amplitude images. The colored pixels represent areas of potential flood (Red: flooded vegetation, Blue: open water flood). Different irrigation conditions on the two data acquisition dates can produce errors on agricultural lands. This FPM should be used as guidance to identify potential areas of flooding, and may be less reliable over urban areas or snow cover. Science POC: Sang-Ho Yun Coordinator POC: Rashied Amin Date: 1/17/17 Blue: open water flood Red: flooded vegetation Map covers FEMA Primary AOI Overlap of Sentinel ground tracks and FEMA AOIs


38 Real Time Flood Impact System Detects Recent Flooding in Southern Thailand
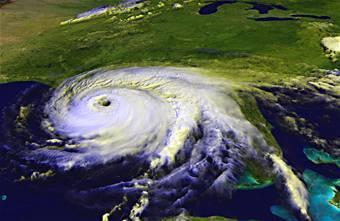
39 Hurricane Response 39


40 Global Precipitation Measurement (GPM) Sees inside Hurricane Joaquin Joaquin became a tropical storm on the evening (EDT) of Monday, September 28th midway between the Bahamas and Bermuda. GPM captured Joaquin Tuesday, September 29 th, 2015 at 21:39 UTC Visualization available at: 80p30.mp4

41 NASA's Integrated Multi-satellitE Retrievals for GPM (IMERG) data were used to estimate the historic amount of rain that fell during the past week in the Carolinas. GPM Observes Historic Rainfall Totals for Nor easter and Hurricane Joaquin
 Center has been working with the National Weather Service to")
 L2 GPROF Rain Rate image of")
42 GPM data used in Operational Decision Support at the National Hurricane Center NASA s Short-term Prediction Research and Transition (SPoRT) Center has been working with the National Weather Service to transition GPM observations into their decision support systems. 89 GHz RGB image of Hurricane Joaquin in N- AWIPS (1 Oct UTC) L2 GPROF Rain Rate image of Hurricane Joaquin in N-AWIPS (4 Oct UTC)

43 Soil Moisture modeled from NASA s Land Information System NASA s Land Information System runs operationally at MSFC using NOAA Stage IV precipitation and other forcing inputs to produce analyses and short term forecasts of soil moisture and other parameters. GPM and SMAP data are being integrated into this system.. In the graphic (right), dark blues and purples suggest that these soils are holding % of their water capacity, hence significant and immediate runoff that contributes to flash flooding.

44 Images on right shows VIIRS Day/Night Band highlighting Hurricane Joaquin and the East Coast Nor easter during October 1-5 th, 2015 when Hurricane Joaquin was a Category 1 storm. Applications of Suomi-NPP VIIRS Day/Night Band for Disaster Response
 measures ocean surface wind speed 4 Hurricane")
45 Hurricane Joaquin Over Flights Tropical Cyclone Intensity Experiment (TCI 2015) supported by Office of Naval Research NASA WB-57 (JSC) carrying: High Definition Sounding System (HDSS) dropsondes by Yankee Environmental Systems Measure vertical profiles of Temperature, Pressure, Relative Humidity, Wind Hurricane Imaging Radiometer HIRAD (MSFC) measures ocean surface wind speed 4 Hurricane Joaquin flights5 O ct 2 O ct 4 O ct 3 O ct

46 Hurricane Joaquin Friday 02 October 2015 Pass 2: 18:35 Z Preliminary HIRAD data, rough calibration. High Brightness Temperatures due to: Wind & Rain Islands 5 GHz Brightness Temperature Brightness varies across swath due to incidence angle; that is accounted for in subsequent wind speed retrievals


47 Hurricane Matthew October 2016

 and")
48 Flood Mapping SAR Applications In preparation for NISAR s launch, Disasters Team collaborators are working with a variety of platforms to develop products in support of disaster response efforts. Through the International Charter activation assets, the team obtained data through the CEOS Flood Pilot, and through Sentinel 1A/1B acquisitions from ESA. Team members contributed flood maps to USGS/HDDS and FEMA partners, including: SAR Imaging of Haiti, the Dominican Republic and eastern Cuba Products for the U.S. coastline including the eastern coast of Florida (via Charter/Radarsat-2) and the Carolinas (via Sentinel) Collaborations among team members are ongoing to share and explore best practices, improve products, their validation, and automation to provide service to FEMA and international partner disaster response efforts, and to build a user community in preparation for the launch of NISAR. Near St. Augustine, FL 7 Oct 2016 Flood GA FL SC Near Lumberton, NC 11 Oct 2016 Flood Imagery was acquired by RADARSAT-2 on 7 October 2016 RADARSAT-2 Sentinel 1A/1B imagery collected in partnership with ESA and delivered through the Alaska Satellite Facility / UAF.


49 Imaging Matthew s Circulation with GPM Collaborative effort between the GPM science team and NASA SPoRT provided brightness temperature and IMERG products to NOAA s National Weather Service and the National Hurricane Center. Images on the right capture snapshots of Matthew using NASA s Global Precipitation Measurement mission Microwave Imager (GPM GMI) data, as displayed within the AWIPS decision support system used by NOAA/National Weather Service partners. NASA s GPM GMI provides passive microwave brightness temperatures useful for displaying cyclone structure, particularly when able to see through overlying cirrus to the center of circulation and spiraling rain bands. In addition, cross-calibration of other passive microwave brightness temperatures are made available from the Precipitation Processing System, along with estimates of rainfall from the Integrated Multi-satellitE Retrievals for GPM (IMERG) product. Hurricane Matthew approaches Florida on at (top) 9 and (bottom) 19 UTC on October 6, with passive microwave brightness temperatures observed from the GPM GMI; data provided to NOAA/NWS/National
 as Matthew battered Hispaniola and Cuba On Oct.")


50 GPM observes Hurricane Matthew s rapid intensification and eyewall replacement GPM observed intense rainfall (left) as Matthew battered Hispaniola and Cuba On Oct. 2 (bottom left) GPM Core Observatory viewed a newly intensified Cat 4 storm south of Haiti, showing strong convection and heavy rainfall in the eye wall and rain bands GPM s Microwave Imager (bottom right) observed the storm going through eye wall LA replacement before impacting Florida as a Cat. 3. This data was provided to FEMA and NWS Offices for situational awareness 11 Nov. 2015


51 Soil Moisture Mapping of Matthew NASA s Land Information System (LIS) assisted NOAA/NWS partners with: Mapping high soil moisture content prior to Matthew and heavy rainfall events where flooding is likely Mapping dry soils to understand the extent of and change in drought, used by NWS partners to inform updates to the U.S. Drought Monitor Understanding how current conditions relate to 30-year climatology LIS outputs were shared with NOAA/NWS and USGS/HDDS during their Hurricane Matthew response. New application partners identified (U.S. Forest Service); other spinoffs to follow, including power-outage prediction when combined with predicted wind speeds, duration, and extent. (Top) (0-2 m) soil moisture (0-100%) pre- and post- Matthew. (Bottom) Soil moisture compared to 30-year climatology (percentiles). Pre-Matthew soils were saturated in the eastern Carolinas and drier in eastern Florida; high soil moisture remains. NASA SPoRT/GSFC LIS: October 1-12, 2016 Drought 0-2 m Soil Moisture Percentile (30-year Climatology)


")
52 Flood products provided for Hurricane Matthew Response The Global Flood Monitoring System provided inundation estimates, flood intensity/detection, and forecasts for Matthew (bottom right) GMU used VIIRS to map estimated inundation area follow Matthew s passage (bottom left) Inundation on same time: Oct. UTC 18:00: Global Flood Modeling System vs. GMU s VIIRS mapping Inundation Depth (mm) GFMS Samei Li, Donglian Sun/GMU Huan Wu, Bob Adler/UMD


53 Heavy Rainfall and Flood Prediction Extensive inland flooding was widely predicted as a result of extremely heavy rains inland of Matthew s trajectory up the eastern seaboard. The Global Flood Monitoring project used NASA GEOS-5 model simulations of precipitation, combined with streamflow and flood predictions to map areas of likely flooding in eastern North Carolina, South Carolina, coastal Georgia, and northeastern Florida. These areas experienced record rainfall with Matthew, resulting in several days of near or record flooding in the areas highlighted by the Global Flood Monitoring project s flood predictions. NASA GEOS-5 48-hour rainfall prediction (top) and associated prediction of streamflow and resulting flooding associated with Matthew s coastal impacts on the Carolinas and coastal Georgia.


54 Power Outages with S-NPP VIIRS Collaborations between NASA Goddard, their Direct Readout Laboratory, and MSFC/SPoRT have contributed pre- and post-event light comparisons using VIIRS Day-Night Band emissions and gridded products that incorporate corrections for moonlight. Atlanta This approach allows for analyzing changes between pre- and post-event scenes and identifying missing or reduced lights due to power outages and other impacts from Hurricane Matthew. Products provided to FEMA, with future goals of reduced latency and automation. Savannah Jacksonville Charleston GA FL SC Animation of change in lights pre- and postevent; lights here are shown in yellow, and preor post-event cloud cover in blue. Comparison of pre- ( normal ) and post-event light emission along the southeastern coast following Hurricane Matthew, on October 9.


55 Dr. David Green Disaster Response Program Manager Office: Mobile: Response: Program:
Current and Upcoming NASA Hurricane Measurement Missions National Hurricane Conference
 NASA Science Mission Directorate Earth Science Division Applied Sciences Program Current and Upcoming NASA Hurricane Measurement Missions National Hurricane Conference April 18, 2017 Formulation Implementation
Why Hydrological Services are Important to Business
 Why Hydrological Services are Important to Business Dr. David Green Program Manager, Disasters Earth Science Division David.s.green@nasa.gov May 8, 2018 2 Communities and Areas of Intensive Risk Socio-Economic
New NASA Ocean Observations and Coastal Applications
 New NASA Ocean Observations and Coastal Applications Duane Armstrong Chief, Applied Science & Technology Project Office August 20, 2014 1 Outline NASA s new Earth Science Ocean Science Missions for 2014
How does NASA study hurricanes? 17 August 2015, by Max Gleber
 How does NASA study hurricanes? 17 August 2015, by Max Gleber Hurricanes are the most powerful weather event on Earth. NASA's expertise in space and scientific exploration contributes to essential services
Unlocking a New Era in Biodiversity Science Keck Institute for Space Studies, Pasadena, CA, October 1-5, Dreaming of 2026
 Unlocking a New Era in Biodiversity Science Keck Institute for Space Studies, Pasadena, CA, October 1-5, 2018 Dreaming of 2026 Woody Turner Earth Science Division NASA Headquarters October 2, 2018 (Pre)Formulation
NASA Disasters Program: Response, Recovery, Mitigation and Resilience
 NASA Disasters Program: Response, Recovery, Mitigation and Resilience Dalia Kirschbaum, PhD NASA Disaster Response Coordinator Dalia.kirschbaum@nasa.gov https://disasters.nasa.gov NASA s Earth Observation
NASA Flood Monitoring and Mapping Tools
 National Aeronautics and Space Administration ARSET Applied Remote Sensing Training http://arset.gsfc.nasa.gov @NASAARSET NASA Flood Monitoring and Mapping Tools www.nasa.gov Outline Overview of Flood
Earth observations guided efforts to aid communities swamped by historic flooding 9 August 2017
 Earth observations guided efforts to aid communities swamped by historic flooding 9 August 2017 Credit: NASA Flooding killed more than 125 people in the U.S. in 2016. When disasters threaten the lives
JPSS GEONETCAST REQUIREMENTS DISCUSSION
 Joint Polar Satellite System (JPSS) JPSS GEONETCAST REQUIREMENTS DISCUSSION Mitch Goldberg Program Scientist Joint Polar Satellite System National Environmental Satellite, Data, and Information Service
NASA Disasters Program Approach/Principles
 Strengthening Disaster Risk Reduction and Reslience the Contributions of Earth Observations Dr. David Green Disasters Program Science Mission Directorate Earth Science Division UNITED NATIONS ESCAP Economic
Interpretation of Polar-orbiting Satellite Observations. Atmospheric Instrumentation
 Interpretation of Polar-orbiting Satellite Observations Outline Polar-Orbiting Observations: Review of Polar-Orbiting Satellite Systems Overview of Currently Active Satellites / Sensors Overview of Sensor
Space-based Weather and Climate Extremes Monitoring (SWCEM) Toshiyuki Kurino WMO Space Programme IPET-SUP-3, 2-4 May 2017
 Toshiyuki Kurino WMO Space Programme IPET-SUP-3, 2-4 May 2017") Space-based Weather and Climate Extremes Monitoring (SWCEM) Toshiyuki Kurino WMO Space Programme IPET-SUP-3, 2-4 May 2017 based on outcome from Workshop on Operational SWCEM 15-17 February 2017, Geneva
Space-based Weather and Climate Extremes Monitoring (SWCEM) Toshiyuki Kurino WMO Space Programme IPET-SUP-3, 2-4 May 2017 based on outcome from Workshop on Operational SWCEM 15-17 February 2017, Geneva
Mapping Coastal Change Using LiDAR and Multispectral Imagery
 Mapping Coastal Change Using LiDAR and Multispectral Imagery Contributor: Patrick Collins, Technical Solutions Engineer Presented by TABLE OF CONTENTS Introduction... 1 Coastal Change... 1 Mapping Coastal
Interagency Remote Sensing Coordination Call Conference Bridge: , Passcode:
 Interagency Remote Sensing Coordination Call Conference Bridge: 800-320-4330, Passcode: 132811 Tropical Activity Atlantic and Pacific Tuesday, September 12, 2018 FEMA RS Updates: 1. The International Charter
GC Briefing. Weather Sentinel Tropical Storm Michael. Status at 8 AM EDT (12 UTC) Today (NHC) Discussion. October 11, 2018
 Today (NHC) Discussion. October 11, 2018") GC Briefing Weather Sentinel Tropical Storm Michael October 11, 2018 After making landfall as a high-end category-4 hurricane on the Florida Panhandle, Michael weakened to tropical storm status early this
GC Briefing Weather Sentinel Tropical Storm Michael October 11, 2018 After making landfall as a high-end category-4 hurricane on the Florida Panhandle, Michael weakened to tropical storm status early this
The National Weather Service of the Future: Building a Weather-Ready Nation
 The of the Future: Building a Weather-Ready Nation Dr. Louis W. Uccellini Director, NOAA Assistant Administrator for Weather Services NCEP Production Suite Review December 2, 2014 Outline Building a Weather-Ready
Hurricane Matthew. National Weather Service Wilmington NC. Steven Pfaff, WCM.
 Hurricane Matthew Threat Assessment for northeast South Carolina & southeast North Carolina National Weather Service Wilmington NC 730 AM EDT Tuesday October 4, 2016 Steven Pfaff, WCM Steven.Pfaff@noaa.gov
CLIMATE CHANGE ADAPTATION BY MEANS OF PUBLIC PRIVATE PARTNERSHIP TO ESTABLISH EARLY WARNING SYSTEM
 CLIMATE CHANGE ADAPTATION BY MEANS OF PUBLIC PRIVATE PARTNERSHIP TO ESTABLISH EARLY WARNING SYSTEM By: Dr Mamadou Lamine BAH, National Director Direction Nationale de la Meteorologie (DNM), Guinea President,
United States Multi-Hazard Early Warning System
 United States Multi-Hazard Early Warning System Saving Lives Through Partnership Lynn Maximuk National Weather Service Director, Central Region Kansas City, Missouri America s s Weather Enterprise: Protecting
Haiti and Dominican Republic Flash Flood Initial Planning Meeting
 Dr Rochelle Graham Climate Scientist Haiti and Dominican Republic Flash Flood Initial Planning Meeting September 7 th to 9 th, 2016 Hydrologic Research Center http://www.hrcwater.org Haiti and Dominican
NASA Report on the Status of Current and Future Earth Satellite Systems
 NASA Report on the Status of Current and Future Earth Satellite Systems Presented to CGMS-46 Plenary Session, Agenda Item D.10 Presenter: Jack Kaye, NASA Headquarters Report prepared based on inputs from
Interagency Remote Sensing Coordination Call Conference Bridge: , Passcode:
 Interagency Remote Sensing Coordination Call Conference Bridge: 800-320-4330, Passcode: 247327 Tropical Activity Atlantic and Pacific Tuesday, September 12, 2018 Remote Sensing - NRCC and HQ: Preparing
Hurricane Season 2010 & NOAA s Deepwater Response
 Hurricane Season 2010 & NOAA s Deepwater Response What s Happened? What Will 2010 Bring? Possible Shoreline Effects Darin Figurskey Meteorologist-in-Charge NOAA s NWS Raleigh, NC NOAA s National Weather
Earth Science Flight Mission Overview
 Earth Science Flight Mission Overview Nand Topiwala Science Mission Directorate NASA Headquarters April 25, 2007 Earth Science Missions Afternoon Constellation, or A-Train, Multi-Satellite Observatory
Amita Mehta and Ana Prados
 Building Capacity in Utilizing NASA Remote Sensing Observations in SWAT for Water Resources and Agricultural Management Applications Amita Mehta and Ana Prados NASA - University of Maryland Baltimore County
NASA Operating Missions
 NASA WGCV38 Update K. Thome Based on charts from M. Freilich, H. Maring, B. Markham, S. Volz Earth Science Division, Science Mission Directorate September 2014 NASA Operating Missions Feb. 2013 Feb. 2014
The Delaware Environmental Monitoring & Analysis Center
 The Delaware Environmental Monitoring & Analysis Center Tina Callahan Delaware Estuary Science & Environmental Summit 2013 January 27-30, 2013 What is DEMAC? Delaware Environmental Monitoring & Analysis
Amina Rangoonwala and Elijah Ramsey III Wetland and Aquatic Research Center. U.S. Geological Survey. Lafayette, LA
 First I will show examples of radar mapping of hurricane surge extent and duration and optical mapping of the resultant marsh dieback along the Louisiana coast Next we extend these works to hurricane Sandy
Understanding Weather and Climate Risk. Matthew Perry Sharing an Uncertain World Conference The Geological Society, 13 July 2017
 Understanding Weather and Climate Risk Matthew Perry Sharing an Uncertain World Conference The Geological Society, 13 July 2017 What is risk in a weather and climate context? Hazard: something with the
P1.6 Simulation of the impact of new aircraft and satellite-based ocean surface wind measurements on H*Wind analyses
 P1.6 Simulation of the impact of new aircraft and satellite-based ocean surface wind measurements on H*Wind analyses Timothy L. Miller 1, R. Atlas 2, P. G. Black 3, J. L. Case 4, S. S. Chen 5, R. E. Hood
Effective Utilization of Synthetic Aperture Radar (SAR) Imagery in Rapid Damage Assessment
 Imagery in Rapid Damage Assessment") Effective Utilization of Synthetic Aperture Radar (SAR) Imagery in Rapid Damage Assessment Case Study Pakistan Floods SUPARCO M. Maisam Raza, Ahmad H. Rabbani SEQUENCE Flood Monitoring using Satellite
Effective Utilization of Synthetic Aperture Radar (SAR) Imagery in Rapid Damage Assessment Case Study Pakistan Floods SUPARCO M. Maisam Raza, Ahmad H. Rabbani SEQUENCE Flood Monitoring using Satellite
GC Briefing. Weather Sentinel Hurricane Florence. Status at 5 PM EDT (21 UTC) Today (NHC) Discussion. September 13, 2018
 Today (NHC) Discussion. September 13, 2018") GC Briefing September 13, 2018 Weather Sentinel Hurricane Florence Tropical storm conditions have been reported for areas of North Carolina and will continue to spread inland to the west and south. Hurricane
GC Briefing September 13, 2018 Weather Sentinel Hurricane Florence Tropical storm conditions have been reported for areas of North Carolina and will continue to spread inland to the west and south. Hurricane
3Chapter Three: Rescue and Response
 17 16 Report Science Title and the Storms: the USGS Response to the Hurricanes of 2005 3Chapter Three: Rescue and Response This chapter documents the U.S. Geological Survey s (USGS) humanitarian rescue
The Transition of Atmospheric Infrared Sounder Total Ozone Products to Operations
 The Transition of Atmospheric Infrared Sounder Total Ozone Products to Operations Emily Berndt 1, Bradley Zavodsky 2, Gary Jedlovec 2 1 NASA Postdoctoral Program Marshall Space Flight Center, Huntsville,
Rainfall-River Forecasting: Overview of NOAA s Role, Responsibilities, and Services
 Dr. Thomas Graziano Chief Hydrologic Services Division NWS Headquarters Steve Buan Service Coordination Hydrologist NWS North Central River Forecast Center Rainfall-River Forecasting: Overview of NOAA
NOAA Surface Weather Program
 NOAA Surface Weather Program Maintenance Decision Support System Stakeholder Meeting #9 Jim O Sullivan NOAA Surface Weather Program Manager NWS Office of Climate, Water, and Weather Services September
Japanese Programs on Space and Water Applications
 Japanese Programs on Space and Water Applications Tamotsu IGARASHI Remote Sensing Technology Center of Japan June 2006 COPUOS 2006 Vienna International Centre Water-related hazards/disasters may occur
What Can Citizen Scientists Tell Us about Drought?
 What Can Citizen Scientists Tell Us about Drought? Using CoCoRaHS to Improve the Monitoring and Reporting of Drought Impacts Amanda Farris, Kirsten Lackstrom Carolinas Integrated Sciences & Assessments
Tropical Update. 12 PM EDT Friday, October 7, 2016 Hurricane Matthew & Tropical Storm Nicole
 Tropical Update 12 PM EDT Friday, October 7, 2016 Hurricane Matthew & Tropical Storm Nicole This update is intended for government and emergency response officials, and is provided for informational and
An Overview of Operations at the West Gulf River Forecast Center Gregory Waller Service Coordination Hydrologist NWS - West Gulf River Forecast Center
 National Weather Service West Gulf River Forecast Center An Overview of Operations at the West Gulf River Forecast Center Gregory Waller Service Coordination Hydrologist NWS - West Gulf River Forecast
APPENDIX 2 OVERVIEW OF THE GLOBAL PRECIPITATION MEASUREMENT (GPM) AND THE TROPICAL RAINFALL MEASURING MISSION (TRMM) 2-1
 AND THE TROPICAL RAINFALL MEASURING MISSION (TRMM) 2-1") APPENDIX 2 OVERVIEW OF THE GLOBAL PRECIPITATION MEASUREMENT (GPM) AND THE TROPICAL RAINFALL MEASURING MISSION (TRMM) 2-1 1. Introduction Precipitation is one of most important environmental parameters.
APPENDIX 2 OVERVIEW OF THE GLOBAL PRECIPITATION MEASUREMENT (GPM) AND THE TROPICAL RAINFALL MEASURING MISSION (TRMM) 2-1 1. Introduction Precipitation is one of most important environmental parameters.
Regional Flash Flood Guidance and Early Warning System
 WMO Training for Trainers Workshop on Integrated approach to flash flood and flood risk management 24-28 October 2010 Kathmandu, Nepal Regional Flash Flood Guidance and Early Warning System Dr. W. E. Grabs
West Carroll Parish Hazard Mitigation Plan Update Public Meeting. August 25, 2015 Oak Grove, LA
 West Carroll Parish Hazard Mitigation Plan Update Public Meeting August 25, 2015 Oak Grove, LA Agenda Hazard Mitigation Planning Process SDMI Staff Risk Assessment SDMI Staff Update on Previous/Current
A Cloud-Based Flood Warning System For Forecasting Impacts to Transportation Infrastructure Systems
 A Cloud-Based Flood Warning System For Forecasting Impacts to Transportation Infrastructure Systems Jon Goodall Associate Professor, Civil and Environmental Engineering Associate Director, Link Lab April
Incorporation of SMOS Soil Moisture Data on Gridded Flash Flood Guidance for Arkansas Red River Basin
 Incorporation of SMOS Soil Moisture Data on Gridded Flash Flood Guidance for Arkansas Red River Basin Department of Civil and Environmental Engineering, The City College of New York, NOAA CREST Dugwon
5.2 IDENTIFICATION OF HAZARDS OF CONCERN
 5.2 IDENTIFICATION OF HAZARDS OF CONCERN 2016 HMP Update Changes The 2011 HMP hazard identification was presented in Section 3. For the 2016 HMP update, the hazard identification is presented in subsection
National Aeronautics and Space Administration. Earth Day is everyday at NASA. activity booklet
 National Aeronautics and Space Administration Earth Day is everyday at NASA activity booklet Earth Day is everyday at NASA NASA s Fleet of Earth Observing Satellites ACRIMSAT Landsat 7 Aqua SORCE Terra
Analyzing and Visualizing Precipitation and Soil Moisture in ArcGIS
 Analyzing and Visualizing Precipitation and Soil Moisture in ArcGIS Wenli Yang, Pham Long, Peisheng Zhao, Steve Kempler, and Jennifer Wei * NASA Goddard Earth Science Data and Information Services Center
Snowfall Detection and Rate Retrieval from ATMS
 Snowfall Detection and Rate Retrieval from ATMS Jun Dong 1, Huan Meng 2, Cezar Kongoli 1, Ralph Ferraro 2, Banghua Yan 2, Nai-Yu Wang 1, Bradley Zavodsky 3 1 University of Maryland/ESSIC/Cooperative Institute
David R. Vallee Hydrologist-in-Charge NOAA/NWS Northeast River Forecast Center
 David R. Vallee Hydrologist-in-Charge NOAA/NWS Northeast River Forecast Center Record flooding along the Shawsheen River during the 2006 Mother s Day Floods Calibrate and implement a variety of hydrologic
CoCoRaHS. Carolina PAGES Hurricane Matthew in South Carolina. CoCoRaHS Observers Activity During Hurricane Matthew.
 Carolina CoCoRaHS SUMMER 2017 Hurricane Matthew in South Carolina H urricane Matthew was the first South Carolina hurricane landfall since Hurricane Charley and Gaston came ashore in 2004. It made landfall
GPSRO and GNSS in the Context of NASA s Earth Science Program
 GPSRO and GNSS in the Context of NASA s Earth Science Program Dr. Jack Kaye* Associate Director for Research Earth Science Division Science Mission Directorate NASA Headquarters * This talk is prepared
GEOMATICS AND DISASTER MANAGEMENT: Early Impact assessment in Haiti
 GEOMATICS AND DISASTER MANAGEMENT: Early Impact assessment in Haiti We will talk about... Post-disaster response: the main questions to be answered Post-disaster rapid mapping: the role of Geomatics The
Active Weather Threat Halloween Week Nor easter October 28 th 31 st 2012
 Active Weather Threat Halloween Week Nor easter October 28 th 31 st 2012 Prepared 1130 AM EDT Wednesday, October 24, 2012 Gary Szatkowski NOAA s NJ Forecast Office Weather.gov/phi Purpose of Briefing Briefing
The NASA Soil Moisture Active Passive Mission (SMAP) Status and Early Results
 Status and Early Results") 20154 California Institute of Technology. Government sponsorship acknowledged. National Aeronautics and Space Administration The NASA Soil Moisture Active Passive Mission (SMAP) Status and Early Results
20154 California Institute of Technology. Government sponsorship acknowledged. National Aeronautics and Space Administration The NASA Soil Moisture Active Passive Mission (SMAP) Status and Early Results
23 rd Annual CQSDI Gregory L. Robinson, Deputy Associate Administrator for Programs March 2016
 23 rd Annual CQSDI Gregory L. Robinson, Deputy Associate Administrator for Programs March 2016 Achieving Alignment for Pioneering Space HUMAN EXPLORATION & OPERATIONS (HEOMD) OFFICE OF COMMUNICATIONS SCIENCE
Monthly Long Range Weather Commentary Issued: SEPTEMBER 19, 2016 Steven A. Root, CCM, Chief Analytics Officer, Sr. VP,
 Monthly Long Range Weather Commentary Issued: SEPTEMBER 19, 2016 Steven A. Root, CCM, Chief Analytics Officer, Sr. VP, sroot@weatherbank.com SEPTEMBER 2016 Climate Highlights The Month in Review The contiguous
Global Precipitation Measurement Mission Overview & NASA Status
 Global Precipitation Measurement Mission Overview & NASA Status Gail Skofronick Jackson GPM Project Scientist (appointed 14 January 2014) Replacing Dr. Arthur Hou (1947-2013) NASA Goddard Space Flight
SMAP Winds. Hurricane Irma Sep 5, AMS 33rd Conference on Hurricanes and Tropical Meteorology Ponte Vedra, Florida, 4/16 4/20, 2018
 Intensity and Size of Strong Tropical Cyclones in 2017 from NASA's SMAP L-Band Radiometer Thomas Meissner, Lucrezia Ricciardulli, Frank Wentz, Remote Sensing Systems, Santa Rosa, USA Charles Sampson, Naval
2006 & 2007 Pre-Hurricane Scenario Analyses
 2006 & 2007 Pre-Hurricane Scenario Analyses Executive Summary May 2007 Page 1 OF X FOR OFFICIAL USE ONLY 4 Public Availability to be Determined Under 5 U.S.C. 552 NOTE: Limited Distribution. Release of
5.2 IDENTIFICATION OF HAZARDS OF CONCERN
 5.2 IDENTIFICATION OF HAZARDS OF CONCERN 2015 HMP Update Changes The 2010 HMP hazard identification was presented in Section 6. For the 2015 HMP update, the hazard identification is presented in subsection
GIS in Weather and Society
 GIS in Weather and Society Olga Wilhelmi Institute for the Study of Society and Environment National Center for Atmospheric Research WAS*IS November 8, 2005 Boulder, Colorado Presentation Outline GIS basic
Remote Sensing I: Basics
 Remote Sensing I: Basics Kelly M. Brunt Earth System Science Interdisciplinary Center, University of Maryland Cryospheric Science Laboratory, Goddard Space Flight Center kelly.m.brunt@nasa.gov (Based on
Contribution to global Earth observation from satellites
 Contribution to global Earth observation from satellites - JAXA s Earth Observation strategy - April 16, 2008 Makoto Kajii Japan Aerospace Exploration Agency Earth Observation Summits and GEOSS 1 st EO
CGMS-45-WMO-WP-05 Monitoring Extreme Weather and Climate from Space. World Meteorological Organization (WMO) Space Programme
 Space Programme") CGMS-45-WMO-WP-05 Monitoring Extreme Weather and Climate from Space World Meteorological Organization (WMO) Space Programme Introduction UNOSAT Report Satellite Detected Waters over Xieng Ngneun District,
CGMS-45-WMO-WP-05 Monitoring Extreme Weather and Climate from Space World Meteorological Organization (WMO) Space Programme Introduction UNOSAT Report Satellite Detected Waters over Xieng Ngneun District,
Daily Operations Briefing. Tuesday, March 27, :30 a.m. EDT
 Daily Operations Briefing Tuesday, March 27, 2018 8:30 a.m. EDT Significant Activity Mar 26-27 Significant Events: None Tropical Activity: Western Pacific No activity affecting U.S. interests Significant
CEOS Overview and JAXA Plans for Water Cycle Observation
 CEOS Overview and JAXA Plans for Water Cycle Observation Asian Water Cycle Symposium November 2-4, 2005 Tokyo, Japan Chu Ishida Japan Aerospace Exploration Agency (JAXA) Contents 1. CEOS overview 2. CEOS
Welcome Jeff Orrock Warning Coordination Meteorologist National Weather Service Raleigh
 Welcome Jeff Orrock Warning Coordination Meteorologist National Weather Service Raleigh Jeff.orrock@noaa.gov Sources: Operational Significant Event Imagery and the Environmental Applications Team (EAT)
New Jersey Department of Transportation Extreme Weather Asset Management Pilot Study
 New Jersey Department of Transportation Extreme Weather Asset Management Pilot Study Overview Prepared for: June 26, 2018 Introduction Overview of Pilot Study New Jersey s Climate New Jersey s Transportation
Ellen L. Mecray NOAA Regional Climate Services Director, Eastern Region Taunton, MA
 Ellen L. Mecray NOAA Regional Climate Services Director, Eastern Region Taunton, MA Regions of the US National Climate Assessment What we Observe: Climate changes and impacts Extreme precipitation and
National Situation Report As of 5:00 a.m. EDT Tuesday, April 4, 2017
 Overview National Situation Report As of 5:00 a.m. EDT Tuesday, April 4, 2017 Table Of Contents Current Operations Monitoring Recovery National Response Coordination Center: Not Activated National Watch
IDENTIFICATION OF HAZARDS OF CONCERN
 IDENTIFICATION OF HAZARDS OF CONCERN To provide a strong foundation for mitigation strategies considered in Section 6, the Village considered a full range of hazards that could impact the area and then
JCOMM-CHy Coastal Inundation Forecasting Demonstration Project (CIFDP)
") WMO World Meteorological Organization Working together in weather, climate and water JCOMM-CHy Coastal Inundation Forecasting Demonstration Project (CIFDP) Coastal Flooding & Vulnerable Populations Coastal
WMO World Meteorological Organization Working together in weather, climate and water JCOMM-CHy Coastal Inundation Forecasting Demonstration Project (CIFDP) Coastal Flooding & Vulnerable Populations Coastal
Comparative Analysis of Hurricane Vulnerability in New Orleans and Baton Rouge. Dr. Marc Levitan LSU Hurricane Center. April 2003
 Comparative Analysis of Hurricane Vulnerability in New Orleans and Baton Rouge Dr. Marc Levitan LSU Hurricane Center April 2003 In order to compare hurricane vulnerability of facilities located in different
Flood SensorWeb Dan Mandl / Fritz Policelli NASA/GSFC
 Flood SensorWeb Dan Mandl / Fritz Policelli NASA/GSFC 10-16-08 1 Purpose Vision of Flood Sensor Web Present status of Flood SensorWeb initiative Some relevant examples from Fire SensorWeb efforts Goal
The National Integrated Drought Information System (NIDIS) Moving the Nation from Reactive to Proactive Drought Risk Management
 Moving the Nation from Reactive to Proactive Drought Risk Management") The National Integrated Drought Information System (NIDIS) Moving the Nation from Reactive to Proactive Drought Risk Management CSG-West Annual Meeting Agriculture & Water Committee Snowbird, UT September
The National Integrated Drought Information System (NIDIS) Moving the Nation from Reactive to Proactive Drought Risk Management CSG-West Annual Meeting Agriculture & Water Committee Snowbird, UT September
Creating a WeatherSMART nation: SAWS drought related research, services and products
 Creating a WeatherSMART nation: SAWS drought related research, services and products Drought Dialogue 23-24 June 2016 Western Cape Government Hannes Rautenbach South African Weather Service SAWS mandate
NOAA s National Weather Service Philadelphia/Mt. Holly NJ
 Next Briefing Package: Friday, October 2, 2015 no later than 300 PM Hazards and Impacts: Overview: A dangerous weather pattern still threatens our region. Threats include very heavy rainfall, inland river
Tropical Update. 5 AM EDT Tuesday, September 12, 2017 Post-Tropical Cyclone Irma, Hurricane Jose, & Tropical Wave (10%)
") Tropical Update 5 AM EDT Tuesday, September 12, 2017 Post-Tropical Cyclone Irma, Hurricane Jose, & Tropical Wave (10%) This update is intended for government and emergency response officials, and is provided
Tropical Update 5 AM EDT Tuesday, September 12, 2017 Post-Tropical Cyclone Irma, Hurricane Jose, & Tropical Wave (10%) This update is intended for government and emergency response officials, and is provided
Hurricane Matthew Threats and Impacts Briefing for Eastern NC
 Hurricane Matthew Threats and Impacts Briefing for Eastern NC October 6 th, 2016 Date/Time Created: 10/6/2016, Noon EDT National Weather Service Newport/Morehead City, NC Hurricane Matthew Key Points Changes
Hurricane Matthew Page 1 Location Forecast Analysis Summary Report - Advanced Wind Estimation On
 Page 1 Current NHC Forecast Predictions Maximum Sustained Winds / Storm Category: 138 MPH / Category 4 Forward motion: 9 mph towards the North Hurricane Force winds extend from the center: 46 miles Tropical
Discovery and Access to Global Water Data, Maps and Services
 Discovery and Access to Global Water Data, Maps and Services David K. Arctur, PhD david.arctur@utexas.edu University of Texas at Austin Open Geospatial Consortium (OGC) Esri International User Conference
RADAR Remote Sensing Application Examples
 RADAR Remote Sensing Application Examples! All-weather capability: Microwave penetrates clouds! Construction of short-interval time series through cloud cover - crop-growth cycle! Roughness - Land cover,
Hurricane Matthew. National Weather Service Wilmington NC. Steven Pfaff, WCM.
 Hurricane Matthew Threat Assessment for northeast South Carolina & southeast North Carolina National Weather Service Wilmington NC 515 PM EDT Monday October 3, 2016 Steven Pfaff, WCM Steven.Pfaff@noaa.gov
National Situation Report As of 3:00 a.m. EDT, Thursday, September 21, 2017 Table of Contents Current Operations Monitoring Recovery
 25k Overview National Situation Report As of 3:00 a.m. EDT, Thursday, September 21, 2017 Table of Contents Current Operations Monitoring Recovery FEMA Headquarters Status FEMA Region Status NRCC Level
Radio Frequency Earth Science
 Radio Frequency Earth Science Overview for Committee On Radio Frequency (CORF) National Academy of Science National Research Council April 27, 2005 Bill.Watson@NASA.Gov Program Executive for Ground Networks
Condition Monitoring: A New System for Drought Impacts Reporting through CoCoRaHS
 Condition Monitoring: A New System for Drought Impacts Reporting through CoCoRaHS Amanda Farris Carolinas Integrated Sciences & Assessments (CISA) University of South Carolina WERA 1012 Annual Conference
Weather Information for Surface Transportation (WIST): Update on Weather Impacts and WIST Progress
: Update on Weather Impacts and WIST Progress") Weather Information for Surface Transportation (WIST): Update on Weather Impacts and WIST Progress Samuel P. Williamson Office of the Federal Coordinator for Meteorological Services and Supporting Research
Weather Information for Surface Transportation (WIST): Update on Weather Impacts and WIST Progress Samuel P. Williamson Office of the Federal Coordinator for Meteorological Services and Supporting Research
Central Asia Regional Flash Flood Guidance System 4-6 October Hydrologic Research Center A Nonprofit, Public-Benefit Corporation
 http://www.hrcwater.org Central Asia Regional Flash Flood Guidance System 4-6 October 2016 Hydrologic Research Center A Nonprofit, Public-Benefit Corporation FFGS Snow Components Snow Accumulation and
The Climate of the Carolinas: Past, Present, and Future - Results from the National Climate Assessment
 The Climate of the Carolinas: Past, Present, and Future - Results from the National Climate Assessment Chip Konrad Chris Fuhrmann Director of the The Southeast Regional Climate Center Associate Professor
Mapping rainfall and flooding
 Mapping rainfall and flooding BY DAVID WALBERT Although Hurricane Floyd was the biggest storm of 1999 and the one most remembered, eastern North Carolina was hit by three hurricanes in a six-week period
EXTRACTION OF FLOODED AREAS DUE THE 2015 KANTO-TOHOKU HEAVY RAINFALL IN JAPAN USING PALSAR-2 IMAGES
 EXTRACTION OF FLOODED AREAS DUE THE 2015 KANTO-TOHOKU HEAVY RAINFALL IN JAPAN USING PALSAR-2 IMAGES F. Yamazaki a, *, W. Liu a a Chiba University, Graduate School of Engineering, Chiba 263-8522, Japan
Weather forecasts and warnings: Support for Impact based decision making
 Weather forecasts and warnings: Support for Impact based decision making Gerry Murphy, Met Éireann www.met.ie An Era of Change Climate and weather is changing Societal vulnerability is increasing The nature
Coastal Emergency Risks Assessment - CERA Real-Time Storm Surge and Wave Visualization Tool
 Coastal Emergency Risks Assessment - CERA Real-Time Storm Surge and Wave Visualization Tool Introduction This document provides guidance for using the Coastal Emergency Risks Assessment (CERA) visualization
Geo-information and Disaster Risk Reduction in the Hindu Kush-Himalayan region
 Geo-information and Disaster Risk Reduction in the Hindu Kush-Himalayan region Basanta Shrestha, Division Head MENRIS, International Centre for Integrated Mountain Development Kathmandu, Nepal The International
Observation (EO) & Geomatics in Canada
 & Geomatics in Canada") Innovating to Increase the Impact of Earth Observation (EO) & Geomatics in Canada Natural Resources Canada February 25, 2014 Prashant Shukle, Director General Canada Centre for Mapping and Earth Observation
Innovating to Increase the Impact of Earth Observation (EO) & Geomatics in Canada Natural Resources Canada February 25, 2014 Prashant Shukle, Director General Canada Centre for Mapping and Earth Observation
Hurricane Floyd Symposium. Satellite Precipitation as a Tool to Reanalyze Hurricane Floyd and Forecast Probabilities of Extreme Rainfall
 Sept. 18, 2009 Hurricane Floyd Symposium Scott Curtis, East Carolina Universtiy Satellite Precipitation as a Tool to Reanalyze Hurricane Floyd and Forecast Probabilities of Extreme Rainfall What was the
Operational Perspectives on Hydrologic Model Data Assimilation
 Operational Perspectives on Hydrologic Model Data Assimilation Rob Hartman Hydrologist in Charge NOAA / National Weather Service California-Nevada River Forecast Center Sacramento, CA USA Outline Operational
NOAA/NESDIS Tropical Web Page with LEO Satellite Products and Applications for Forecasters
 NOAA/NESDIS Tropical Web Page with LEO Satellite Products and Applications for Forecasters Sheldon Kusselson National Oceanic and Atmospheric Administration (NOAA) National Environmental Satellite Data
Hurricane Matthew. Life Threatening Flash Flooding Likely. National Weather Service Wilmington NC. Josh Weiss, Meteorologist
 Hurricane Matthew Life Threatening Flash Flooding Likely Threat Assessment for northeast South Carolina & southeast North Carolina National Weather Service Wilmington NC 630 PM EDT Friday October 7, 2016