Responsive Traffic Management Through Short-Term Weather and Collision Prediction
|
|
|
- Clara Gwenda Brown
- 5 years ago
- Views:
Transcription

")

1 Responsive Traffic Management Through Short-Term Weather and Collision Prediction Presenter: Stevanus A. Tjandra, Ph.D. City of Edmonton Office of Traffic Safety (OTS) Co-authors: Yongsheng Chen, Ph.D., P.Eng., Frank Feng, Ph.D. OTS Tony Qiu, Ph.D., Gerhard Reuter, Ph.D., Lawrence Lan, M.Sc., Clark Pennely, M.Sc. University of Alberta

2 Weather-Responsive Traffic Management (WRTM) City of Edmonton Weather and Collision Prediction
3 City of Edmonton Office of Traffic Safety (OTS) Established in 2006 as a result of Mayor Traffic Safety Task Force Focus on urban traffic safety through evidence-based approaches Shifting Rural to Urban World Population (UN Report 2009): Year Urban Population Rural Population billion 3.4 billion billion 2.9 billion The OTS will reduce the prevalence of fatal, injury, and property damage collisions through the 4 E s of traffic safety (Engineering, Education, Enforcement, and Evaluation) by improving urban traffic safety engineering road user behaviour speed management and data, business intelligence and analytics

4 Weather Impacts on Safety and Mobility US DOT Road Weather Management Program: 1 In US, over 5,870,000 vehicle collisions each year - 23% (nearly 1,312,000) are weatherrelated. On average, 6,250 fatalities and over 480,000 injuries in weather-related collisions each year. 23 percent of the non-recurrent delay on highways across the US is due to snow, ice, and fog 544 million vehicle-hours of delay per year. Weather-related collision costs in Canada are estimated to be approximately $1 billion per year. 2 Survey indicated the importance of information on weather conditions for travelers. 3 51% 1 accessed on May 15, Andrey, J., B. Mills, and J. Vandermolen. Weather Information and Road Safety: Final Report. Final Report Presented to the Institute for Catastrophic Loss Reduction, Downloadable from 3 Federal Highway Administration. US Department of Transportation. Weather-Responsive Traffic Management: New Approaches to Improve Safety and Mobility. (Spring 2011). FHWA-JPO

5 Daily temperature (ºC) Snowfall (cm) Weather in Edmonton Throughout the year, temperatures can range from below -40 C during the winter, to above 30 C in the summer Average Jan Feb Mar Apr May Jun Jul Aug Sep Oct Nov Dec Average # days with snow depth of at least 1, 5, 10 or 20 cm on the ground ( ) 1 Jan Feb Mar Apr May Jun Jul Aug Sep Oct Nov Dec >= 1 cm >= 5 cm >= 10 cm >= 20 cm In the City of Edmonton, around 57% of collisions occurred in the fall and winter months (January - March and October - December) Climate Normals & Averages 2 City of Edmonton annual motor vehicle collision reports. Downloadable from


6 Weather Impacts on Traffic Safety: Trends and Patterns
7 Weather Impacts on Traffic Safety Weather impact on collision 1 : Min Temp<-10, Total Snow>0 and Speed of Max Gust >20 increased FTC (Followed Too Closely) collisions between 17.9% and 33.0%. 1 El-Basyouny, K., Barua, S., Islam, Md.T., Li, R Assessing the Effect of Weather States on Crash Severity and Type using Full Bayesian Multivariate Safety Models. TRB 93rd Annual Meeting Compendium.

8 Weather-Responsive Traffic Management (WRTM) Goal 1 : to minimize the delay and risk experienced by motorists while driving in bad weather. Strategies 1 : Advisory strategies provide warning and other information to travelers; Control strategies to regulate or optimize traffic flow; and Treatment strategies to ensure the roads are clear of obstructions Implementation: Integrated Transportation Management Centre WRTM Congestion management Advanced Traveler Information System (ATIS) Situational awareness and planning functionality Emergency operations centre capability 1 Federal Highway Administration. US Department of Transportation. Weather-Responsive Traffic Management: Real Solutions for Serious Traffic Problems. FHWA-JPO Increase access, mobility and safety
9 WRTM - City of Edmonton s Initiative Building 6 new weather stations collecting/calculating: Wind speed and direction Barometer pressure Snow and rain fall Air temperature and humidity Dew point Weather, collision and traffic flow (volume & speed) prediction: Current state: 7 days ahead prediction of citywide daily weather and collision Collision prediction: public roadway collisions and police-call (CAD) collisions Collaborators: Weather prediction: Department of Earth and Atmospheric Sciences, University of Alberta Collision and traffic flow prediction: City of Edmonton Office of Traffic Safety Web-base application: Department of Civil and Environmental Engineering, University of Alberta Current users: the Edmonton Police Service and City of Edmonton Office of Traffic Safety


 High Speed")

10 1-Apr 2-Apr 3-Apr 4-Apr 5-Apr 6-Apr 7-Apr 8-Apr 9-Apr 12-Feb 13-Feb 14-Feb 15-Feb 16-Feb 17-Feb 18-Feb 19-Feb 20-Feb 21-Feb 22-Feb 23-Feb 24-Feb 25-Feb 26-Feb 27-Feb 28-Feb 1-Mar 2-Mar 3-Mar 4-Mar 5-Mar 6-Mar 7-Mar 8-Mar 9-Mar 10-Mar Predicted Total & FTC Collisions Amount of Precipitation (MM) Snow Fall Amount (cm) 11/20/ /22/ /24/ /26/ /28/ /30/ /02/ /04/ /06/ /08/ /10/ /12/ /14/ /16/ /18/ /20/ /22/ /24/ /26/ /28/ /30/ /01/ /03/ /05/ /07/ /09/2013 City of Edmonton Weather, Collision and Traffic Flow Prediction Weather Data Set-up for Edmonton Calendar Data Month, Day of Week, Holiday Traffic Flow Data VDS Sites: Speed, Volume Traffic Speed (km/h, Location: SW VDS Site - WMD & 156 St) High Speed Alert Warranted Future Work day-earlier Forecast Snow (cm) Actual Amount Snow (cm) 7-day-earlier Forecast Snow (cm) Past Future Volume & Speed Prediction Day PredictedTotal PredictedFTC AmountPrecipitation Weather Prediction Collision Prediction
 and humidity Visibility Weather data source: National Oceanic and Atmospheric Administration (NOAA) Use Weather Research and Forecasting model (WRF) for prediction Prediction accuracy: RSME:")
11 Equitable Threat (skill) RSME Predicted variables by four quadrants (NE, SE, NW, SW): Wind speed and direction Barometer pressure Snow and rain fall Weather Prediction Air temperature (low, high, mean) and humidity Visibility Weather data source: National Oceanic and Atmospheric Administration (NOAA) Use Weather Research and Forecasting model (WRF) for prediction Prediction accuracy: RSME: Root Mean Squared Error Weather Prediction Error 1st Day 2nd Day 3rd Day 4th Day 5th Day 6th Day 7th Day Day in Prediction Weather Prediction Error: Precipitation 1st Day 2nd Day 3rd Day 4th Day 5th Day 6th Day 7th Day Day in Prediction Max T (ºC) Min T (ºC) Wind Speed (km/h) 0.2 mm 1.0 mm 5.0 mm


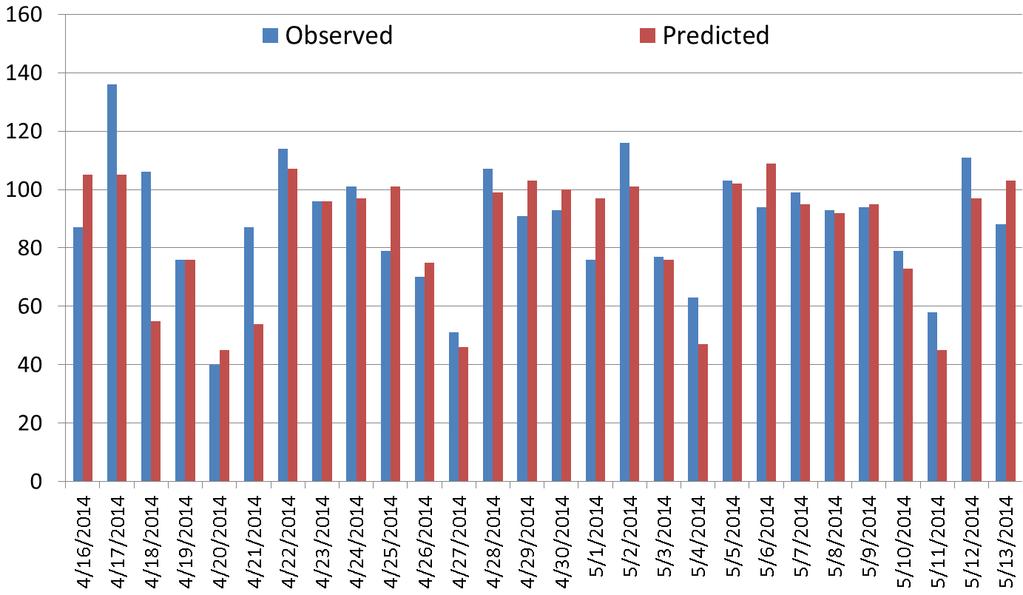
12 Public Roadway Collision Prediction MAE: Mean Absolute Error MAPE: Mean Absolute Percent Error

13 Police call (CAD)-Collision Prediction MAPE 13%

14 Weather and Collision Prediction: Web-Base Application
15 Benefits Icy Curves Ahead Icy Curve Warning System (ICWS) 1 Deployment of the ICWS reduced the number of annual collisions by 18% (CMF = 0.82), PDO collision rate was reduced from 5.51 to 4.00 collisions per winter season Fatal and Injury collision rate decreased from 2.86 to 2.67 collisions per season ICWS has potentially provided safety benefits of $1.7 million dollars per winter season 1 Zhirui, Y., Veneziano, D., Turnbull, I., Safety Effects of Icy Curve Warning Systems. Presented at the 91st Annual Meeting of the Transportation Research Board, Paper No , Washington, D.C., (2012)
16 Next Steps Hourly predictions for the next 7 days; models updated every 6 hours Alarm threshold development Collision prediction by specific area and corridors Traffic volume and speed prediction CMF and C/B-ratio estimation Integration with the Traffic Management Centre Utilize media (radio, TV) and social media (Twitter, Facebook) to increase driver awareness

17 Thank You Contact:
UDOT Weather Program Traffic Operations Center
 UDOT Weather Program Traffic Operations Center Presentation Goals You MUST account for weather in your Traffic Management program Provide you with information on proven tools and strategies You NEED a
Weather Information for Road Managers
 Weather Information for Road Managers by Paul A. Pisano, Lynette C. Goodwin and Andrew D. Stern How Does Weather Affect Roads? The complex interactions between weather and roads have major affects on traffic
Dust Storms in Arizona: The Challenge to Ensure Motorist Safety Jennifer Toth, P.E. Deputy Director for Transportation
 Dust Storms in Arizona: The Challenge to Ensure Motorist Safety Jennifer Toth, P.E. Deputy Director for Transportation Arizona Department of Transportation AASHTO Extreme Weather Event Symposium May 21,
Road Weather Management Program
 Road Weather Management Program AASHTO/TRB Joint Maintenance Conference: Highway Safety & Reliability (Winter Maintenance and Highway Safety and Reliability) 7/22/2015 Gabe Guevara. P.E. FHWA Office of
Safety effects of lower speed limits during winter months
 Safety effects of lower speed limits during winter months Jaakko Klang Traffic Safety Engineer Centres for Economic Development, Transport and the Environment Finland 13.9.2018 1 1. Finland 13.9.2018 2
Weather Information for Surface Transportation (WIST): Update on Weather Impacts and WIST Progress
: Update on Weather Impacts and WIST Progress") Weather Information for Surface Transportation (WIST): Update on Weather Impacts and WIST Progress Samuel P. Williamson Office of the Federal Coordinator for Meteorological Services and Supporting Research
Weather Information for Surface Transportation (WIST): Update on Weather Impacts and WIST Progress Samuel P. Williamson Office of the Federal Coordinator for Meteorological Services and Supporting Research
FHWA Road Weather Management Program Update
 FHWA Road Weather Management Program Update 2015 Winter Maintenance Peer Exchange Bloomington, MN September 21-25, 2015 Gabe Guevara FHWA Office of Operations Road Weather Management Team 2015 Winter Maintenance
Champaign-Urbana 2001 Annual Weather Summary
 Champaign-Urbana 2001 Annual Weather Summary ILLINOIS STATE WATER SURVEY 2204 Griffith Dr. Champaign, IL 61820 wxobsrvr@sws.uiuc.edu Maria Peters, Weather Observer January: After a cold and snowy December,
2003 Water Year Wrap-Up and Look Ahead
 2003 Water Year Wrap-Up and Look Ahead Nolan Doesken Colorado Climate Center Prepared by Odie Bliss http://ccc.atmos.colostate.edu Colorado Average Annual Precipitation Map South Platte Average Precipitation
A Preliminary Severe Winter Storms Climatology for Missouri from
 A Preliminary Severe Winter Storms Climatology for Missouri from 1960-2010 K.L. Crandall and P.S Market University of Missouri Department of Soil, Environmental and Atmospheric Sciences Introduction The
Champaign-Urbana 2000 Annual Weather Summary
 Champaign-Urbana 2000 Annual Weather Summary ILLINOIS STATE WATER SURVEY 2204 Griffith Dr. Champaign, IL 61820 wxobsrvr@sws.uiuc.edu Maria Peters, Weather Observer January: January started on a mild note,
Appendix BAL Baltimore, Maryland 2003 Annual Report on Freeway Mobility and Reliability
 (http://mobility.tamu.edu/mmp) Office of Operations, Federal Highway Administration Appendix BAL Baltimore, Maryland 2003 Annual Report on Freeway Mobility and Reliability This report is a supplement to:
CHARACTERISTICS OF TRAFFIC ACCIDENTS IN COLD, SNOWY HOKKAIDO, JAPAN
 CHARACTERISTICS OF TRAFFIC ACCIDENTS IN COLD, SNOWY HOKKAIDO, JAPAN Motoki ASANO Director Traffic Engineering Division Civil Engineering Research Institute of 1-3 Hiragishi, Toyohira-ku, Sapporo, 062-8602,
The Climate of Pontotoc County
 The Climate of Pontotoc County Pontotoc County is part of the Crosstimbers. This region is a transition region from the Central Great Plains to the more irregular terrain of southeast Oklahoma. Average
CoCoRaHS Monitoring Colorado s s Water Resources through Community Collaborations
 CoCoRaHS Monitoring Colorado s s Water Resources through Community Collaborations Nolan Doesken Colorado Climate Center Atmospheric Science Department Colorado State University Presented at Sustaining
TMC Monthly Operational Summary
 TMC Monthly Operational Summary March Bureau of Transportation Systems Management & Operations (TSMO) NH Department of Transportation s Mission Transportation excellence enhancing the quality of life in
TMC Monthly Operational Summary
 TMC Monthly Operational Summary July 1 Bureau of Transportation Systems Management & Operations (TSMO) NH Department of Transportation s Mission Transportation excellence enhancing the quality of life
Future Weather in Toronto and the GTA
 Future Weather in Toronto and the GTA Due to Climate Change Electrical Sector Meeting, Nov. 23 rd, 2011 Christopher Ll. Morgan, PhD Toronto Environment Office Contents 2 Introduction (Why We Did What We
Weather and Travel Time Decision Support
 Weather and Travel Time Decision Support Gerry Wiener, Amanda Anderson, Seth Linden, Bill Petzke, Padhrig McCarthy, James Cowie, Thomas Brummet, Gabriel Guevara, Brenda Boyce, John Williams, Weiyan Chen
The Climate of Marshall County
 The Climate of Marshall County Marshall County is part of the Crosstimbers. This region is a transition region from the Central Great Plains to the more irregular terrain of southeastern Oklahoma. Average
Memo. I. Executive Summary. II. ALERT Data Source. III. General System-Wide Reporting Summary. Date: January 26, 2009 To: From: Subject:
 Memo Date: January 26, 2009 To: From: Subject: Kevin Stewart Markus Ritsch 2010 Annual Legacy ALERT Data Analysis Summary Report I. Executive Summary The Urban Drainage and Flood Control District (District)
The Climate of Bryan County
 The Climate of Bryan County Bryan County is part of the Crosstimbers throughout most of the county. The extreme eastern portions of Bryan County are part of the Cypress Swamp and Forest. Average annual
Drought in Southeast Colorado
 Drought in Southeast Colorado Nolan Doesken and Roger Pielke, Sr. Colorado Climate Center Prepared by Tara Green and Odie Bliss http://climate.atmos.colostate.edu 1 Historical Perspective on Drought Tourism
Transportation and Road Weather
 Portland State University PDXScholar TREC Friday Seminar Series Transportation Research and Education Center (TREC) 4-18-2014 Transportation and Road Weather Rhonda Young University of Wyoming Let us know
VIRGINIA S I-77 VARIABLE SPEED LIMIT SYSTEM FOR LOW VISIBILITY CONDITIONS
 VIRGINIA S I-77 VARIABLE SPEED LIMIT SYSTEM FOR LOW VISIBILITY CONDITIONS Christopher D. McDonald, PE, PTOE Regional Operations Director, Southwest Region NRITS and ITS Arizona Annual Conference October
Sierra Weather and Climate Update
 Sierra Weather and Climate Update 2014-15 Kelly Redmond Western Regional Climate Center Desert Research Institute Reno Nevada Yosemite Hydroclimate Workshop Yosemite Valley, 2015 October 8-9 Percent of
The Climate of Grady County
 The Climate of Grady County Grady County is part of the Central Great Plains, encompassing some of the best agricultural land in Oklahoma. Average annual precipitation ranges from about 33 inches in northern
The Climate of Payne County
 The Climate of Payne County Payne County is part of the Central Great Plains in the west, encompassing some of the best agricultural land in Oklahoma. Payne County is also part of the Crosstimbers in the
The Climate of Kiowa County
 The Climate of Kiowa County Kiowa County is part of the Central Great Plains, encompassing some of the best agricultural land in Oklahoma. Average annual precipitation ranges from about 24 inches in northwestern
Local Ctimatotogical Data Summary White Hall, Illinois
 SWS Miscellaneous Publication 98-5 STATE OF ILLINOIS DEPARTMENT OF ENERGY AND NATURAL RESOURCES Local Ctimatotogical Data Summary White Hall, Illinois 1901-1990 by Audrey A. Bryan and Wayne Armstrong Illinois
The Climate of Seminole County
 The Climate of Seminole County Seminole County is part of the Crosstimbers. This region is a transition region from the Central Great Plains to the more irregular terrain of southeastern Oklahoma. Average
The Climate of Murray County
 The Climate of Murray County Murray County is part of the Crosstimbers. This region is a transition between prairies and the mountains of southeastern Oklahoma. Average annual precipitation ranges from
Colorado s 2003 Moisture Outlook
 Colorado s 2003 Moisture Outlook Nolan Doesken and Roger Pielke, Sr. Colorado Climate Center Prepared by Tara Green and Odie Bliss http://climate.atmos.colostate.edu How we got into this drought! Fort
The Climate of Texas County
 The Climate of Texas County Texas County is part of the Western High Plains in the north and west and the Southwestern Tablelands in the east. The Western High Plains are characterized by abundant cropland
What are Intelligent Transportation Systems? Major ITS Areas
 Intelligent Transportation Systems in Small Cities and Rural Areas Indiana Road School March 20, 2001 Steven Beningo Federal Highway Administration Midwestern Resource Center What are Intelligent Transportation
Fort Rucker Wx Operations
 Spring & Summer Weather Hazards Fort Rucker Wx Operations Overview Hours of Operation OWS vs FRWXOPS Products Services Climatology Seasonal Patterns Seasonal Hazards Hours of Operation Observing 24/7 (automated)
Fall & Winter Weather Hazards. Presented by: Fort Rucker Weather Operations
 Fall & Winter Weather Hazards Presented by: Fort Rucker Weather Operations Products & Services FRWXOPS Provides: Weather Briefings Resource Protection Observing PMSV Climatology Seasonal Weather Briefings
Tornado Hazard Risk Analysis: A Report for Rutherford County Emergency Management Agency
 Tornado Hazard Risk Analysis: A Report for Rutherford County Emergency Management Agency by Middle Tennessee State University Faculty Lisa Bloomer, Curtis Church, James Henry, Ahmad Khansari, Tom Nolan,
The Climate of Haskell County
 The Climate of Haskell County Haskell County is part of the Hardwood Forest. The Hardwood Forest is characterized by its irregular landscape and the largest lake in Oklahoma, Lake Eufaula. Average annual
Missouri River Basin Water Management Monthly Update
 Missouri River Basin Water Management Monthly Update Participating Agencies 255 255 255 237 237 237 0 0 0 217 217 217 163 163 163 200 200 200 131 132 122 239 65 53 80 119 27 National Oceanic and Atmospheric
Champaign-Urbana 1998 Annual Weather Summary
 Champaign-Urbana 1998 Annual Weather Summary ILLINOIS STATE WATER SURVEY Audrey Bryan, Weather Observer 2204 Griffith Dr. Champaign, IL 61820 wxobsrvr@sparc.sws.uiuc.edu The development of the El Nìno
NEWS RELEASE. Province boosts winter highway safety measures
 For Immediate Release 2018TRAN0045-000567 April 4, 2018 NEWS RELEASE Province boosts winter highway safety measures VICTORIA Following an intense winter, the is undertaking several improvements to make
Climatography of the United States No
 Climate Division: AK 5 NWS Call Sign: ANC Month (1) Min (2) Month(1) Extremes Lowest (2) Temperature ( F) Lowest Month(1) Degree s (1) Base Temp 65 Heating Cooling 90 Number of s (3) Jan 22.2 9.3 15.8
Complete Weather Intelligence for Public Safety from DTN
 Complete Weather Intelligence for Public Safety from DTN September 2017 White Paper www.dtn.com / 1.800.610.0777 From flooding to tornados to severe winter storms, the threats to public safety from weather-related
2003 Moisture Outlook
 2003 Moisture Outlook Nolan Doesken and Roger Pielke, Sr. Colorado Climate Center Prepared by Tara Green and Odie Bliss http://climate.atmos.colostate.edu Through 1999 Through 1999 Fort Collins Total Water
5.0 WHAT IS THE FUTURE ( ) WEATHER EXPECTED TO BE?
 WEATHER EXPECTED TO BE?") 5.0 WHAT IS THE FUTURE (2040-2049) WEATHER EXPECTED TO BE? This chapter presents some illustrative results for one station, Pearson Airport, extracted from the hour-by-hour simulations of the future period
5.0 WHAT IS THE FUTURE (2040-2049) WEATHER EXPECTED TO BE? This chapter presents some illustrative results for one station, Pearson Airport, extracted from the hour-by-hour simulations of the future period
GAMINGRE 8/1/ of 7
 FYE 09/30/92 JULY 92 0.00 254,550.00 0.00 0 0 0 0 0 0 0 0 0 254,550.00 0.00 0.00 0.00 0.00 254,550.00 AUG 10,616,710.31 5,299.95 845,656.83 84,565.68 61,084.86 23,480.82 339,734.73 135,893.89 67,946.95
EXAMINATION OF THE SAFETY IMPACTS OF VARYING FOG DENSITIES: A CASE STUDY OF I-77 IN VIRGINIA
 0 0 0 EXAMINATION OF THE SAFETY IMPACTS OF VARYING FOG DENSITIES: A CASE STUDY OF I- IN VIRGINIA Katie McCann Graduate Research Assistant University of Virginia 0 Edgemont Road Charlottesville, VA 0 --
Funding provided by NOAA Sectoral Applications Research Project CLIMATE. Basic Climatology Colorado Climate Center
 Funding provided by NOAA Sectoral Applications Research Project CLIMATE Basic Climatology Colorado Climate Center Remember These? Factor 1: Our Energy Source Factor 2: Revolution & Tilt Factor 3: Rotation!
ALASKA REGION CLIMATE OUTLOOK BRIEFING. December 22, 2017 Rick Thoman National Weather Service Alaska Region
 ALASKA REGION CLIMATE OUTLOOK BRIEFING December 22, 2017 Rick Thoman National Weather Service Alaska Region Today s Outline Feature of the month: Autumn sea ice near Alaska Climate Forecast Basics Climate
10/18/2016 The Hoosier Co. Inc W. 86th Street, Indianapolis, IN
 10/18/2016 The Hoosier Co. Inc. 5421 W. 86th Street, Indianapolis, IN 46268 1 Today s Topics Weather impacts What is RWIS? How old is this tool? Key RWIS Technology/Innovation Key RWIS sensing parameters
Research Needs for Weather-Responsive Traffic Management
 1 Research Needs for Weather-Responsive Traffic Management Paul A. Pisano, Team Leader Federal Highway Administration (FHWA), Office of Operations Road Weather Management 400 Seventh Street, S.W. HOTO-1,
Changing Hydrology under a Changing Climate for a Coastal Plain Watershed
 Changing Hydrology under a Changing Climate for a Coastal Plain Watershed David Bosch USDA-ARS, Tifton, GA Jeff Arnold ARS Temple, TX and Peter Allen Baylor University, TX SEWRU Objectives 1. Project changes
WHEN IS IT EVER GOING TO RAIN? Table of Average Annual Rainfall and Rainfall For Selected Arizona Cities
 WHEN IS IT EVER GOING TO RAIN? Table of Average Annual Rainfall and 2001-2002 Rainfall For Selected Arizona Cities Phoenix Tucson Flagstaff Avg. 2001-2002 Avg. 2001-2002 Avg. 2001-2002 October 0.7 0.0
Applications/Users for Improved S2S Forecasts
 Applications/Users for Improved S2S Forecasts Nolan Doesken Colorado Climate Center Colorado State University WSWC Precipitation Forecasting Workshop June 7-9, 2016 San Diego, CA First -- A short background
National Rural ITS Conference 2006
 National Rural ITS Conference 2006 Design of Automated Variable Speed Limits and Lane Assignments in Rural Areas Presented by: Tom Blaine P. E., POE New Mexico Department of Transportation Intelligent
Center for Transportation Research and Education. Winter Maintenance Operations & Maintenance Decision Support System TRANS 691 Seminar March 5, 2004
 Center for Transportation Research and Education Winter Maintenance Operations & Maintenance Decision Support System TRANS 691 Seminar March 5, 2004 1 Why Winter Maintenance? Weather related traffic accidents
MDSS and Advanced Forecasting STSMO Weather Workshop Dave Huft, SDDOT Research Program Manager September 12, 2017
 Connecting South Dakota and the Nation MDSS and Advanced Forecasting STSMO Weather Workshop Dave Huft, SDDOT Research Program Manager September 12, 2017 1 Weather Impacts & Strategies Winter perceived
Missouri River Basin Water Management Monthly Update
 Missouri River Basin Water Management Monthly Update Participating Agencies 255 255 255 237 237 237 0 0 0 217 217 217 163 163 163 200 200 200 131 132 122 239 65 53 80 119 27 National Oceanic and Atmospheric
A Report on a Statistical Model to Forecast Seasonal Inflows to Cowichan Lake
 A Report on a Statistical Model to Forecast Seasonal Inflows to Cowichan Lake Prepared by: Allan Chapman, MSc, PGeo Hydrologist, Chapman Geoscience Ltd., and Former Head, BC River Forecast Centre Victoria
Missouri River Basin Water Management Monthly Update
 Missouri River Basin Water Management Monthly Update Participating Agencies 255 255 255 237 237 237 0 0 0 217 217 217 163 163 163 200 200 200 131 132 122 239 65 53 80 119 27 National Oceanic and Atmospheric
What Does It Take to Get Out of Drought?
 What Does It Take to Get Out of Drought? Nolan J. Doesken Colorado Climate Center Colorado State University http://ccc.atmos.colostate.edu Presented at the Insects, Diseases and Drought Workshop, May 19,
Evaluation of NDDOT Fixed Automated Spray Technology (FAST) Systems November 24, 2009
 Systems November 24, 2009") Evaluation of NDDOT Fixed Automated Spray Technology (FAST) Systems November 4, 009 Shawn Birst, PE Program Director, ATAC Associate Research Fellow Upper Great Plains Transportation Institute North Dakota
Evaluation of NDDOT Fixed Automated Spray Technology (FAST) Systems November 4, 009 Shawn Birst, PE Program Director, ATAC Associate Research Fellow Upper Great Plains Transportation Institute North Dakota
The Effects of Weather on Urban Trail Use: A National Study
 The Effects of Weather on Urban Trail Use: A National Study Alireza Ermagun, Tracy Haden-Loh, Greg Lindsey May 3, 2016 Rails to Trails Conservancy Trail Modeling and Assessment Platform Objectives Monitor
Section 12. Winter Storms
 Section 12. Winter Storms Contents Why Winter Storms are a Threat...12-1 Hazard Profile...12-1 History of Winter Storms...12-4 People and Property at Risk...12-7 Potential Damages and Losses...12-7 Why
Seasonal Climate Watch September 2018 to January 2019
 Seasonal Climate Watch September 2018 to January 2019 Date issued: Aug 31, 2018 1. Overview The El Niño-Southern Oscillation (ENSO) is still in a neutral phase and is still expected to rise towards an
APPENDIX G-7 METEROLOGICAL DATA
 APPENDIX G-7 METEROLOGICAL DATA METEOROLOGICAL DATA FOR AIR AND NOISE SAMPLING DAYS AT MMR Monthly Normals and Extremes for Honolulu International Airport Table G7-1 MMR RAWS Station Hourly Data Tables
Missouri River Basin Water Management Monthly Update
 Missouri River Basin Water Management Monthly Update Participating Agencies 255 255 255 237 237 237 0 0 0 217 217 217 163 163 163 200 200 200 131 132 122 239 65 53 80 119 27 National Oceanic and Atmospheric
Seasonal Climate Watch June to October 2018
 Seasonal Climate Watch June to October 2018 Date issued: May 28, 2018 1. Overview The El Niño-Southern Oscillation (ENSO) has now moved into the neutral phase and is expected to rise towards an El Niño
Climatography of the United States No
 Climate Division: CA 4 NWS Call Sign: Month (1) Min (2) Month(1) Extremes Lowest (2) Temperature ( F) Lowest Month(1) Degree s (1) Base Temp 65 Heating Cooling 100 Number of s (3) Jan 55.6 39.3 47.5 77
Climatography of the United States No
 Climate Division: CA 5 NWS Call Sign: Month (1) Min (2) Month(1) Extremes Lowest (2) Temperature ( F) Lowest Month(1) Degree s (1) Base Temp 65 Heating Cooling 100 Number of s (3) Jan 56.6 36.5 46.6 81
Climatography of the United States No
 Climate Division: CA 1 NWS Call Sign: Month (1) Min (2) Month(1) Extremes Lowest (2) Temperature ( F) Lowest Month(1) Degree s (1) Base Temp 65 Heating Cooling 100 Number of s (3) Jan 57.9 38.9 48.4 85
Climatography of the United States No
 Climate Division: CA 5 NWS Call Sign: Month (1) Min (2) Month(1) Extremes Lowest (2) Temperature ( F) Lowest Month(1) Degree s (1) Base Temp 65 Heating Cooling 100 Number of s (3) Jan 44.8 25.4 35.1 72
Climatography of the United States No
 Climate Division: CA 4 NWS Call Sign: Month (1) Min (2) Month(1) Extremes Lowest (2) Temperature ( F) Lowest Month(1) Degree s (1) Base Temp 65 Heating Cooling 100 Number of s (3) Jan 49.4 37.5 43.5 73
Climatography of the United States No
 Climate Division: CA 6 NWS Call Sign: Month (1) Min (2) Month(1) Extremes Lowest (2) Temperature ( F) Lowest Month(1) Degree s (1) Base Temp 65 Heating Cooling 100 Number of s (3) Jan 69.4 46.6 58.0 92
Climatography of the United States No
 Climate Division: CA 4 NWS Call Sign: Month (1) Min (2) Month(1) Extremes Lowest (2) Temperature ( F) Lowest Month(1) Degree s (1) Base Temp 65 Heating Cooling 1 Number of s (3) Jan 58.5 38.8 48.7 79 1962
Climatography of the United States No
 Climate Division: CA 6 NWS Call Sign: Month (1) Min (2) Month(1) Extremes Lowest (2) Temperature ( F) Lowest Month(1) Degree s (1) Base Temp 65 Heating Cooling 1 Number of s (3) Jan 67.5 42. 54.8 92 1971
Climatography of the United States No
 Climate Division: CA 1 NWS Call Sign: Month (1) Min (2) Month(1) Extremes Lowest (2) Temperature ( F) Lowest Month(1) Degree s (1) Base Temp 65 Heating Cooling 1 Number of s (3) Jan 57.8 39.5 48.7 85 1962
HAZARD DESCRIPTION... 1 LOCATION... 1 EXTENT... 1 HISTORICAL OCCURRENCES...
 WINTER STORM HAZARD DESCRIPTION... 1 LOCATION... 1 EXTENT... 1 HISTORICAL OCCURRENCES... 3 SIGNIFICANT PAST EVENTS... 4 PROBABILITY OF FUTURE EVENTS... 5 VULNERABILITY AND IMPACT... 5 Hazard Description
Active Traffic & Safety Management System for Interstate 77 in Virginia. Chris McDonald, PE VDOT Southwest Regional Operations Director
 Active Traffic & Safety Management System for Interstate 77 in Virginia Chris McDonald, PE VDOT Southwest Regional Operations Director Interstate 77 at Fancy Gap Mountain Mile markers 0-15 Built in late
Climatography of the United States No
 Climate Division: ND 8 NWS Call Sign: BIS Month (1) Min (2) Month(1) Extremes Lowest (2) Temperature ( F) Lowest Month(1) Degree s (1) Base Temp 65 Heating Cooling 100 Number of s (3) Jan 21.1 -.6 10.2
Climatography of the United States No
 Climate Division: TN 1 NWS Call Sign: Month (1) Min (2) Month(1) Extremes Lowest (2) Temperature ( F) Lowest Month(1) Degree s (1) Base Temp 65 Heating Cooling 100 Number of s (3) Jan 47.6 24.9 36.3 81
Climatography of the United States No
 Climate Division: CA 5 NWS Call Sign: FAT Month (1) Min (2) Month(1) Extremes Lowest (2) Temperature ( F) Lowest Month(1) Degree s (1) Base Temp 65 Heating Cooling 1 Number of s (3) Jan 53.6 38.4 46. 78
CLIMATE OVERVIEW. Thunder Bay Climate Overview Page 1 of 5
 CLIMATE OVERVIEW The climate in the Thunder Bay area is typical of a mid-latitude inland location with a Great Lake Moderating influence. The moderating effect of Lake Superior results in cooler summer
Climatography of the United States No
 Climate Division: CA 6 NWS Call Sign: 1L2 N Lon: 118 3W Month (1) Min (2) Month(1) Extremes Lowest (2) Temperature ( F) Lowest Month(1) Degree s (1) Base Temp 65 Heating Cooling 1 Number of s (3) Jan 63.7
BUDT 733 Data Analysis for Decision Makers
 BUDT 733 Data Analysis for Decision Makers Fall 2007 - Sections DC01 Exploring A Trip to Hawaii What drives flight delays between DC and Honolulu by Prashant Bhaip Andres Garay Vedat Kaplan Greg Vinogradovg
US Drought Status. Droughts 1/17/2013. Percent land area affected by Drought across US ( ) Dev Niyogi Associate Professor Dept of Agronomy
 Dev Niyogi Associate Professor Dept of Agronomy") Droughts US Drought Status Dev Niyogi Associate Professor Dept of Agronomy Deptof Earth Atmospheric Planetary Sciences Indiana State Climatologist Purdue University LANDSURFACE.ORG iclimate.org climate@purdue.edu
Droughts US Drought Status Dev Niyogi Associate Professor Dept of Agronomy Deptof Earth Atmospheric Planetary Sciences Indiana State Climatologist Purdue University LANDSURFACE.ORG iclimate.org climate@purdue.edu
Climatography of the United States No
 Climate Division: CA 5 NWS Call Sign: BFL Month (1) Min (2) Month(1) Extremes Lowest (2) Temperature ( F) Lowest Month(1) Degree s (1) Base Temp 65 Heating Cooling 1 Number of s (3) Jan 56.3 39.3 47.8
8 VISIBILITY. 8.1 Setting. 8.2 Assessment Focus. Table 8-1: Key Issue for Visibility
 Volume 2: Environmental and Sturgeon Upgrader Project 8 VISIBILITY 8.1 Setting The Project is in Sturgeon County within Alberta s Industrial Heartland area (the Heartland). The Heartland includes a number
UWM Field Station meteorological data
 University of Wisconsin Milwaukee UWM Digital Commons Field Station Bulletins UWM Field Station Spring 992 UWM Field Station meteorological data James W. Popp University of Wisconsin - Milwaukee Follow
Monthly Long Range Weather Commentary Issued: APRIL 18, 2017 Steven A. Root, CCM, Chief Analytics Officer, Sr. VP,
 Monthly Long Range Weather Commentary Issued: APRIL 18, 2017 Steven A. Root, CCM, Chief Analytics Officer, Sr. VP, sroot@weatherbank.com MARCH 2017 Climate Highlights The Month in Review The average contiguous
Chiang Rai Province CC Threat overview AAS1109 Mekong ARCC
 Chiang Rai Province CC Threat overview AAS1109 Mekong ARCC This threat overview relies on projections of future climate change in the Mekong Basin for the period 2045-2069 compared to a baseline of 1980-2005.
Minnesota s Climatic Conditions, Outlook, and Impacts on Agriculture. Today. 1. The weather and climate of 2017 to date
 Minnesota s Climatic Conditions, Outlook, and Impacts on Agriculture Kenny Blumenfeld, State Climatology Office Crop Insurance Conference, Sep 13, 2017 Today 1. The weather and climate of 2017 to date
2015 Fall Conditions Report
 2015 Fall Conditions Report Prepared by: Hydrologic Forecast Centre Date: December 21 st, 2015 Table of Contents Table of Figures... ii EXECUTIVE SUMMARY... 1 BACKGROUND... 2 SUMMER AND FALL PRECIPITATION...
Evaluation of fog-detection and advisory-speed system
 Evaluation of fog-detection and advisory-speed system A. S. Al-Ghamdi College of Engineering, King Saud University, P. O. Box 800, Riyadh 11421, Saudi Arabia Abstract Highway safety is a major concern
Climatography of the United States No
 Climate Division: TN 3 NWS Call Sign: BNA Month (1) Min (2) Month(1) Extremes Lowest (2) Temperature ( F) Lowest Month(1) Degree s (1) Base Temp 65 Heating Cooling 100 Number of s (3) Jan 45.6 27.9 36.8
The Climate of Oregon Climate Zone 3 Southwest Interior
 .k) 105 Unbound issue " " 1 4oes not circulate C4P. Special Report 915 May 1993 The Climate of Oregon Climate Zone 3 Southwest Interior Property of OREGON STATE UNIVERSITY Library Serials Corvallis, OR
Meteorological alert system in NMS of Mongolia
 Meteorological alert system in NMS of Mongolia L.Oyunjargal, NAMEM Regional Workshop on Impact-based Forecasts in Asia Seoul, Korea, 07-09 NOV 2017 Weather related disasters 1. Strong wind and snow and
WINTER STORM Annex II
 WINTER STORM Annex II I. PURPOSE A. This annex has been prepared to ensure a coordinated response by state agencies to requests from local jurisdictions to reduce potential loss of life and to ensure essential
ACCUMULATED PRECIPITATION IN INCHES
 CUMULATIVE PRECIPITATION WATER YEAR COLUMBIA BASIN ABOVE GRAND COULEE 84% of Normal 1971- Average ACCUMULATED PRECIPITATION IN INCHES 8 6 82% of Normal 85% of Normal 82% of Normal SNAKE RIVER BASIN ABOVE