Safety effects of lower speed limits during winter months
|
|
|
- Rudolph Martin
- 5 years ago
- Views:
Transcription


1 Safety effects of lower speed limits during winter months Jaakko Klang Traffic Safety Engineer Centres for Economic Development, Transport and the Environment Finland


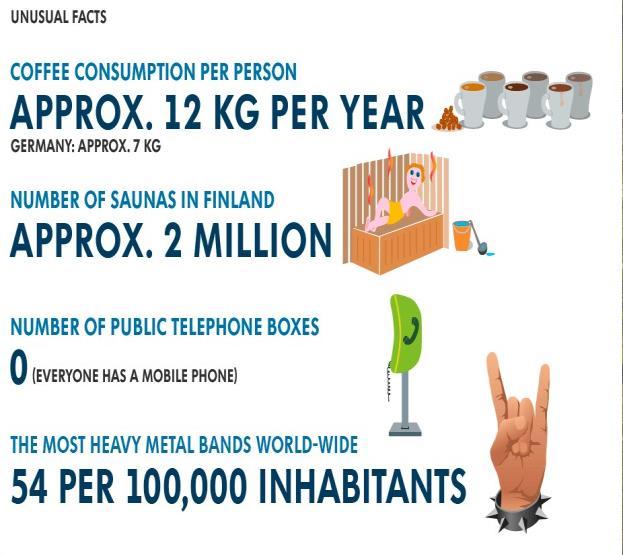
2 1. Finland


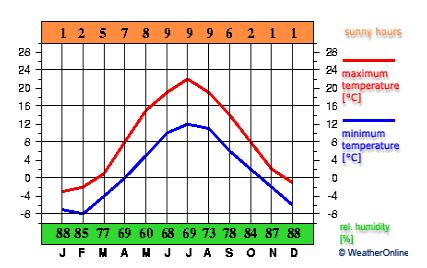
3 2. Climate


4 Highways km (motorways 900 km) 3. The road network in Finland Municipal streets km Private and forest roads km


5 4. Speed limits Jaakko Klang, ELY-Center, FINLAND 5

6 5. Road safety

7 6. Study on the traffic safety effects of lowered speed limits in the winter and dark season The aim of the study was to find out: how speed limits and traffic amounts have developed in different seasons how traffic safety has developed in the summer and winter seasons what the characteristics of winter-time accidents are
 of weekly vehicle kilometres per year on main roads with a speed limit of 100 km/h in")
8 7. Seasonal traffic changes Figure 1. The percentage (%) of weekly vehicle kilometres per year on main roads with a speed limit of 100 km/h in the summer and 80 km/h in the winter in 1995 and

9 km/h 8. Speed limits in the summer and winter season Year Summer 100 / Winter 80 Summer 100 / Winter 100 Summer / Average speed Winter / Average speed Figure 2. Average speed (km/h) of all vehicles in the summer and winter on two-lane main roads by speed limit in 2004, 2008, 2012 and The top of the bar indicates the average speed in the summer and the bottom indicates the average speed in the winter. The figure below the bar indicates how much the average speed decreased during the winter compared to summer. 9
 Summer season (April-September) Winter speed limits implemented in stages in 1987 2004 Figure 4.")
10 Deaths / 100 million vehicle km 9. Traffic safety in different seasons Winter season (October-March) Summer season (April-September) Winter speed limits implemented in stages in Figure 4. Risk of death in the winter and summer season in For the whole inspection period, 45% of vehicle kilometers were allocated to the winter season

11 Deaths / 100 million vehicle km 10. Risk of death by month as an eight-year average JAN FEB MAR APR MAY JUN JUL AUG SEP OCT NOV DEC Month Figure 5. Risk of death by month as an eight-year average. The monthly distribution of vehicle kilometers has been assumed to remain the same during the whole inspection period. 11 Jaakko Klang, ELY-Center, FINLAND


12 11. Accidents Dry (N=6149) Wet(N=2265) Winter conditions (N=3004 JAN FEB MAR APR MAY JUN JUL AUG SEP OCT NOV DEC Month Figure 6. The monthly percentage of different road surfaces in the accidents leading to bodily injury on main roads in Jaakko Klang, ELY-Center, FINLAND 12


13 12. Accidents Deaths / month Head-on collisions Other accidents Figure 7. The average number of deaths on main roads in JAN FEB MAR APR MAY JUN JUL AUG SEP OCT 13 NOV DEC Jaakko Klang, ELY-Center, FINLAND Month
 km (4) km Tiepituus, Road Avg KVL, ajon/vrk Avg traffic/ traffic/day day, veh/day veh/day Performa nce (5), Suorite (5), Milj.")
14 13. The safety effects Table 1. The effects of winter season speed limits in by accident and traffic data Road length length km(4) km (4) km Tiepituus, Road Avg KVL, ajon/vrk Avg traffic/ traffic/day day, veh/day veh/day Performa nce (5), Suorite (5), Milj. km/v Million km/y Safety situation (6) Turvallisuustilanne (6) Turvallisuussäästö benefit (7) (7) Bodily Hvjo/v inj/y Kuolemat/v Deaths/y Bodily Hvjo/v inj/y Kuolemat/v Deaths/y 120-> 100 km/h (1) ,7 2,3 5,7 0,6 100->80 (2) ,5 24,9 27,2 7,2 80->70 (2) ,6 0,4 0,4 0,1 Muuttuvat Chancing(3 (3) ,9 1,3 2,8 0,4 ) Yhteensä Total ,7 28,8 36,0 8,2 (1) Motorways where the 120 km/h is lowered to 100 km/h for the winter (2) Two-lane main roads where the 100 km/h is lowered to 80 km/h for the winter (3) The effect of changing speed limits calculated as lowering 100 km/h to 80 km/h (4) Length of road where winter speed limits are in use (5) The amount of vehicle kilometers driven with speed limits lowered for the winter (6) How many accidents leading to bodily injury and death there would be in the winter season without lowered speed limits (7) Accidents and traffic fatalities avoided yearly due to winter speed limits Safety 14

15 14. Conclusions accidents leading to bodily injury and 8 deaths are avoided every winter. 2. the risk of the most severe safety issue head-on collisions is the greatest. 3. Elk collisions are also more common 4. When driving with studded tyres, lower speeds help reduce the wear on road surfaces. 5. Studies show that drivers do not sufficiently take into account the prevailing driving conditions, and their behaviour must be adjusted with measures such as speed limits that take driving conditions into account. 6. Road users support the concept of changing speed limits according season, and lower limits are better accepted during the winter months Jaakko Klang, ELY-Center, FINLAND 15


16 Thank you for your attention Report: Harri Peltola: Safety effects of lower speed limits during winter months. Analysis of accidents in Finnish Transport Agency, Technology and Environment Department. Helsinki Research reports of the Finnish Transport Agency 61/ pages. ISSN-L , ISSN , ISBN
GAMINGRE 8/1/ of 7
 FYE 09/30/92 JULY 92 0.00 254,550.00 0.00 0 0 0 0 0 0 0 0 0 254,550.00 0.00 0.00 0.00 0.00 254,550.00 AUG 10,616,710.31 5,299.95 845,656.83 84,565.68 61,084.86 23,480.82 339,734.73 135,893.89 67,946.95
WHEN IS IT EVER GOING TO RAIN? Table of Average Annual Rainfall and Rainfall For Selected Arizona Cities
 WHEN IS IT EVER GOING TO RAIN? Table of Average Annual Rainfall and 2001-2002 Rainfall For Selected Arizona Cities Phoenix Tucson Flagstaff Avg. 2001-2002 Avg. 2001-2002 Avg. 2001-2002 October 0.7 0.0
Responsive Traffic Management Through Short-Term Weather and Collision Prediction
 Responsive Traffic Management Through Short-Term Weather and Collision Prediction Presenter: Stevanus A. Tjandra, Ph.D. City of Edmonton Office of Traffic Safety (OTS) Co-authors: Yongsheng Chen, Ph.D.,
YACT (Yet Another Climate Tool)? The SPI Explorer
? The SPI Explorer") YACT (Yet Another Climate Tool)? The SPI Explorer Mike Crimmins Assoc. Professor/Extension Specialist Dept. of Soil, Water, & Environmental Science The University of Arizona Yes, another climate tool for
YACT (Yet Another Climate Tool)? The SPI Explorer Mike Crimmins Assoc. Professor/Extension Specialist Dept. of Soil, Water, & Environmental Science The University of Arizona Yes, another climate tool for
Global Climates. Name Date
 Global Climates Name Date No investigation of the atmosphere is complete without examining the global distribution of the major atmospheric elements and the impact that humans have on weather and climate.
The Climate of Bryan County
 The Climate of Bryan County Bryan County is part of the Crosstimbers throughout most of the county. The extreme eastern portions of Bryan County are part of the Cypress Swamp and Forest. Average annual
The Climate of Pontotoc County
 The Climate of Pontotoc County Pontotoc County is part of the Crosstimbers. This region is a transition region from the Central Great Plains to the more irregular terrain of southeast Oklahoma. Average
CHARACTERISTICS OF TRAFFIC ACCIDENTS IN COLD, SNOWY HOKKAIDO, JAPAN
 CHARACTERISTICS OF TRAFFIC ACCIDENTS IN COLD, SNOWY HOKKAIDO, JAPAN Motoki ASANO Director Traffic Engineering Division Civil Engineering Research Institute of 1-3 Hiragishi, Toyohira-ku, Sapporo, 062-8602,
The Climate of Seminole County
 The Climate of Seminole County Seminole County is part of the Crosstimbers. This region is a transition region from the Central Great Plains to the more irregular terrain of southeastern Oklahoma. Average
The Climate of Marshall County
 The Climate of Marshall County Marshall County is part of the Crosstimbers. This region is a transition region from the Central Great Plains to the more irregular terrain of southeastern Oklahoma. Average
Analysing The Temporal Pattern Of Crime Hotspots In South Yorkshire, United Kingdom
 Advances in Social Sciences Research Journal Vol.5, No.6 Publication Date: June. 25, 218 DoI:1.14738/assrj.56.4822. Abdullahi, H., & Abbas, I. I. (218). Analysing The Temporal Pattern Of Crime Hotspots
The Climate of Grady County
 The Climate of Grady County Grady County is part of the Central Great Plains, encompassing some of the best agricultural land in Oklahoma. Average annual precipitation ranges from about 33 inches in northern
Effects of quality assurance on winter maintenance. Otto Kärki ELY-centre, Finland NordBalt Seminar Vantaa 7 8 October 2014
 Effects of quality assurance on winter maintenance Otto Kärki ELY-centre, Finland NordBalt Seminar Vantaa 7 8 October 2014 Development of Yearly Maintenance Cost, /km Area maintenance contracts, development
The Climate of Payne County
 The Climate of Payne County Payne County is part of the Central Great Plains in the west, encompassing some of the best agricultural land in Oklahoma. Payne County is also part of the Crosstimbers in the
The Climate of Kiowa County
 The Climate of Kiowa County Kiowa County is part of the Central Great Plains, encompassing some of the best agricultural land in Oklahoma. Average annual precipitation ranges from about 24 inches in northwestern
The Climate of Haskell County
 The Climate of Haskell County Haskell County is part of the Hardwood Forest. The Hardwood Forest is characterized by its irregular landscape and the largest lake in Oklahoma, Lake Eufaula. Average annual
The Climate of Murray County
 The Climate of Murray County Murray County is part of the Crosstimbers. This region is a transition between prairies and the mountains of southeastern Oklahoma. Average annual precipitation ranges from
The Climate of Texas County
 The Climate of Texas County Texas County is part of the Western High Plains in the north and west and the Southwestern Tablelands in the east. The Western High Plains are characterized by abundant cropland
SYSTEM BRIEF DAILY SUMMARY
 SYSTEM BRIEF DAILY SUMMARY * ANNUAL MaxTemp NEL (MWH) Hr Ending Hr Ending LOAD (PEAK HOURS 7:00 AM TO 10:00 PM MON-SAT) ENERGY (MWH) INCREMENTAL COST DAY DATE Civic TOTAL MAXIMUM @Max MINIMUM @Min FACTOR
Winter Season Resource Adequacy Analysis Status Report
 Winter Season Resource Adequacy Analysis Status Report Tom Falin Director Resource Adequacy Planning Markets & Reliability Committee October 26, 2017 Winter Risk Winter Season Resource Adequacy and Capacity
P7.7 A CLIMATOLOGICAL STUDY OF CLOUD TO GROUND LIGHTNING STRIKES IN THE VICINITY OF KENNEDY SPACE CENTER, FLORIDA
 P7.7 A CLIMATOLOGICAL STUDY OF CLOUD TO GROUND LIGHTNING STRIKES IN THE VICINITY OF KENNEDY SPACE CENTER, FLORIDA K. Lee Burns* Raytheon, Huntsville, Alabama Ryan K. Decker NASA, Marshall Space Flight
Lesson Nine Population Problems. Key question How does growth of Florida s human population affect bear populations?
 Lesson Nine Population Problems Key question How does growth of Florida s human population affect bear populations? Conceptual frameworks topics IV.C. Florida black bear seasonal activities and movements
Communicating Climate Change Consequences for Land Use
 Communicating Climate Change Consequences for Land Use Site: Prabost, Skye. Event: Kyle of Lochalsh, 28 th February 28 Further information: http://www.macaulay.ac.uk/ladss/comm_cc_consequences.html Who
SYSTEM BRIEF DAILY SUMMARY
 SYSTEM BRIEF DAILY SUMMARY * ANNUAL MaxTemp NEL (MWH) Hr Ending Hr Ending LOAD (PEAK HOURS 7:00 AM TO 10:00 PM MON-SAT) ENERGY (MWH) INCREMENTAL COST DAY DATE Civic TOTAL MAXIMUM @Max MINIMUM @Min FACTOR
Smoothed Prediction of the Onset of Tree Stem Radius Increase Based on Temperature Patterns
 Smoothed Prediction of the Onset of Tree Stem Radius Increase Based on Temperature Patterns Mikko Korpela 1 Harri Mäkinen 2 Mika Sulkava 1 Pekka Nöjd 2 Jaakko Hollmén 1 1 Helsinki
Time Series Analysis
 Time Series Analysis A time series is a sequence of observations made: 1) over a continuous time interval, 2) of successive measurements across that interval, 3) using equal spacing between consecutive
Changing Hydrology under a Changing Climate for a Coastal Plain Watershed
 Changing Hydrology under a Changing Climate for a Coastal Plain Watershed David Bosch USDA-ARS, Tifton, GA Jeff Arnold ARS Temple, TX and Peter Allen Baylor University, TX SEWRU Objectives 1. Project changes
Jackson County 2013 Weather Data
 Jackson County 2013 Weather Data 61 Years of Weather Data Recorded at the UF/IFAS Marianna North Florida Research and Education Center Doug Mayo Jackson County Extension Director 1952-2008 Rainfall Data
A Report on a Statistical Model to Forecast Seasonal Inflows to Cowichan Lake
 A Report on a Statistical Model to Forecast Seasonal Inflows to Cowichan Lake Prepared by: Allan Chapman, MSc, PGeo Hydrologist, Chapman Geoscience Ltd., and Former Head, BC River Forecast Centre Victoria
DROUGHT IN MAINLAND PORTUGAL
 DROUGHT IN MAINLAND Ministério da Ciência, Tecnologia e Ensino Superior Instituto de Meteorologia, I. P. Rua C Aeroporto de Lisboa Tel.: (351) 21 844 7000 e-mail:informacoes@meteo.pt 1749-077 Lisboa Portugal
H IGHWAY 3 WILDLIFE MORTALITY
 Miistakis Institute for the Rockies H IGHWAY 3 WILDLIFE MORTALITY CONTENTS Introduction 1 Methods 2 Data Limitations 3 Results 3 Discussion 8 Special points of interest: The analysis includes mortality
ENGINE SERIAL NUMBERS
 ENGINE SERIAL NUMBERS The engine number was also the serial number of the car. Engines were numbered when they were completed, and for the most part went into a chassis within a day or so. However, some
Champaign-Urbana 2000 Annual Weather Summary
 Champaign-Urbana 2000 Annual Weather Summary ILLINOIS STATE WATER SURVEY 2204 Griffith Dr. Champaign, IL 61820 wxobsrvr@sws.uiuc.edu Maria Peters, Weather Observer January: January started on a mild note,
peak half-hourly New South Wales
 Forecasting long-term peak half-hourly electricity demand for New South Wales Dr Shu Fan B.S., M.S., Ph.D. Professor Rob J Hyndman B.Sc. (Hons), Ph.D., A.Stat. Business & Economic Forecasting Unit Report
Technical note on seasonal adjustment for M0
 Technical note on seasonal adjustment for M0 July 1, 2013 Contents 1 M0 2 2 Steps in the seasonal adjustment procedure 3 2.1 Pre-adjustment analysis............................... 3 2.2 Seasonal adjustment.................................
Minnesota s Climatic Conditions, Outlook, and Impacts on Agriculture. Today. 1. The weather and climate of 2017 to date
 Minnesota s Climatic Conditions, Outlook, and Impacts on Agriculture Kenny Blumenfeld, State Climatology Office Crop Insurance Conference, Sep 13, 2017 Today 1. The weather and climate of 2017 to date
GTR # VLTs GTR/VLT/Day %Δ:
 MARYLAND CASINOS: MONTHLY REVENUES TOTAL REVENUE, GROSS TERMINAL REVENUE, WIN/UNIT/DAY, TABLE DATA, AND MARKET SHARE CENTER FOR GAMING RESEARCH, DECEMBER 2017 Executive Summary Since its 2010 casino debut,
Implementation Status & Results Azerbaijan Third Highway Project (P118023)
") Public Disclosure Authorized Public Disclosure Authorized The World Bank Implementation Status & Results Azerbaijan Third Highway Project (P118023) Operation Name: Third Highway Project (P118023) Project
Public Disclosure Authorized Public Disclosure Authorized The World Bank Implementation Status & Results Azerbaijan Third Highway Project (P118023) Operation Name: Third Highway Project (P118023) Project
SPECIMEN. Date Morning/Afternoon. A Level Geography H481/01 Physical systems Sample Question Paper. Time allowed: 1 hour 30 minutes PMT
 Oxford Cambridge and RSA A Level Geography H481/01 Physical systems Sample Question Paper Date Morning/Afternoon Time allowed: 1 hour 30 minutes You must have: the Resource Booklet the OCR 12-page Answer
Champaign-Urbana 2001 Annual Weather Summary
 Champaign-Urbana 2001 Annual Weather Summary ILLINOIS STATE WATER SURVEY 2204 Griffith Dr. Champaign, IL 61820 wxobsrvr@sws.uiuc.edu Maria Peters, Weather Observer January: After a cold and snowy December,
Chiang Rai Province CC Threat overview AAS1109 Mekong ARCC
 Chiang Rai Province CC Threat overview AAS1109 Mekong ARCC This threat overview relies on projections of future climate change in the Mekong Basin for the period 2045-2069 compared to a baseline of 1980-2005.
Faisal S. Syed, Shahbaz M.,Nadia R.,Siraj I. K., M. Adnan Abid, M. Ashfaq, F. Giorgi, J. Pal, X. Bi
 ICTP NCP International Conference on Global Change 15-19 November, 2006, Islamabad Climate Change Studies over South Asia Region Using Regional Climate Model RegCM3 (Preliminary Results) Faisal S. Syed,
2003 Water Year Wrap-Up and Look Ahead
 2003 Water Year Wrap-Up and Look Ahead Nolan Doesken Colorado Climate Center Prepared by Odie Bliss http://ccc.atmos.colostate.edu Colorado Average Annual Precipitation Map South Platte Average Precipitation
Analysis of Historical Pattern of Rainfall in the Western Region of Bangladesh
 24 25 April 214, Asian University for Women, Bangladesh Analysis of Historical Pattern of Rainfall in the Western Region of Bangladesh Md. Tanvir Alam 1*, Tanni Sarker 2 1,2 Department of Civil Engineering,
Tornado Hazard Risk Analysis: A Report for Rutherford County Emergency Management Agency
 Tornado Hazard Risk Analysis: A Report for Rutherford County Emergency Management Agency by Middle Tennessee State University Faculty Lisa Bloomer, Curtis Church, James Henry, Ahmad Khansari, Tom Nolan,
CWV Review London Weather Station Move
 CWV Review London Weather Station Move 6th November 26 Demand Estimation Sub-Committee Background The current composite weather variables (CWVs) for North Thames (NT), Eastern (EA) and South Eastern (SE)
Determine the trend for time series data
 Extra Online Questions Determine the trend for time series data Covers AS 90641 (Statistics and Modelling 3.1) Scholarship Statistics and Modelling Chapter 1 Essent ial exam notes Time series 1. The value
Long-term Water Quality Monitoring in Estero Bay
 Long-term Water Quality Monitoring in Estero Bay Keith Kibbey Laboratory Director Lee County Environmental Laboratory Division of Natural Resource Management Estero Bay Monitoring Programs Three significant
OVERVIEW OF IMPROVED USE OF RS INDICATORS AT INAM. Domingos Mosquito Patricio
 OVERVIEW OF IMPROVED USE OF RS INDICATORS AT INAM Domingos Mosquito Patricio domingos.mosquito@gmail.com Introduction to Mozambique /INAM Introduction to AGRICAB/SPIRITS Objectives Material & Methods Results
Mountain View Community Shuttle Monthly Operations Report
 Mountain View Community Shuttle Monthly Operations Report December 6, 2018 Contents Passengers per Day, Table...- 3 - Passengers per Day, Chart...- 3 - Ridership Year-To-Date...- 4 - Average Daily Ridership
UNCLASSIFIED. Environment, Safety and Health (ESH) Report
 Report") Environment, Safety and Health (ESH) Report Perfect Days On a Perfect Day nobody is hurt, we receive no community complaints, we have no security breaches, we do not breach our environmental permit conditions,
Environment, Safety and Health (ESH) Report Perfect Days On a Perfect Day nobody is hurt, we receive no community complaints, we have no security breaches, we do not breach our environmental permit conditions,
Bryan Butler. National Radio Astronomy Observatory. November 23, 1998
 MMA Memo. No. 238 Precipitable Water at KP 1993{1998 Bryan Butler National Radio Astronomy Observatory November 23, 1998 Introduction This memo is essentially a clone of MMA Memo No. 237 (also VLA Scientic
Climate also has a large influence on how local ecosystems have evolved and how we interact with them.
 The Mississippi River in a Changing Climate By Paul Lehman, P.Eng., General Manager Mississippi Valley Conservation (This article originally appeared in the Mississippi Lakes Association s 212 Mississippi
Seasonal Hydrometeorological Ensemble Prediction System: Forecast of Irrigation Potentials in Denmark
 Seasonal Hydrometeorological Ensemble Prediction System: Forecast of Irrigation Potentials in Denmark Diana Lucatero 1*, Henrik Madsen 2, Karsten H. Jensen 1, Jens C. Refsgaard 3, Jacob Kidmose 3 1 University
TMC Monthly Operational Summary
 TMC Monthly Operational Summary July 1 Bureau of Transportation Systems Management & Operations (TSMO) NH Department of Transportation s Mission Transportation excellence enhancing the quality of life
ISO Lead Auditor Lean Six Sigma PMP Business Process Improvement Enterprise Risk Management IT Sales Training
 Training Calendar 2014 Public s (ISO LSS PMP BPI ERM IT Sales Training) www.excelledia.com (ISO, LSS, PMP, BPI, ERM, IT, Sales Public s) 1 Schedule Registration JANUARY FEBRUARY 2 days 26 JAN 27 JAN 3
TILT, DAYLIGHT AND SEASONS WORKSHEET
 TILT, DAYLIGHT AND SEASONS WORKSHEET Activity Description: Students will use a data table to make a graph for the length of day and average high temperature in Utah. They will then answer questions based
Jackson County 2018 Weather Data 67 Years of Weather Data Recorded at the UF/IFAS Marianna North Florida Research and Education Center
 Jackson County 2018 Weather Data 67 Years of Weather Data Recorded at the UF/IFAS Marianna North Florida Research and Education Center Doug Mayo Jackson County Extension Director 1952-2008 Rainfall Data
BUSI 460 Suggested Answers to Selected Review and Discussion Questions Lesson 7
 BUSI 460 Suggested Answers to Selected Review and Discussion Questions Lesson 7 1. The definitions follow: (a) Time series: Time series data, also known as a data series, consists of observations on a
Computing & Telecommunications Services
 Computing & Telecommunications Services Monthly Report September 214 CaTS Help Desk (937) 775-4827 1-888-775-4827 25 Library Annex helpdesk@wright.edu www.wright.edu/cats/ Table of Contents HEAT Ticket
Lecture Prepared By: Mohammad Kamrul Arefin Lecturer, School of Business, North South University
 Lecture 15 20 Prepared By: Mohammad Kamrul Arefin Lecturer, School of Business, North South University Modeling for Time Series Forecasting Forecasting is a necessary input to planning, whether in business,
Appendix BAL Baltimore, Maryland 2003 Annual Report on Freeway Mobility and Reliability
 (http://mobility.tamu.edu/mmp) Office of Operations, Federal Highway Administration Appendix BAL Baltimore, Maryland 2003 Annual Report on Freeway Mobility and Reliability This report is a supplement to:
Physical Features of Monsoon Asia. 192 Unit 7 Teachers Curriculum Institute 60 N 130 E 140 E 150 E 60 E 50 N 160 E 40 N 30 N 150 E.
 50 N 60 E 70 E 80 E 90 E 100 E 60 N 110 E 120 E 130 E 140 E 150 E 50 N 160 E 40 N 40 N 30 N 60 E 30 N 150 E Tropic of Cancer 20 N Tropic of Cancer 20 N 10 N 10 N 0 Equator 0 Equator 10 S 10 S 0 500 1,000
UWM Field Station meteorological data
 University of Wisconsin Milwaukee UWM Digital Commons Field Station Bulletins UWM Field Station Spring 992 UWM Field Station meteorological data James W. Popp University of Wisconsin - Milwaukee Follow
Investigation of Rainfall Trend in Jorhat Town, Assam, India
 EUROPEAN ACADEMIC RESEARCH Vol. II, Issue 7/ October 2014 ISSN 2286-4822 www.euacademic.org Impact Factor: 3.1 (UIF) DRJI Value: 5.9 (B+) Investigation of Rainfall Trend in Jorhat Town, MAYURAKSHI BHUYAN
TMC Monthly Operational Summary
 TMC Monthly Operational Summary March Bureau of Transportation Systems Management & Operations (TSMO) NH Department of Transportation s Mission Transportation excellence enhancing the quality of life in
Lesson Adaptation Activity: Analyzing and Interpreting Data
 Lesson Adaptation Activity: Analyzing and Interpreting Data Related MA STE Framework Standard: 3-ESS2-1. Use graphs and tables of local weather data to describe and predict typical weather during a particular
PROGRESS ACCOMPLISHED THIS PERIOD
 Semi-Annual Report Period Covered: September 1, 21 through February 28, 217 Prepared By: Richard Radigan Title: Monitoring of a Constructed Oyster Reef in the St. Lucie Estuary Agency: Florida Fish & Wildlife
Monitoring on Subsidence Claims. John Parvin Subsidence Claims Manager
 Monitoring on Subsidence Claims John Parvin Subsidence Claims Manager Key Milestones Subsidence cover 1972 Surge of claims1989/1990/1991 Project Management 1992 onwards Mitigation Surge 1995/2003 Delegated
Quality Pavement Markings
 Quality Pavement Markings Idaho Asphalt Conference Moscow, Idaho October 26, 2006 Purpose of Pavement Markings Provide the visual information needed by the driver to guide their vehicle Ed Lagergren,,
Average temperature ( F) World Climate Zones. very cold all year with permanent ice and snow. very cold winters, cold summers, and little rain or snow
 World Climate Zones. very cold all year with permanent ice and snow. very cold winters, cold summers, and little rain or snow") P r e v i e w Look carefully at the climagraph of Mumbai, India. What is the wettest month (or months) in Mumbai? What is the driest month (or months) in Mumbai? What effects might this city s climate
P r e v i e w Look carefully at the climagraph of Mumbai, India. What is the wettest month (or months) in Mumbai? What is the driest month (or months) in Mumbai? What effects might this city s climate
CAVE CLIMATE COMPARISON ACTIVITY BETWEEN THE SURFACE AND THE CAVERN
 CAVE CLIMATE COMPARISON ACTIVITY BETWEEN THE SURFACE AND THE CAVERN Created by Ray Bowers For the Virtual Center for the Environment (VCE) A part of the Institute of Natural Resources Analysis and Management
Water Management for Environmental Restoration Flows In the Big Bend reach, Rio Grande Rio Bravo
 University of California, Davis Department of Land, Air and Water Resources Water Management for Environmental Restoration Flows In the Big Bend reach, Rio Grande Rio Bravo 46 th Annual Meeting 8 9 March,
Experimental measurements and analysis of the indoor conditions in Italian museum storerooms: a study case
 Experimental measurements and analysis of the indoor conditions in Italian museum storerooms: a study case F. Cappelletti, P. Romagnoni and A. Birra University Iuav of Venezia, Italy Aims and methods Analysis
EVALUATION OF ALGORITHM PERFORMANCE 2012/13 GAS YEAR SCALING FACTOR AND WEATHER CORRECTION FACTOR
 EVALUATION OF ALGORITHM PERFORMANCE /3 GAS YEAR SCALING FACTOR AND WEATHER CORRECTION FACTOR. Background The annual gas year algorithm performance evaluation normally considers three sources of information
Technical note on seasonal adjustment for Capital goods imports
 Technical note on seasonal adjustment for Capital goods imports July 1, 2013 Contents 1 Capital goods imports 2 1.1 Additive versus multiplicative seasonality..................... 2 2 Steps in the seasonal
MISSION DEBRIEFING: Teacher Guide
 Activity 2: It s Raining Again?! Using real data from one particular location, students will interpret a graph that relates rainfall to the number of cases of malaria. Background The relationship between
2016 Meteorology Summary
 2016 Meteorology Summary New Jersey Department of Environmental Protection AIR POLLUTION AND METEOROLOGY Meteorology plays an important role in the distribution of pollution throughout the troposphere,
Suppression of colonies of Reticulitermes spp. using the Sentricon termite colony elimination system: : A case study in Chatsworth, CA
 Suppression of colonies of Reticulitermes spp. using the Sentricon termite colony elimination system: : A case study in Chatsworth, CA Gail M. Getty, MS, Chris Solek, MS, Ron 1 1 Sbragia, Ph.D., Michael
ISO Lead Auditor Lean Six Sigma PMP Business Process Improvement Enterprise Risk Management IT Sales Training
 Training Calendar 2014 Public s (ISO LSS PMP BPI ERM IT Sales Training) (ISO, LSS, PMP, BPI, ERM, IT, Sales Public s) 1 Schedule Registration JANUARY ) FEBRUARY 2 days 26 JAN 27 JAN 3 days 28 JAN 30 JAN
Agricultural Science Climatology Semester 2, Anne Green / Richard Thompson
 Agricultural Science Climatology Semester 2, 2006 Anne Green / Richard Thompson http://www.physics.usyd.edu.au/ag/agschome.htm Course Coordinator: Mike Wheatland Course Goals Evaluate & interpret information,
Sections 01, 02, & 04 (Bressoud and Ehren) 9 October, 2015
 9 October, 2015") Math 135, Applied Calculus First Midterm Exam Sections 01, 02, & 04 (Bressoud and Ehren) 9 October, 2015 This exam is worth 100 points. Show your work. Partial credit will be given for partially correct
Math 135, Applied Calculus First Midterm Exam Sections 01, 02, & 04 (Bressoud and Ehren) 9 October, 2015 This exam is worth 100 points. Show your work. Partial credit will be given for partially correct
Monthly Magnetic Bulletin
 BRITISH GEOLOGICAL SURVEY Ascension Island Observatory Monthly Magnetic Bulletin December 2008 08/12/AS Crown copyright; Ordnance Survey ASCENSION ISLAND OBSERVATORY MAGNETIC DATA 1. Introduction Ascension
Seasonality in recorded crime: preliminary findings
 Seasonality in recorded crime: preliminary findings Celia Hird Chandni Ruparel Home Office Online Report /7 The views expressed in this report are those of the authors, not necessarily those of the Home
Location. Datum. Survey. information. Etrometa. Step Gauge. Description. relative to Herne Bay is -2.72m. The site new level.
 Tide Gauge Location OS: 616895E 169377N WGS84: Latitude: 51 o 22.919196 N Longitude: 01 o 6.9335907 E Instrument Type Etrometa Step Gauge Benchmarks Benchmark TGBM = 5.524m above Ordnance Datum Newlyn
ISO Lead Auditor Lean Six Sigma PMP Business Process Improvement Enterprise Risk Management IT Sales Training
 Training Calendar 2014 Public s (ISO LSS PMP BPI ERM IT Sales Training) (ISO, LSS, PMP, BPI, ERM, IT, Sales Public s) 1 Schedule Registration JANUARY IMS ) FEBRUARY 2 days 26 JAN 27 JAN 3 days 28 JAN 30
Variability and trends in daily minimum and maximum temperatures and in diurnal temperature range in Lithuania, Latvia and Estonia
 Variability and trends in daily minimum and maximum temperatures and in diurnal temperature range in Lithuania, Latvia and Estonia Jaak Jaagus Dept. of Geography, University of Tartu Agrita Briede Dept.
Location. Datum. Survey. information. Etrometa. Step Gauge. Description. relative to Herne Bay is -2.72m. The site new level.
 Tide Gauge Location OS: 616895E 169377N WGS84: Latitude: 51 o 22.919196 N Longitude: 01 o 6.9335907 E Instrument Type Etrometa Step Gauge Benchmarks Benchmark TGBM = 5.524m above Ordnance Datum Newlyn
Folsom Dam Water Control Manual Update Joint Federal Project, Folsom Dam
 Folsom Dam Water Control Manual Update Joint Federal Project, Folsom Dam Public Workshop May 25, 2016 Sacramento Library Galleria 828 I Street, Sacramento, CA US Army Corps of Engineers BUILDING STRONG
REPORT ON LABOUR FORECASTING FOR CONSTRUCTION
 REPORT ON LABOUR FORECASTING FOR CONSTRUCTION For: Project: XYZ Local Authority New Sample Project Contact us: Construction Skills & Whole Life Consultants Limited Dundee University Incubator James Lindsay
FEB DASHBOARD FEB JAN FEB MAR APR MAY JUN JUL AUG SEP OCT NOV DEC
 Positive Response Compliance 215 Compliant 215 Non-Compliant 216 Compliant 216 Non-Compliant 1% 87% 96% 86% 96% 88% 89% 89% 88% 86% 92% 93% 94% 96% 94% 8% 6% 4% 2% 13% 4% 14% 4% 12% 11% 11% 12% JAN MAR
. regress lchnimp lchempi lgas lrtwex befile6 affile6 afdec6 t
 BOSTON COLLEGE Department of Economics EC 228 Econometrics, Prof. Baum, Ms. Yu, Fall 2003 Problem Set 7 Solutions Problem sets should be your own work. You may work together with classmates, but if you
The Climate of Oregon Climate Zone 5 High Plateau
 105 E55 Unbound issue i". 9 13oes not circulate CZe Special Report 917 May 1993 The Climate of Oregon Climate Zone 5 Property of OREGON STATE UNIVERSITY Library Serials Corvallis, OR 97331-4503 Agricultural
DROUGHT INDICES BEING USED FOR THE GREATER HORN OF AFRICA (GHA)
") DROUGHT INDICES BEING USED FOR THE GREATER HORN OF AFRICA (GHA) Christopher Oludhe IGAD Climate Prediction and Applications Centre (ICPAC) Inter-Regional Workshop on Indices and Early Warning Systems for
DROUGHT INDICES BEING USED FOR THE GREATER HORN OF AFRICA (GHA) Christopher Oludhe IGAD Climate Prediction and Applications Centre (ICPAC) Inter-Regional Workshop on Indices and Early Warning Systems for
Country Presentation-Nepal
 Country Presentation-Nepal Mt.Everest, Shiva Pd. Nepal, DHM South Asia Drought Monitor Workshop Dhaka Bangladesh 2 th April 215 Overview Brief Climatology Climate activities- DHM PPCR (Pilot Program for
Regents Earth Science Unit 7: Water Cycle and Climate
 Regents Earth Science Unit 7: Water Cycle and Climate Name Section Coastal and Continental Temperature Ranges Lab # Introduction: There are large variations in average monthly temperatures among cities
Variability of Reference Evapotranspiration Across Nebraska
 Know how. Know now. EC733 Variability of Reference Evapotranspiration Across Nebraska Suat Irmak, Extension Soil and Water Resources and Irrigation Specialist Kari E. Skaggs, Research Associate, Biological
Disentangling Impacts of Climate & Land Use Changes on the Quantity & Quality of River Flows in Southern Ontario
 Disentangling Impacts of Climate & Land Use Changes on the Quantity & Quality of River Flows in Southern Ontario by Trevor Dickinson & Ramesh Rudra, Water Resources Engineering University of Guelph Acknowledgements
Champaign-Urbana 1999 Annual Weather Summary
 Champaign-Urbana 1999 Annual Weather Summary ILLINOIS STATE WATER SURVEY 2204 Griffith Dr. Champaign, IL 61820 wxobsrvr@sws.uiuc.edu Maria Peters, Weather Observer A major snowstorm kicked off the new
CLIMATE OVERVIEW. Thunder Bay Climate Overview Page 1 of 5
 CLIMATE OVERVIEW The climate in the Thunder Bay area is typical of a mid-latitude inland location with a Great Lake Moderating influence. The moderating effect of Lake Superior results in cooler summer