Sedimentation Survey of Highland Silver Lake, Madison County, Illinois
|
|
|
- Lillian Morton
- 6 years ago
- Views:
Transcription
1 Contract Report Sedimentation Survey of Highland Silver Lake, Madison County, Illinois by William C. Bogner Prepared for The City of Highland March 2001 Illinois State Water Survey Watershed Science Section Champaign, Illinois A Division of the Illinois Department of Natural Resources
2 Sedimentation Survey of Highland Silver Lake, Madison County, Illinois by William C. Bogner Prepared for: The City of Highland Illinois State Water Survey Champaign, Illinois
3
4 Table of Contents Page Introduction...1 Acknowledgments...2 Lake Information...2 Reservoir and Water Supply History...2 Watershed...5 Lake Sedimentation Surveys...5 Lake Basin Volumes...7 Sedimentation Rates...8 Factors Affecting Lake Sedimentation Rates Sediment Distribution...14 Sediment Particle Size Distribution...14 Evaluation and Comparison to Other Illinois Lakes...16 Summary...18 References...19 Appendix I. Cross Sections of Silver Lake Transects...21 Appendix II. Sediment Core Sample Unit Weight Results...37 Appendix III. Sediment Particle Size Distribution Sample Results...39 iii
5 Abstract Sedimentation detracts from the use of any water supply lake by reducing lake depth and volume, with a reduction of reserve water supply capacity and possible burying of intake structures. Sedimentation of a reservoir is a natural process that can be accelerated or slowed by human activities in the watershed. Silver Lake is located in Madison County, one mile northwest of Highland, Illinois. The location of the dam is north latitude and west longitude in Section 30, T.4N., R.5W., Madison County, Illinois. The dam impounds the East Fork of Silver Creek, a tributary of Silver Creek in the Kaskaskia River basin. The watershed is a portion of Hydrologic Unit as defined by the U.S. Geological Survey. Construction of the lake was completed in The Silver Lake watershed consists of the 47.1-square-mile area drained by the East Fork of Silver Creek above the dam site. Land use in the watershed of the lake is mainly agricultural. Average annual precipitation in the area is inches as measured at Greenville ( ), and the average runoff ( ) is approximately 10.0 inches (Shoal Creek near Breese). The average annual lake evaporation rate is 35.2 inches per year at St. Louis, Missouri. The Illinois State Water Survey conducted sedimentation surveys of Silver Lake in 1981 and In 1981, cross sections were laid out at 14 lines across the lake and surveyed. Sedimentation surveys of Silver Lake in 1984 and 1999 repeated as closely as possible the series of survey lines established during the 1981 survey. Sedimentation has reduced the capacity of Silver Lake from 7,322 acre-feet or ac-ft (2,386 million gallons) in 1962 to 5,832 ac-ft (1,900 million gallons) in The sediment accumulation rates in the lake have averaged 40.3 ac-ft per year from Annual sedimentation rates for three separate periods, , , and , were 51.2, 63.0, and 21.9 ac-ft, respectively. Density analyses of the sediment samples indicate that sediment in the northern (upstream) portions of the lake has greater unit weight than sediment in the southern end of the lake. In general, coarser sediments are expected to be deposited in the upstream portion of a lake where the entrainment velocity of the stream is reduced to the much slower velocities of a lake environment. These coarser sediments tend to be denser when settled and are subject to drying and higher compaction rates as a result of more frequent drawdown exposure in the shallow water environment. As the remaining sediment load of the stream is transported through the lake, increasingly finer particle sizes and decreasing unit weight are observed. The sedimentation rate for Highland Silver Lake is similar to the rates for other Illinois lakes of similar size and character. The sedimentation rate for Silver Lake is in the low to average range compared to other Illinois lakes. iv
6 Sedimentation Survey of Highland Silver Lake, Madison County, Illinois Introduction The Illinois State Water Survey (ISWS), in cooperation with the City of Highland, Illinois, conducted a sedimentation survey of Highland Silver Lake during the fall of The survey was undertaken to provide information on the storage and sedimentation conditions of the lake. Highland Silver Lake is owned and operated by the city. The city withdraws water from the lake as the sole raw water source of the public water supply for the community. Sedimentation detracts from the use of any water supply lake by reducing lake depth and volume, with a reduction of reserve water supply capacity and possible burying of intake structures. Sedimentation of a reservoir is a natural process that can be accelerated or slowed by human activities in the watershed. In general, sedimentation of a lake is presumed to be accelerated unintentionally as a secondary impact of other developments within the watershed. For example, construction and agricultural activities in a lake watershed generally are found to increase sediment delivery to the lake due to increased exposure of soil material to erosive forces. Reductions of the sedimentation rate in a lake due to human impacts almost always are the result of programs intentionally designed to reduce soil and streambank erosion, and they are often the result of implementing lake remediation programs. These programs might include, but are not limited to, the implementation of watershed erosion control practices (such as reduced tillage and other farming or development practices), streambank and lakeshore stabilization, stream energy dissipaters, and lake dredging. Sedimentation of a reservoir is the final stage of a three-step sediment transport process. The three steps are watershed erosion by sheet, rill, gully, and/or streambank erosion; sediment transport in a defined stream system; and deposition of the sediment, which reduces stream energy such that the sediment can no longer be transported either in suspension or as bed load. Sediment deposition can occur throughout the stream system. Lake sedimentation occurs when sediment-laden water in a stream enters the reduced flow velocity regime of a lake. As water velocity is reduced, suspended sediment is deposited in patterns related to the size and fall velocity of each particle. During this process, soil particles are partially sorted by size along the longitudinal axis of the lake. Larger and heavier sand and coarse silt particles are deposited in the upper end of the lake; finer silts and clay particles tend to be carried further into the lake. Several empirical methods for estimating sedimentation rates in Illinois have been developed (ISWS, 1967; Upper Mississippi River Basin Commission, 1970; Singh and Durgunoglu, 1990). These methods use regionalized relationships between watershed size and lake sedimentation rates. As estimates, they serve well, within limits. A more precise measure of the sedimentation rate is provided by conducting a sedimentation survey of the reservoir. A sedimentation survey 1
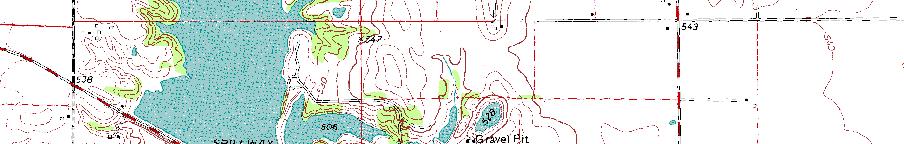
7 provides detailed information on distribution patterns within the lake and defines temporal changes in overall sedimentation rates. Acknowledgments The project was funded by the City of Highland. Dick Aten was project manager. Steve Shultz and Kevin Kehrer assisted with monument recovery. This project was conducted by the author as part of his regular duties at the Illinois State Water Survey under the administrative guidance of Derek Winstanley, Chief, and Manoutchehr Heidari, Acting Head, and Mike Demissie, Head of the Watershed Science Section. Richard Allgire and K. Erin Hessler Bauer assisted with the field data collection. Yi Han analyzed the sediment samples. Don Roseboom and Shun Dar Lin provided technical review. Eva Kingston edited the report. Linda Hascall reviewed the graphics. Views expressed in this report are those of the author and do not necessarily reflect the views of the sponsor or the Illinois State Water Survey. Lake Information Silver Lake (figure 1) is located in Madison County, one mile northwest of Highland, Illinois. The location of the dam is north latitude and west longitude in Section 30, T.4N., R.5W., Madison County, Illinois. The dam impounds the East Fork of Silver Creek, a tributary of Silver Creek in the Kaskaskia River basin. The watershed is a portion of Hydrologic Unit as defined by the U.S. Geological Survey (USGS, 1988). Reservoir and Water Supply History The earliest Water Survey file report on water supply or sewerage conditions in Highland is dated March 31, This report was prepared by Ralph Hilscher on the basis of a town visit on February 6, The following history has been prepared using Mr. Hilscher s and later reports. Mr. Hilscher s observations were that the town had no public water supply or sewage system. Household water was obtained from private, dug wells generally in the range of 20 to 40 feet deep. Mr. Hilscher considered these wells to be highly susceptible to contamination but noted that there had been no major outbreaks of typhoid although 12 cases had been diagnosed during the period 1907 to 1912 and resulted in three deaths. In about 1910 (two years prior to the 1912 visit) the city had contracted with an engineering firm to evaluate potential public water supply options for the community. The engineer s report recommended the construction of an impounding reservoir north of town, a water works, and distribution system. This plan was not approved by the voters. Water for fire fighting was available from a series of cisterns located every few blocks in town. Water for street sprinkling was collected in a cistern and distributed through town by a piping system. These systems were not used for household purposes. 2
8 Figure 1. Location and watershed delineation for Silver Lake 3
9 The two major industries in town were a brewery and a condensed milk factory. In about 1902, these companies combined forces to build two small ponds north of town. Following the defeat of the public water supply initiative, these two companies again combined resources and constructed an impoundment at the site of the old city reservoir. This lake was partially fed by springs in the watershed. This lake with the previously constructed ponds and occasional withdrawals from the East Branch of Silver Creek provided sufficient water for the operation of both businesses. Over the next 20 years, several other potential reservoir sites and ground-water supplies were investigated. The reservoir sites generally were not well suited to construction of an adequate reservoir. Local ground-water conditions were not conducive to development as a source of supply. Any aquifers potentially having adequate water to develop were too highly mineralized to treat economically. A 1923 ISWS file report notes that the brewery was then a soft drink manufacturer, and the condensed milk company was shipping whole milk. There had been no change in public water supply conditions. The pump station for withdrawing water from the creek had silted in, and sewerage was becoming a significant concern. The Highland public water supply system was installed in No direct information about this system was available in ISWS file reports It appears that the city purchased the brewery/milk plant reservoir and installed a water works plant and distribution system. At the time of a May 11, 1944 file report, the city was providing water using the old lake as a pump storage reservoir for water taken from the creek. The report estimated that only one-third of the water supply came from the direct watershed of the lake and two-thirds were taken from the creek. During the early 1950s, southern Illinois experienced a severe and prolonged period of drought. Several file reports available from this period indicate that the lake level was being maintained by pumping water from the creek. Several emergency measures were implemented: Hauling 726 truckloads or 3.25 million gallons of water (August 1954). Installing a pump from what remained of the lake to the intake structure. Bringing in additional pump capacity to move water from the creek to the lake. Excavating a channel to intercept spring flow from sites south of Route 143. In September 1954, with one Hammond, Indiana Civil Defense 1,500-gallon-per-minute (gpm) pump, a used 1,500 gpm pump from Breese, and existing pumping capacity, 6,800 gpm of pump capacity was available to intercept water from the creek and divert it into the reservoir. Water use had been reduced to about one-half of the pre-drought conditions. The first indication of action to construct the new lake is in a 1954 water plant inspection report. Review of aerial photography taken in Spring 1962 indicates that the lake was just starting to fill. Inspection reports indicate that the lake was in use in September
10 Highland became a regional water supplier when bulk water connections were made to Pierron in Bond County (1972), Grant Fork (1975), and St. Jacob s (about 1980). An automatic pressure valve controls the St. Jacob s connection which supplements an existing well supply. From 1981 to 1986, the Silver Lake watershed was selected as one of 13 experimental Rural Clean Water Program sites. The watershed was also selected as one of five of the 13 watersheds for a comprehensive monitoring and evaluation program under the direction of the Agricultural Stabilization and Conservation Service of the U.S. Department of Agriculture. As part of the monitoring program, sedimentation surveys were conducted for the lake in 1981 and Watershed The Silver Lake watershed consists of the 47.1-square-mile area drained by the East Fork of Silver Creek above the dam site (figure 1). The highest point in the watershed is at an elevation of 640 feet National Geodetic Vertical Datum or NGVD (southeast of New Douglas), and the normal pool elevation of the lake is feet NGVD. Land use in the watershed of the lake is mainly agricultural. Average annual precipitation in the area is inches as measured at Greenville ( ), and the average runoff ( ) is approximately 10.0 inches (Shoal Creek near Breese). The average annual lake evaporation rate is 35.2 inches per year at St. Louis, Missouri, the closest available station (Roberts and Stall, 1967). The upland soils in the watershed are in the Virden-Piasa-Darmstadt Association (USDA-SCS, 1986). These soils are nearly level to moderately sloping and may have some drainage problems due in part to the poor permeability of the subsoil. This association is usually formed in loess on broad, upland plains originally covered by prairie grasses. Slopes range from 0 to 8 percent. Soils in stream depressions are in the Hickory-Elco-Rosetta Association (USDA-SCS, 1986). These soils are moderately sloping to steep and generally well drained. Subsoils have moderately slow permeability. These soils formed in glacial till, loess, and loess over an older buried soil on valley side slopes and in narrow upland ridges. The original soils formed mainly under deciduous forest cover. Slopes range from 5 to 30 percent. Lake Sedimentation Surveys The ISWS conducted sedimentation surveys of Silver Lake in 1981 (Bogner, 1982) and 1984 (Makowski et al., 1986). In 1981, cross sections were laid out at 14 lines across the lake and surveyed. During the 1984 and 1999 surveys, these survey lines were resurveyed to define temporal changes in lakebed topography. During the 1984 survey, the range ends were monumented by installing 4-inch by 4-inch concrete posts to mark the transect ends. The 1999 sedimentation survey of Silver Lake (figure 2) repeated as closely as possible the series of survey lines established during the 1981 survey. 5
11 Figure 2. Survey plan for Silver Lake,
12 For the 1981 and 1984 sedimentation surveys, horizontal distances along the cross-sectional transects were measured by stretching a marked polyethylene cable between corresponding range end monuments. Water depth (vertical control) was referenced to the water surface, and all depth data were adjusted to the spillway crest elevation. Depth measurements were made using an aluminum sounding pole lowered to the top of the sediment surface to measure the existing water depth. The pole was then used to probe to the original bottom as determined by the initial point of resistance to the sediment probe. The 1999 survey was conducted using an Odom Hydrographic Systems MK II fathometer for depth measurement and a differentially corrected Leica 9600 System Geodetic Position System (GPS) for horizontal control across the transect. All navigation and data logging functions were controlled using Hypack, a hydrographic survey software. The GPS positions were differentially corrected using Radio Technical Commission for Maritime Services (RTCM) correction signals broadcast by the U.S. Coast Guard from St. Louis, Missouri. The fathometer was calibrated daily prior to initiating measurements. Calibration checks at the end of most work days showed daily variations of feet in a profile at one-foot depth intervals. For each main lake cross section, three to seven physical measurements of the water depth and sediment thickness were made with an aluminum sounding pole. The three upstream cross sections in the lake were resurveyed in 1999 with the traditional cable and pole method due to shallow depths. Plots of all cross sections surveyed from 1981, 1984, and 1999 are presented in appendix I. For comparison, the 1999 pole measurements also are plotted in appendix I as point data. These water-depth measurements with the pole show a close correspondence with the 1999 depth sounder readings. Comparison of the original lake depth for the 1999 pole readings to the full cross-sectional data collected for the 1981 and 1984 surveys shows a good match for most measurements made. Lake Basin Volumes Calculations of the lake capacities were made using methods described in the National Engineering Handbook of the U.S. Soil Conservation Service (USDA-SCS, 1968). This method requires the surface area of the lake segments, the cross-sectional area and widths of their bounding segments, and a shape factor to determine the original and present volume of each segment. These volumes are then summed to determine the total lake volume. The reference elevation used for the lake was the top of the spillway, feet NGVD. Table 1 presents the volume calculation results of the three surveys. Sedimentation has reduced the basin capacity from 7,322 acre-feet (ac-ft) in 1962 to 5,832 ac-ft in The 1999 basin capacity was 79.4 percent of the 1962 potential basin capacity. For water supply purposes, these volumes convert to capacities of 2,386 million gallons in 1962 and 1,900 million gallons in The capacity of the lake in 1981 was 6,349 ac-ft (2,069 million gallons), and 6,160 ac-ft (2,007 million gallons) in
13 Table 1. Reservoir Capacity and Capacity Loss Analysis Period Cumulative Capacity Cumulative annual annual loss for capacity capacity capacity Period Capacity period loss loss rate loss rate a) Analysis in units of acre-feet , , , , , , b) Analysis in units of million gallons , , , , Note: Lake surface area was 600 acres for Capacity shown is for the sedimentation survey conducted at the end of the period. The 1999 water depths for the lake were used to generate the bathymetric map in figure 3 and the volume distribution curve data in figure 4. Figure 4 can be used to determine the capacity of the reservoir below a given stage elevation. For example, the water volume below the 4-foot depth contour (shown by the dashed line in figure 4) is 3,869 ac-ft. With time and continued sedimentation, the relationships shown in figure 4 will become obsolete. Alteration of the spillway elevation, or the implementation of a dredging program would likewise alter these relationships. Sedimentation Rates Sedimentation rates for Silver Lake were analyzed in terms of delivery rates from the watershed and accumulation rates in the reservoir. The watershed delivery processes and rates are the link between soil erosion processes in the watershed, sediment transport processes, and water supply quantity impacts in the reservoir. These delivery rates measure the actual sediment yield from the watershed, including reduced sediment transport due to field and in-stream redeposition. The delivery rate is determined by dividing the volume or mass of sediment deposited in the lake over a period of time by the length of the time period. This value is then divided by the area of the watershed and presented in a range of unit values. The in-lake accumulation rate provides a means of extrapolating future lake conditions from past and present lake conditions in order to evaluate the integrity of the lake as a water supply source as well as a recreational resource. To determine the accumulation rate, the sediment deposition 8

14 Figure 3. Bathymetric map of Silver Lake 9
15 Surface Area (acres) Surface area 5 Lake stage at 4.0 feet below normal pool Stage (feet below normal pool) Spillway Crest at feet NGVD Capacity Stage Area Volume (acres) (ac-ft) , , , Area Capacity Capacity (acre-feet) Figure 4. Stage vs. volume vs. area relationship for Silver Lake,
16 volume is divided by the original capacity of the reservoir and converted to a percent. This value is then divided by the time between surveys to convert it to a rate of capacity loss per year. This sedimentation rate is determined for each sedimentation period as well as cumulatively for the life of the reservoir. Tables 2 and 3 provide the sedimentation rates for Silver Lake and its watershed for the periods , , , and These rates indicate a decline in net sediment yield from the watershed from 51 ac-ft from to 22 ac-ft annually from The long-term average annual sediment yield from was 40 ac-ft. These delivery rates show the need for continuing efforts to control watershed erosion, thereby reducing reservoir sedimentation rates. Factors Affecting Lake Sedimentation Rates Sedimentation rates in a lake can vary over time due to changes in either watershed or in-lake conditions. Changes in watershed conditions, such as altered precipitation patterns, land-use patterns, and streamflow variability, also affect the sediment delivery rates to the lake. In-lake conditions that also affect sedimentation rates involve the variation of trap efficiency (due to reduced storage capacity) and sediment consolidation. Figure 5 shows representative streamflow values for the East Fork Shoal Creek near Coffeen from October 1963-September 1997 (USGS web page, 2000). The most important of these plots for analysis of lake sedimentation are the maximum flows and the average flows. High sediment transport rates are closely related to peak water discharge periods (Demissie et al., 1983; Bhowmik et al., 1993). The plots in figure 5 indicate that average flows for most months were higher during the sedimentation study period for Silver Lake. Average flows for the and sedimentation periods were very similar on both a monthly and annual basis. This suggests that sediment delivery to the lake should be somewhat higher during the survey period with the other two periods being very similar. In contrast to the observations of the average flow characteristics, the monthly and annual peak discharges tend to be lower during the 1981 to 1984 period. In the case of peak flows, the 1984 to 1999 period shows a tendency to higher peak flows. This is particularly true for the late Spring and late Fall periods when row cropped fields would be most exposed. These higher peak flows would also be expected to indicate a higher potential soil loss rate. Instead, sedimentation rates for the middle sedimentation period are somewhat higher, but the sedimentation rate for the latter (1984 to 1999) period is significantly less than the rate for either of the earlier periods. This suggests that other watershed conditions have been larger factors in determining Silver Lake sedimentation rates after This may indicate that the watershed treatment program implemented under the Rural Clean Water Program ( ) was a positive influence on sediment delivery to the lake. The results of this flow analysis should be treated cautiously due to the short time periods involved. This is particularly true of the 3-year time period for the 1981 to 1984 period. For the peak flow analysis for this period, three short-time frame values are included in this data set. 11
17 Table 2. Computed Sediment Delivery Rates from the Watershed for Each Sedimentation Period Annual deposition rates Acre-feet per square Cubic feet Tons Period Acre-feet mile per acre per acre Note: Total watershed area is 47.1 square miles. Table 3. Capacity Loss Rates (percent) Relative to Original Lake Capacity Period Cumulative annual annual Period Per period Cumulative loss loss
18 a) Average monthly flow East Fork Shoal Creek near Coffeen stream flow analysis Period of record b) Maximum monthly flow Flow (cfs) c) Minimum monthly flow 0 Dec Jan Feb Mar Apr May Jun Jul Aug Sep Oct Nov Dec Jan Period average Note: Maximum and minimum lines and symbols for sub-periods are hidden when they are coincident with the period of record (heavier line) in the figure. Figure 5. Comparison of a) average, b) maximum, and c) minimum monthly flow for the East Fork Shoal Creek near Coffeen for the three sedimentation periods ( , , and ) and the full record of the station ( ) 13
19 The trap efficiency (percentage portion of sediment captured by the reservoir) of the lake was determined using a predictive equation developed by Dendy (1974) based on the relationship between the annual capacity to inflow ratio and sediment-holding capacity. The trap efficiency of Silver Lake was 92.7 percent in 1962, meaning that 92.7 percent of all sediment entering the lake was trapped in the lake basin. In general, as sediment accumulation reduces the volume of the lake basin, the holding time for water entering the lake is reduced. This reduction in holding time means less time for sediment to drop out of suspension and a reduction in trap efficiency. Due to the large capacity of Silver Lake relative to the size of its watershed, the trap efficiency of the lake has not been significantly reduced. In 1999, the trap efficiency was 91.5 percent. Gradual consolidation of lake sediments affects the calculated sedimentation rate of the lake by reducing the volume of accumulated sediments. Sediments accumulate on the bottom of the lake in a very loose, fluid mass. As these sediments are covered by continued sedimentation or are exposed by occasional lake drawdown, they are subject to compaction. This process reduces the volume of the sediments while increasing the weight per unit volume. Thus, the tonnage of the sediments accumulated during a period of time will not change, but the volume of the sediments may be reduced over time by up to 50 percent. This is also consistent with a reduced volumetric sedimentation rate over time. Consolidation of sediments would be most pronounced in the north end of Silver Lake. Some portions of the upper end of the lake are being exposed even at normal pool level. The exposure of sediment in these terrestrial deposits and the shallow water deposits that are subject to frequent exposure due to lake level drawdown would be consolidated on an annual basis. Overall, sedimentation rates for Silver Lake were high for the initial periods ( ) with a range of 74 to 91 cubic feet per acre per year. Sedimentation rates for the period have been considerably lower. Sediment Distribution Table 4 shows the distribution of sediment in the lake. This table lists the average sediment thickness and mass distribution for the lake and for each lake calculation segment as shown in figure 2. Sediment thickness ranges from 1.9 to 4.1 feet. The most significant accumulation by either measure, depth or mass, is in segments 12 and 13 in the northern portion of the lake. Density analyses of the sediment samples (appendix II) indicate that sediment in the northern (upstream) portions of the lake has greater unit weight than sediment in the southern end of the lake. In general, coarser sediments are expected to be deposited in the upstream portion of a lake where the entrainment velocity of the stream is reduced to the much slower velocities of a lake environment. These coarser sediments tend to be denser when settled and are subject to drying and higher compaction rates as a result of more frequent drawdown exposure in the shallow water environment. As the remaining sediment load of the stream is transported through the lake, increasingly finer particle sizes and decreasing unit weight are observed. Sediment Particle Size Distribution A total of 16 lakebed sediment samples were collected for particle size distribution analysis. Appendix III presents the laboratory analyses for these samples. Figure 6 A-C shows particle 14
20 Table 4. Sediment Distribution in Silver Lake Segment sediment sediment sediment sediment per from volume volume volume volume accumulation weight thickness segment acre figure 2 (ac-ft) (ac-ft) (ac-ft) (ac-ft) (ac-ft) (tons) (feet) (tons) , , ,771 1,623 1,609 1, , , , , , , , , , , , , , , , , , , , , , , , , , , , ,408 Totals 7,322 6,349 6,160 5,832 Averages 1,491 1,324, ,207 Notes: Averages are whole lake averages, not column averages.
21 size distribution plots for samples collected from the top surface of the accumulated sediments. These samples show the tendency for sediment particle size to decrease from upstream to downstream in the lake. This reduction in deposited sediment particle sizes is consistent with all other Illinois impoundment lakes for which particle size distribution data are available. This trend in particle-size distribution is a result of the natural sorting of suspended sediments in the lake environment. Coarser sediments are deposited as the inflowing stream water is first slowed upon entering the lake. As water moves through the lake, the suspended sediments become finer as the coarser-sized fractions fall out of suspension. At the dam, the suspended sediments are predominantly composed of colloidal and organic materials. All samples were composed of clay and silt sediment materials. This would be consistent with general observations concerning sediment distribution in Illinois lakes (Fitzpatrick et al., 1987; Bogner, 1986). These and other sources indicate that the occurrences of sand exceeding 10 percent are unusual for samples collected from lake sediment. Two sets of samples (shown in figure 6D) were collected to analyze vertical variations in particle size distribution. These samples show a temporal trend toward coarser sediments in the surface layer at each sample site. This observation is also consistent with general trends in lake sediments. Surficial sediment, the most recently deposited sediment, tends to be coarser with time at a given point. This is due to the downlake shift in the initial depositional environment of the lake due to the loss of trap efficiency of the upper end of the lake. With time, the initial depositional zone in the lake will move further down the lake because of water volume loss to sedimentation. Evaluation and Comparison to Other Illinois Lakes The sedimentation rate for Highland Silver Lake is similar to the rates for other Illinois lakes of similar size and character. Table 5 presents comparative data for other selected Illinois lakes from ISWS lake sedimentation files and for Silver Lake. The sedimentation rate for Silver Lake is in the low to average range compared to the other lakes. The drainage areas of all of the other lakes in this list are also from rural watersheds. Maintaining the water supply storage capacity of Silver Lake is essential for the maintenance of an adequate water supply for Highland. In addition to water supply, Silver Lake also provides a much needed water-based recreational resource for the Madison County area. Capacity loss rate (0.55 percent per year) and watershed sediment yield rate (1.19 tons per acre) of the lake and its watershed over the period are about average for Illinois impoundment lakes. The capacity loss rate of 0.55 percent per year determined by this study is considerably lower than the values in the 1981 (0.70 percent per year) and 1984 (0.86 percent per year) reports. 16
22 a. Particle size plots for surficial sediment samples from the dam to R9-R10 R1-R2 R3-R4 R5-R6 R7-R8 R9-R10 80 PERCENT FINER BY WEIGHT b. Particle size plots for surficial sediment samples from I-70 to R17-R18 R9-R10 R11-R12 R13-R14 R15-R16 R17-R18 c. Particle size plots for surficial sediment samples from R17-R18 to the upper end of the lake R17-R18 R19-R20 R21-R22 R23-R24 R25-R26 R27-R d. Particle size plots for paired core samples PS 3, R25-R26, Surface PS 6, R25-R26, Core section PS 19, R11-R12, Surface PS 22, R11-R12, Core section GRAIN SIZE (mm) SAND SILT CLAY >> Figure 6. Particle size (PS) distributions for Silver Lake sediment samples 17
23 Lake Table 5. Comparison of Highland Silver Lake and Other Illinois Lakes County Survey year Lake age (years) Watershed area (sq. mi.) As-built capacity (ac-ft) Surveyed capacity (ac-ft) Annual volume loss (percent) Otter Lake Macoupin ,140 15, Lake Pittsfield Pike ,563 2, Lake Taylorville Christian ,410 7, Raccoon Lake Marion ,580 4, Lake Springfield Sangamon ,900 52, Lake Lou Yeager Montgomery ,800 13, Silver Lake Madison ,320 5, Notes: sq. mi. = square miles; ac-ft = acre-feet Summary The Illinois State Water Survey has conducted a sedimentation survey of Silver Lake in Highland, Illinois. The lake, originally constructed in 1962, is the raw water source for the Highland public water supply. Previous lake sedimentation surveys were conducted in 1981 and The operating elevation for the reservoir is feet NGVD. Sedimentation has reduced the capacity of Silver Lake from 7,322 ac-ft (2,386 million gallons) in 1962 to 5,832 ac-ft (1,900 million gallons) in The sediment accumulation rates in the lake have averaged 40.3 ac-ft per year from Annual sedimentation rates for three separate periods, , , and were 51.2, 63.0, and 21.9 ac-ft, respectively. 18
24 References Bhowmik, N.G., W.C. Bogner, J.A. Slowikowski, and J.R. Adams Source Monitoring and Evaluation of Sediment Inputs for Peoria Lake. Illinois Department of Energy and Natural Resources Report number ILENR/RE-WR-93/01, Springfield, IL. Bogner, W.C Sedimentation Survey of Lake Pittsfield, Pike County, Illinois. Illinois State Water Survey Contract Report 401. Bogner, W.C Sedimentation Survey of Highland Silver Lake, Highland, Illinois. Illinois State Water Survey Contract Report 297. Demissie, M, N.G. Bhowmik, and J.R Adams Hydrology, Hydraulics, and Sediment Transport, Kankakee and Iroquois Rivers. Illinois State Water Survey Report of Investigation 103. Dendy, F.E Sediment Trap Efficiency of Small Reservoirs. Transactions of the American Society of Agricultural Engineers, 15(5): Fitzpatrick, W.P., W.C. Bogner, and N.G. Bhowmik Sedimentation and Hydrologic Processes in Lake Decatur and Its Watershed. Illinois State Water Survey Report of Investigation 107. Illinois State Water Survey Reservoir Sedimentation. Illinois State Water Survey Technical Letter 3A. Makowski, P.B., M.T. Lee, and M. Grinter Hydrologic Investigation of the Highland Silver Lake Watershed: 1985 Progress Report. Illinois State Water Survey Contract Report 380. Roberts, W.J., and J.B. Stall Lake Evaporation in Illinois. Illinois State Water Survey Report of Investigation 57. Singh, K.P., and A. Durgunoglu An Improved Method for Estimating Future Reservoir Storage Capacities: Application to Surface Water Supply Reservoirs in Illinois (Second Edition). Illinois State Water Survey Contract Report 493. U.S. Department of Agriculture-Soil Conservation Service Soil Survey of Madison County. Illinois Agriculture Experiment Station Soil Report 120, Urbana, IL. U.S. Department of Agriculture-Soil Conservation Service National Engineering Handbook, Section 3, Sedimentation, Chapters 1, 2, and 7. Washington, D.C. U.S. Geological Survey Hydrologic Unit Map State of Illinois. Reston, VA. 19
25 U.S. Geological Survey web page Historical Streamflow Daily Values for East Fork Shoal Creek Near Coffeen, Il ( ). ( Upper Mississippi River Basin Commission Comprehensive Basin Study, Volume 3. 20
26 Appendix I. Cross Sections of Silver Lake Transects 21
27 22
28 -5 0 R1-R2 Normal Pool Level (500 feet NGVD) 5 Water Depth (feet) Silver Lake cross sections 1999 depth 1981 depth 1984 depth Original depth (1981) Original depth (1984) Water depth by sounding pole (1999) Original depth by sounding pole (1999) -5 0 R3-R4 Normal Pool Level (500 feet NGVD) 5 Water Depth (feet) Distance from Odd Numbered Monument (feet) 23
29
30 -5 0 R5-R6 Normal Pool Level (500 feet NGVD) 5 Water Depth (feet) Silver Lake cross sections 1999 depth 1981 depth 1984 depth Original depth (1981) Original depth (1984) Water depth by sounding pole (1999) Original depth by sounding pole (1999) -5 0 R7-R8 Normal Pool Level (500 feet NGVD) 5 Water Depth (feet) Distance from Odd Numbered Monument (feet) 25
31
32 -5 0 R9-R10 Normal Pool Level (500 feet NGVD) 5 Water Depth (feet) Silver Lake cross sections 1999 depth 1981 depth 1984 depth Original depth (1981) Original depth (1984) Water depth by sounding pole (1999) Original depth by sounding pole (1999) -5 0 R11-R12 Normal Pool Level (500 feet NGVD) 5 Water Depth (feet) Distance from Odd Numbered Monument (feet) 27
33
34 -5 0 R13-R14 Normal Pool Level (500 feet NGVD) 5 Water Depth (feet) Silver Lake cross sections 1999 depth 1981 depth 1984 depth Original depth (1981) Original depth (1984) Water depth by sounding pole (1999) Original depth by sounding pole (1999) -5 0 R15-R16 Normal Pool Level (500 feet NGVD) 5 Water Depth (feet) Distance from Odd Numbered Monument (feet) 29
35
36 -5 0 R17-R18 Normal Pool Level (500 feet NGVD) 5 Water Depth (feet) Silver Lake cross sections 1999 depth 1981 depth 1984 depth Original depth (1981) Original depth (1984) Water depth by sounding pole (1999) Original depth by sounding pole (1999) -5 0 R19-R20 Normal Pool Level (500 feet NGVD) 5 Water Depth (feet) Distance from Odd Numbered Monument (feet) 31
37
38 -5 0 R21-R22 Normal Pool Level (500 feet NGVD) 5 Water Depth (feet) Silver Lake cross sections 1999 depth 1981 depth 1984 depth Original depth (1981) Original depth (1984) Water depth by sounding pole (1999) Original depth by sounding pole (1999) -5 0 R23-R24 Normal Pool Level (500 feet NGVD) 5 Water Depth (feet) Silver Lake cross section plots 1999 depth 1981 depth 1984 depth Original depth (1999) Original depth (1981) Original depth (1984) Distance from Odd Numbered Monument (feet) 33
39
40 -5 0 R25-R26 Normal Pool Level (500 feet NGVD) 5 Water Depth (feet) Silver Lake cross section plots 1999 depth 1981 depth 1984 depth Original depth (1999) Original depth (1981) Original depth (1984) Distance from Odd Numbered Monument (feet) -5 0 R27-R28 Normal Pool Level (500 feet NGVD) 5 Water Depth (feet) Distance from Odd Numbered Monument (feet) 35
41
42 Appendix II. Sediment Core Sample Unit Weight Results Unit weight Sample Sediment (pounds per number Location layers cubic foot) 2 R27-R R25-R R25-R R23-R R23-R R21-R R19-R R17-R R15-R R13-R R11-R R11-R R9-R R7-R R5-R R3-R
43 38
44 Appendix III. Sediment Particle Size Distribution Sample Results Sample number Particle size PS-1 PS-3 PS-6 PS-7 PS-10 (millimeters) R27-R28 R25-R26 R25-R26 R23-R24 R21-R Sample number Particle size PS-12 PS-14 PS-16 PS-18 PS-19 (millimeters) R19-R20 R17-R18 R15-R16 R13-R14 R11-R Sample number Particle size PS-22 PS-23 PS-25 PS-27 PS-29 PS-31 (millimeters) R11-R12 R9-R10 R7-R8 R5-R6 R3-R4 R1-R
45 ILLINOIS DEPARTMENT OF NATURAL RESOURCES
Sedimentation Survey of Lake Decatur s Basin 6, Macon County, Illinois
 Contract Report 2001-07 Sedimentation Survey of Lake Decatur s Basin 6, Macon County, Illinois by William C. Bogner Prepared for the City of Decatur May 2001 Illinois State Water Survey Watershed Science
Sedimentation Survey of Lake Vermilion, Vermilion County, Illinois
 Contract Report 643 Sedimentation Survey of Lake Vermilion, Vermilion County, Illinois by William C. Bogner and K. Erin Hessler Prepared for the Consumers Illinois Water Company May 1999 Illinois State
Sedimentation Survey of Lake Decatur s Big and Sand Creek Basins, Macon County, Illinois
 Contract Report 2002-09 Sedimentation Survey of Lake Decatur s Big and Sand Creek Basins, Macon County, Illinois by William C. Bogner Prepared for the City of Decatur November 2002 Illinois State Water
Sedimentation Survey of Lake Paradise and Lake Mattoon, Mattoon, Illinois
 Contract Report 2003-04 Sedimentation Survey of Lake Paradise and Lake Mattoon, Mattoon, Illinois by William C. Bogner Prepared for the CMT Engineering Company City of Mattoon and Illinois Environmental
Illinois State Water Survey Division
 Illinois State Water Survey Division SURFACE WATER SECTION SWS Contract Report 413 AT THE UNIVERSITY OF ILLINOIS SEDIMENTATION SURVEY OF DAWSON LAKE, MORAINE VIEW STATE PARK, MC LEAN COUNTY, ILLINOIS by
Lake Sedimentation Survey of Siloam Springs State Park Lake, Adams County, Illinois
 Contract Report 567 Lake Sedimentation Survey of Siloam Springs State Park Lake, Adams County, Illinois by Richard L. Allgire Office of Sediment & Wetland Studies Prepared for the Illinois Department of
Sedimentation Survey of Paris West Lake, Edgar County, Illinois
 Contract Report 527 Sedimentation Survey of Paris West Lake, Edgar County, Illinois by William C. Bogner Office of Hydraulics & River Mechanics Prepared for the City of Paris March 1992 Illinois State
Illinois State Water Survey Division
 Illinois State Water Survey Division SURFACE WATER SECTION SWS Miscellaneous Publication 108 SEDIMENT YIELD AND ACCUMULATION IN THE LOWER CACHE RIVER by Misganaw Demissie Champaign, Illinois June 1989
Illinois State Water Survey Division
 Illinois State Water Survey Division SURFACE WATER SECTION SWS Contract Report 397 AT THE UNIVERSITY OF ILLINOIS SEDIMENTATION SURVEY OF ASHLEY LAKE, WASHINGTON COUNTY, ILLINOIS by William C. Bogner Prepared
January 25, Summary
 January 25, 2013 Summary Precipitation since the December 17, 2012, Drought Update has been slightly below average in parts of central and northern Illinois and above average in southern Illinois. Soil
Highland Lake Bathymetric Survey
 Highland Lake Bathymetric Survey Final Report, Prepared For: The Town of Highland Lake 612 Lakeshore Drive Oneonta, AL 35121 Prepared By: Tetra Tech 2110 Powers Ferry Road SE Suite 202 Atlanta, GA 30339
Illinois Drought Update, December 1, 2005 DROUGHT RESPONSE TASK FORCE Illinois State Water Survey, Department of Natural Resources
 Illinois Drought Update, December 1, 2005 DROUGHT RESPONSE TASK FORCE Illinois State Water Survey, Department of Natural Resources For more drought information please go to http://www.sws.uiuc.edu/. SUMMARY.
PRELIMINARY DRAFT FOR DISCUSSION PURPOSES
 Memorandum To: David Thompson From: John Haapala CC: Dan McDonald Bob Montgomery Date: February 24, 2003 File #: 1003551 Re: Lake Wenatchee Historic Water Levels, Operation Model, and Flood Operation This
How Do Human Impacts and Geomorphological Responses Vary with Spatial Scale in the Streams and Rivers of the Illinois Basin?
 How Do Human Impacts and Geomorphological Responses Vary with Spatial Scale in the Streams and Rivers of the Illinois Basin? Bruce Rhoads Department of Geography University of Illinois at Urbana-Champaign
B-1. Attachment B-1. Evaluation of AdH Model Simplifications in Conowingo Reservoir Sediment Transport Modeling
 Attachment B-1 Evaluation of AdH Model Simplifications in Conowingo Reservoir Sediment Transport Modeling 1 October 2012 Lower Susquehanna River Watershed Assessment Evaluation of AdH Model Simplifications
REDWOOD VALLEY SUBAREA
 Independent Science Review Panel Conceptual Model of Watershed Hydrology, Surface Water and Groundwater Interactions and Stream Ecology for the Russian River Watershed Appendices A-1 APPENDIX A A-2 REDWOOD
3.0 TECHNICAL FEASIBILITY
 3.0 TECHNICAL FEASIBILITY 3.1 INTRODUCTION To enable seasonal storage and release of water from Lake Wenatchee, an impoundment structure would need to be constructed on the lake outlet channel. The structure
Assessment of Lake Forest Lake Sediment Trapping Efficiency and Capacity. Marlon R. Cook Groundwater Assessment Program Geological Survey of Alabama
 Assessment of Lake Forest Lake Sediment Trapping Efficiency and Capacity Marlon R. Cook Groundwater Assessment Program Geological Survey of Alabama Impacts of the Lake at Lake Forest on the connectivity
HISTORY OF CONSTRUCTION FOR EXISTING CCR SURFACE IMPOUNDMENT PLANT GASTON ASH POND 40 CFR (c)(1)(i) (xii)
(1)(i) (xii)") HISTORY OF CONSTRUCTION FOR EXISTING CCR SURFACE IMPOUNDMENT PLANT GASTON ASH POND 40 CFR 257.73(c)(1)(i) (xii) (i) Site Name and Ownership Information: Site Name: E.C. Gaston Steam Plant Site Location:
HISTORY OF CONSTRUCTION FOR EXISTING CCR SURFACE IMPOUNDMENT PLANT GASTON ASH POND 40 CFR 257.73(c)(1)(i) (xii) (i) Site Name and Ownership Information: Site Name: E.C. Gaston Steam Plant Site Location:
Kaskaskia Morphology Study Headwaters to Lake Shelbyville
 Kaskaskia Morphology Study Headwaters to Lake Shelbyville KWA Mini Summit 5 March 2012 1 Kaskaskia Morphology Study Headwaters to Lake Shelbyville Conducted by U.S. Army Corps of Engineers, St. Louis District
Sedimentation in the Nile River
 Advanced Training Workshop on Reservoir Sedimentation Sedimentation in the Nile River Prof. Dr. Abdalla Abdelsalam Ahmed 10-16 Oct. 2007, IRTCES, Beijing, China CWR,Sudan 1 Water is essential for mankind
Low-flow Estimates for Cedar Creek at Galesburg, Illinois
 ISWS CR 587 ntract Report 587 Low-flow Estimates for Cedar Creek at Galesburg, Illinois by Krishan P. Singh and Robert S. Larson Office of Surface Water Resources: Systems, Information & GIS Prepared for
CCR Rule Annual Inspection Report (cont.) 2
 2") The inspection findings consisted of maintenance items and items that were not observed to be signs or potential signs of significant structural weakness. No deficiencies or disrupting conditions that
The inspection findings consisted of maintenance items and items that were not observed to be signs or potential signs of significant structural weakness. No deficiencies or disrupting conditions that
INFLOW DESIGN FLOOD CONTROL SYSTEM PLAN 40 C.F.R. PART PLANT YATES ASH POND 2 (AP-2) GEORGIA POWER COMPANY
 GEORGIA POWER COMPANY") INFLOW DESIGN FLOOD CONTROL SYSTEM PLAN 40 C.F.R. PART 257.82 PLANT YATES ASH POND 2 (AP-2) GEORGIA POWER COMPANY EPA s Disposal of Coal Combustion Residuals from Electric Utilities Final Rule (40 C.F.R.
INFLOW DESIGN FLOOD CONTROL SYSTEM PLAN 40 C.F.R. PART 257.82 PLANT YATES ASH POND 2 (AP-2) GEORGIA POWER COMPANY EPA s Disposal of Coal Combustion Residuals from Electric Utilities Final Rule (40 C.F.R.
State Water Survey Division SURFACE WATER SECTION
 State Water Survey Division SURFACE WATER SECTION AT THE UNIVERSITY OF ILLINOIS Illinois Department of Energy and Natural Resources SWS Miscellaneous Publication 88 SEDIMENTATION OF POOL 19 ON THE MISSISSIPPI
N 2 3. Lake Huron. St. Clair River. Black River Assessment. Figure 1. Major tributaries to the Black River. 1. Berry Drain 2. Elk Creek.
 1. Berry Drain 2. Elk Creek Deckerville 3. Arnot Creek 4. Black Creek 5. Silver Creek 6. Plum Creek 7. Mill Creek 1 Sandusky Carsonville 8. Stocks Creek Applegate N 2 3 Croswell Peck 0 5 10 Brown City
Surface Water and Stream Development
 Surface Water and Stream Development Surface Water The moment a raindrop falls to earth it begins its return to the sea. Once water reaches Earth s surface it may evaporate back into the atmosphere, soak
KANSAS GEOLOGICAL SURVEY Open File Report LAND SUBSIDENCE KIOWA COUNTY, KANSAS. May 2, 2007
 KANSAS GEOLOGICAL SURVEY Open File Report 2007-22 LAND SUBSIDENCE KIOWA COUNTY, KANSAS Prepared by Michael T. Dealy L.G., Manager, Wichita Operations SITE LOCATION The site was approximately four miles
Stream Discharge and the Water Budget
 Regents Earth Science Unit 6: Water Cycle & Climate Name: Lab # Stream Discharge and the Water Budget Introduction: The United States Geological Survey (USGS) measures and publishes values for the daily
STRUCTURAL STABILITY ASSESSMENT
 STRUCTURAL STABILITY ASSESSMENT CFR 257.73(d) Bottom Ash Pond Complex Cardinal Plant Brilliant, Ohio October, 2016 Prepared for: Cardinal Operating Company Cardinal Plant Brilliant, Ohio Prepared by: Geotechnical
GEOL 1121 Earth Processes and Environments
 GEOL 1121 Earth Processes and Environments Wondwosen Seyoum Department of Geology University of Georgia e-mail: seyoum@uga.edu G/G Bldg., Rm. No. 122 Seyoum, 2015 Chapter 6 Streams and Flooding Seyoum,
9. PROBABLE MAXIMUM PRECIPITATION AND PROBABLE MAXIMUM FLOOD
 9. PROBABLE MAXIMUM PRECIPITATION AND PROBABLE MAXIMUM FLOOD 9.1. Introduction Due to the size of Watana Dam and the economic importance of the Project to the Railbelt, the Probable Maximum Flood (PMF)
The subject paper is being submitted for approval for publication in the annual volume entitled Geological Survey Research.
 Water Resources Division 345 Middlefield Road Menlo Park, California January 12, 1965 Memorandum To: Mr. Frank E. Clark, Chief, General Hydrology Branch Thru: Area Hydrologist PCA From: Valmore C. LaMarche
Chapter 3 Erosion in the Las Vegas Wash
 Chapter 3 Erosion in the Las Vegas Wash Introduction As described in Chapter 1, the Las Vegas Wash (Wash) has experienced considerable change as a result of development of the Las Vegas Valley (Valley).
Hydrogeology and Simulated Effects of Future Water Use and Drought in the North Fork Red River Alluvial Aquifer: Progress Report
 Hydrogeology and Simulated Effects of Future Water Use and Drought in the North Fork Red River Alluvial Aquifer: Progress Report Developed in partnership with the Oklahoma Water Resources Board S. Jerrod
 Red River Flooding June 2015 Caddo and Bossier Parishes Presented by: Flood Technical Committee Where the Rain Falls Matters I-30 versus I-20 I-20 Backwater and Tributary Floods (Localized) 2016 Flood
Lower Tuolumne River Accretion (La Grange to Modesto) Estimated daily flows ( ) for the Operations Model Don Pedro Project Relicensing
 Estimated daily flows ( ) for the Operations Model Don Pedro Project Relicensing") Lower Tuolumne River Accretion (La Grange to Modesto) Estimated daily flows (1970-2010) for the Operations Model Don Pedro Project Relicensing 1.0 Objective Using available data, develop a daily time series
Lower Tuolumne River Accretion (La Grange to Modesto) Estimated daily flows (1970-2010) for the Operations Model Don Pedro Project Relicensing 1.0 Objective Using available data, develop a daily time series
Bank Erosion and Morphology of the Kaskaskia River
 Bank Erosion and Morphology of the Kaskaskia River US Army Corps Of Engineers St. Louis District Fayette County Soil and Water Conservation District Team Partners : Carlyle Lake Ecosystem Partnership Vicinity
Historical Sedimentation at the Mouths of Five Deltas on Peoria Lake
 Contract Report 2001-08 Historical Sedimentation at the Mouths of Five Deltas on Peoria Lake by Nani G. Bhowmik, Erin Bauer, William C. Bogner, and Mike Demissie Principal Investigator Nani G. Bhowmik
San Francisco Public Utilities Commission Hydrological Conditions Report For April 2014
 San Francisco Public Utilities Commission Hydrological Conditions Report For April 2014 J. Chester, C. Graham, A. Mazurkiewicz, & M. Tsang, May 13, 2014 Snow in the High Country The view from Bond Pass
February 10, Mr. Jeff Smith, Chairman Imperial Valley Water Authority E County Road 1000 N Easton, IL Dear Chairman Smith:
 February 1, 1 Mr. Jeff Smith, Chairman Imperial Valley Water Authority 8 E County Road 1 N Easton, IL Dear Chairman Smith: The Illinois State Water Survey (ISWS), under contract to the Imperial Valley
Sediment Deposition LET THE RIVER RUN T E A C H E R. Activity Overview. Activity at a Glance. Time Required. Level of Complexity.
 Activity at a Glance Grade: 6 9 Subject: Science Category: Physical Science, Earth Science Topic: Deposition, River Systems Time Required Two 45-minute periods Level of Complexity Medium Materials* TI-73
HEC-RAS Reservoir Transport Simulation of Three Reservoirs in the Lower Susquehanna River Basin. Mike Langland and Ed Koerkle
 HEC-RAS Reservoir Transport Simulation of Three Reservoirs in the Lower Susquehanna River Basin Mike Langland and Ed Koerkle Topics Background / Project Objectives Data Selection - Sediment and Geometric
STREAM SEDIMENT MONITORING PROGRAM FOR ILLINOIS. Nani G. Bhowmik and J. Rodger Adams
 STREAM SEDIMENT MONITORING PROGRAM FOR ILLINOIS By Nani G. Bhowmik and J. Rodger Adams Illinois State Water Survey 2201 Griffith Drive Champaign, IL 61820 August 1985 STREAM SEDIMENT MONITORING PROGRAM
U.S. Army Corps of Engineers Detroit District. Sediment Trap Assessment Saginaw River, Michigan
 U.S. Army Corps of Engineers Detroit District December 2001 December 2001 This report has been prepared for USACE, Detroit District by: W.F. BAIRD & ASSOCIATES LTD. 2981 YARMOUTH GREENWAY MADISON, WISCONSIN
San Francisco Public Utilities Commission Hydrological Conditions Report For March 2016
 San Francisco Public Utilities Commission Hydrological Conditions Report For March 2016 J. Chester, C. Graham, A. Mazurkiewicz, & M. Tsang, April 7, 2016 Snow Surveyor Chris Graham crossing Huckleberry
A Report on a Statistical Model to Forecast Seasonal Inflows to Cowichan Lake
 A Report on a Statistical Model to Forecast Seasonal Inflows to Cowichan Lake Prepared by: Allan Chapman, MSc, PGeo Hydrologist, Chapman Geoscience Ltd., and Former Head, BC River Forecast Centre Victoria
U.S. ARMY CORPS OF ENGINEERS
 CORPS FACTS Regulating Mississippi River Navigation Pools U.S. ARMY CORPS OF ENGINEERS BUILDING STRONG Historical Background Federal improvements in the interest of navigation on the Mississippi River
Weather and Climate of the Rogue Valley By Gregory V. Jones, Ph.D., Southern Oregon University
 Weather and Climate of the Rogue Valley By Gregory V. Jones, Ph.D., Southern Oregon University The Rogue Valley region is one of many intermountain valley areas along the west coast of the United States.
Bishopville Prong Study
 Bathymetric and Sediment Assessment in the Bishopville Prong of St. Martin River Darlene V. Wells, Richard A. Ortt, Jr., and Stephen Van Ryswick Funded by MCBP 2011-2012 Implementation Grant Objectives
Attachment B to Technical Memorandum No.2. Operations Plan of Ross Valley Detention Basins
 Attachment B to Technical Memorandum No.2 Operations Plan of Ross Valley Detention Basins Operations Plan of Ross Valley Detention Basins Stetson Engineers Inc. January 26, 2011 1.0 Introduction Achieving
Appendix E Guidance for Shallow Flooding Analyses and Mapping
 Appendix E Guidance for Shallow Flooding Analyses and Mapping E.1 Introduction Different types of shallow flooding commonly occur throughout the United States. Types of flows that result in shallow flooding
Technical Memorandum No Sediment Model
 Pajaro River Watershed Study in association with Technical Memorandum No. 1.2.9 Sediment Model Task: Development of Sediment Model To: PRWFPA Staff Working Group Prepared by: Gregory Morris and Elsie Parrilla
2015 Fall Conditions Report
 2015 Fall Conditions Report Prepared by: Hydrologic Forecast Centre Date: December 21 st, 2015 Table of Contents Table of Figures... ii EXECUTIVE SUMMARY... 1 BACKGROUND... 2 SUMMER AND FALL PRECIPITATION...
Roger Andy Gaines, Research Civil Engineer, PhD, P.E.
 Roger Andy Gaines, Research Civil Engineer, PhD, P.E. Research Civil Engineer/Regional Technical Specialist Memphis District August 24, 2010 Objectives Where we have been (recap of situation and what s
Chiang Rai Province CC Threat overview AAS1109 Mekong ARCC
 Chiang Rai Province CC Threat overview AAS1109 Mekong ARCC This threat overview relies on projections of future climate change in the Mekong Basin for the period 2045-2069 compared to a baseline of 1980-2005.
Sediment Traps. CAG Meeting May 21, 2012
 Sediment Traps CAG Meeting May 21, 2012 Agenda Background Fundamentals of Sediment Transport Sediment Trap Existing Information Next Steps 2 The Site Saginaw River 22 mile river beginning at confluence
EAGLES NEST AND PIASA ISLANDS
 EAGLES NEST AND PIASA ISLANDS HABITAT REHABILITATION AND ENHANCEMENT PROJECT MADISON AND JERSEY COUNTIES, ILLINOIS ENVIRONMENTAL MANAGEMENT PROGRAM ST. LOUIS DISTRICT FACT SHEET I. LOCATION The proposed
The Yellow River Initiative: The Birth of a System Approach to Challenges Facing the Everglades of the North
 The Yellow River Initiative: The Birth of a System Approach to Challenges Facing the Everglades of the North Robert Barr and Siavash Beik 2016 INAFSM Annual Conference Belterra Conference Center, Indiana
Analysis of Sedimentation in Wonogiri Reservoir
 Journal of the Civil Engineering Forum Vol. 2 No. 1 (January 2016) Analysis of Sedimentation in Wonogiri Reservoir Tri Joko Inti Budi Santosa Large River Basin Organization of Bengawan Solo, Surakarta,
HEC-6 Modeling of the Main Stem of the Kankakee River in Illinois from the Stateline Bridge to the Kankakee Dam
 Contract Report 2004-04 HEC-6 Modeling of the Main Stem of the Kankakee River in Illinois from the Stateline Bridge to the Kankakee Dam by Nani G. Bhowmik, Christina Tsai, Paminder Parmar, and Misganaw
Lower Susquehanna River Integrated Sediment & Nutrient Monitoring Program
 Lower Susquehanna River Integrated Sediment & Nutrient Monitoring Program Presented at the Chesapeake Bay Program Scientific and Technical Advisory Committee (STAC) Workshop January 13, 2016 Background
Tarbela Dam in Pakistan. Case study of reservoir sedimentation
 Tarbela Dam in Pakistan. HR Wallingford, Wallingford, UK Published in the proceedings of River Flow 2012, 5-7 September 2012 Abstract Reservoir sedimentation is a main concern in the Tarbela reservoir
Overview of fluvial and geotechnical processes for TMDL assessment
 Overview of fluvial and geotechnical processes for TMDL assessment Christian F Lenhart, Assistant Prof, MSU Research Assoc., U of M Biosystems Engineering Fluvial processes in a glaciated landscape Martin
ES 105 Surface Processes I. Hydrologic cycle A. Distribution % in oceans 2. >3% surface water a. +99% surface water in glaciers b.
 ES 105 Surface Processes I. Hydrologic cycle A. Distribution 1. +97% in oceans 2. >3% surface water a. +99% surface water in glaciers b. >1/3% liquid, fresh water in streams and lakes~1/10,000 of water
Big Wood River. General Information
 General Information The flows out of the southern portion of the Sawtooth National Recreation Area in central Idaho. The study reach is about a,200 ft length of river about.5 miles upstream from the discontinued
UPPER COSUMNES RIVER FLOOD MAPPING
 UPPER COSUMNES RIVER FLOOD MAPPING DRAFT BASIC DATA NARRATIVE FLOOD INSURANCE STUDY SACRAMENTO COUTY, CALIFORNIA Community No. 060262 November 2008 Prepared By: CIVIL ENGINEERING SOLUTIONS, INC. 1325 Howe
Technical Memorandum No
 Pajaro River Watershed Study in association with Technical Memorandum No. 1.2.10 Task: Evaluation of Four Watershed Conditions - Sediment To: PRWFPA Staff Working Group Prepared by: Gregory Morris and
SPECIFIC DEGRADATION AND RESERVOIR SEDIMENTATION. By Renee Vandermause & Chun-Yao Yang
 SPECIFIC DEGRADATION AND RESERVOIR SEDIMENTATION By Renee Vandermause & Chun-Yao Yang Outline Sediment Degradation - Erosion vs Sediment Yield - Sediment Yield - Methods for estimation - Defining Sediment
2001 ANNUAL REPORT on INTERBASIN TRANSFERS for RTP South and the Towns of Cary, Apex, and Morrisville
 2001 ANNUAL REPORT on INTERBASIN TRANSFERS for RTP South and the Towns of Cary, Apex, and Morrisville Prepared for: Town of Cary Town of Apex Town of Morrisville RTP South/Wake County Submitted to: North
NATIONAL WEATHER SERVICE
 January 2016 February 9, 2016 This was a dry month across the HSA despite one large and several smaller snowfalls. Most locations ended up 1-2 inches below normal for the month. The driest locations at
Erosion Surface Water. moving, transporting, and depositing sediment.
 + Erosion Surface Water moving, transporting, and depositing sediment. + Surface Water 2 Water from rainfall can hit Earth s surface and do a number of things: Slowly soak into the ground: Infiltration
The Climate of Payne County
 The Climate of Payne County Payne County is part of the Central Great Plains in the west, encompassing some of the best agricultural land in Oklahoma. Payne County is also part of the Crosstimbers in the
Soil Formation. Lesson Plan: NRES B2-4
 Soil Formation Lesson Plan: NRES B2-4 1 Anticipated Problems 1. What are five different factors that affect soil formation? 2. What are some different types of parent material that affect soils? 3. What
HYDROLOGIC AND WATER RESOURCES EVALUATIONS FOR SG. LUI WATERSHED
 HYDROLOGIC AND WATER RESOURCES EVALUATIONS FOR SG. LUI WATERSHED 1.0 Introduction The Sg. Lui watershed is the upper part of Langat River Basin, in the state of Selangor which located approximately 20
Section 4: Model Development and Application
 Section 4: Model Development and Application The hydrologic model for the Wissahickon Act 167 study was built using GIS layers of land use, hydrologic soil groups, terrain and orthophotography. Within
Squaw Creek. General Information
 General Information is a tributary to the Salmon River. It enters the north side of the river about 0 miles downstream of North Fork, Idaho. The study reach is about a 30 ft length of stream about 2 miles
January 22, Coronado National Forest 300 West Congress Street Tucson, AZ Jim Upchurch, Forest Supervisor. Dear Mr.
 January 22, 2015 Coronado National Forest 300 West Congress Street Tucson, AZ 85701 Attn: Jim Upchurch, Forest Supervisor Dear Mr. Upchurch: In your letter dated January 16, 2015, you requested that Hudbay
2. PHYSICAL SETTING FINAL GROUNDWATER MANAGEMENT PLAN. 2.1 Topography. 2.2 Climate
 FINAL GROUNDWATER MANAGEMENT PLAN 2. PHYSICAL SETTING Lassen County is a topographically diverse area at the confluence of the Cascade Range, Modoc Plateau, Sierra Nevada and Basin and Range geologic provinces.
Chapter 10 - Sacramento Method Examples
 Chapter 10 Sacramento Method Examples Introduction Overview This chapter presents two example problems to demonstrate the use of the Sacramento method. These example problems use the SACPRE and HEC-1 computer
2012 USACE Drought Actions
 2012 USACE Drought Actions for Inland Waterway Users Board 68 Jim Walker Navigation Branch Chief 19 December 2012 US US Army Corps of of Engineers US Drought Monitor 1 2 3 4 6 5 Impacts: 1. The area in
Red River Levee Panel
 Red River Levee Panel Mississippi River Commission Monday, August 9, 2017 Red River Levees in LA & AR NONE along TX & OK Boarder Red River Levee Issues Caddo Levee Cherokee Park Authorization Bossier Levee
Appendix C Surface Water and Groundwater Interaction Memorandum
 Texas Custodial Trust 2301 West Paisano Drive El Paso, Texas 79922 Appendix C Surface Water and Groundwater Interaction Memorandum 6835001 Malcolm Pirnie, Inc. 410 N. 44 th Street, Suite 1000 Phoenix,
CAPACITY AND SEDIMENTATION OF LOCH LOMOND RESERVOIR SANTA CRUZ COUNTY, CALIFORNIA. By Ronald P. Fogelman and Karen L. Johnson U.S.
 CAPACTY AND SEDMENTATON OF LOCH LOMOND RESERVOR SANTA CRUZ COUNTY, CALFORNA By Ronald P. Fogelman and Karen L. Johnson U.S. GEOLOGCAL SURVEY Open-File Report 85-485 Prepared in cooperation with the CTY
Missouri River Basin Water Management
 Missouri River Basin Water Management US Army Corps of Engineers Missouri River Navigator s Meeting February 12, 2014 Bill Doan, P.E. Missouri River Basin Water Management US Army Corps of Engineers BUILDING
Unconventional Wisdom and the Effects of Dams on Downstream Coarse Sediment Supply. Byron Amerson, Jay Stallman, John Wooster, and Derek Booth
 Unconventional Wisdom and the Effects of Dams on Downstream Coarse Sediment Supply 3 February 2009 Byron Amerson, Jay Stallman, John Wooster, and Derek Booth Sultan River, WA OBJECTIVE Consider the landscape
Disentangling Impacts of Climate & Land Use Changes on the Quantity & Quality of River Flows in Southern Ontario
 Disentangling Impacts of Climate & Land Use Changes on the Quantity & Quality of River Flows in Southern Ontario by Trevor Dickinson & Ramesh Rudra, Water Resources Engineering University of Guelph Acknowledgements
The hydrologic service area (HSA) for this office covers Central Kentucky and South Central Indiana.
 for this office covers Central Kentucky and South Central Indiana.") MONTH YEAR January 2011 February 15, 2011 X An X inside this box indicates that no flooding occurred within this hydrologic service area. January 2011 was drier than normal in all locations in the area.
MONTH YEAR January 2011 February 15, 2011 X An X inside this box indicates that no flooding occurred within this hydrologic service area. January 2011 was drier than normal in all locations in the area.
Lecture Outlines PowerPoint. Chapter 5 Earth Science 11e Tarbuck/Lutgens
 Lecture Outlines PowerPoint Chapter 5 Earth Science 11e Tarbuck/Lutgens 2006 Pearson Prentice Hall This work is protected by United States copyright laws and is provided solely for the use of instructors
Susitna-Watana Hydroelectric Project (FERC No )
") (FERC No. 14241) Development of Sediment-Transport Relationships and an Initial Sediment Balance for the Middle and Lower Susitna River Segments Prepared for Prepared by Tetra Tech February 2013 REPORT
(FERC No. 14241) Development of Sediment-Transport Relationships and an Initial Sediment Balance for the Middle and Lower Susitna River Segments Prepared for Prepared by Tetra Tech February 2013 REPORT
Summary. Streams and Drainage Systems
 Streams and Drainage Systems Summary Streams are part of the hydrologic cycle and the chief means by which water returns from the land to the sea. They help shape the Earth s surface and transport sediment
STUDY GUIDE FOR CONTENT MASTERY. Surface Water Movement
 Surface Water SECTION 9.1 Surface Water Movement In your textbook, read about surface water and the way in which it moves sediment. Complete each statement. 1. An excessive amount of water flowing downslope
Numerical modeling of sediment flushing from Lewis and Clark Lake
 University of Nebraska - Lincoln DigitalCommons@University of Nebraska - Lincoln US Army Research U.S. Department of Defense 2013 Numerical modeling of sediment flushing from Lewis and Clark Lake Jungkyu
Island Design. UMRS EMP Regional Workshop. Presentation for the
 Island Design Presentation for the UMRS EMP Regional Workshop by Jon Hendrickson Hydraulic Engineer Regional Technical Specialist, Water Quality and Habitat Restoration August 17 19, 2005 Project Delivery
Remaining Capacity in Great Lakes Reservoirs
 US Army Corps of Engineers Detroit District Remaining Capacity in Great Lakes Reservoirs Storage Capacity Behind Great Lakes Dams Field Data and Modeling Motivation for project Project overview Data and
CASE STUDY NATHPA JHAKRI, INDIA
 SEDIMENT MANAGEMENT CASE STUDY NATHPA JHAKRI, INDIA Key project features Name: Nathpa Jhakri Country: India Category: reduce sediment production (watershed management); upstream sediment trapping; bypass
Each basin is surrounded & defined by a drainage divide (high point from which water flows away) Channel initiation
 Channel initiation") DRAINAGE BASINS A drainage basin or watershed is defined from a downstream point, working upstream, to include all of the hillslope & channel areas which drain to that point Each basin is surrounded &
DRAINAGE BASINS A drainage basin or watershed is defined from a downstream point, working upstream, to include all of the hillslope & channel areas which drain to that point Each basin is surrounded &
Little Swan Lake. Dam Inspection & Siltation Study Prepared By: William Klingner, P.E., CFM October 28, 2018
 Little Swan Lake Dam Inspection & Siltation Study Prepared By: William Klingner, P.E., CFM October 28, 2018 Agenda Little Swan Lake Dam Inspection Theoretical Little Swan Lake Siltation Rate Calculations
LOCATED IN INDIAN RIVER COUNTY PREPARED FOR S.J.R.W.M.D. AND F.W.C.D. DECEMBER, 2003 Updated 2007 Updated May 2014 PREPARED BY
 FELLSMERE WATER CONTROL DISTRICT EAST MASTER DRAINAGE PLAN AND STORMWATER HYDROLOGIC ANALYSIS OF THE GRAVITY DRAINAGE SYSTEM LOCATED BETWEEN THE EAST BOUNDARY, LATERAL U, THE MAIN CANAL, AND DITCH 24 LOCATED
The Climate of Bryan County
 The Climate of Bryan County Bryan County is part of the Crosstimbers throughout most of the county. The extreme eastern portions of Bryan County are part of the Cypress Swamp and Forest. Average annual