Technical Memorandum
|
|
|
- Bertha Ramsey
- 5 years ago
- Views:
Transcription
1 15250 NE 95th Street Redmond, WA Phone: (425) Fax: (425) Technical Memorandum Date: December 30, 2010 Project Number: /MM101 To: Bob Aldrich, Snohomish County Surface Water Management From: Paul DeVries, Ph.D., P.E. Subject: Results of Geomorphic Analysis of Hydraulic, Hydrologic, and Sediment Conditions in the Lower Skykomish River Below the Sultan River CONTENTS LIST OF PLATES INTRODUCTION RELEVANCE TO RECOVERY PLANNING METHODS LONGITUDINAL PROFILES SEDIMENT TRANSPORT MODELING HEC-RAS Model Geometric Data HEC-RAS Model Calibration Sediment Transport Simulation Flows Bedload Transport Analysis AERIAL PHOTOGRAPH INTERPRETATION Historic Channel Planform Mapping Gravel/Sand Bar and Side Channel Area Mapping AVULSION RISK ASSESSMENT Individual Avulsion Risk Factors Joint Avulsion Risk Factors...20
2 R2 Resource Consultants, Inc. December 30, /MM101: Lower Skykomish River Geomorphic Analysis Page 2 3. RESULTS LONGITUDINAL PROFILES SEDIMENT TRANSPORT MODELING CHANNEL MIGRATION PATTERNS GRAVEL/SAND BAR STORAGE AND SIDE CHANNEL AREA TRENDS AVULSION RISK SYNOPSIS OF ANALYSIS RESULTS AND SELECTION OF CONCEPTUAL PROJECTS SUMMARY OF LARGE SCALE VARIATION IN REACH GEOMORPHIC CHARACTERISTICS POTENTIAL RESTORATION PROJECTS Channel Migration/Side Channel Connectivity Projects Instream Habitat Complexity Projects Mainstem Spawning Habitat Maintain Island Splits LEVEL OF CONFIDENCE IN ANALYSIS AND RESULTS REFERENCES...40 APPENDIX A: Summary of Hydraulic Calibration LIST OF PLATES Plate 1. Plate 2. Location of analysis segments established to evaluate and present GIS data for the lower Skykomish River geomorphic reach analysis. Spatial variation in erosional and depositional trends in the lower Skykomish River analysis reach as suggested by sediment transport modeling using Parker s (1990) bedload transport equation; classifications are as defined in Table 2. Lateral extent depicted is based on the extent of historic channel delineation.
3 R2 Resource Consultants, Inc. December 30, /MM101: Lower Skykomish River Geomorphic Analysis Page 3 Plate 3. Plate 4. Plate 5. Plate 6. Plate 7. Plate 8. Plate 9. Locations of main and side channels of the lower Skykomish River analysis reach as digitized from georeferenced aerial photographs. Mapped extent of main and side channel locations over the period of record is indicated by light blue shading. Results of a bank condition survey of the lower Skykomish River performed by Snohomish County Surface Water Management in Risk ratings of potential avulsion pathways characterized according to lowest of three flood levels (2-, 10- and 100-year recurrence intervals) at which floodplain or off-channel flow may occur. Tracings and ratings were based on 2006 topography. GIS Data available from Snohomish County Surface Water Management. Risk ratings of potential avulsion pathways characterized according to average gradient along each pathway segment. Tracings and ratings were based on 2006 topography. GIS Data available from Snohomish County Surface Water Management. Risk ratings of potential avulsion pathways characterized according to floodplain soil K w erodibility factors. GIS Data available from Snohomish County Surface Water Management. Joint avulsion risk ratings of potential avulsion pathways characterized according to weighted sums of flood flow level, longitudinal gradient, and floodplain soil K w erodibility factor ratings depicted in Plates 6-8. Tracings and ratings were based on 2006 topography. GIS Data available from Snohomish County Surface Water Management. Avulsion risk mitigation ratings of potential avulsion pathways characterized according to whether a segment passes through forested land. GIS Data available from Snohomish County Surface Water Management. Plate 10. Avulsion risk mitigation ratings of potential avulsion pathways characterized according to whether a segment is intersected by a paved or gravel surfaced road. GIS Data available from Snohomish County Surface Water Management. Road coverage may be incomplete and should be evaluated on a site-specific basis.
4 R2 Resource Consultants, Inc. December 30, /MM101: Lower Skykomish River Geomorphic Analysis Page 4 Plate 11. Locations of restoration projects identified in this assessment that address Snohomish River Basin Recovery Plan goals and that are consistent with natural processes in the lower Skykomish River.
5 R2 Resource Consultants, Inc. December 30, /MM101: Lower Skykomish River Geomorphic Analysis Page 5 1. INTRODUCTION R2 Resource Consultants Inc, (R2) is assisting Snohomish County Surface Water Management (SWM) with reach scale geomorphic analyses that will be used to support assessment and prioritization of restoration possibilities in the lower Skykomish River reach, extending from the town of Sultan downstream to the confluence with the Snoqualmie River (Figure 1). The goal of the analyses is to identify projects that are consistent and compatible with natural reach scale hydraulic and sediment transport processes and that will restore and protect salmon habitat as well as protect infrastructure in the reach. R2 worked closely with SWM staff in the collection and analysis of data specific to the reach geomorphic assessment and directed at the following goals: 1. Identify reach scale processes that influence channel morphology; 2. Identify hydraulic and sediment transport processes that will influence future condition and channel location in the reach; 3. Identify the most geomorphically active and inactive segments in the reach; and 4. Qualify risk associated with different restoration activities for each level of geomorphic activity, including channel connectivity, floodplain connectivity, instream/bank stabilization structures, and bank revetment removal. The geomorphic analysis involved the following elements that are described in this memorandum: 1. Collection and analysis of pebble count data, and analysis of long profile characteristics. 2. Development of a HEC-RAS model for use in hydraulic and sediment transport analyses relative to identifying river segments with aggradational vs. degradation tendencies and for estimating hydraulic characteristics at various flow levels. 3. Digitizing of former main and side channel locations and unvegetated gravel bars using available aerial photography up to and including 2007, and calculating channel migration rates and changes in active gravel bar areas 4. Delineation of potential floodplain avulsion channels and assessment of avulsion risks. 5. Review and synthesis of the sediment transport, channel migration rate, and gravel bar data to develop ratings for each parameter for sub-reaches within the project reach (called analysis segments). 6. Identification of appropriate restoration project types for different segments based on segment characteristics developed in the preceding tasks.

6 R2 Resource Consultants, Inc. December 30, /MM101: Lower Skykomish River Geomorphic Analysis Page 6 The work products will be used to guide future specific restoration grant applications for completing projects that are consistent with natural geomorphic processes in the Lower Skykomish River below the Sultan River. This work represents an extension of analyses performed previously in the Braided Reach of the Skykomish River upstream of the Sultan River to Gold Bar, which has been integral in the identification, design, and construction of restoration projects initiated in that reach in 2009 and continuing through Sultan R Monroe Groeneveld Slough Haskell Slough Riley Slough Flow Analysis Reach Figure 1. Location of the lower Skykomish River reach analyzed in this memorandum, near Monroe, WA. 1.1 Relevance to Recovery Planning The analysis reach is roughly 13½ miles long and provides important spawning and rearing habitat for Skykomish Chinook salmon (Oncorhynchus tshawytscha), one of two distinct Chinook stocks identified as being important for recovery in the Snohomish River basin and for which escapement numbers are estimated at 10% of historic levels according to the 2005 Snohomish Basin Salmon Recovery Plan. A key component for recovery identified by the Plan is to restore and preserve watershed processes and provide juvenile rearing habitat in the mainstem Skykomish River. The analyses documented in this memo are key to understanding the reach scale processes that control the distribution, quality, and persistence of juvenile habitat. Habitat and fish surveys conducted as part of the Braided Reach analysis by Washington Trout (now Wild Fish Conservancy) indicated that side channel habitat is particularly important for juvenile salmonids living within the mainstem river corridor. Thus projects that increase side
7 R2 Resource Consultants, Inc. December 30, /MM101: Lower Skykomish River Geomorphic Analysis Page 7 channel habitat availability and quality are considered desirable for enabling recovery of salmon and steelhead stocks in the basin. The work and results described in this memorandum can be used to assess opportunities and risks of specific restoration activities designed to improve juvenile and spawning habitats, as well as more general risks to floodplain development and infrastructure. To accomplish this, a strategy was employed of identifying the extent to which shorter, distinct segments within the reach are geomorphically active or inactive in terms of sediment transport, deposition, channel migration, and overall erosion tendency. This strategy allowed evaluation of specific locations on the floodplain in the context of local and reach scale constraints. In addition, the results facilitate explanation of the physical cause of specific effects to infrastructure and private land in an intuitive way to stakeholders. 2. METHODS A suite of analyses was selected over focusing on a specific method, any one of which on its own would provide some information but would not yield a sufficiently complete picture. Quantitative, process-based analyses (e.g., sediment transport modeling, bank migration rates, gravel bar areas) were favored over channel form (e.g., see Kondolf et al. 2001) or process-based classifications (e.g., channel migration zone mapping; Rapp and Abbe 2003), so that the results could be used to better answer the question, What would happen if The analysis involved identifying and quantifying (1) physical processes that influence reach channel morphology, (2) hydraulic and sediment transport processes that will affect future condition and channel location in the reach, and (3) the most geomorphically active and inactive segments in reach. To accomplish these tasks, information was analyzed that was critical for assessing processes acting at the reach and site scales (Wissmar and Beschta 1998; Kondolf 2000): (1) longitudinal profiles of elevation, gradient, and grain size distributions, (2) hydraulics and hydrology using HEC- RAS, USGS gage data, and surveyed cross-section and flood stage data, (3) bedload transport potential based on a 50-year duration, (4) aerial photographs for evaluating changes in active channel locations and cumulative active gravel bar storage and side channel areas, and (5) LiDAR and other available GIS data for characterizing flood engagement frequency and avulsion risk potential of floodplain channels. Salient details of the methods are described below. 2.1 Longitudinal Profiles Longitudinal profiles provide an indication of effects of large scale slope changes on sediment transport and deposition patterns that control fish habitat form. Longitudinal profiles were
8 R2 Resource Consultants, Inc. December 30, /MM101: Lower Skykomish River Geomorphic Analysis Page 8 developed for water surface and thalweg elevations and mean velocity over the analysis reach and upstream, using the HEC-RAS model data and predictions for the 2-yr flood event. The longitudinal profiles were used to identify general sediment transport trends in the reach and upstream. A total of 13 pebble counts were sampled to characterize upstream-downstream variation in grain size and depositional patterns in the reach, and compare with upstream data collected previously. It was generally not feasible to collect data near the thalweg given channel size. Instead, a sample size of 100 stones was selected randomly by moving over the mid-point of active depositional point bars between the water and floodplain and measuring the intermediate axis diameter of each stone. Sampling locations were selected to be geomorphically similar in terms of bar type and relative location on the bar, so that observed longitudinal variation in grain sizes would not reflect locally variable depositional processes, but rather larger scale geomorphic variation. Various percentile particle sizes, including D 50 (size for which 50 percent of stones were smaller), were computed for each sample and plotted against river mile. Inspection of the longitudinal scatter in D 50 and D 90 values indicated that there were three sub-reaches in the plot corresponding to large scale breaks in channel confinement and flood flows. Pebble count data were accordingly pooled within each sub-reach to develop three general grain size distributions that were used in sediment transport analyses. 2.2 Sediment Transport Modeling Sediment transport modeling involved first creating a hydraulic HEC-RAS model of the reach and using the model output to predict sediment transport rates within the active channel, and develop a within-reach sediment transport budget HEC-RAS Model Geometric Data A HEC-RAS steady flow model was constructed to simulate flood flows and predict longitudinal shear stress variation for estimating bedload transport rates and their effect on a coarse sediment budget within the reach. The model was developed as a blend of two different models, one developed previously for SWM to model the 100 year flood in the lower 9 miles of the reach ( nhc model ), and a second model developed more recently by R2 to model flood flows upstream specifically for the geomorphic analysis. The upstream model was developed using bathymetric longitudinal and cross-section profile data collected in the field in 2007 by County staff, and using 2003 LiDAR data. All elevations were calculated relative to the NAVD 88 vertical datum. Benchmarks were established and tied-in using real time kinematic (RTK) GPS
9 R2 Resource Consultants, Inc. December 30, /MM101: Lower Skykomish River Geomorphic Analysis Page 9 and a total station. Profile data were collected using a raft that was rowed across channel. Cables were not used to maintain position, and thus the data did not represent a perfectly perpendicular line as is needed for computing flow rate and stage in HEC-RAS. Cross-sections were correspondingly developed by projecting the bed elevation surveyed at points along the boat trajectory stream-wise onto a perpendicular transect. Elevations were computed by subtracting the water depth from the water surface elevation, which was determined using RTK GPS. The bare earth model LiDAR data were used to complete dry-land portions including exposed bars, side channels, and the floodplain. The upstream and downstream boundary conditions were approximated using the normal depth assumption in lieu of having measured rating curves. Transect spacing was specified in the HEC-RAS model for the channel centerline, and shoreward of the left and right banks. Transect names were set equal to centerline stationing using a river mile designation. Left and right bank longitudinal stationing was measured on scaled color aerial photographs using GIS. Ineffective flow areas were specified at most transects to help distribute the flow better or to delay engagement of side channels and floodplain areas until higher flows, based on review of aerial photographs and assessing land cover and side-channel size characteristics. The model crosssections (Plate 1) generally defined analysis segments for which other quantities were calculated such as bank migration rate and gravel bar area. There were also a few transects added later in the analysis to improve model accuracy that did not define analysis segments. Table 1 lists the analysis river mile for each HEC-RAS model transect defining an analysis segment, and Plate 1 depicts the corresponding analysis segment locations. Table 1. River mile (RM) system used in the analysis (RM 0 = confluence with Snoqualmie and Snohomish rivers. Analysis Segment Analysis RM (Downstream Boundary) Landmarks, Notes Head of Groeneveld Slough Interpolated HEC-RAS Transect Exit of Groeneveld Slough
10 R2 Resource Consultants, Inc. December 30, /MM101: Lower Skykomish River Geomorphic Analysis Page 10 Table 1. River mile (RM) system used in the analysis (RM 0 = confluence with Snoqualmie and Snohomish rivers. Analysis Segment Analysis RM (Downstream Boundary) Landmarks, Notes Top of Channel Split Elwell Creek Bottom of Channel Split BPA Power Line BPA Power Line Next to SR Barr Creek Public Boat Access Top of Haskell Slough
11 R2 Resource Consultants, Inc. December 30, /MM101: Lower Skykomish River Geomorphic Analysis Page 11 Table 1. River mile (RM) system used in the analysis (RM 0 = confluence with Snoqualmie and Snohomish rivers. Analysis Segment Analysis RM (Downstream Boundary) Landmarks, Notes Old Rail Bridge Location Above 203 Bridge at Monroe Below 203 Bridge Bottom of Haskell Slough Bottom of Riley Slough
12 R2 Resource Consultants, Inc. December 30, /MM101: Lower Skykomish River Geomorphic Analysis Page HEC-RAS Model Calibration The HEC-RAS model was calibrated upstream of RM 9 using water surface elevations surveyed after the December 1980 (90,100 cfs), November 1990 (102,000 cfs), November 2006 (129,000), and November 2008 (67,500 cfs) peak flow events, with discharges as reported at the USGS gage located at Gold Bar (Station No ). High water surface elevations were provided by Chris Nelson, SWM for various locations along the river. The November 2006 event was the flood of record at the Gold Bar gage. The November 2008 event corresponded to a flood with an approximately 7 year recurrence interval and was also representative of hydraulic conditions and coarse bedload transport in the main channel during extreme events. The model should not be considered accurate for predicting water levels that can be used to delineate the 100-year floodplain per FEMA standards, but the predicted levels should be approximately correct for assessing sediment transport rate imbalances between adjacent transects and for developing relative avulsion risk ratings (see below). Calibration focused first on establishing the order of magnitude of Manning s n-values occurring at the November 2006 peak flow level. Predicted water surface elevations were compared with the surveyed values available to estimate the approximate magnitude of n for the 100 year flood. The model was then recalibrated to the November 2008 peak flow level, which corresponds closer to the range of most geomorphically effective flows in the main channel, via adjustments of Manning s n, expansion, and contraction coefficients until the predicted water surface elevation was similar to the measured. The two sets of calibration values of Manning s n were compared to confirm consistency, with slightly higher n-values needed to calibrate to the lower flood discharge at specific locations upstream of the Wallace River. Given the general consistency in calibration coefficients between the two flow levels and with hydraulic principles, the results were considered suitable for modeling of sediment transport flows in general. The calibration values determined for cross-sections near the calibration water surface elevation locations were applied to other locations in the reach. Based on the calibration results, it was decided that the HEC-RAS model developed for below RM 8 did not need to be recalibrated, given that the Manning s n values for both calibration flows were generally identical at most locations evaluated between RM 9 and the Sultan River, and were similar in overall magnitude above and below RM 9. Calibration details are presented in Appendix A. The model was calibrated and run using the interpolated transect feature of HEC-RAS. The extra transects were needed to ensure (i) more reasonable calibration n-values, (ii) reduce modeled head loss between transects to avoid model warning messages regarding a 1 ft criterion, and (iii) increase numerical accuracy. Adding extra transects stabilized the model better by
13 R2 Resource Consultants, Inc. December 30, /MM101: Lower Skykomish River Geomorphic Analysis Page 13 smoothing between-transect changes in depth and velocity, and distributing energy losses across shorter model segments. Interpolated transects were generally spaced less than approximately 200 ft apart, resulting in energy losses between transects generally equal to about 1.0 ft or less at flood stage, a resolution considered sufficient for the river size Sediment Transport Simulation Flows Simulation flows were developed using the USGS gage at Gold Bar as an overall basis. Flows were adjusted downstream based on basin-wide hydrology analyses performed for the County (nhc 2008). Major inflows included in the model were the Wallace River and the Sultan River. Additional flow change locations were included in the nhc model portion that accounted for losses to the floodplain in the vicinity of Monroe and downstream. These flow change locations were not modified in the combined model and the affiliated flow splits from the nhc model were relied on to estimate other simulation flows for the various flow change locations. Details on flow estimation are provided in Appendix A. A flow duration curve was generated for the Gold Bar gage using available daily mean flow data for the period of record (Figure 2). The curve was discretized into a histogram approximating the duration of various simulation flow magnitudes as a percent of the length of the record. The temporal distribution of flows was determined based on matching total volume under the curve and total number of days over a 50-year period while also approximating the curve shape. Corresponding flows at other locations downriver were estimated using the relations and data sources described above and in Appendix A Bedload Transport Analysis The simulation flows were modeled in HEC-RAS using the steady flow option, for a series of discharges equal to and greater than the 5 percent exceedance flow, up to the 50 year flood. Relatively little bedload transport occurs in general in alluvial rivers when discharge is below the 5 percent exceedance flow. A 50-year period was simulated to predict the total volume of bedload transported at each HEC-RAS transect and evaluate corresponding long term deposition and erosion trends in the reach over a representative project design life. The HEC-RAS main channel shear stress predictions were input with grain size distribution data to a Fortran program that predicted sediment transport rate per unit width based on Parker s (1990) bedload transport equation. An approximate sediment budget was developed to characterize analysis segments within the reach regarding their deposition or erosion tendencies,
14 R2 Resource Consultants, Inc. December 30, /MM101: Lower Skykomish River Geomorphic Analysis Page 14 and use that knowledge as a guide to the type of project that may or may not succeed in the segment. For example, fish habitat structures constructed with large wood would not be expected to succeed in an analysis segment that was predicted to strongly experience a net gain in sediment over time, because the structures would have a higher risk of burial or abandonment by the river. 6% 5% Skykomish River at Gold Bar Percent Exceedance 4% 3% 2% 1% Gage Data Sediment Transport Calculations 0% Mean Daily Flow (cfs) Figure 2. Flow duration curve for the Skykomish River at Gold Bar USGS gage (Station No ) and corresponding discretization employed to approximate flow duration for the 50-year bedload transport sediment budget analysis. The sediment budget was computed for each flow and analysis segment by estimating sediment transport rates at the bounding upstream and downstream HEC-RAS cross-sections, and applying a mass balance equation for bed elevation change between transects as a function of estimated input and output bedload mass transport rates per unit width (q B ), active width (W), distance between transects (L), sediment density (ρ s ), and porosity (P) (DeVries, 2000):
15 R2 Resource Consultants, Inc. December 30, /MM101: Lower Skykomish River Geomorphic Analysis Page 15 Y T t 2 Y t = dt t t t 2 ( qbw ) out ( qbw ) in Δt 0.5L( Win + Wout ) ρ s (1 P 1 1 ) (1) where the incremental change in bed elevation ( Y/ t) was evaluated for each simulation flow and then multiplied by the histogram time increment (Δt) over which the modeled flow occurred during the 50-year period. This was repeated for other flows, and the results summed to estimate a net mean change in bed elevation Y T between successive HEC-RAS transects. A strongly positive value of the Y/ t sum was inferred as an indication of a strong tendency towards aggradation, and a strongly negative value as an indication of a stronger tendency towards degradation (at the same time recognizing that the reach as a whole may be aggradational over a geologic time span). The active width used in Equation (1) was specified as the smaller of the wetted main channel width computed by HEC-RAS and an active bottom width in the main channel as judged from a review of cross-section profile morphology and scaled 2003 aerial photographs, consistent with what was done for the previous Braided Reach geomorphic analysis. Length was set as the main channel distance between HEC-RAS transects. The resolution of the HEC-RAS modeling and physical characteristics of the modeled reach were such that predictions of bed elevation change at several pairs of adjacent analysis segments were strongly negative for the upstream segment and strongly positive for the adjacent downstream segment. To resolve this, the two analysis segment predictions of bed elevation change were combined using the following weighted formula based on computing total volume between three successive transects consecutively numbered 1, 2, and 3: Y T1 3 Y = T1 2 L L ( W 1 ( W 1 + W ) + Y L ( W + W 2 + W ) + L 2 T ( W W 3 ) 3 ) (2) Seven aggradation/deposition potential classes were developed subsequently and used to characterize deposition trends based on the sign and magnitude of the predicted bed elevation change (Table 2). Each analysis segment was classified accordingly and the results depicted graphically in ARC-GIS.
16 R2 Resource Consultants, Inc. December 30, /MM101: Lower Skykomish River Geomorphic Analysis Page 16 Table 2. Predicted bed elevation change rate and sign used to classify analysis segments according to sediment transport and deposition characteristics in the lower Skykomish River below the Sultan River. Aggradation/Degradation Potential Class Bed Elevation Change Rate (ft/yr) 1 < 1.0 (Extreme Degradation Potential) to 0.20 (High Degradation Potential) to 0.05 (Moderate Degradation Potential) 4 ±0.05 (Minor Change) to 0.20 (Moderate Aggradation Potential) to 1.0 (High Aggradation Potential) 7 > 1.0 (Extreme Aggradation Potential) 2.3 Aerial Photograph Interpretation Aerial photographs were available from 1938, 1965, 1969, 1978, 1984, 1991, 1998, 2001, 2003, 2006, and The photographs were mosaicked and georeferenced. The reach was divided into analysis segments using hydraulic modeling transects as boundaries (a few transects were added later in the HEC-RAS model, but the analysis segment boundaries were preserved for consistency throughout the analysis). This permitted a common framework for synthesizing the results from the various analyses. Spatial and temporal patterns in channel migration rate and gravel bar area were derived from the aerial photographs to infer relative stability of specific analysis segments of the analysis reach associated with varying geomorphic activity levels. The 2001 and 2006 photographs were digitized but were not included in quantitative analyses so that average migration rates and changes in gravel bar area would be calculated over roughly similar time intervals Historic Channel Planform Mapping Right and left river bank locations were digitized by SWM GIS staff for each year photographs were available. Main and major side channels were mapped. The resulting digitized poly lines were overlaid chronologically and locations compared between consecutive sets of photographs. Migration rates were estimated as the local average offset distance within an analysis segment between successive main channel river bank traces, divided by the number of years between the two sets of photographs. The visual changes and calculated migration rates were used as the basis for classifying an analysis segment according to planform changes, using rates established in previous analyses for the Skykomish and Sauk rivers (Table 3). The riverbank with the greater average annual migration rate was used to classify a segment.
17 R2 Resource Consultants, Inc. December 30, /MM101: Lower Skykomish River Geomorphic Analysis Page 17 Table 3. River channel migration rate classification for assessing channel planform changes. Migration may be to either left or right bank directions. Planform Change Index Average Migration Rate (ft/yr, one or both banks) 1 < 15 (minor change) (small change, meandering tendency) (moderate change, meandering/wandering tendency) 4 >80 (severe change, braiding tendency) Gravel/Sand Bar and Side Channel Area Mapping Exposed, unvegetated (i.e., active) main channel gravel/sand bar and clearly visible active side channel areas were digitized from the aerial photographs as discrete polygons. Most bars were point bars, although mid-channel bars were also mapped at specific locations where the channel widened substantially so that flow depth was very shallow across the hydraulic control formed by depositing coarse bedload. The area of gravel bar mapped in each segment was then computed and summed cumulatively from upstream to downstream in ARC-GIS to reflect the direction of sediment transport and deposition. A running sum was computed for the main channel; separate sums were computed for major side channels, with the river mile determined by the location at which the side channel branched off from the main channel. Not all of the aerial photographs were taken at similar flows, and differences were expected in gravel bar areas due to differential inundation. An adjustment was performed by calculating an average active gravel bar cross-channel width (W GB ) as the segment area digitized divided by segment centerline length, and determining an average wetted width (W W ) across upstream and downstream segment boundaries, at each flow in GIS. The photograph year with wetted widths falling in the middle of the other years (1991) was used as a reference wetted width (W Wref ), and wetted widths from all other years used to adjust the respective year s value of W GB to an estimated equivalent reference year width (W GBref ), via the following formula: W = W + W W ) (3) GBref GB ( Wref ref Resulting values less than zero were set to zero. The adjustment effectively converted measured gravel bar widths (W GB ) to the equivalent width for the flow at which the 1991 photographs were taken (W GBref ).
18 R2 Resource Consultants, Inc. December 30, /MM101: Lower Skykomish River Geomorphic Analysis Page 18 The mean adjusted (or equivalent) widths allowed for making comparisons across different years without the influence of changing thalweg lengths (e.g., associated with channel migration). Locations were identified where mean widths changed by more than 130 ft between photographs, indicting a substantial change in storage and erosion activity. This threshold value approximates the upper limit to average correction in gravel bar width for each set of sequential aerial photographs, and thus filtered out potential instances of interpretation and measurement error. Each analysis segment was classified according to whether or not a substantial change in mean width of active bar or side channel slope occurred, and whether the change represented an overall decrease or increase in area between successive photographs. The resulting classifications were coded for each analysis segment and presented spatially in GIS format. 2.4 Avulsion Risk Assessment Avulsion risk was assessed using LiDAR topographic data, HEC-RAS flood modeling results, and various GIS data. Factors evaluated as contributing to the potential for avulsion included the presence of concentrated flow pathways evident on the topographic surface, the average slope of pathway segments, the general flow level at which the upstream inlet would be inundated, and the inherent erosivity of soils associated with the pathway. Potential factors that could reduce the risk of avulsion were also identified, including vegetation and the presence of infrastructure. The methods used to characterize and identify these various factors are described below Individual Avulsion Risk Factors Flow Paths: Potential avulsion pathway segments were traced on 2 ft contour maps generated from the 2003 LiDAR data as linear features with elevations that were generally lower than the surrounding floodplain. Segments began and ended at the main river channel or junctions with other segments. A GIS layer was then constructed by Laura Audette (SWM GIS staff) that depicted each potential pathway segment as a linear feature. Inundation Flow Level: The elevation of pathway segments branching from the river was used to estimate the return interval event at which each segment and connected segments downstream and upstream would become wetted, using water surface elevations estimated for the 2-year, 10- year, and 100-year event based on the HEC-RAS modeling. Segments below junctions with upstream segments were assumed to be connected at the same level as upstream segments as long as there was no significant break in slope evident on the map downstream. For example, if a downstream segment was connected to two upstream segments with one flowing at the 2 year
19 R2 Resource Consultants, Inc. December 30, /MM101: Lower Skykomish River Geomorphic Analysis Page 19 flood level and the other at the 10 year flood level, the downstream segment was assigned a 2- year flood level risk. Slope: A longitudinal profile for each pathway was developed by extracting elevation data from a DEM for selected points spaced 100 ft apart along each segment. Average slope was calculated as the average of slopes calculated between points, for each segment. Slope between points was calculated as the difference in elevation between points divided by the length between points (100 ft or shorter, depending on the total length of the segment). Soil Erodibility: The avulsion pathway layer was overlaid in GIS on a soils map produced by the NRCS. Each soil type is assigned a K w -factor which represents both susceptibility to erosion and the infiltration rate. Soils with lower K w -factors are more resistant to erosion due either to high clay content or high infiltration. Soils with higher K w -factors are more erodible. Soils within the study area were classified as follows based on the NRCS K w -factor, with greater emphasis placed on the uppermost soil horizon: 1 = K w -factor > 0.3 (higher erodibility) 2 = K w -factor (moderate erodibility) 3 = K w -factor <0.2 (lower erodibility) Where potential avulsion pathways crossed soils with different K w -factors, a weighted average class was calculated based on the relative length of channel crossing each soil type. Vegetation Cover: In general, the presence of forest vegetation is anticipated to reduce the risk of avulsion, as trees provide deep, dense root masses that are more resistant to erosion and may inhibit braiding. In addition, if channels do avulse through forested areas, trees that fall into the new channel provide roughness elements that reduce erosive energy and may temporarily block flow. Vegetation was assessed visually for each avulsion pathway using 2007 aerial imagery. Potential avulsion pathways were classified as forested, non-forested or open water. Only forest vegetation was considered to potentially reduce the likelihood of avulsion. Road Grade Controls: The presence of roads can act as both a mitigating factor or exacerbate the risk of avulsion. Paved roads, and to a lesser extent gravel roads represent a hard point that is more resistant to erosion over the short-term. However, roads that cross avulsion pathways may also exacerbate the risk if they contain undersized drainage structures or temporarily hold back water then fail catastrophically. This analysis assumes that roads are monitored and/or protected during floods and thus moderate the risk of avulsion where they are present. Road
20 R2 Resource Consultants, Inc. December 30, /MM101: Lower Skykomish River Geomorphic Analysis Page 20 crossings were identified from aerial imagery. Paved roads were considered to be more resistant and more likely to be protected during floods, and thus were assigned a greater mitigative factor. Bank Hardening: The presence of bank hardening can retard avulsion if the river does not erode around the structure and it is designed and built to counter the potential for undermining at the bank toe. Risk needs to be evaluated on a case-by-case basis, however, where type of structure (i.e., rip rap or LWD), condition of the structure, distance from the upstream and downstream ends of the structure to a floodplain swale, and respective structure end point and swale elevation differences can either be a mitigating factor or not substantially affect avulsion risk depending on the particulars of the site. For that reason bank hardening was not explicitly included as a factor in this reach-scale avulsion risk analysis. An existing SWM survey of bank modifications was available for providing context when interpreting the results, however Joint Avulsion Risk Factors The factors above were considered for ways to combine them into a joint risk rating system. Weighting factors were conceived and assigned to ranges of each factor. It was decided to combine the flow level, slope, and soil erodibility factors into a weighted joint risk rating system, and apply vegetation and road characteristics as mitigating factors. Each pathway segment identified on the LiDAR topographic surface was rated accordingly, following the gradations and weightings proposed in Table 4. The joint avulsion risk was calculated for each segment as the sum of the weights assigned in Table 5 for return interval event at which the pathway may flow, pathway slope, and soil erodibility. The following joint risk classes were defined based on professional judgment: o Joint Risk Weight Sum >14 = Class 1 (Highest risk) o Joint Risk Weight Sum = = Class 2 o Joint Risk Weight Sum = 6-10 = Class 3 o Joint Risk Weight Sum <6 = Class 4 (lowest risk) The joint risk rating may be modified by subtracting weights for mitigating factors, with initial recommendations for weights given in Table 4. Alternatively, the mitigating factor ratings can be used on a case-by-case basis in consideration of greater site specific knowledge as to the relative importance each factor could play in mitigating joint avulsion risk.
21 R2 Resource Consultants, Inc. December 30, /MM101: Lower Skykomish River Geomorphic Analysis Page 21 Table 4. Parameter Summary of parameters used to assess relative avulsion risk, and the weights assigned to each parameter. Risk Factors: Criterion (weight) Flood Return Interval Causing Inundation >100 yr (1) 100 yr (3) 10 yr (6) 2 yr (9) Slope <0% (1) 0-1% (3) 1-3% (6) >3% (9) Soil Erodibility Class 3 (1) 2 (2) 1 (3) Potential Mitigating Factors: Vegetation Forested (-2) Non-Forested (0) Open Water (0) Road Crossing Paved (-3) Gravel (-1) Bank Hardening Across Pathway Rip Rap (-4) Large Wood (-2)
22 R2 Resource Consultants, Inc. December 30, /MM101: Lower Skykomish River Geomorphic Analysis Page Longitudinal Profiles 3. RESULTS The longitudinal profile of the Skykomish River is strongly concave upstream of the Sultan River and mostly uniform in gradient (S=0.0012) downstream to approximately RM 1.9 (Figure 3). The river bed gradient is substantially lower below RM 1.9 (S=0.0003), a reflection of the backwater effect from the confluence with the lower gradient Snoqualmie and Snohomish rivers. The predicted water surface elevation in the lowermost mile was steeper than upstream, but this reflected primarily the assumed downstream boundary condition for the water level and flow at the confluence. Thus, for purposes of this assessment, hydraulic predictions of flood levels upstream to approximately RM 1 are uncertain for purposes of assessing overall avulsion and sediment transport potentials. Review of the aerial photographs indicates a meandering river planform exists upstream of the BPA lines located near RM 9.7. The river planform downstream is represented by a straighter, channelized sub-reach to about RM 3.5 near the outlet of Haskell Slough, by a mildly sinuous channel between RM 3.5 and RM 1, and by a deltaic morphology in the lowermost mile (cf. Plate 1). Substrates in the reach generally fall into cobble and gravel size classes (Figure 4). In general, the grain size distribution indicates three sub-reaches that are consistent with the river planform breaks. Upstream of about RM 9.7, the grain size distribution is approximately constant and similar to the distribution upstream of the Sultan River (Figure 5). Bedload and high flows originating from the Sultan River do not appear to influence grain size distributions in the mainstem Skykomish River. Grain size distributions are either approximately constant or may be gradually coarsening in the downstream direction in the channelized sub-reach. Grain sizes become finer downstream of the outlet of Haskell Slough and more closely approximate grain size distributions upstream of the channelized subreach. Figure 5 also depicts the range of Chinook salmon and steelhead trout spawning habitat D 50 values reported by Kondolf and Wolman (1993) in their review. Substrates appear most suitable for Chinook salmon spawning in the sub-reaches upstream and downstream of the channelized sub-reach.
23 R2 Resource Consultants, Inc. December 30, /MM101: Lower Skykomish River Geomorphic Analysis Page Thalweg yr Flood WSE Elevation (ft, NAVD88) Bridge at Monroe Sultan River Wallace River Gold Bar SR2 (High Bridge) River Mile Thalweg 2-yr Flood WSE Regression Elevation (ft, NAVD88) Monroe S= Figure 3. S= River Mile Longitudinal elevation and gradient profiles of the Skykomish River from its confluence with the Snoqualmie and Snohomish rivers to upstream of Gold Bar (upper graph) and the lower reach extending upstream to the Sultan River (lower graph). The water surface elevation predicted for the 2-year flood is also depicted.
24 R2 Resource Consultants, Inc. December 30, /MM101: Lower Skykomish River Geomorphic Analysis Page D95 D84 D Boulder Cobble mm 200 Sultan R Haskell Slough Cobble Gravel River Mile Figure 4. Longitudinal trends in selected grain size distribution percentiles measured on depositional gravel bar surfaces in the Skykomish River upstream and downstream of the Sultan River. Data upstream of the Sultan River are presented from earlier analyses for a broader scale comparison of reach processes. Horizontal lines depict the approximate transition from gravel- to cobble- to boulder-sized stones.
25 R2 Resource Consultants, Inc. December 30, /MM101: Lower Skykomish River Geomorphic Analysis Page Gravel Bar Substrate D 50 (mm) Average D Haskell Slough BPA Powerline Sultan R Startup Levee Gold Bar River Mile Figure 5. Longitudinal trends in average D 50 on gravel bars in the main Skykomish River channel, and corresponding sub-reach breaks in distributions suggested by scatter in the pebble count data. The average values were used in the sediment transport modeling for each sub-reach below the Sultan River. The vertical bars indicate the range of D 50 values reported for suitable Chinook (outer clear bar) and steelhead (inner solid bar) spawning substrates by Kondolf and Wolman (1993). 3.2 Sediment Transport Modeling The HEC-RAS model was calibrated as closely as possible to the surveyed flood marks (Appendix A). Calibration errors were generally within +/- 0.5 ft and the resulting Manning s n values appeared consistent with values for other rivers presented in Barnes (1967) and Hicks and Mason (1998), and thus were reasonable for purposes of reach scale sediment transport budgeting. Table 5 summarizes the flows selected for modeling in the HEC-RAS and sediment transport analyses, and their modeled duration.
26 R2 Resource Consultants, Inc. December 30, /MM101: Lower Skykomish River Geomorphic Analysis Page 26 Table 5. HEC- RAS Profile Name Simulation flows modeled in HEC-RAS for the sediment transport analysis. Additional flow changes were modeled at a number of locations downstream of the Sultan River as described in Appendix A. Percent Exceedance Modeled Duration (days) At Gold Bar Gage (Station # ) Flow (cfs) Below Wallace River Below Sultan River PF PF PF PF PF PF PF (~2-yr flood) PF PF9 PF10 PF (~10-yr flood) (~25 year flood) (~50 yr flood) The HEC-RAS model resulted in extreme variation in predicted bedload volume gains and losses across adjacent analysis segments at eight locations. Smoothing using Equation (2) resulted in a more reasonable appearing plot of predicted bed elevation changes based on Parker s (1990) bedload transport equation (Figure 6). Plate 2 depicts the corresponding spatial variation in aggradation and degradation potentials in the Lower Skykomish River analysis reach. Upstreamdownstream patterns in variability of aggradation and degradation potential are generally consistent with the three sub-reach breaks identified above. Most of the meander planform subreach above about RM 9.7 is associated with equilibrium transport potential (Figure 6), suggesting bedload transport through the sub-reach is balanced with supply from upstream. This sub-reach appears to process coarse sediment downstream in a more uniform manner than elsewhere in the analysis reach. There is a large discontinuity in the vicinity of the sub-reach break located at about RM 9.7, with moderate variability in the channelized sub-reach downstream to the lower reach break located at about RM 3.5, in the vicinity of the downstream end of Haskell Slough. Downstream of Haskell Slough, the river exhibits the greatest variability and magnitude of upstream-downstream bedload transport rate imbalances.
27 R2 Resource Consultants, Inc. December 30, /MM101: Lower Skykomish River Geomorphic Analysis Page 27 Smoothed Sediment Transport Predictions Sultan R 4 edicted Potential Net Change in Mean Bed Elevation Upstream of Transect Location (ft/yr) Pr Haskell Slough BPA Powerline Segment Downstream Boundary River Mile Figure 6. Longitudinal variation in predicted potential bed elevation changes within analysis segments over a 50 year period, as determined by evaluation of HEC-RAS hydraulic modeling output using Parker s (1990) bedload transport equation. 3.3 Channel Migration Patterns The aerial photograph series provided a relatively periodic determination of channel location, with intervening periods associated with at least one large flood event occurring that exceeded the 2-year event level. The largest events occurred between the , , and photographs (Figure 7). The aerial photography mapping and LiDAR data indicate that areas of greatest channel migration in the analysis reach tend to be concentrated at a few locations, and appear to have translated in the downstream direction at most locations (Figure 8). Side channels have not tended to capture the mainstem flow at least since 1938, and have generally remained side channels with limited connectivity. Channel migration has been generally constrained within a moderately confined floodplain between the Sultan River and about RM 6, upstream of Monroe (Plate 3, also see avulsion channel mapping results below). There is evidence of limited
28 R2 Resource Consultants, Inc. December 30, /MM101: Lower Skykomish River Geomorphic Analysis Page 28 meander migration occurring between 1938 and 1965 within the meander planform sub-reach above RM 9.7, and little to none after that (Plate 3). Downstream to about RM 2.5, channel migration has been relatively restricted by the settlement of Monroe and by bank armoring and resulting channelization (Plate 4). However, there has been considerable planform instability in the vicinity of the old railroad bridge locations in segments 44 and 45 (Figure 8). Removal of the bridge piers may be associated with significant readjustment in the future in these analysis segments. Downstream of RM 2.5, there is a broader distribution of relict channels over the floodplain compared with upstream (see avulsion channel mapping results), yet channel migration has remained limited there as well (Plate 3). It appears that riprap is preventing channel migration from occurring in most of this sub-reach (Plate 4). Accordingly, channel planform instability appears manifest in most of the analysis reach through primarily local channel braiding, for example at analysis segments 31 and 32 (Figure 8). These two segments are located along the upstream side of a sharp bend in the channelized sub-reach (cf. Plate 1) and are confined artificially by riprap that has been placed along both banks. This is a location where deposition and erosion of sediments appears to occur frequently and rapidly over the short term, forcing the main channel thalweg to migrate actively between the armored right and left banks (Plate 4). Over the long term, erosion and deposition appear to be more balanced in these two segments (Plate 2). A similar but likely smaller tendency appears in the migration rate data in the vicinity of analysis segments 39 and 40, which are confined by riprap along the outside bend. 3.4 Gravel/Sand Bar Storage and Side Channel Area Trends Figure 9 depicts cumulative plots of active gravel/sand bar and side channel areas, adjusted to a common flow level, for the various years of aerial photography analyzed. The vertical differences between curves to some extent reflects the time between the previous large flood event and the date the photographs were taken (shorter time interval greater amount of deposit surface area that has not become vegetated yet), error in interpreting older aerial photographs (2003 and later photographs were in color; older photographs were lower resolution black and white), and error in adjusting gravel bar areas to a common flow rate.
29 R2 Resource Consultants, Inc. December 30, /MM101: Lower Skykomish River Geomorphic Analysis Page Annual Peak Discharge (cfs) Oct-37 Oct-42 Oct-47 Oct-52 Oct-57 Oct-62 Oct-67 Oct-72 Oct-77 Oct-82 Oct-87 Oct-92 Oct-97 Oct-02 Oct-07 Figure 7. Annual peak flow time series encompassing the aerial photography date range, for the USGS gage Skykomish River near Gold Bar (Station # ). Dates when each set of aerial photographs were taken are indicated by the dashed vertical lines.
30 R2 Resource Consultants, Inc. December 30, /MM101: Lower Skykomish River Geomorphic Analysis Page 30 Analysis Segment Downstream Boundary RM Planform Instability Index Calculated From Aerial Photography Series Meander Planform Sub Reach Channelized Planform Sub Reach Below Haskell Slough Figure 8. Spatial and temporal variation in channel migration tendencies within analysis segments of the Skykomish River below the Sultan River, as indicated by successive series of ortho-corrected and geo-referenced aerial photographs. Planform change index values are described in Table 3. Arrows indicate possible upstream/downstream shifts in location of zones of greater channel change over the aerial photographic record.
31 R2 Resource Consultants, Inc /MM101: Lower Skykomish River Geomorphic Analysis December 30, 2010 Page 31 12,000,000 Main Channel 10,000, Cumulative Area of Active Gravel Bar (ft2) ,000, ,000,000 4,000,000 2,000, Analysis River Mile 3,000,000 Side Channel 2,500, Cumulative Active Side Channel Area (ft2) ,000, ,500,000 1,000, , Analysis River Mile Figure 9. Cumulative active gravel/sand area mapping results for all years that aerial photography was digitized. Results are presented separately for exposed gravel areas occurring in the main channel (top graph) and total area of active side channels (bottom). The locations of the HEC-RAS transects are indicated by the dashed vertical lines.
32 R2 Resource Consultants, Inc. December 30, /MM101: Lower Skykomish River Geomorphic Analysis Page 32 Nonetheless, useful information may be derived from the data depicted in Figure 9 based on the following observations: For analysis segments where successive year s curves are approximately parallel, it may be inferred that there was probably negligible change in gravel bar storage volumes or side channel areas between the two years photographed. In other locations, the slopes of the plots differ notably, where main channel storage volumes and side channel areas either appear to have decreased or increased between successive photograph years. The rate of change in curves between successive aerial photographs may be calculated as a change in average width of active gravel/sand bar or side channel area. Segments with substantial changes in average main channel gravel bar width, and thus storage of material readily available for bedload transport, are depicted for each pair of successive photographs in Figure 10, in a format similar to that presented in Figure 8 for the channel migration results. Figure 10 represents substantial changes in gravel/sand bar area, where changes between successive photographs exceed approximately +/- 130ft. The results indicate that while gravel appears to be distributed relatively uniformly along the length of the main channel, most active gravel bar storage changes occur in the meandering planform sub-reach and in the sub-reach below Haskell Slough. In addition, this trend appears to have strengthened over time, with temporally increasingly stability evident in the central portion of the channelized sub-reach. The channelized sub-reach contains little to no side channel habitat. Most side channel habitat occurs above RM 10 and below RM Avulsion Risk Plates 5-7 depict the individual avulsion risk factor ratings for each delineated pathway segment. Plate 8 depicts the joint avulsion risk rating based on flow level, slope, and soil erodibility. Plates 9 and 10 depict the ratings for the vegetation and road mitigating factors. The individual and joint ratings represent relative risks amongst all potential flow paths based on physical characteristics known to affect the likelihood of avulsion. These risk ratings cannot be used to predict exactly where the channel will move during future storm events, but can be used to prioritize alternatives to reduce the risk of failure, or of potential impacts to property and infrastructure.
33 R2 Resource Consultants, Inc. December 30, /MM101: Lower Skykomish River Geomorphic Analysis Page 33 Meander Planform Sub Reach Channelized Planform Sub Reach Below Haskell Slough Main Channel Analysis Downstream Segment Boundary RM Segments With Significant Changes in Gravel Bar Area Between Successive Aerial Photograph Series (average equivalent bar width change > +/ 130ft) Figure 10. Spatial and temporal variation in active gravel/sand bar storage areas within the main channel for analysis segments of the lower Skykomish River, as indicated by successive series of geo-referenced aerial photographs. Change is represented as a substantial gain (+) or loss (--) in mean width of non-vegetated bar surface in excess of +/- 130 ft.
34 R2 Resource Consultants, Inc. December 30, /MM101: Lower Skykomish River Geomorphic Analysis Page 34 The results depicted in Plates 5-10 are based on LiDAR data collected in 2003 and hydraulic data collected in Specific ratings may change in the future depending on flooding and future channel migration. It is not feasible to update the ratings each year after flooding because of the expense, however the ratings resulting from this analysis can still be used to assess general risk as described below, and provide an indication of relative differences in avulsion potential for possibly the next 10+ years. In general, there appear to be many potential pathways evident in the topographic data with medium to high risk of avulsion distributed across the analysis reach floodplain (Plate 8). Most of the highest joint risk pathway segments (Class 1) are connected downstream of moderate joint risk pathway segments (Class 2), suggesting that the most likely mechanism for avulsion would be through upstream propagation of head cuts starting in Class 1 segments, assuming other factors do not mitigate for risk. It is notable that while the LiDAR data indicate the presence of potential avulsion pathways over broad portions of the floodplain surface, the channel migration traces in Plate 3 suggest that they rarely if ever pose a substantial avulsion risk overall. Class 2 segments are more typically associated with inundation at the 10 year flood level, and include the majority of Haskell Slough. Class 3 segments would become higher risk segments likely only after the river avulses through upstream Class 1 or 2 segments. Most Class 3 segments are located well away from the main channel. Riley Slough is one such channel, and appears to be associated with minimal risk of avulsion.
35 R2 Resource Consultants, Inc. December 30, /MM101: Lower Skykomish River Geomorphic Analysis Page SYNOPSIS OF ANALYSIS RESULTS AND SELECTION OF CONCEPTUAL PROJECTS The following general patterns are indicated by the analysis results. The features indicated lead to river and fish habitat restoration projects that vary across the four primary geomorphic reaches identified, reflecting characteristic river processes and erosion/deposition risks observed at the reach scale. 4.1 Summary of Large Scale Variation in Reach Geomorphic Characteristics Four geomorphic sub-reaches are identified that are defined by three breaks in longitudinal trends for the following physical attributes: ~RM 9.7, above the BPA powerlines: Change from meander planform tendency upstream to channelized sub-reach downstream Channel migration: distributed over more analysis segments upstream, limited to two highly concentrated locations downstream Side channels: more prominent, persistent, and connected to mainstem upstream Aggradation/degradation potential: General equilibrium transport conditions prevail upstream, greater variation downstream Degree of reworking of active gravel bars in main channel: Greater upstream, limited downstream Grain size distribution: Upstream similar to above Sultan River, coarser downstream in channelized sub-reach ~RM 3.5, at the exit of Haskell Slough: Grain size distribution: downstream similar to above RM 9.7, finer than upstream Aggradation/degradation potential: Greater variation downstream Number and degree of reworking of gravel bars: Greater downstream, limited upstream Floodplain and side channel connectivity appears to be more artificially confined downstream ~RM 1-2, Transition to Delta Morphology: Reduced slope downstream of RM 2 reflecting backwater effect from confluence with Snoqualmie and Snohomish rivers Number and size of gravel bars: Larger and more braided downstream of RM 1
36 R2 Resource Consultants, Inc. December 30, /MM101: Lower Skykomish River Geomorphic Analysis Page 36 Confinement: Less downstream of RM Potential Restoration Projects Four general types of restoration projects are identified here along with the locations where they would be consistent with natural processes and the Snohomish River Recovery Plan (Plate 11) Channel Migration/Side Channel Connectivity Projects Channel migration and side channel connectivity could be effected for the purpose of enhancing or restoring juvenile salmonid side channel habitat. However, much of the river is artificially constrained by riprap (cf. Plate 4) which has precluded channel migration in many locations where reach-scale morphology and sediment transport conditions would otherwise facilitate the process. There are two ways in which migration could be (re)induced: (i) removal of riprap and (ii) construction of instream wood structures (flood fence or log jams). Riprap removal would allow the channel to reconnect with side channels and the floodplain more generally and allow meandering processes to return to more natural patterns. Construction of in-channel wood would create local hard points and instream roughness that could induce local bar deposition and migration of the thalweg in the direction of the opposite bank, or force channel splits depending on structure placement location and size. Suitable sites for riprap removal would be upstream of ~RM 9.7 and downstream of Haskell Slough (~RM 3.5), subject to evaluation of avulsion potential using Plates 4-9 and landowner willingness to reengage floodplain channels. Within these sub-reaches, the river meandered historically and side channels are more prominent. Between RM , the river may be too channelized and side channels too limited in presence for small scale riprap removal to have much effect on channel form, although a few opportunities may exist to selectively reengage side channels combined with floodplain protection and riparian restoration measures such as flood fencing. Riprap removal in the channelized sub-reach should be at locations where upstreamdownstream sediment transport rate imbalances between adjacent analysis segments are calculated to be minor to negligible (classes 3-5, Table 2) to minimize potential for significant relocation of the mainstem channel. Suitable sites for in-channel structures would be located where there are large upstreamdownstream sediment transport rate imbalances and a strong aggradation tendency such that a structure could be constructed to facilitate local deposition and set up conditions favoring channel migration away from the deposition location, or split the flow and increase flood flow in a perched side channel. In addition, there should be a relatively high avulsion risk into the
37 R2 Resource Consultants, Inc. December 30, /MM101: Lower Skykomish River Geomorphic Analysis Page 37 channel (i.e., it should be engaged preferentially at the 2 year flood), which are likely to be locations deemed most feasible according to land ownership and farmland preservation goals. For riprap removal, the following analysis segments have reach scale conditions favoring controlled reconnection with side channels that could potentially provide habitat subject to landowner concurrence, additional restoration measures improving connectivity and riparian conditions, and/or implementation of suitable grade controls where needed to control avulsion risk: - Segment 6 - Segment 17 - Segment 31 - Segment 38 (Haskell Slough) - Segment 56 For instream structures, the following analysis segments potentially have reach scale conditions favoring structures inducing channel splits, including a locally aggradational setting and existing perched side channels that could lead to longer term restored side channel habitat: - Segment 21 (for right bank channel) - Segment 44 - Segment 51 - Segment 57 - Segment 62 Segments 7 and 11 also feature heads of perched side channels but are associated with a neutral aggradation/degradation tendency, thus the effectiveness of constructing structures to engage the side channels is less certain Instream Habitat Complexity Projects The recovery plan indicates the need for side channel habitat complexity for juvenile salmonids. Structures providing cover should be located in relatively persistent and prominent side channels that are in contact with groundwater and potentially even flowing during the summer. The heads of such channels should be located in analysis segments with relatively neutral aggradation/ degradation tendency so that the effective lifespan of the structures is maximized. In addition, avulsion potential should be relatively low in the vicinity of each structure where private
38 R2 Resource Consultants, Inc. December 30, /MM101: Lower Skykomish River Geomorphic Analysis Page 38 property concerns exist. Accordingly, the geomorphic analysis results are interpreted to suggest the following suitable locations: - Groeneveld Slough (Segments 3-7) - Segments 12-16, right channel - Haskell Slough (if reconnected with mainstem through riprap removal) Mainstem Spawning Habitat Gravels are most suitable for Chinook salmon spawning in the mainstem upstream of ~RM 9.7 and downstream of Haskell Slough (~RM 3.5). Given the relatively confined nature of the river and abundant gravel at various locations, no measures are suggested at this time to physically increase the quantity and quality of spawning gravel. However, given the general paucity of instream habitat structure, construction of smaller log structures or boulder fields could provide cover near suitable spawning locations. Suitability for such instream structures would be highest in the sub-reaches noted above where grain sizes are most suitable for Chinook spawning, in analysis segments where aggradation/degradation potential is generally neutral and where spawning surveys indicate most extensive use. The meandering planform sub-reach upstream of ~RM 9.7 appears to be most appropriate. The results from this analysis can be compared accordingly with redd surveys to identify suitable locations Maintain Island Splits A persistent island/split channel morphology is limited in the lower Skykomish River in part because of the relatively channelized and trained nature of most of the river. This morphologic unit type provides habitat diversity, especially during high flow and it appears beneficial to fish to preserve islands where they exist. This can be accomplished by constructing apex jams at the upstream end of islands, subject to the constraint that the locations are not associated with a strong degradation or aggradation tendency where, respectively, the structure might fail or private land might become affected by increased flooding. Two locations identified in the analysis reach generally meet these criteria and may be suitable for this type of project. Jams or flood fence structures could be placed specifically at the following locations: - Segment 11 - Segment Level of Confidence in Analysis and Results The longitudinal profiles of channel gradient, grain size, sediment transport analysis predictions of aggradation/degradation potential, flow depth channel migration rates, and size and extent of
39 R2 Resource Consultants, Inc. December 30, /MM101: Lower Skykomish River Geomorphic Analysis Page 39 side channel changes over time, all consistently point to the five geomorphic sub-reaches outlined above. More site specific analysis and design will be required to evaluate erosion risk for specific projects and management actions, but the results presented here provide a quantitative estimate of reach scale hydraulic and erosion processes that will affect general suitability of specific measures. The information can be used to infer relative risk associated with different restoration activities (e.g., channel and floodplain connectivity, instream/bank stabilization structures, channel migration training, and bank revetment removal), with respect to whether projects would work against or with natural sedimentation and channel forming processes. The level of uncertainty about each individual analysis varies depending on the type of data, and can be inferred in many cases from the scatter of data depicted in the graphs above. Specific cases are identified below: The flood level and sediment transport predictions should not be used to precisely delineate lateral flood extents and predict actual bed elevation changes. Limited field surveyed flood level data were used to calibrate the HEC-RAS model that involved approximately bankfull flood levels. Overbank flows were not calibrated. Typical sediment transport rate prediction errors range within an order of magnitude. However, the relative differences in sediment transport potential predicted for successive transects should be preserved and not meaningfully affect the results presented in Figure 8, or erosion risk determinations based on those results. The river has changed course variably at different locations since the LiDAR data were collected; all channel planform, flood level estimation, and sediment transport predictions are presented here based on earlier topography. The 2007 aerial photographs and 2003 LiDAR and 2007 channel elevation data are among the most recent physical data available (2009 photographs are now available at time of writing). It does not appear feasible to redo the analyses reported here every time the channel moves, but the general trends seen here at the sub-reach scale should be preserved in the foreseeable future, possibly within the next years. The channel migration traces are generally accurate for the main channel and major side channels. Smaller side channels not visible in the aerial photographs were delineated as part of the avulsion risk analysis using the LiDAR data. The collective digitized channel traces for the present and avulsion risk analyses should provide for a reasonable delineation of the channel migration zone.
40 R2 Resource Consultants, Inc. December 30, /MM101: Lower Skykomish River Geomorphic Analysis Page REFERENCES Barnes, H.H Roughness characteristics of natural channels. USGS Water Supply Paper DeVries, P Scour in Low Gradient Gravel Bed Streams: Patterns, Processes, and Implications for the Survival of Salmonid Embryos. Ph.D. dissertation, University of Washington, Seattle, Washington. Hicks, D.M., and P.D. Mason Roughness characteristics of New Zealand rivers. Water Resources Publications LLC, Englewood Colorado. Kondolf, G.M Some Suggested Guidelines for Geomorphic Aspects of Anadromous Salmonid Habitat Restoration Proposals. Restoration Ecology 8(1): Kondolf, G.M., and M.G Wolman The Sizes of Salmonid Spawning Gravels. Water Resources Research 29: Kondolf, G.M., M.W. Smeltzer, and S.F. Railsback Design and Performance of a Channel Reconstruction Project in a Coastal California Gravel-Bed Stream. Environmental Management 28(6): Northwest Hydraulic Consultants (nhc) Hydrology for Upper Skykomish River Flood Insurance Re-Study, Snohomish County, Washington. Technical memorandum prepared for SWM by A. Ball and L. Karpack, October 27. Parker, G Surface-Based Bedload Transport Relation for Gravel Rivers. Journal of Hydraulic Research 28: Rapp, C.F., and T.B. Abbe A Framework for Delineating Channel Migration Zones. Washington State Department of Ecology, Final Draft Publication # Olympia, Washington. Wissmar, R.C, and R.L. Beschta Restoration and Management of Riparian Ecosystems: A Catchment Perspective. Freshwater Biology 40:
41 APPENDIX A Summary of Hydraulic Calibration
42 (1) Introduction This appendix summarizes hydraulic modeling of the Skykomish River. The model reach extended from the confluence with the Snoqualmie River (RM 0) to RM Figure 1 shows the longitudinal channel thalweg profile of the study reach. The lower section where RM<15.7 (below the Wallace River mouth) has a mild channel slope of S o =0.12%, the upper part from RM>22.9 (above the High Bridge) has a relatively steep slope of 0.69%. The middle section of the river has a channel slope of 0.26%. (2) Hydraulic Models There were two HEC-RAS models developed by R2 and NHC. The NHC model extended from RM 0.0 (Snoqualmie River confluence) to RM 22. The R2 model extended from RM 9.7 to RM The NHC model had been previously calibrated up to about RM 9.7. The R2 model was calibrated to high water marks (HWMs) surveyed for floods occurring in 1990, 2006, and Table 1 lists the flows of each of the floods at three different locations on the Skykomish River, including the USGS gage near Gold Bar (# ), below the Wallace River, and below the Sultan River. Figure 2 depicts the Manning s n coefficient of the calibrated R2 model along the main channel for the three flood flows. The HWMs of 1990 and 2006 floods were calibrated together using the same channel roughness because their flows were similar, while the 2008 flood was calibrated in a separate model, as shown in Figure 2. Table 2 summarizes the model calibration results for the three floods. The calibration errors are equal to the calibrated WSE minus the HWM elevation. For the majority of HWMs, the calibration errors are well within 0.5 ft, the error permitted by FEMA (Federal Emergency Management Agency). However, a few points have errors greater than 2 ft. Those points were considered outliers and excluded from model calibration because their WSEs were hydraulically impossible to achieve with reasonable channel roughness and the existing geometry setup. The HWMs and simulated WSEs of 1990/2006 floods are plotted in Figure 3.1 through Figure 3.5, and 2008 flood simulation results are plotted in Figure 4.1 through Figure 4.5. The NHC model was calibrated previously up to about RM 9.7. The two HEC-RAS models were merged, where NHC cross-sections were used below RM 9.7 and R2 cross-sections above RM 9.7. (3) Estimate of Flow in Sloughs and Overtopping Levees The NHC model was originally developed for unsteady flow simulation and the geometry of the model configuration had to be modified to facilitate steady flow simulations as part of the geomorphic sediment transport analysis. Haskell and Riley sloughs were removed from the A-1
43 model geometry and replaced with corresponding flow change locations. In addition to the sloughs, water was also modeled to leave or enter the Skykomish River by overtopping levees during floods. To quantify the flows in the sloughs and/or overtopping the levees during high flows, the original NHC unsteady model was employed to simulate the hydraulics of the 1975, 1980, 1986, and 1990 storms. The storm hydrographs and boundary conditions were derived from the accompanying DSS files of the NHC model. The simulated hydrographs of the four storms at different locations along the Skykomish River were analyzed to determine the flow change relationship under various high flow conditions due to the presence of sloughs and levees. A total of 8 locations were selected estimate flow changes, including just u/s of Riley Slough (RM 6.5), just u/s of Haskell Slough (RM 6.01), Monroe (RM 4.85), SR-203 Bridge (RM 3.96), just below where Haskell Slough returns (RM 3.09), RM 2.07, RM 0.92, and RM Those locations were set as flow change points in the mainstem, with outflows to sloughs and levee overtopping, and inflows from slough outlets. Figure 5.1 through Figure 5.4 show the simulated hydrographs at those locations for each of the four storms. Table 3.1 through Table 3.4 list the flows read off from Figure 5.1 through Figure 5.4, respectively, and each table summarizes the flows at different times from the beginning of each storm. Figure 6.1 through Figure 6.4 plot the flow variations for Table 3.1 through Table 3.4, respectively. In order to compare the same flow starting from below the Sultan River and varying in the downstream direction, the analysis needed to take average water particle travel time into account. Travel time from the confluence with the Sultan River (RM 13.07) to Riley Slough (RM 6.50) was estimated to be about two hours, and an additional 1 hour from Riley slough to the outlet of Haskell Slough. For simplicity, two hours of travel time (relative to Sultan River confluence at RM 13.07) was applied to the river reach between RM 6.5 and RM 3.09, and three hours of travel time was applied for the locations below RM The flow variations in Table 3.1 through Table 3.4 were then converted to percent of flow change with respect to the discharge of the upstream flow changing locations. The results are summarized in the Table 4.1 through Table 4.4, in which Column 1 and Column 2 are, respectively, the time and the starting flow below the Sultan River (RM 13.07) directly from the NHC model output. Column 3 is percent of flow change above Riley Slough (RM 6.5) relative to flow below the Sultan River. Column 4 is the percent of flow leaving Skykomish River into Riley Slough relative to the flow below the Sultan River. Column 5 is the percent of flow entering Haskell Slough (RM 6.01) relative to the flow just upstream. Column 6 is the percent of flow leaving Skykomish River between Monroe (RM 4.85) and SR-203 Bridge (RM 3.96) A-2
44 relative to the flow at Monroe. Column 7 is the percent of flow returning from Haskell Slough (RM 3.09) relative to the flow at the SR-203 bridge. Column 8 is the percent of flow leaving Skykomish River between RM 3.09 and RM 2.07 relative to the flow just below where Haskell Slough flow returns. Column 9 is the percent of flow leaving the Skykomish River between RM 0.92 and RM 2.08 relative to the flow at RM Column 10 is the percent of flow leaving the Skykomish River between RM 0.92 and RM 0.16 relative to the flow at RM Figure 7.1 through Figure7.8 plot the percentages in Table 4 versus flow below the Sultan River. Each of the eight plots in Figure 7 contains the percentages from Table 4.1 through Table 4.4 for each of the four storms. A composite regression line was fit to the percentage data in each plot to describe first-order variation in the percent change. Figure 7.1 plots the percent of flow increase between the Sultan River and Riley Slough (Column 2 in Table 2) and the plot shows little correlation among the points, with the majority of points falling within ±4%. Because no significant tributaries or distributaries exist between the Sultan River and Riley Slough, it was assumed that the flows at these two locations would be approximately the same and 0% was assigned for all flows, as shown in the figure. Figure 7.2 plots the percentage of flow entering Riley Slough (Column 3 in Table 2), and the graph shows that the percentage generally increases with increasing flow in the Skykomish River. A composite curve P was developed to fit the percentage data for the entire range of flows, per the following equations: (1) Q 30,000cfs: P=0% (2) 30,000cfs Q 100,000cfs: P=3%*(Q-30,000)/70,000 (3) Q 100,000cfs: P=3%+5%*(Q-100,000)/40,000 Figure 7.3 plots the percentage of flow entering Haskell slough (Column 4 in Table 2), and the plot shows the percentage generally increases with increasing flow in the Skykomish River. A composite curve P was developed to fit the percent data, per the following equations: (1) Q 8,000cfs: P=0% (2) 8,000cfs Q 40,000cfs: P=11%*(Q-8,000)/32,000 (3) Q 40,000cfs: P=11%+13%*(Q-40,000)/100,000 Figure 7.4 plots the percentage of flow leaving the Skykomish River between Monroe and the SR-203 bridge (Column 5 in Table 2). The plot shows the percentage generally decreases with increasing flow in the Skykomish River. A negative percent value indicates more flow is A-3
45 entering than leaving the Skykomish River between Monroe and SR-203 Bridge. A composite curve P was developed to fit the percent data, per the following equations: (1) Q 8,000cfs: P=0% (2) 8,000cfs Q 24,000cfs: P=6%*(Q-8,000)/16,000 (3) 24,000cfs Q 80,000cfs: P=6% (4) Q 80,000cfs: P=6%-19%*(Q-80,000)/60,000 Figure 7.5 plots the percent of flow returning from Haskell Slough (Column 6 in Table 2), and the plot shows the percentage generally increases with increasing flow in the Skykomish River. A composite curve P was developed to fit the percent data, per the following equations: (1) Q 12,000cfs: P=0% (2) 12,000cfs Q 52,000cfs: P=5%+16%*(Q-12,000)/40,000 (3) 48,000cfs Q 100,000cfs: P=21% (4) Q 100,000cfs: P=21%+14%*(Q-100,000)/40,000 Figure 7.6 plots the percentage of flow leaving the Skykomish River between RM 3.09 and RM 2.07 (Column 7 in Table 2), and the plot shows the percentage generally increases with increasing flow in the Skykomish River. The percent values are always positive, suggesting there are generally more flows leaving than entering the Skykomish River within this reach during high flows. A composite curve P was developed to fit the percent data, per the following equations: (1) Q 12,000cfs: P=0% (2) 12,000cfs Q 80,000cfs: P=20%*(Q-12,000)/68,000 (3) Q 80,000cfs: P=20%+5%*(Q-80,000)/40,000 Figure 7.7 plots the percentage of flow leaving the Skykomish River between RM 0.92 and RM 2.08 (Column 8 in Table 2), and the plot shows the percentage increases with flows less than 40,000 cfs, and decreased with increasing flows greater than 100,000cfs. The percentage is always positive, suggesting the flows are generally leaving the Skykomish River within this reach during high flows. A composite curve P was developed to fit the percent data, per the following equations: (1) Q 8,000cfs: P=0% (2) 8,000cfs Q 40,000cfs: P=2%+54%*(Q-8,000)/32,000 (3) 40,000cfs Q 100,000cfs: P=56% (4) Q 100,000cfs: P=56%-36%*(Q-100,000)/40,000 A-4
46 Figure 7.8 plots the percentage of flow leaving the Skykomish River between RM 0.92 and RM 0.16 (Column 9 in Table 2), and the plot shows the percentage generally decreases with increasing flows in the Skykomish River. The percentage values are mostly negative, suggesting the Skykomish River receives flows from the Snoqualmie River during high flows. A composite curve P was developed to fit the percent data, per the following equations: (1) Q 12,000cfs: P=0% (2) 12,000cfs Q 20,000cfs: P=5%*(Q-12,000)/8,000 (3) 20,000cfs Q 40,000cfs: P=5% (4) 40,000cfs Q 80,000cfs: P=5%-37%*(Q-40,000)/40,000 (3) Q 80,000cfs: P=-32% (4) Estimating Sediment Transport Simulation Flows After the percentage of flow change at each of the 8 locations was determined, flows at those locations could be estimated for any given steady flow level. Eleven simulation flows were modeled for the sediment transport analysis ranging from the 5% exceedance flow to the 50-yr return period flood at Gold Bar, as listed in Table 5. Also listed are the flows below the Wallace and Sultan rivers (see nhc 2008 hydrology memo). Table 6 summarizes the estimated flows at each of the selected locations on the Skykomish River, after applying the equations above in Figure 7.1 through Figure 7.8. Figure 8 graphically shows the flows along the Skykomish River for the 11 simulation flows in Table 6. Table 1: Flows for the 1990, 2006, and 2008 floods Flow (cfs) Location Nov 1990 Flood Nov 2006 Flood Nov 2008 Flood Skykomish River near Gold Bar Skykomish River below Wallace River Skykomish River below Sultan River A-5
47 Table 2. Hydraulic calibration summary for the HWMs of 1990, 2006, and 2008 floods River Distance Flood HWM Numbering (ft) (RM) 1990 Flood 2006 Flood 2008 Flood HWM Elev (ft) Modeled WSE Calib Error (ft) A-6
48 Table 3.1 Simulated flows (cfs) of Nov, 1975 flood at different locations on the Skykomish River where flows are changed due to sloughs and/or levees. Estimated travel times from Sultan River to each location are also indicated. Location below Sultan R. u/s of Riley u/s of Haskel at Monroe at SR-203 Bridge below Haskel RM-2 RM-1 RM-0 Travel Time + 0 hr + 2 hr + 2 hr + 2 hr + 2 hr + 3 hr + 3 hr + 3 hr + 3 hr Time RM RM 6.5 RM 6.01 RM 4.85 RM 3.96 RM 3.09 RM 2.07 RM 0.92 RM /30/ :00 3,078 2,209 2,126 1,989 2,393 2,818 2,668 2,513 2,403 12/1/1975 0:00 15,240 15,349 15,253 14,475 14,013 15,291 15,028 12,419 12,179 12/1/ :00 33,969 33,107 32,971 29,580 27,425 32,907 31,780 15,842 15,153 12/2/1975 0:00 53,760 53,489 53,287 46,632 44,094 53,694 47,608 21,561 25,166 12/2/1975 4:00 68,243 66,735 66,018 56,237 53,278 66,517 55,419 25,715 32,712 12/2/1975 8:00 88,580 88,026 86,856 72,114 70,922 85,964 68,576 35,578 47,790 12/2/ :00 102, ,773 98,169 80,118 81,692 97,222 75,765 50,841 67,592 12/2/ :00 80,626 82,380 82,260 69,325 70,958 82,527 64,839 68,991 90,186 12/3/1975 5:00 97,324 97,895 95,926 78,799 81,243 95,660 71,406 79, ,109 12/4/1975 0:00 74,509 75,718 75,676 64,225 64,784 76,197 58,215 76,895 99,549 12/4/1975 8:00 87,218 88,035 87,385 72,931 74,325 87,378 65,767 76,526 98,560 12/5/1975 0:00 40,072 42,341 42,559 38,243 37,375 43,432 38,826 54,256 74,287 A-7
49 Table 3.2 Simulated flows (cfs) of Dec, 1980 flood at different locations on the Skykomish River where flows are changed due to sloughs and/or levees. Estimated travel times from Sultan River to each location are also indicated. Location below Sultan R. u/s of Riley u/s of Haskel at Monroe at SR-203 Bridge below Haskel RM-2 RM-1 RM-0 Travel Time + 0 hr + 2 hr + 2 hr + 2 hr + 2 hr + 3 hr + 3 hr + 3 hr + 3 hr Time / RM RM RM 6.5 RM 6.01 RM 4.85 RM 3.96 RM 3.09 RM 2.07 RM 0.92 RM /23/1980 1:00 14,127 14,386 14,419 14,126 13,777 14,591 14,684 12,251 12,361 12/23/1980 8:00 12,411 12,726 12,740 12,535 12,384 13,196 13,234 11,467 11,595 12/23/1980 9:00 12,278 12,589 12,601 12,405 12,268 13,080 13,113 11,400 11,515 12/23/ :00 12,044 12,364 12,374 12,195 12,074 12,862 12,892 11,278 11,378 12/23/ :00 11,866 12,179 12,186 12,020 11,896 12,679 12,705 11,166 11,244 12/24/1980 0:00 13,311 13,739 13,701 13,276 13,303 14,323 14,229 12,033 11,960 12/24/ :00 35,706 35,295 35,177 31,386 29,506 35,745 34,099 15,988 15,681 12/25/1980 0:00 43,032 42,670 42,350 37,271 35,547 44,185 40,349 18,732 19,168 12/25/1980 2:00 52,804 51,132 50,475 43,669 41,369 52,710 46,104 20,343 21,911 12/25/1980 5:00 74,851 72,491 71,307 59,782 57,071 72,359 58,835 24,693 29,896 12/25/1980 7:00 90,131 89,546 87,621 72,054 70,299 87,965 69,076 28,479 36,831 12/25/ :00 113, , ,449 84,968 88, ,941 81,494 38,899 51,826 A-8
50 Table 3.3 Simulated flows (cfs) of Nov, 1986 flood at different locations on the Skykomish River where flows are changed due to sloughs and/or levees. Estimated travel times from Sultan River to each location are also indicated. Location below Sultan R. u/s of Riley u/s of Haskel at Monroe at SR-203 Bridge below Haskel RM-2 RM-1 RM-0 Travel Time + 0 hr + 2 hr + 2 hr + 2 hr + 2 hr + 3 hr + 3 hr + 3 hr + 3 hr Time / RM RM RM 6.5 RM 6.01 RM 4.85 RM 3.96 RM 3.09 RM 2.07 RM 0.92 RM /20/1986 1:00 9,237 9,457 9,458 9,420 9,942 10,531 10,456 9,619 9,582 11/20/1986 8:00 19,216 19,107 18,609 16,778 16,422 20,199 19,022 13,937 12,514 11/20/ :00 29,717 28,473 28,170 24,798 23,247 27,857 26,117 16,319 15,523 11/20/ :00 38,990 38,778 38,682 34,475 32,537 38,999 36,796 16,840 15,975 11/21/1986 0:00 25,827 26,884 26,974 25,124 24,381 27,924 28,252 15,668 16,227 11/22/1986 0:00 14,455 14,904 14,932 14,562 14,401 15,264 15,342 13,112 13,221 11/23/1986 0:00 12,161 12,401 12,396 12,187 11,972 12,793 12,781 11,200 11,237 11/23/ :00 39,387 38,072 37,742 33,168 31,425 38,921 35,919 16,050 14,893 11/23/ :00 63,610 61,081 59,855 50,742 47,691 62,202 51,990 20,648 21,883 11/23/ :00 81,848 79,798 78,318 64,908 62,317 79,233 63,169 24,571 29,347 11/23/ :00 93,929 94,458 92,888 76,693 79,077 94,126 73,859 30,461 40,441 11/24/ :00 40,504 43,851 44,128 39,562 39,888 45,966 40,209 58,389 78,453 A-9
51 Table 3.4 Simulated flows (cfs) of Nov, 1990 flood at different locations on the Skykomish River where flows are changed due to sloughs and/or levees. Estimated travel times from Sultan River to each location are also indicated. Location below Sultan R. u/s of Riley u/s of Haskel at Monroe at SR-203 Bridge below Haskel RM-2 RM-1 RM-0 Travel Time + 0 hr + 2 hr + 2 hr + 2 hr + 2 hr + 3 hr + 3 hr + 3 hr + 3 hr Time / RM RM RM 6.5 RM 6.01 RM 4.85 RM 3.96 RM 3.09 RM 2.07 RM 0.92 RM /22/1990 1:00 7,043 7,142 7,118 7,032 7,126 7,491 7,410 7,014 6,980 11/22/1990 8:00 14,703 14,887 14,505 13,296 12,359 15,067 14,089 11,569 10,827 11/22/1990 9:00 20,353 19,171 18,633 16,735 15,492 19,035 17,746 13,363 12,321 11/22/ :00 30,246 28,352 28,069 24,801 22,572 26,942 25,323 16,322 15,296 11/22/ :00 35,424 33,885 33,692 30,059 27,650 33,188 31,751 16,354 15,377 11/23/1990 0:00 43,065 43,191 43,193 38,489 36,052 43,161 40,362 19,050 20,956 11/23/ :00 44,762 43,933 43,574 38,324 35,644 44,682 40,474 27,602 36,488 11/24/1990 0:00 75,912 72,792 71,267 59,480 55,387 72,027 58,142 33,084 44,393 11/24/1990 2:00 96,508 94,976 92,344 75,402 72,948 92,240 71,320 38,763 52,118 11/24/1990 5:00 120, , ,254 89,534 94, ,271 87,580 51,906 68,072 11/24/1990 6:00 126, , ,408 91,973 99, ,430 91,040 57,301 74,522 11/24/1990 9:00 133, , ,271 94, , ,074 93,065 72,508 92,552 A-10
52 Table 4.1 Estimated flow percentage leaving or entering Skykomish River for the Nov 1975 storm at selected locations where flows would change in the HEC- RAS model. (1) (2) (3) (4) (5) (6) (7) (8) (9) (10) Travel Time + 0 hr + 2 hr + 2 hr + 2 hr + 2 hr + 3 hr + 3 hr + 3 hr + 3 hr Location Flow (cfs) below Sultan % of low change relative to flow below Sultan R. u/s of Riley % of flow out to Riley Slough relative to flow below Sultan R. u/s of Haskel % flow out to Haskel Slough relative to flow above Haskell at Monroe % of overtopping outflow relative to flow at Monroe at SR-203 Bridge % of return flow from Haskel relative to flow at SR- 203 Bridge bl Haskel returns % of overtopping outflow relative to flow below where Haskel returns % of overtopping outflow relative to flow at RM=2.07 % of overtopping outflow relative to flow at RM 0.92 RM-2 RM-1 RM-0 Time / RM RM RM 6.5 RM 6.01 RM 4.85 RM 3.96 RM 3.09 RM 2.07 RM 0.92 RM /30/ :00 3, % 2.7% 6.4% -20.3% 34.7% 5.3% 5.8% 4.4% 12/1/1975 0:00 15, % 0.6% 5.1% 3.2% 5.8% 1.7% 17.4% 1.9% 12/1/ :00 33, % 0.4% 10.3% 7.3% 12.1% 3.4% 50.1% 4.4% 12/2/1975 0:00 53, % 0.4% 12.5% 5.4% 16.0% 11.3% 54.7% -16.7% 12/2/1975 4:00 68, % 1.1% 14.8% 5.3% 19.3% 16.7% 53.6% -27.2% 12/2/1975 8:00 88, % 1.3% 17.0% 1.7% 19.5% 20.2% 48.1% -34.3% 12/2/ :00 102, % 2.5% 18.4% -2.0% 20.9% 22.1% 32.9% -32.9% 12/2/ :00 80, % 0.1% 15.7% -2.4% 18.6% 21.4% -6.4% -30.7% 12/3/1975 5:00 97, % 2.0% 17.9% -3.1% 20.8% 25.4% -11.6% -28.2% 12/4/1975 0:00 74, % 0.1% 15.1% -0.9% 18.5% 23.6% -32.1% -29.5% 12/4/1975 8:00 87, % 0.7% 16.5% -1.9% 19.4% 24.7% -16.4% -28.8% 12/5/1975 0:00 40, % -0.5% 10.1% 2.3% 13.9% 10.6% -39.7% -36.9% A-11
53 Table 4.2 Estimated flow percentage leaving or entering Skykomish River for the Dec 1980 storm at selected locations where flows would change in the HEC- RAS model. (1) (2) (3) (4) (5) (6) (7) (8) (9) (10) Travel Time + 0 hr + 2 hr + 2 hr + 2 hr + 2 hr + 3 hr + 3 hr + 3 hr + 3 hr Location Flow (cfs) below Sultan % of low change relative to flow below Sultan R. u/s of Riley % of flow out to Riley Slough relative to flow below Sultan R. u/s of Haskel % flow out to Haskel Slough relative to flow above Haskell at Monroe % of overtopping outflow relative to flow at Monroe at SR-203 Bridge % of return flow from Haskel relative to flow at SR-203 Bridge bl Haskel slough % of overtopping outflow relative to flow below where Haskel returns % of overtopping outflow relative to flow at RM=2.07 % of overtopping outflow relative to flow at RM 0.92 RM-2 RM-1 RM-0 Time / RM RM RM 6.5 RM 6.01 RM 4.85 RM 3.96 RM 3.09 RM 2.07 RM 0.92 RM /23/1980 1:00 14, % -0.2% 2.0% 2.5% 3.4% -0.6% 16.6% -0.9% 12/23/1980 8:00 12, % -0.1% 1.6% 1.2% 5.3% -0.3% 13.4% -1.1% 12/23/1980 9:00 12, % -0.1% 1.6% 1.1% 5.5% -0.3% 13.1% -1.0% 12/23/ :00 12, % -0.1% 1.4% 1.0% 5.5% -0.2% 12.5% -0.9% 12/23/ :00 11, % -0.1% 1.4% 1.0% 5.5% -0.2% 12.1% -0.7% 12/24/1980 0:00 13, % 0.3% 3.1% -0.2% 7.9% 0.7% 15.4% 0.6% 12/24/ :00 35, % 0.3% 10.8% 6.0% 14.8% 4.6% 53.1% 1.9% 12/25/1980 0:00 43, % 0.7% 12.0% 4.6% 19.4% 8.7% 53.6% -2.3% 12/25/1980 2:00 52, % 1.2% 13.5% 5.3% 21.9% 12.5% 55.9% -7.7% 12/25/1980 5:00 74, % 1.6% 16.2% 4.5% 22.0% 18.7% 58.0% -21.1% 12/25/1980 7:00 90, % 2.1% 17.8% 2.4% 22.6% 21.5% 58.8% -29.3% 12/25/ :00 113, % 4.3% 20.2% -3.6% 25.0% 23.8% 52.3% -33.2% A-12
54 Table 4.3 Estimated flow percentage leaving or entering Skykomish River for the Nov 1986 storm at selected locations where flows would change in the HEC- RAS model. (1) (2) (3) (4) (5) (6) (7) (8) (9) (10) Travel Time + 0 hr + 2 hr + 2 hr + 2 hr + 2 hr + 3 hr + 3 hr + 3 hr + 3 hr Location Flow (cfs) below Sultan % of low change relative to flow below Sultan R. u/s of Riley % of flow out to Riley Slough relative to flow below Sultan R. u/s of Haskel % flow out to Haskel Slough relative to flow above Haskell at Monroe % of overtopping outflow relative to flow at Monroe at SR-203 Bridge % of return flow from Haskel relative to flow at SR-203 Bridge bl Haskel slough % of overtopping outflow relative to flow below where Haskel returns % of overtopping outflow relative to flow at RM=2.07 % of overtopping outflow relative to flow at RM 0.92 RM-2 RM-1 RM-0 Time / RM RM RM 6.5 RM 6.01 RM 4.85 RM 3.96 RM 3.09 RM 2.07 RM 0.92 RM /21/1986 1:00 24, % 0.0% 0.4% -5.5% 11.2% 0.7% 8.0% 0.4% 11/21/1986 8:00 21, % 2.6% 9.8% 2.1% 20.8% 5.8% 26.7% 10.2% 11/21/ :00 20, % 1.0% 12.0% 6.3% 13.2% 6.2% 37.5% 4.9% 11/21/ :00 18, % 0.2% 10.9% 5.6% 13.9% 5.6% 54.2% 5.1% 11/22/1986 0:00 14, % -0.3% 6.9% 3.0% 11.5% -1.2% 44.5% -3.6% 11/23/1986 0:00 12, % -0.2% 2.5% 1.1% 4.9% -0.5% 14.5% -0.8% 11/24/1986 0:00 89, % 0.0% 1.7% 1.8% 5.1% 0.1% 12.4% -0.3% 11/24/ :00 54, % 0.8% 12.1% 5.3% 18.3% 7.7% 55.3% 7.2% 11/24/ :00 42, % 1.9% 15.2% 6.0% 24.0% 16.4% 60.3% -6.0% 11/24/ :00 38, % 1.8% 17.1% 4.0% 23.0% 20.3% 61.1% -19.4% 11/24/ :00 33, % 1.7% 17.4% -3.1% 22.0% 21.5% 58.8% -32.8% 1/0/1900 0:00 00, % -0.7% 10.3% -0.8% 16.1% 12.5% -45.2% -34.4% A-13
55 Table 4.4 Estimated flow percentage leaving or entering Skykomish River for the Nov 1990 storm at selected locations where flows would change in the HEC- RAS model. (1) (2) (3) (4) (5) (6) (7) (8) (9) (10) Travel Time + 0 hr + 2 hr + 2 hr + 2 hr + 2 hr + 3 hr + 3 hr + 3 hr + 3 hr Location Flow (cfs) below Sultan % of low change relative to flow below Sultan R. u/s of Riley % of flow out to Riley Slough relative to flow below Sultan R. u/s of Haskel % flow out to Haskel Slough relative to flow above Haskell at Monroe % of overtopping outflow relative to flow at Monroe at SR-203 Bridge % of return flow from Haskel relative to flow at SR-203 Bridge bl Haskel slough % of overtopping outflow relative to flow below where Haskel returns % of overtopping outflow relative to flow at RM=2.07 % of overtopping outflow relative to flow at RM 0.92 RM-2 RM-1 RM-0 Time / RM RM RM 6.5 RM 6.01 RM 4.85 RM 3.96 RM 3.09 RM 2.07 RM 0.92 RM /22/1990 1:00 7, % 0.3% 1.2% -1.3% 6.4% 1.1% 5.3% 0.5% 11/22/1990 8:00 14, % 2.6% 8.3% 7.0% 14.3% 6.5% 17.9% 6.4% 11/22/1990 9:00 20, % 2.6% 10.2% 7.4% 14.8% 6.8% 24.7% 7.8% 11/22/ :00 30, % 0.9% 11.6% 9.0% 9.5% 6.0% 35.5% 6.3% 11/22/ :00 35, % 0.5% 10.8% 8.0% 11.3% 4.3% 48.5% 6.0% 11/23/1990 0:00 43, % 0.0% 10.9% 6.3% 13.0% 6.5% 52.8% -10.0% 11/23/ :00 44, % 0.8% 12.0% 7.0% 17.8% 9.4% 31.8% -32.2% 11/24/1990 0:00 75, % 2.0% 16.5% 6.9% 22.7% 19.3% 43.1% -34.2% 11/24/1990 2:00 96, % 2.7% 18.3% 3.3% 23.1% 22.7% 45.6% -34.5% 11/24/1990 5:00 120, % 6.2% 21.6% -5.6% 30.4% 25.9% 40.7% -31.1% 11/24/1990 6:00 126, % 6.9% 23.0% -8.5% 31.5% 26.2% 37.1% -30.1% 11/24/1990 9:00 133, % 7.3% 24.1% -11.3% 31.2% 26.8% 22.1% -27.6% A-14
56 Table 5. Flow Scenario Simulation flows for sediment transport study. Flow % Exceedance (Return Period) near Gold Bar Flow (cfs) below Wallace River below Sultan River (Q 2yr ) (Q 10yr ) (Q 25yr ) (Q 50yr ) A-15
57 Table 6. Estimated flows at flow changing points on the Skykomish River for the 11 sediment transport simulation flow scenarios. Flow % Excd (Return period) bl Sultan River above Riley above RM Monroe Flow SR-203 bl Haskell RM RM RM 0.92 RM RM (Q 2yr ) (Q 10yr ) (Q 25yr ) (Q 50yr ) A-16
58 Thalweg yr Flood WSE Elevation (ft, NAVD88) Monroe Sultan River Wallace River Gold Bar High Bridge 50 0 S=0.119% S=0.263% S=0.688% River Station (ft) Figure 1. Skykomish River main channel thalweg profile and large scale channel longitudinal gradients. A-17
59 Manning's n Manning's n (1990/2006 flood) Manning's n (2008 flood) River Station (ft) Figure 2. Calibrated channel roughness coefficients for the Skykomish River main channel, per HWMs of 1990, 2006, and 2008 floods. A-18
60 Mann Road Bridge 1990 HWMs 2006 HWMs Figure 3.1 Skykomish River WSE calibration for 1990 and 2006 flood flows. River distance = 50000ft (RM 9.47) ~ 75000ft (RM 14.20). Circles and squares are the HWMs of 1990 flood and 2006 flood, respectively. A-19
61 1990 HWMs 2006 HWMs Figure 3.2 Skykomish River WSE calibration for 1990 and 2006 flood flows. River distance = 75,000ft (RM 14.20) ~ 100,000ft (RM 18.94). Circles and squares are the HWMs of 1990 flood and 2006 flood, respectively. A-20
62 High Bridge 1990 HWMs 2006 HWMs Figure 3.3 Skykomish River WSE calibration for 1990 and 2006 flood flows. River distance = 100,000ft (RM 18.94) ~ 125,000ft (RM 23.67). Circles and squares are the HWMs of 1990 flood and 2006 flood, respectively. A-21
63 1990 HWMs 2006 HWMs Figure 3.4 Skykomish River WSE calibration for 1990 and 2006 flood flows. River distance = 125,000ft (RM 23.67) ~ 145,000ft (RM 27.46). Circles and squares are the HWMs of 1990 flood and 2006 flood, respectively. A-22
64 1990 HWMs 2006 HWMs Figure 3.5 Skykomish River WSE calibration for 1990 and 2006 flood flows. River distance > 140,000ft (RM 26.52). Circles and squares are the HWMs of 1990 flood and 2006 flood, respectively. A-23
65 Mann Road Bridge 2008 HWMs Figure 4.1 Skykomish River WSE calibration for the 2008 flood flow. River distance = 50,000ft (RM 9.47) ~ 75,000ft (RM 14.20). Triangles indicate the HWMs of 2008 flood. A-24
66 2008 HWMs Figure 4.2 Skykomish River WSE calibration for 2008 flood flow. River distance = 75,000ft (RM 14.20) ~ 100,000ft (RM 18.94). Triangles indicate the HWMs of 2008 flood. A-25
67 High Bridge 2008 HWMs Figure 4.3 Skykomish River WSE calibration for 2008 flood flow. River distance = 100,000ft (RM 18.94) ~ 125,000ft (RM 23.67). Triangles indicate the HWMs of 2008 flood. A-26
 ~ 145,000ft (RM 27.46).")
68 2008 HWMs Figure 4.4 Skykomish River WSE calibration for 2008 flood flow. River distance = 125,000ft (RM 23.67) ~ 145,000ft (RM 27.46). Triangles are the HWMs of 2008 flood. A-27
69 2008 HWMs Figure 4.5 Skykomish River WSE calibration for 2008 flood flow. River distance > 140,000ft (RM 26.52). Triangles are the HWMs of 2008 flood. A-28
70 RM bl Sultan RM 6.5 u/s Riley RM 6.01 u/s Haskell RM 4.85 Monroe RM 3.09 bl Haskell RM 2.07 Mainstem RM 0.92 Mainstem RM 0.16 Mainstem Flow (cfs) Nov Dec Dec Dec Dec Dec Dec-75 Figure 5.1 Simulated hydrographs at different locations on the Skykomish River for the Nov, 1975 storm. A-29
71 RM bl Sultan RM 6.5 u/s Riley RM 6.01 u/s Haskell RM 4.85 Monroe Flow (cfs) RM 3.09 bl Haskell RM 2.07 Mainstem RM 0.92 Mainstem RM 0.16 Mainstem Dec Dec Dec Dec Dec Dec-80 Figure 5.2 Simulated hydrographs at different locations on the Skykomish River for the Dec, 1980 storm. A-30
72 RM bl Sultan RM 6.5 u/s Riley RM 6.01 u/s Haskell RM 4.85 Monroe RM 3.09 bl Haskell RM 2.07 Mainstem RM 0.92 Mainstem RM 0.16 Mainstem Flow (cfs) Nov Nov Nov Nov Nov Nov-86 Figure 5.3 Simulated hydrographs at different locations on the Skykomish River for the Nov, 1986 storm. A-31
73 Flow (cfs) RM bl Sultan 6.5 RM u/s Riley 6.01 RM u/s Haskell 4.85 RM Monroe 3.09 RM bl Haskell 2.07 RM Mainstem 0.92 RM Mainstem 0.16 RM Mainstem Nov Nov Nov Nov Nov Nov-90 Figure 5.4 Simulated hydrographs at different locations on the Skykomish River for the Nov, 1990 storm. A-32
74 120, ,000 80,000 Flow (cfs) 60,000 40,000 20, River Mile (RM) from Snoqualmie River confluence 11/30/ :00 12/1/ :00 12/2/1975 4:00 12/2/1975 8:00 12/2/ :00 12/2/ :00 12/3/1975 5:00 12/4/1975 0:00 12/4/1975 8:00 12/5/1975 0:00 Figure 6.1 Nov, 1975 storm hydrograph. The time for each legend indicates the initial time of the flow starting from below the Sultan River. The flow on each curve represents the discharge of the starting flow as it moves downstream. A-33
75 120, ,000 80,000 Flow (cfs) 60,000 40,000 20,000 00, River Mile (RM) from Snoqualmie River confluence 12/23/ :00 12/24/1980 0:00 12/24/ :00 12/25/1980 0:00 12/25/1980 2:00 12/25/1980 5:00 12/25/1980 7:00 12/25/ :00 12/23/1980 1:00 Figure 6.2 Dec, 1980 storm hydrograph. The time for each legend indicates the initial time of the flow starting from below the Sultan River. The flow on each curve represents the discharge of the starting flow as it moves downstream. A-34
76 100,000 90,000 80,000 70,000 Flow (cfs) 60,000 50,000 40,000 30,000 20,000 10,000 00, River Mile (RM) from Snoqualmie River confluence 11/21/1986 0:00 11/22/1986 0:00 11/23/1986 0:00 11/23/ :00 11/23/ :00 11/23/ :00 11/23/ :00 11/24/ :00 11/20/1986 1:00 Figure 6.3 Nov, 1986 storm hydrograph. The time for each legend indicates the initial time of the flow starting from below the Sultan River. The flow on each curve represents the discharge of the starting flow as it moves downstream. A-35
77 160, , , ,000 Flow (cfs) 80,000 60,000 40,000 20,000 00, River Mile (RM) from Snoqualmie River confluence 11/22/ :00 11/23/1990 0:00 11/23/ :00 11/24/1990 0:00 11/24/1990 2:00 11/24/1990 5:00 11/24/1990 6:00 11/24/1990 9:00 11/22/1990 1:00 Figure 6.4 Nov, 1990 storm hydrograph. The time for each legend indicates the initial time of the flow starting from below the Sultan River. The flow on each curve represents the discharge of the starting flow as it moves downstream. A-36
78 10% 8% (1) Q <= 140,000cfs: P=0.0% 6% % of Flow Increase 4% 2% 0% -2% -4% -6% 0 20,000 40,000 60,000 80, , , ,000 Flow (cfs) below Sultan River Confluence Nov 1975 flood Dec 1980 flood Nov 1986 flood Nov 1990 flood Figure 7.1 Percentage of Q change from below Sultan River (RM 13.07) to above Riley Slough (RM 6.50) relative to flow below the Sultan River. A-37
79 % of Flow Entering Riley Slough 8% 7% 6% 5% 4% 3% 2% 1% 0% -1% -2% (1) Q <= 30,000cfs: P=0% (2) 30,000cfs <= Q <= 100,000cfs: P=3%*(Q-30,000)/70,000 (3) Q >= 100,000cfs: P=3%+5%*(Q-100,000)/40, ,000 40,000 60,000 80, , , ,000 Flow (cfs) below Sultan River Nov 1975 flood Dec 1980 flood Nov 1986 flood Nov 1990 flood Figure 7.2 Percentage of Q entering Riley Slough at RM 6.50 relative to the flow d/s of Sultan River (RM 13.07). A-38
80 30% % of Flow Entering Haskell Slough 25% 20% 15% 10% 5% (1) Q <= 8,000cfs: P=0% (2) 8,000cfs <= Q <= 40,000cfs: P=11%*(Q-8,000)/32,000 (3) Q >= 40,000cfs: P=11%+13%*(Q-40,000)/100,000 0% 0 20,000 40,000 60,000 80, , , ,000 Flow (cfs) below Sultan River Nov 1975 flood Dec 1980 flood Nov 1986 flood Nov 1990 flood Figure 7.3 Percentage of flow entering Haskel Slough relative to flow u/s of Haskel Slough. A-39
81 15% % of Flow leaving Skykomish River 10% 5% 0% -5% -10% -15% -20% (1) Q <= 8,000cfs: P=0% (2) 8,000cfs <= Q <= 24,000cfs: P=6%*(Q-8,000)/16,000 (3) 24,000cfs <= Q <= 80,000cfs: P=6% (4) Q >= 80,000cfs: P=6%-19%*(Q-80,000)/60,000-25% Flow (cfs) below Sultan River Nov 1975 flood Dec 1980 flood Nov 1986 flood Nov 1990 flood Figure 7.4 Percentage of flow leaving Skykomish River between SR203 Bridge and Monroe (RM 4.85) relative to the flow at Monroe. A negative percentage indicates flow entering Skykomish River. A-40
82 40% % of Flow from Haskel Slough Return 35% 30% 25% 20% 15% 10% 5% (1) Q <= 12,000cfs: P=0% (2) 12,000cfs <= Q <= 52,000cfs: P=5%+16%*(Q-12,000)/40,000 (3) 48,000cfs <= Q <= 100,000cfs: P=21% (4) Q >= 100,000cfs: P=21%+14%*(Q-100,000)/40,000 0% 0 20,000 40,000 60,000 80, , , ,000 Flow (cfs) below Sultan River Nov 1975 flood Dec 1980 flood Nov 1986 flood Nov 1990 flood Figure 7.5 Percentage of return flow from Haskel Slough relative to the flow at SR-203 Bridge. A-41
83 30% % of flow leaving between RM 3.09 & RM % 20% 15% 10% 5% 0% -5% (1) Q <= 12,000cfs: P=0% (2) 12,000cfs <= Q <= 80,000cfs: P=20%*(Q-12,000)/68,000 (3) Q >= 80,000cfs: P=20%+5%*(Q-80,000)/40, ,000 40,000 60,000 80, , , ,000 Flow (cfs) below Sultan River Nov 1975 flood Dec 1980 flood Nov 1986 flood Nov 1990 flood Figure7.6 % of overtopping outflow between RM 3.09 and RM 2.07 relative to the flow just below where Haskel Slough returns (RM 3.09). A-42
84 80% % Flow leaving between RM 2.07 and RM % 40% 20% 0% -20% -40% (1) Q <= 8,000cfs: P=0% (2) 8,000cfs <= Q <= 40,000cfs: P=2%+54%*(Q-8,000)/32,000 (3) 40,000cfs <= Q <= 100,000cfs: P=56% (4) Q <= 100,000cfs: P=56%-36%*(Q-100,000)/40,000-60% 0 20,000 40,000 60,000 80, , , ,000 Flow (cfs) below Sultan River Nov 1975 flood Dec 1980 flood Nov 1986 flood Nov 1990 flood Figure 7.7 % of flow leaving Skykomish River between RM 2.07 and RM 0.92 relative to the flow at RM A-43
85 % Q leaving between RM 0.92 and RM % 10% 0% -10% -20% -30% (1) Q <= 12,000cfs: P=0% (2) 12,000cfs <= Q <= 20,000cfs: P=5%*(Q-12,000)/8,000 (3) 20,000cfs <= Q <= 40,000cfs: P=5% (4) 40,000cfs <= Q <= 80,000cfs: P=5%-37%*(Q-40,000)/40,000 (5) Q >= 80,000cfs: P=-32% -40% 0 20,000 40,000 60,000 80, , , ,000 Flow (cfs) below Sultan River Nov 1975 flood Dec 1980 flood Nov 1986 flood Nov 1990 flood Figure 7.8 % of flow leaving Skykomish River between RM 0.92 and RM 0.16 relative to the flow at RM A negative percentage indicates flow entering Skykomish River. A-44
86 Flow (cfs) RM (miles) 5% 1% 0.50% 0.40% 0.30% 0.20% 0.14% (Q2yr) 0.10% 0.03% (Q10yr) 0.01% (Q25yr) 0.005% (Q50yr) Figure 8 Flow variations along the Skykomish River from Sultan River confluence to Snoqualmie River junction. The flows range from 5% exceedance flow to 50-yr return period flood. A-45

87

88

89

90
91 City of Sultan City of Monroe Legend Recurrence Interval > 100 Plate 5 Risk ratings of potential avulsion pathways characterized according to lowest of three flood levels (2-, 10- and 100-year recurrence intervals) at which floodplain or off-channel flow may occur. Tracings and ratings were based on 2006 topography. GIS Data available from Snohomish County Surface Water Management. Snohomish County disclaims any warranty of merchantability or warranty of fitness of this map for any particular purpose, either express or implied. No representation or warranty is made concerning the accuracy, currency, completeness or quality of data depicted on this map. Any user of this map assumes all responsibility for use thereof, and further agrees to hold Snohomish County harmless from and against any damage, loss, or liability arising from any use of this map Miles Snohomish County PUBLIC WORKS SURFACE WATER MANAGEMENT (425) I:\pw\swm\spwlca\Rivers\Skykomish_River\Lower_Sky_Avulsion_Plates\mxds\LowerSky_Avulsion_Risks.mxd LCA 2/24/2010
92 City of Sultan City of Monroe Legend Slope <0% >0 - <=1% >1 - <=3% >3% Plate 6 Risk ratings of potential avulsion pathways characterized according to average gradient along each pathway segment. Tracings and ratings were based on 2006 topography. GIS Data available from Snohomish County Surface Water Management. Snohomish County disclaims any warranty of merchantability or warranty of fitness of this map for any particular purpose, either express or implied. No representation or warranty is made concerning the accuracy, currency, completeness or quality of data depicted on this map. Any user of this map assumes all responsibility for use thereof, and further agrees to hold Snohomish County harmless from and against any damage, loss, or liability arising from any use of this map Miles Snohomish County PUBLIC WORKS SURFACE WATER MANAGEMENT (425) I:\pw\swm\spwlca\Rivers\Skykomish_River\Lower_Sky_Avulsion_Plates\mxds\LowerSky_Avulsion_Risks.mxd LCA 2/24/2010
93 City of Sultan City of Monroe Legend Soil Class 1 Higher Erosivity 2 Moderate Erosivity 3 Lower Erosivity Plate 7 Risk ratings of potential avulsion pathways characterized according to floodplain soil Kw erodibility factors. GIS Data available from Snohomish County Surface Water Management. Snohomish County disclaims any warranty of merchantability or warranty of fitness of this map for any particular purpose, either express or implied. No representation or warranty is made concerning the accuracy, currency, completeness or quality of data depicted on this map. Any user of this map assumes all responsibility for use thereof, and further agrees to hold Snohomish County harmless from and against any damage, loss, or liability arising from any use of this map Miles Snohomish County PUBLIC WORKS SURFACE WATER MANAGEMENT (425) I:\pw\swm\spwlca\Rivers\Skykomish_River\Lower_Sky_Avulsion_Plates\mxds\LowerSky_Avulsion_Risks.mxd LCA 2/24/2010
94 City of Sultan City of Monroe Legend Risk Class 1 Highest Lowest Plate 8 Joint avulsion risk ratings of potential avulsion pathways characterized according to weighted sums of flood flow level, longitudinal gradient, and floodplain soil Kw erodibility factor ratings depicted in Figures 1-3. Tracings and ratings were based on 2003 topography. GIS Data available from Snohomish County Surface Water Management. Snohomish County disclaims any warranty of merchantability or warranty of fitness of this map for any particular purpose, either express or implied. No representation or warranty is made concerning the accuracy, currency, completeness or quality of data depicted on this map. Any user of this map assumes all responsibility for use thereof, and further agrees to hold Snohomish County harmless from and against any damage, loss, or liability arising from any use of this map Miles Snohomish County PUBLIC WORKS SURFACE WATER MANAGEMENT (425) I:\pw\swm\spwlca\Rivers\Skykomish_River\Lower_Sky_Avulsion_Plates\mxds\LowerSky_Avulsion_Risks.mxd LCA 2/24/2010
95 City of Sultan City of Monroe Legend Vegetation Forested (Partially or Fully) Nonforested Open Water Plate 9 Avulsion risk mitigation ratings of potential avulsion pathways characterized according to whether a segment passes through forested land. GIS Data available from Snohomish County Surface Water Management. Snohomish County disclaims any warranty of merchantability or warranty of fitness of this map for any particular purpose, either express or implied. No representation or warranty is made concerning the accuracy, currency, completeness or quality of data depicted on this map. Any user of this map assumes all responsibility for use thereof, and further agrees to hold Snohomish County harmless from and against any damage, loss, or liability arising from any use of this map Miles Snohomish County PUBLIC WORKS SURFACE WATER MANAGEMENT (425) I:\pw\swm\spwlca\Rivers\Skykomish_River\Lower_Sky_Avulsion_Plates\mxds\LowerSky_Avulsion_Risks.mxd LCA 2/24/2010


96 City of Sultan City of Monroe Legend Roads Road Crossings not Identified Gravel/ Dirt Roads Paved Roads Plate 10 Avulsion risk mitigation ratings of potential avulsion pathways characterized according to whether a segment is intersected by a paved or gravel surfaced road. GIS Data available from Snohomish County Surface Water Management. Road coverage may be incomplete and should be evaluated on a site-specific basis. Snohomish County disclaims any warranty of merchantability or warranty of fitness of this map for any particular purpose, either express or implied. No representation or warranty is made concerning the accuracy, currency, completeness or quality of data depicted on this map. Any user of this map assumes all responsibility for use thereof, and further agrees to hold Snohomish County harmless from and against any damage, loss, or liability arising from any use of this map Miles Snohomish County PUBLIC WORKS SURFACE WATER MANAGEMENT (425) I:\pw\swm\spwlca\Rivers\Skykomish_River\Lower_Sky_Avulsion_Plates\mxds\LowerSky_Avulsion_Risks.mxd LCA 2/24/2010
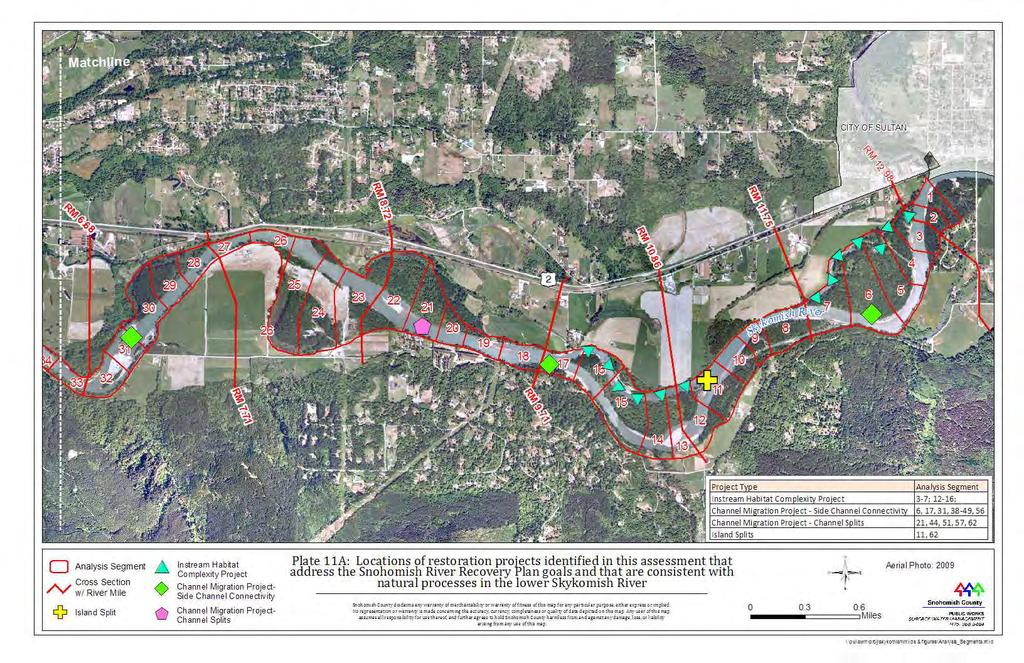
97

98
Technical Memorandum
 f 15250 NE 95th Street Redmond, WA 98052-2518 Phone: (425) 556-1288 Fax: (425) 556-1290 e-mail: mail@r2usa.com Technical Memorandum Date: March 22, 2010 Project Number: 1771.01/MM101 To: Bob Aldrich, Snohomish
Wetland & Floodplain Functional Assessments and Mapping To Protect and Restore Riverine Systems in Vermont. Mike Kline and Laura Lapierre Vermont DEC
 Wetland & Floodplain Functional Assessments and Mapping To Protect and Restore Riverine Systems in Vermont Mike Kline and Laura Lapierre Vermont DEC NWI+ Hydro-Geomorphic Characterization of Wetlands and
ADDRESSING GEOMORPHIC AND HYDRAULIC CONTROLS IN OFF-CHANNEL HABITAT DESIGN
 ADDRESSING GEOMORPHIC AND HYDRAULIC CONTROLS IN OFF-CHANNEL HABITAT DESIGN Conor Shea - Hydrologist U.S. Fish and Wildlife Service Conservation Partnerships Program Arcata, CA Learning Objectives Examine
Technical Memorandum. To: From: Copies: Date: 10/19/2017. Subject: Project No.: Greg Laird, Courtney Moore. Kevin Pilgrim and Travis Stroth
 Technical Memorandum To: From: Greg Laird, Courtney Moore Kevin Pilgrim and Travis Stroth 5777 Central Avenue Suite 228 Boulder, CO 80301 www.otak.com Copies: [Electronic submittal] Date: 10/19/2017 Subject:
MEANDER MIGRATION MODEL ASSESSMENT FOR THE JANUARY 2005 STORM, WHITMAN PROPERTY, SAN ANTONIO CREEK, VENTURA COUNTY, CALIFORNIA
 MEANDER MIGRATION MODEL ASSESSMENT FOR THE JANUARY 2005 STORM, WHITMAN PROPERTY, SAN ANTONIO CREEK, VENTURA COUNTY, CALIFORNIA Prepared by Eric Larsen, Ph.D. Mark Rains, Ph.D. October 2006 INTRODUCTION
Vermont Stream Geomorphic Assessment. Appendix E. River Corridor Delineation Process. VT Agency of Natural Resources. April, E0 - April, 2004
 Vermont Stream Geomorphic Assessment Appendix E River Corridor Delineation Process Vermont Agency of Natural Resources - E0 - River Corridor Delineation Process Purpose A stream and river corridor delineation
Stream Geomorphology. Leslie A. Morrissey UVM July 25, 2012
 Stream Geomorphology Leslie A. Morrissey UVM July 25, 2012 What Functions do Healthy Streams Provide? Flood mitigation Water supply Water quality Sediment storage and transport Habitat Recreation Transportation
Summary of Hydraulic and Sediment-transport. Analysis of Residual Sediment: Alternatives for the San Clemente Dam Removal/Retrofit Project,
 Appendix N SUMMARY OF HYDRAULIC AND SEDIMENT-TRANSPORT ANALYSIS OF RESIDUAL SEDIMENT: ALTERNATIVES FOR THE SAN CLEMENTE DAM REMOVAL/RETROFIT PROJECT, CALIFORNIA the San Clemente Dam Removal/Retrofit Project,
UPPER COSUMNES RIVER FLOOD MAPPING
 UPPER COSUMNES RIVER FLOOD MAPPING DRAFT BASIC DATA NARRATIVE FLOOD INSURANCE STUDY SACRAMENTO COUTY, CALIFORNIA Community No. 060262 November 2008 Prepared By: CIVIL ENGINEERING SOLUTIONS, INC. 1325 Howe
MIDDLE PILCHUCK RIVER ASSESSMENT
 MIDDLE PILCHUCK RIVER ASSESSMENT Geomorphic Report Prepared for Washington State Salmon Recovery Funding Board Snohomish County Prepared by Snohomish County Surface Water Management March 26, 2012 Acknowledgements
FUTURE MEANDER BEND MIGRATION AND FLOODPLAIN DEVELOPMENT PATTERNS NEAR RIVER MILES 200 TO 191 OF THE SACRAMENTO RIVER PHASE III REPORT
 FUTURE MEANDER BEND MIGRATION AND FLOODPLAIN DEVELOPMENT PATTERNS NEAR RIVER MILES 200 TO 191 OF THE SACRAMENTO RIVER PHASE III REPORT Eric W. Larsen REPORT FOR DUCKS UNLIMITED March 31, 2006-1 - Contents
Technical Memorandum No Sediment Model
 Pajaro River Watershed Study in association with Technical Memorandum No. 1.2.9 Sediment Model Task: Development of Sediment Model To: PRWFPA Staff Working Group Prepared by: Gregory Morris and Elsie Parrilla
Stop 1: Marmot Dam Stop 1: Marmot Dam
 Stop 1: Marmot Dam Stop 1: Marmot Dam Following the removal of Marmot Dam in 2007, the fate of the reservoir sediments has been monitored through a series of surveys and sediment transport measurements.
PolyMet NorthMet Project
 RS 26 Draft-01 December 8, 2005 RS26 Partridge River Level 1 Rosgen Geomorphic Survey Rosgen Classification Partridge River from Headwaters to Colby Lake Prepared for PolyMet NorthMet Project December
Why Geomorphology for Fish Passage
 Channel Morphology - Stream Crossing Interactions An Overview Michael Love Michael Love & Associates mlove@h2odesigns.com (707) 476-8938 Why Geomorphology for Fish Passage 1. Understand the Scale of the
Step 5: Channel Bed and Planform Changes
 Step 5: Channel Bed and Planform Changes When disturbed, streams go through a series of adjustments to regain equilibrium with the flow and sediment supply of their watersheds. These adjustments often
YELLOWSTONE RIVER FLOOD STUDY REPORT TEXT
 YELLOWSTONE RIVER FLOOD STUDY REPORT TEXT TECHNICAL REPORT Prepared for: City of Livingston 411 East Callender Livingston, MT 59047 Prepared by: Clear Creek Hydrology, Inc. 1627 West Main Street, #294
Calculation of Stream Discharge Required to Move Bed Material
 Calculation of Stream Discharge Required to Move Bed Material Objective: Students will map two sections of a stream and calculate the depth, velocity, and discharge of flows required to move the stream
Technical Memorandum No
 Pajaro River Watershed Study in association with Technical Memorandum No. 1.2.10 Task: Evaluation of Four Watershed Conditions - Sediment To: PRWFPA Staff Working Group Prepared by: Gregory Morris and
Fish Passage at Road Crossings
 Fish Passage at Road Crossings 1 Crossing Design Workshop Outline 1:00 to 2:00 Intro, Design Overview, Channel Width 2:00 to 2:15 Break 2:15 to 3:15 No-Slope, Stream Simulation Design 3:15 to 3:30 Break
L OWER N OOKSACK R IVER P ROJECT: A LTERNATIVES A NALYSIS A PPENDIX A: H YDRAULIC M ODELING. PREPARED BY: LandC, etc, LLC
 L OWER N OOKSACK R IVER P ROJECT: A LTERNATIVES A NALYSIS A PPENDIX A: H YDRAULIC M ODELING PREPARED BY: LandC, etc, LLC TABLE OF CONTENTS 1 Introduction... 1 2 Methods... 1 2.1 Hydraulic Model... 1 2.2
The last three sections of the main body of this report consist of:
 Threatened and Endangered Species Geological Hazards Floodplains Cultural Resources Hazardous Materials A Cost Analysis section that provides comparative conceptual-level costs follows the Environmental
SUIATTLE RIVER CHANNEL MAPPING and FOREST ROAD 26 EROSION RISK ANALYSIS
 SUIATTLE RIVER CHANNEL MAPPING and FOREST ROAD 26 EROSION RISK ANALYSIS By: Kate Ramsden and Devin Smith Skagit River System Cooperative Prepared For: United States Forest Service Mt. Baker-Snoqualmie
Restoration Goals TFG Meeting. Agenda
 San Joaquin River Restoration Program Restoration Goals TFG Meeting Reach 2B Update April 28, 2010 Agenda 1. Introductions 2. Program Restoration Goal Context 3. Program Update a) Interim Flows b) EIS/EIR
7.3 Sediment Delivery Analysis
 7.3 Sediment Delivery Analysis In order to evaluate potential changes in sedimentation patterns that could occur due to impacts from the FCP and LPP alignments, sediment assessment models were constructed
Final Report. Prepared for. American Rivers, California Trout, Friends of the River and Trout Unlimited
 A of the Potential Downstream Sediment Deposition Following the Removal of Iron Gate, Copco, and J.C. Boyle Dams, Klamath River, CA Final Report Prepared for American Rivers, California Trout, Friends
OBJECTIVES. Fluvial Geomorphology? STREAM CLASSIFICATION & RIVER ASSESSMENT
 STREAM CLASSIFICATION & RIVER ASSESSMENT Greg Babbit Graduate Research Assistant Dept. Forestry, Wildlife & Fisheries Seneca Creek, Monongahela National Forest, West Virginia OBJECTIVES Introduce basic
Rosgen Classification Unnamed Creek South of Dunka Road
 Rosgen Classification Unnamed Creek South of Dunka Road Prepared for Poly Met Mining Inc. September 2013 Rosgen Classification Unnamed Creek South of Dunka Road Prepared for Poly Met Mining Inc. September
Dam Removal Analysis Guidelines for Sediment
 A review of: Dam Removal Analysis Guidelines for Sediment Joe Rathbun (Retired) rathbunj@sbcglobal.net Some Potential Sediment Issues Reservoir restoration Downstream water quality Downstream deposition
PENNSYLVANIA DEPARTMENT OF TRANSPORTATION ENGINEERING DISTRICT 3-0
 PENNSYLVANIA DEPARTMENT OF TRANSPORTATION ENGINEERING DISTRICT 3-0 LYCOMING COUNTY S.R.15, SECTION C41 FINAL HYDROLOGIC AND HYDRAULIC REPORT STEAM VALLEY RUN STREAM RELOCATION DATE: June, 2006 REVISED:
State of the River: Geomorphic Structure. Josh Wyrick, Ph.D. UC Davis
 State of the River: Geomorphic Structure Josh Wyrick, Ph.D. UC Davis 1 Geomorphic Structure Methodology Data Collection (topography, rating curve, hydraulics, substrate, vegetation & cover) GIS-Based Analyses
Two-Dimensional Simulation of Truckee River Hydrodynamics
 Two-Dimensional Simulation of Truckee River Hydrodynamics by Stephen H. Scott PURPOSE: The purpose of this Coastal and Hydraulics Engineering Technical Note (CHETN) is to demonstrate the use of multidimensional
MEMORANDUM 1. INTRODUCTION
 MEMORANDUM TO: Jim Well, Ducks Unlimited FROM: Mike Harvey, PhD, PG, Bob Mussetter, PhD, PE, Dai Thomas, PE SUBJECT: Two-dimensional Sediment-transport Modeling of the M&T/Llano Project No. US-CA-62-2
Probabilistic Evaluation of a Meandering Low-Flow Channel. February 24 th, UMSRS
 Probabilistic Evaluation of a Meandering Low-Flow Channel February 24 th, 2014 2014 UMSRS 1 2 acknowledgments Low- Flow Channel (LFC) overview Proposed Diversion Channel collects runoff from: The Rush
Hydraulic and Sediment Transport Modeling Strategy
 Appendix B Hydraulic and Sediment Transport Modeling Strategy May 2014 Technical Memorandum Channel Capacity Report January 2015 San Joaquin River Restoration Program Hydraulic and Sediment Transport Modeling
Geomorphology Studies
 Geomorphology Studies Technical Workgroup Meeting February 14, 2012 Prepared by: Tetra Tech Prepared for: Alaska Energy Authority Overall Goal Geomorphology Studies Two studies Geomorphology Study (RSP
Geomorphic Importance of Winter Peak Flows and Annual Snowmelt Hydrographs in a Sierra Nevada Boulder-Bedrock River
 Geomorphic Importance of Winter Peak Flows and Annual Snowmelt Hydrographs in a Sierra Nevada Boulder-Bedrock River Scott McBain and Bill Trush McBain & Trush, Inc. Clavey River and Cherry Creek vicinity
Carmel River Bank Stabilization at Rancho San Carlos Road Project Description and Work Plan March 2018
 Carmel River Bank Stabilization at Rancho San Carlos Road Project Description and Work Plan March 2018 EXISTING CONDITION The proposed Carmel River Bank Stabilization at Rancho San Carlos Road Project
LOMR SUBMITTAL LOWER NEHALEM RIVER TILLAMOOK COUNTY, OREGON
 LOMR SUBMITTAL LOWER NEHALEM RIVER TILLAMOOK COUNTY, OREGON Prepared for: TILLAMOOK COUNTY DEPARTMENT OF COMMUNITY DEVELOPMENT 1510-B THIRD STREET TILLAMOOK, OR 97141 Prepared by: 10300 SW GREENBURG ROAD,
Dolores River Watershed Study
 CHAPTER 4: RIVER AND FLOODPLAIN ISSUES The Dolores River falls into a category of streams in Colorado that share some unique characteristics. Like some other mountain streams in the state, it has a steep
Diego Burgos. Geology 394. Advisors: Dr. Prestegaard. Phillip Goodling
 Sediment Transport into an Urban Tributary Junction Diego Burgos Geology 394 Advisors: Dr. Prestegaard Phillip Goodling 1 Abstract Tributary junctions are an important component of stream morphology and
USGS Flood Inundation Mapping of the Suncook River in Chichester, Epsom, Pembroke and Allenstown, New Hampshire
 USGS Flood Inundation Mapping of the Suncook River in Chichester, Epsom, Pembroke and Allenstown, New Hampshire NH Water & Watershed Conference Robert Flynn, USGS NH-VT Water Science Center March 23, 2012
NATURAL RIVER. Karima Attia Nile Research Institute
 NATURAL RIVER CHARACTERISTICS Karima Attia Nile Research Institute NATURAL RIVER DEFINITION NATURAL RIVER DEFINITION Is natural stream of water that flows in channels with ih more or less defined banks.
Degradation Concerns related to Bridge Structures in Alberta
 Degradation Concerns related to Bridge Structures in Alberta Introduction There has been recent discussion regarding the identification and assessment of stream degradation in terms of how it relates to
Geomorphology Geology 450/750 Spring Fluvial Processes Project Analysis of Redwood Creek Field Data Due Wednesday, May 26
 Geomorphology Geology 450/750 Spring 2004 Fluvial Processes Project Analysis of Redwood Creek Field Data Due Wednesday, May 26 This exercise is intended to give you experience using field data you collected
Ways To Identify Background Verses Accelerated Erosion
 Ways To Identify Background Verses Accelerated Erosion Establish Background Condition From Old Ground Photos, Aerial Photos, and Maps Compare Rate Over Time At the Same Location, or for Reaches Channel
!"#$%&&'()*+#$%(,-./0*)%(!
*+#$%(,-./0*)%(!") 8:30 Sign in Hoosic River Revival Coalition!"#$%&&'()*+#$%(,-./0*)%(! 12-#30+4/#"5-(60 9:00 Welcome and Introductions 9:15 Goals for Today s Program: A Description of the Planning Process 9:30 First Session:
8:30 Sign in Hoosic River Revival Coalition!"#$%&&'()*+#$%(,-./0*)%(! 12-#30+4/#"5-(60 9:00 Welcome and Introductions 9:15 Goals for Today s Program: A Description of the Planning Process 9:30 First Session:
MATHEMATICAL MODELING OF FLUVIAL SEDIMENT DELIVERY, NEKA RIVER, IRAN. S.E. Kermani H. Golmaee M.Z. Ahmadi
 JOURNAL OF ENVIRONMENTAL HYDROLOGY The Electronic Journal of the International Association for Environmental Hydrology On the World Wide Web at http://www.hydroweb.com VOLUME 16 2008 MATHEMATICAL MODELING
60 PERCENT DESIGN REPORT HABITAT RESTORATION OF THE CHELAN RIVER REACH 4 AND TAILRACE
 60 PERCENT DESIGN REPORT HABITAT RESTORATION OF THE CHELAN RIVER REACH 4 AND TAILRACE Prepared for Public Utility District Number 1 of Chelan County 327 North Wenatchee Avenue Wenatchee, Washington 98801
Swift Creek Sediment Management Action Plan (SCSMAP)
") Swift Creek Sediment Management Action Plan (SCSMAP) PHASE 2 PROJECT PLAN PROPOSAL Whatcom County Public Works Department 322 N. Commercial Street, Suite 210 Bellingham, WA 98225 (360) 676-6692 June 2013
Swift Creek Sediment Management Action Plan (SCSMAP) PHASE 2 PROJECT PLAN PROPOSAL Whatcom County Public Works Department 322 N. Commercial Street, Suite 210 Bellingham, WA 98225 (360) 676-6692 June 2013
Evaluation of Geomorphic Effects of Removal of Marmot and Little Sandy Dams and Potential Impacts on Anadromous Salmonids
 PRELIMINARY FINAL Evaluation of Geomorphic Effects of Removal of Marmot and Little Sandy Dams and Potential Impacts on Anadromous Salmonids Prepared for: Portland General Electric 121 SW Salmon Street
Lower South Fork McKenzie River Floodplain Enhancement Project
 Lower South Fork McKenzie River Floodplain Enhancement Project McKenzie River Ranger District Willamette National Forest Project Location The project is located in the South Fork McKenzie River Watershed,
CASE STUDIES. Introduction
 Introduction The City of Winston-Salem faces the challenge of maintaining public infrastructure (e.g., water and sewer lines, storm drains, roads, culverts and bridges) while minimizing the potential impacts
FUTURE MEANDER BEND MIGRATION AND FLOODPLAIN DEVELOPMENT PATTERNS NEAR RIVER MILES 241 TO 235, SACRAMENTO RIVER
 FUTURE MEANDER BEND MIGRATION AND FLOODPLAIN DEVELOPMENT PATTERNS NEAR RIVER MILES 241 TO 235, SACRAMENTO RIVER Eric W. Larsen University of California, Davis With the assistance of Evan Girvetz REPORT
Squaw Creek. General Information
 General Information is a tributary to the Salmon River. It enters the north side of the river about 0 miles downstream of North Fork, Idaho. The study reach is about a 30 ft length of stream about 2 miles
GLG362/GLG598 Geomorphology K. Whipple October, 2009 I. Characteristics of Alluvial Channels
 I. Characteristics of Alluvial Channels Self-formed morphology set by entrainment, transport, and deposition They move unconsolidated sedimentary materials present in the valley fill flood plain/bank flow
Implementing a Project with 319 Funds: The Spring Brook Meander Project. Leslie A. Berns
 Implementing a Project with 319 Funds: The Spring Brook Meander Project Leslie A. Berns "...to acquire... and hold lands... for the purpose of protecting and preserving the flora, fauna and scenic beauties...
Case Study 2: Twenty-mile Creek Rock Fords
 Case Study : Twenty-mile Creek Rock Fords Location Crossing Description Washington. Okanagan National Forest. Methow Valley Ranger District. Chewuch river basin, East Chewuch Road. The Twenty-mile Creek
Fluvial Driven Alluvial Fans
 Fluvial Driven Alluvial Fans Restoration Project Evaluations - Examples from the Russian and Napa River Watersheds Mia Docto Masters Thesis UC Berkeley 1. Basic Fan Description 2. Fluvial Driven Fan Characteristics
Opportunities to Improve Ecological Functions of Floodplains and Reduce Flood Risk along Major Rivers in the Puget Sound Basin
 Opportunities to Improve Ecological Functions of Floodplains and Reduce Flood Risk along Major Rivers in the Puget Sound Basin Christopher Konrad, US Geological Survey Tim Beechie, NOAA Fisheries Managing
Modeling Post-Development Runoff and Channel Impacts from Hydromodification: Practical Tools for Hydromodification Assessment
 Modeling Post-Development Runoff and Channel Impacts from Hydromodification: Practical Tools for Hydromodification Assessment Chris Bowles, Ph.D. Andy Collison, Ph.D. Matt Wickland, M.S. c.bowles@pwa-ltd.com
FUTURE MEANDER BEND MIGRATION AND FLOODPLAIN DEVELOPMENT PATTERNS NEAR RIVER MILES 200 TO 191 OF THE SACRAMENTO RIVER
 FUTURE MEANDER BEND MIGRATION AND FLOODPLAIN DEVELOPMENT PATTERNS NEAR RIVER MILES 200 TO 191 OF THE SACRAMENTO RIVER Eric W. Larsen University of California, Davis With the assistance of Evan Girvetz
3/3/2013. The hydro cycle water returns from the sea. All "toilet to tap." Introduction to Environmental Geology, 5e
 Introduction to Environmental Geology, 5e Running Water: summary in haiku form Edward A. Keller Chapter 9 Rivers and Flooding Lecture Presentation prepared by X. Mara Chen, Salisbury University The hydro
(3) Sediment Movement Classes of sediment transported
 Sediment Movement Classes of sediment transported") (3) Sediment Movement Classes of sediment transported Dissolved load Suspended (and wash load ) Important for scouring algae Bedload (5-10% total load Moves along bed during floods Source of crushing for
(3) Sediment Movement Classes of sediment transported Dissolved load Suspended (and wash load ) Important for scouring algae Bedload (5-10% total load Moves along bed during floods Source of crushing for
Section 4: Model Development and Application
 Section 4: Model Development and Application The hydrologic model for the Wissahickon Act 167 study was built using GIS layers of land use, hydrologic soil groups, terrain and orthophotography. Within
Field Observations and One-Dimensional Flow Modeling of Summit Creek in Mack Park, Smithfield, Utah
 Intermountain Center for River Rehabilitation and Restoration, Utah State University 31 July 2018 Field Observations and One-Dimensional Flow Modeling of Summit Creek in Mack Park, Smithfield, Utah I.
GEOL 652. Poudre River Fieldtrip
 GEOL 652. Poudre River Fieldtrip One of the more difficult variables to measure and/or estimate when studying flow in natural channels is that of roughness. Roughness, usually approximated with Manning
Hydraulics of bendway weirs
 River Basin Management IV 389 Hydraulics of bendway weirs C. Thornton 1, S. Abt 1, D. Baird 2 & R. Padilla 3 1 Colorado State University, Fort Collins, CO, USA 2 U.S. Bureau of Reclamation, Denver, CO,
Birch Creek Geomorphic Assessment and Action Plan
 Birch Creek Geomorphic Assessment and Action Plan Jim Webster Tim Hanrahan, PhD, CFM Jesse Schwartz, PhD Zach Hill January 22, 2015 White Eagle Grange This Project is a First Step in Strategy Planning
Coarse Sediment Augmentation on Regulated Rivers. Scott McBain McBain & Trush, Inc.
 Coarse Sediment Augmentation on Regulated Rivers Scott McBain McBain & Trush, Inc. scott@mcbaintrush.com Components Some geomorphic and ecological considerations Conceptual approach at understanding augmentation
LOMR SUBMITTAL LOWER NESTUCCA RIVER TILLAMOOK COUNTY, OREGON
 LOMR SUBMITTAL LOWER NESTUCCA RIVER TILLAMOOK COUNTY, OREGON Prepared for: TILLAMOOK COUNTY DEPARTMENT OF COMMUNITY DEVELOPMENT 1510-B THIRD STREET TILLAMOOK, OR 97141 Prepared by: 10300 SW GREENBURG ROAD,
Avoiding Geohazards in the Mid-Atlantic Highlands by Using Natural Stream Principles
 Avoiding Geohazards in the Mid-Atlantic Highlands by Using Natural Stream Principles J. Steven Kite, WVU Neal Carte, WVDOT Will Harman, Michael Baker Corp. Donald D. Gray, WVU Photo: W. Gillespie North
Rivers T. Perron
 1 Rivers T. Perron 12.001 After our discussions of large-scale topography, how we represent topography in maps, and how topography interacts with geologic structures, you should be frothing at the mouth
1 INTRODUCTION AND MAJOR FINDINGS... 1
 Memorandum To: Lindsey Clark, Stillwater Valley Watershed Council Coordinator From: Chad Raisland, Pioneer Technical Services, Inc. and Karin Boyd, Applied Geomorphology, Inc. CC: Tanya Lester, Stillwater
17-20 November 2007 Incidental Take Monitoring Methodology and Results
 Sample Site Selection Protocol 17-20 November 2007 Incidental Take Monitoring Methodology and Results On 16 November 2007, the U.S. Fish and Wildlife Service (USFWS) provided the USACE Mobile District
DETAILED DESCRIPTION OF STREAM CONDITIONS AND HABITAT TYPES IN REACH 4, REACH 5 AND REACH 6.
 DETAILED DESCRIPTION OF STREAM CONDITIONS AND HABITAT TYPES IN REACH 4, REACH 5 AND REACH 6. The Eklutna River was divided into study reaches (figure 1) prior to this site visit. Prominent geologic or
River Nith restoration, cbec UK Ltd, October 2013 APPENDIX A
 APPENDIX A FLUVIAL AUDIT METHOD STATEMENT Fluvial Audit Methodology INTRODUCTION The procedure used to characterize the geomorphic and sedimentary regimes of the River Till is an adaptation of the Fluvial
Big Wood River. General Information
 General Information The flows out of the southern portion of the Sawtooth National Recreation Area in central Idaho. The study reach is about a,200 ft length of river about.5 miles upstream from the discontinued
Appendix K.2: Sediment Management Excerpt from South Orange County Hydromodification Management Plan
 Appendix K.2: Sediment Management Excerpt from South Orange County Hydromodification Management Plan 4 Sediment Supply Management Requirements Permit Order R9-2013-0001 as amended by Order No. R9-2015-0001Section
Columbia Estuary Province
 Rolling Provincial Review: Implementation 2001-2004 Province 73 Columbia Basin Fish & Wildlife Authority Province FY 2001-2004 Spending Summaries NPCC Recommendations and BPA Spending by Project Category,
Riparian Assessment. Steps in the right direction... Drainage Basin/Watershed: Start by Thinking Big. Riparian Assessment vs.
 Riparian Assessment vs. Monitoring Riparian Assessment What is a healthy stream? Determine stream/riparian health Determine change or trend, especially in response to mgmt Classification = designation
Limitation to qualitative stability indicators. the real world is a continuum, not a dichotomy ~ 100 % 30 % ~ 100 % ~ 40 %
 Stream Stability Assessment & BEHI Surveys Joe Rathbun MDEQ Water Resources Division rathbunj@michigan.gov 517--373 517 373--8868 Stability Stream can transport its water and sediment inputs without changing
GEOMORPHIC CHANGES IN LOWER CACHE CREEK 2012
 GEOMORPHIC CHANGES IN LOWER CACHE CREEK 2012 Eric W. Larsen Technical Memorandum Prepared for Cache Creek Technical Advisory Committee Natural Resources Program Yolo County Board of Supervisors 2012 Prepared
GLG598 Surface Processes and Landform Evolution K. Whipple Fall 2012 VERDE RIVER: FLOW MECHANICS, ROUGHNESS, AND SHEAR STRESS
 VERDE RIVER: FLOW MECHANICS, ROUGHNESS, AND SHEAR STRESS This lab will introduce you to some common field techniques and some general understanding of the geomorphic processes operating in a stream. The
Aquifer an underground zone or layer of sand, gravel, or porous rock that is saturated with water.
 Aggradation raising of the streambed by deposition that occurs when the energy of the water flowing through a stream reach is insufficient to transport sediment conveyed from upstream. Alluvium a general
SELBY CREEK STREAM HABITAT RESTORATION AND RIPARIAN REVEGETATION PROJECT: GEOMORPHIC ANALYSIS AND REVIEW
 SELBY CREEK STREAM HABITAT RESTORATION AND RIPARIAN REVEGETATION PROJECT: GEOMORPHIC ANALYSIS AND REVIEW Submitted to Bioengineering Institute P.O. Box 1554 Laytonville, CA 95454 By Matthew O Connor, PhD,
CR AAO Bridge. Dead River Flood & Natural Channel Design. Mitch Koetje Water Resources Division UP District
 CR AAO Bridge Dead River Flood & Natural Channel Design Mitch Koetje Water Resources Division UP District Old County Road AAO Bridge Map courtesy of Marquette County Silver Lake Basin McClure Basin
LAR BPWG. DWR Erosion Screening Process Application to LAR. May 17, water resource specialists
 LAR BPWG DWR Erosion Screening Process Application to LAR May 17, 2016 Presentation Outline Review of Erosion Screening Process Modifications for LAR Application ESP LAR Results Recommendations ESP Background
Fluvial Geomorphic Guidelines
 Fluvial Geomorphic Guidelines FACT SHEET I: GEOMORPHOLOGICAL HAZARDS CONFINED AND UNCONFINED WATERCOURSES Channel migration and erosion can create substantial risk to inappropriately located infrastructure
Updated Fluvial Geomorphology Modeling Approach
 (FERC No. 14241) Updated Fluvial Geomorphology Modeling Approach Technical Memorandum Prepared for Prepared by Tetra Tech Original Submitted June 30, 2013 Updated May 2014 Page intentionally left blank
APPENDIX E. GEOMORPHOLOGICAL MONTORING REPORT Prepared by Steve Vrooman, Keystone Restoration Ecology September 2013
 APPENDIX E GEOMORPHOLOGICAL MONTORING REPORT Prepared by Steve Vrooman, Keystone Restoration Ecology September 2 Introduction Keystone Restoration Ecology (KRE) conducted geomorphological monitoring in
Stream Simulation: A Simple Example
 Stream Simulation: A Simple Example North Thompson Creek, CO Paul T. Anderson U.S.D.A. Forest Service Here s How We Started May 2011 2-1 USDA-Forest Service Here s How We Finished Forest Service Aquatic
STUDY PERFORMANCE REPORT
 STUDY PERFORMANCE REPORT State: Michigan Project No.: F-80-R-8 Study No.: 230702 Title: Effects of sediment traps on Michigan river channels Period Covered: October 1, 2006 to September 30, 2007 Study
Strategies for managing sediment in dams. Iwona Conlan Consultant to IKMP, MRCS
 Strategies for managing sediment in dams Iwona Conlan Consultant to IKMP, MRCS 1 Sediment trapping by dams Active storage capacity Dead storage coarse material (bed load) Fine materials (suspension) Francis
Upper Mississippi River Basin Environmental Management Program Workshop
 Presentation to the Upper Mississippi River Basin Environmental Management Program Workshop by Michael Rodgers River Engineer US Army Corps of Engineers, St. Louis District August 17, 2007 Engineering
Dan Miller + Kelly Burnett, Kelly Christiansen, Sharon Clarke, Lee Benda. GOAL Predict Channel Characteristics in Space and Time
 Broad-Scale Models Dan Miller + Kelly Burnett, Kelly Christiansen, Sharon Clarke, Lee Benda GOAL Predict Channel Characteristics in Space and Time Assess Potential for Fish Use and Productivity Assess
Dealing with Zone A Flood Zones. Topics of Discussion. What is a Zone A Floodplain?
 Dealing with Zone A Flood Zones Topics of Discussion Overview of Zone A Floodplains Permitting Development in Zone A Floodplains Estimating Flood Elevations in Zone A Flood Insurance Implications Letters
STREAM RESTORATION AWRA Summer Specialty Conference, GIS and Water Resources IX
 STREAM RESTORATION 2016 AWRA Summer Specialty Conference, GIS and Water Resources IX Innovative Use of 2D Hydraulic Modeling in Stream Restoration Design Presented by: Li Gao, PE and Robert Scrafford,
Kaskaskia Morphology Study Headwaters to Lake Shelbyville
 Kaskaskia Morphology Study Headwaters to Lake Shelbyville KWA Mini Summit 5 March 2012 1 Kaskaskia Morphology Study Headwaters to Lake Shelbyville Conducted by U.S. Army Corps of Engineers, St. Louis District
NATURE OF RIVERS B-1. Channel Function... ALLUVIAL FEATURES. ... to successfully carry sediment and water from the watershed. ...dissipate energy.
 1 2 Function... Sevier River... to successfully carry sediment and water from the watershed....dissipate energy. 3 ALLUVIAL FEATURES 4 CHANNEL DIMENSION The purpose of a stream is to carry water and sediment