Air sea temperature decoupling in western Europe during the last interglacial glacial transition
|
|
|
- Rosamund Murphy
- 5 years ago
- Views:
Transcription
1 María Fernanda Sánchez Goñi, Edouard Bard, Amaelle Landais, Linda Rossignol, Francesco d Errico SUPPLEMENTARY INFORMATION DOI: /NGEO1924 Air sea temperature decoupling in western Europe during the last interglacial glacial transition Supplementary Information Present-day environmental setting At present, the western European margin is primarily affected by the strength and direction of the northwesterlies and the North Atlantic subtropical gyre dynamic 1. The western Iberian margin is locally influenced in summer by upwelling events that generate a southward surface circulation while downwelling in winter develops a northward surface circulation 2-3. At latitudes above 40 N, the atmospheric configuration results in year-round wet climate, with annual precipitation at ~1000 mm, and a mean annual temperature of 10 C allowing for the development of the Atlantic mixed Quercus (oak) forest 4. In southwestern Iberia, between 36 and 40 N, precipitation is concentrated in autumn and winter (Pann<600 mm). Cool winters (minimal winter temperatures ranging between 5 and - 1 C) and hot, dry summers promote the development of Mediterranean forest. Modern sea surface conditions along the western European margin between 37 N and 45 N are characterized by mean annual temperatures ranging from 18 C to 14.5 C, respectively. Table S1 Stratigraphic events identified by 5-6 and dated after Svensson et al., 2008, Shackleton et al., 2000 and 2003, Sanchez Goñi et al., 2012 used to: a) develop the linear interpolation model of core MD , and b) the age models of the other western NATURE GEOSCIENCE 1
2 European margin cores. These chronologies are based on the correlation of identified and dated forest increases in MD to the same identified forest increases in cores MD and MD a Event stratigraphy Reference MD References Depth (cm) D-O 12* Shackleton et al., Svensson et al., D-O 14* Shackleton et al., Svensson et al., D-O 17* Shackleton et al., Svensson et al., MIS 5a lightest value Shackleton et al Shackleton et al., 2000, MIS 5e/5d Shackleton et al Sanchez Goñi et al., Age ka b Event stratigraphy MD Age ka MD MD Depth (cm) Depth (cm) Depth (cm) Forest increase (D-O 12) Forest increase (D-O 14) Forest increase (D-O 17) HS 6 (strong N. pachyderma (s) increase) Forest increase (Stadial II/Ognon II) Forest increase (Stadial I/Ognon I) Forest increase (Mélisey II/St Germain II) Forest decrease (St Germain 1c/Mélisey II) Figure S1 Comparison of a) summer and winter foraminifera-based SST records and the percentage curve of subtropical and temperate planktonic foraminifera with b) pollen percentage records of different taxa from core MD retrieved in the Bay of Biscay. Grey bands indicate warm/temperate phases in western France. The clear identification of 2

3 the Ognon II Interstadial after the abrupt increase of the Atlantic forest pollen percentages demonstrates that this interstadial is a real climate event and not the result of pollen reworking as previously suggested 7. HS 6 indicate Heinrich Stadial 6. Grey bands indicate warm phases. 3
4 Figure S2 Constrained Correspondence Analysis (CCA) showing the sample scores on the ordination space for the pollen record of core MD and using foraminifera-based summer (jas) SST as constraining variable. The CCA between the five main pollen ecological groups, Atlantic forest, Picea, Abies, Ericaceae (heathlands), grasslands and semi-desert, and, using summer SST as constraining variables statistically confirmed our observations. Numbers refer to sample ages in thousands of years (ka). 4
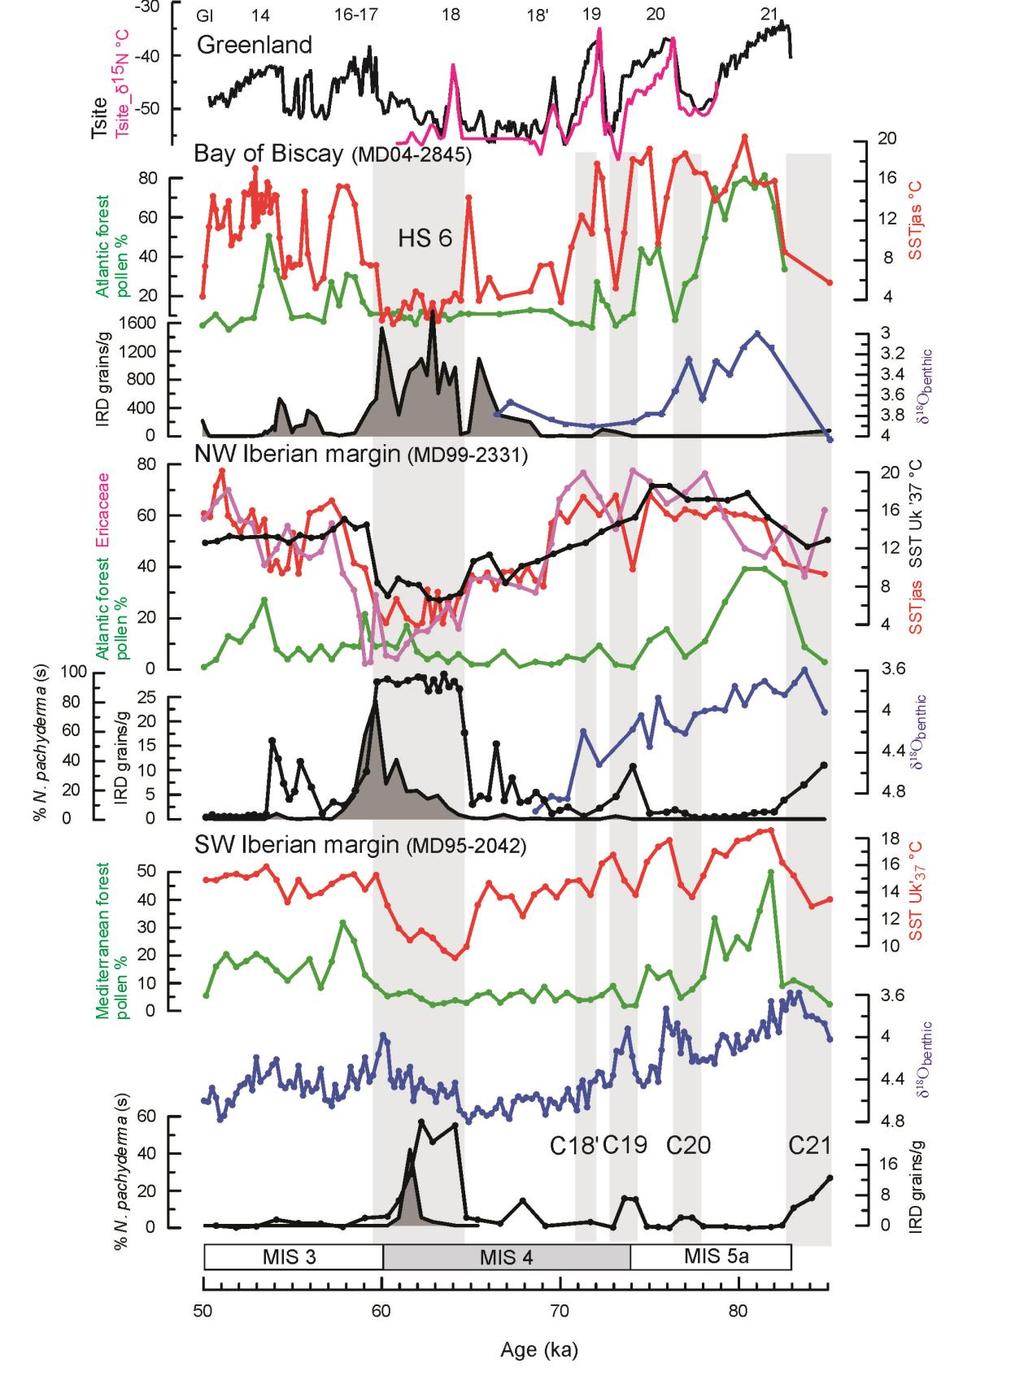
5 Figure S3 a) Temperature record of Greenland 8-10 compared with the western European margin palaeoclimatic records for the interval ka: b) M (Bay of Biscay): Atlantic forest pollen percentages, foraminifera-based SST, benthic foraminifera δ 18 O and IRD concentrations (grey surface), c) MD (northwestern Iberian margin): Atlantic forest and Ericaceae (heathlands) pollen percentages, foraminifera- and Uk 37 -based SST, benthic foraminifera δ 18 O, IRD concentrations (grey surface) and N. pachyderma (s) percentages (black line). Note the tight correlation between the Ericaceae and the foraminifera-based SST records that show heathland expansion at the expense of the Atlantic forest contraction when SST are relatively warm, higher than 9 C in summer, and e) MD (southwestern Iberian margin): pollen percentages, Uk 37 -based SST, benthic foraminifera δ 18 O, IRD concentrations (grey surface) and N. pachyderma (s) percentages (black line). The onset of HS (Heinrich Stadial) 6 in the south westernmost site is marked by the strong increase in N. pachyderma (s). C19 is marked by the slight occurrence of IRD in the northern cores. MIS refers to Marine Isotopic Stages. 5
6 6
7 Figure S4 Comparison between summer SST reconstruction curves for core MD This figure shows no substantial differences between the two curves apart from a tendency of SIMMAX (green line) to smooth SST between 80 and 73 ka. The SIMMAX SST estimates fully confirm persistent warm conditions in the Bay of Biscay during the MIS5e/4 transition. We have used MAT (black line) instead of SIMMAX because it has been shown that the former accurately reconstruct SST 11. 7
8 References 1 Hurrell, J. W. Decadal trends in the North Atlantic Oscillation : regional temperatures and precipitation. Science 269, (1995). 2 Fiúza, A. F. d. G., Macedo, M. E. d. & Guerreiro, M. R. Climatological space and time variation of the Portuguese coastal upwelling. Oceanologica Acta 5, (1982). 3 Frouin, R., Fiúza, A. F. G., Ambar, I. & Boyd, T. J. Observations of a poleward surface current off the coasts of Portugal and Spain during winter. Journal of Geophysical Research 95, (1990). 4 Ozenda, P. Les végétaux dans la biosphère. (Doin, 1982). 5 Shackleton, N. J., Sanchez Goñi, M. F., Pailler, D. & Lancelot, Y. Marine Isotope Substage 5e and the Eemian Interglacial. Global and Planetary Change 757, 1-5 (2003). 6 Shackleton, N. J., Fairbanks, R. G., Chiu, T. & Parrenin, F. Absolute calibration of the Greenland time scale: implications for Antarctic time scales and for Δ14C. Quaternary Science Reviews 23, (2004). 7 Keigwin, L. D., Curry, W. B., Lehman, S. J. & Johnsen, S. The role of the deep ocean in North Atlantic climate change between 70 and 130 kyr ago. Nature 371, (1994). 8 Huber, C. et al. Isotope calibrated Greenland temperature record over Marine Isotope Stage 3 and its relation to CH4. Earth and Planetary Science Letters 243, (2006). 9 Landais, A. et al. A continuous record of temperature evolution over a whole sequence of Dansgaard-Oeschger during Marine Isotopic Stage 4 (76 to 62 kyr BP). Geophysical Research Letters 31 (L22211), , doi:doi: /2004GL (2004). 10 Capron, E. et al. Millennial and sub-millennial scale climatic variations recorded in polar ice cores over the last glacial period. The Climate of the Past 6, (2010). 11 Guiot, J., de Vernal, A. In Hillaire-Marcel and de Vernal (eds.) Proxies in Late Cenozoic Paleoceanography, Elsevier, pp (2007). 8
In the new age model developed for MD , vegetation-derived climatic phases
 GSA DATA REPOSITORY 2012185 Sánchez Goñi et al. 1 2 3 4 5 6 7 8 9 10 11 12 13 14 SUPPLEMENTAL INFORMATION Methods Age model In the new age model developed for MD04-2845, vegetation-derived climatic phases
SUPPLEMENTARY INFORMATION
 SUPPLEMENTARY INFORMATION Supplementary Materials and Methods Stable isotope analyses Where possible two or three separate analyses of different benthic species were made in each sample; a correction factor
Muted change in Atlantic overturning circulation over some glacial-aged Heinrich events
 SUPPLEMENTARY INFORMATION DOI: 10.1038/NGEO2045 Muted change in Atlantic overturning circulation over some glacial-aged Heinrich events Jean Lynch-Stieglitz 1, Matthew W. Schmidt 2, L. Gene Henry 1,7,
Ocean & climate: an introduction and paleoceanographic perspective
 Ocean & climate: an introduction and paleoceanographic perspective Edouard BARD Chaire de l évolution du climat et de l'océan du Collège de France CEREGE, UMR CNRS, AMU, IRD, CdF Aix-en-Provence The ocean
The Tswaing Impact Crater, South Africa: derivation of a long terrestrial rainfall record for the southern mid-latitudes
 The Tswaing Impact Crater, South Africa: derivation of a long terrestrial rainfall record for the southern mid-latitudes T.C. PARTRIDGE Climatology Research Group, University of the Witwatersrand, Johannesburg,
Chapter 15 Millennial Oscillations in Climate
 Chapter 15 Millennial Oscillations in Climate This chapter includes millennial oscillations during glaciations, millennial oscillations during the last 8000 years, causes of millennial-scale oscillations,
M. Wary et al. Correspondence to: M. Wary
 Supplement of Clim. Past, 11, 1507 1525, 2015 http://www.clim-past.net/11/1507/2015/ doi:10.5194/cp-11-1507-2015-supplement Author(s) 2015. CC Attribution 3.0 License. Supplement of Stratification of surface
/ Past and Present Climate
 MIT OpenCourseWare http://ocw.mit.edu 12.842 / 12.301 Past and Present Climate Fall 2008 For information about citing these materials or our Terms of Use, visit: http://ocw.mit.edu/terms. Ice Sheet Paleoclimatology
SUPPLEMENTARY INFORMATION
 SUPPLEMENTARY INFORMATION DOI: 1.138/NGEO168 "Strength and geometry of the glacial Atlantic Meridional Overturning Circulation" S2 Map of core locations Core locations of the Holocene and LGM 231 / 23
6. What has been the most effective erosive agent in the climate system? a. Water b. Ice c. Wind
 Multiple Choice. 1. Heinrich Events a. Show increased abundance of warm-water species of planktic foraminifera b. Show greater intensity since the last deglaciation c. Show increased accumulation of ice-rafted
JEAN-CLAUDE DUPLESSY, MAURICE ARNOLD, EDOUARD BARD, ANNE JUILLET-LECLERC, NEJIB KALLEL
 [RADIOCARBON, VOL 31, No. 3, 1989, P 493-521 AMS 14C STUDY OF TRANSIENT EVENTS AND OF THE VENTILATION RATE OF THE PACIFIC INTERMEDIATE WATER DURING THE LAST DEGLACIATION JEAN-CLAUDE DUPLESSY, MAURICE ARNOLD,
Development of the Global Environment
 Development of the Global Environment G302: Spring 2004 A course focused on exploration of changes in the Earth system through geological history Simon C. Brassell Geological Sciences simon@indiana.edu
A multi-proxy study of planktonic foraminifera to identify past millennialscale. climate variability in the East Asian Monsoon and the Western Pacific
 This pdf file consists of all pages containing figures within: A multi-proxy study of planktonic foraminifera to identify past millennialscale climate variability in the East Asian Monsoon and the Western
ATOC OUR CHANGING ENVIRONMENT
 ATOC 1060-002 OUR CHANGING ENVIRONMENT Class 22 (Chp 15, Chp 14 Pages 288-290) Objectives of Today s Class Chp 15 Global Warming, Part 1: Recent and Future Climate: Recent climate: The Holocene Climate
The North Atlantic Oscillation: Climatic Significance and Environmental Impact
 1 The North Atlantic Oscillation: Climatic Significance and Environmental Impact James W. Hurrell National Center for Atmospheric Research Climate and Global Dynamics Division, Climate Analysis Section
Ruddiman CHAPTER 13. Earth during the LGM ca. 20 ka BP
 Ruddiman CHAPTER 13 Earth during the LGM ca. 20 ka BP The Last Glacial Maximum When? How much more ice than today? How much colder was it than today (global average)? How much lower were snowlines? Did
ABRUPT CLIMATIC CHANGES AND DEEP WATER CIRCULATION IN THE NORTH ATLANTIC
 ABRUPT CLIMATIC CHANGES AND DEEP WATER CIRCULATION IN THE NORTH ATLANTIC Carlo Laj and Catherine Kissel Laboratoire des Sciences du Climat et de l Environnement Gif-sur-Yvette, France How fast did scientists
D.D. Rousseau!,+,, G. Kukla$ & J. McManus*
 View point What is what in the ice and the ocean? D.D. Rousseau!,+,, G. Kukla$ & J. McManus*! Université Montpellier II, Institut des Sciences de l'evolution, UMR CNRS-UM2 5554, case 61, place E. Bataillon,
Introduction to Quaternary Geology (MA-Modul 3223) Prof. C. Breitkreuz, SS2012, TU Freiberg
 Prof. C. Breitkreuz, SS2012, TU Freiberg") Introduction to Quaternary Geology (MA-Modul 3223) Prof. C. Breitkreuz, SS2012, TU Freiberg 1. Introduction: - Relevance, and relations to other fields of geoscience - Lower stratigraphic boundary and
Introduction to Quaternary Geology (MA-Modul 3223) Prof. C. Breitkreuz, SS2012, TU Freiberg 1. Introduction: - Relevance, and relations to other fields of geoscience - Lower stratigraphic boundary and
Supplementary Figure 1. New downcore data from this study. Triangles represent the depth of radiocarbon dates. Error bars represent 2 standard error
 Supplementary Figure 1. New downcore data from this study. Triangles represent the depth of radiocarbon dates. Error bars represent 2 standard error of measurement (s.e.m.). 1 Supplementary Figure 2. Particle
Speleothems and Climate Models
 Earth and Life Institute Georges Lemaître Centre for Earth and Climate Research Université catholique de Louvain, Belgium Speleothems and Climate Models Qiuzhen YIN Summer School on Speleothem Science,
Rapid climate change in ice cores
 Rapid climate change in ice cores Liz Thomas British Antarctic Survey Overview Introduction to ice cores Evidence of rapid climate change in the Greenland ice cores DO events Younger Dryas 8.2 kyr cold
Proxy-based reconstructions of Arctic paleoclimate
 Proxy-based reconstructions of Arctic paleoclimate TODAY THE PAST Boothia Peninsula, Nunavut Prof. Sarah Finkelstein Earth Sciences, University of Toronto Finkelstein@es.utoronto.ca Outline Why does climate
Welcome to ATMS 111 Global Warming.
 Welcome to ATMS 111 Global Warming http://www.atmos.washington.edu/2010q1/111 Isotopic Evidence 16 O isotopes "light 18 O isotopes "heavy" Evaporation favors light Rain favors heavy Cloud above ice is
Rapid Climate Change: Heinrich/Bolling- Allerod Events and the Thermohaline Circulation. By: Andy Lesage April 13, 2010 Atmos.
 Rapid Climate Change: Heinrich/Bolling- Allerod Events and the Thermohaline Circulation By: Andy Lesage April 13, 2010 Atmos. 6030 Outline Background Heinrich Event I/Bolling-Allerod Transition (Liu et
North Pacific Climate Overview N. Bond (UW/JISAO), J. Overland (NOAA/PMEL) Contact: Last updated: September 2008
, J. Overland (NOAA/PMEL) Contact: Last updated: September 2008") North Pacific Climate Overview N. Bond (UW/JISAO), J. Overland (NOAA/PMEL) Contact: Nicholas.Bond@noaa.gov Last updated: September 2008 Summary. The North Pacific atmosphere-ocean system from fall 2007
North Pacific Climate Overview N. Bond (UW/JISAO), J. Overland (NOAA/PMEL) Contact: Nicholas.Bond@noaa.gov Last updated: September 2008 Summary. The North Pacific atmosphere-ocean system from fall 2007
Climate Chapter 19. Earth Science, 10e. Stan Hatfield and Ken Pinzke Southwestern Illinois College
 Climate Chapter 19 Earth Science, 10e Stan Hatfield and Ken Pinzke Southwestern Illinois College The climate system A. Climate is an aggregate of weather B. Involves the exchanges of energy and moisture
Climate and Environment
 Climate and Environment Oxygen Isotope Fractionation and Measuring Ancient Temperatures Oxygen Isotope Ratio Cycles Oxygen isotope ratio cycles are cyclical variations in the ratio of the mass of oxygen
isopycnal outcrop w < 0 (downwelling), v < 0 L.I. V. P.
, v < 0 L.I. V. P.") Ocean 423 Vertical circulation 1 When we are thinking about how the density, temperature and salinity structure is set in the ocean, there are different processes at work depending on where in the water
Ocean 423 Vertical circulation 1 When we are thinking about how the density, temperature and salinity structure is set in the ocean, there are different processes at work depending on where in the water
Geochemical fingerprints of the ice-age (Southern) Ocean
 Ocean") Geochemical fingerprints of the ice-age (Southern) Ocean THE SOUTHERN OCEAN, ITS DYNAMICS, BIOGEOCHEMISTRY AND ROLE IN THE CLIMATE SYSTEM NCAR, Boulder, CO 10-13 April 2017 Bob Anderson Motivation: Ice
Geochemical fingerprints of the ice-age (Southern) Ocean THE SOUTHERN OCEAN, ITS DYNAMICS, BIOGEOCHEMISTRY AND ROLE IN THE CLIMATE SYSTEM NCAR, Boulder, CO 10-13 April 2017 Bob Anderson Motivation: Ice
North Atlantic ocean circulation and abrupt climate change during the last glaciation
 1 2 3 4 5 6 7 8 9 North Atlantic ocean circulation and abrupt climate change during the last glaciation Authors: L. G. Henry 1*, J. F. McManus 1, W. B. Curry 2,3, N. L. Roberts 4, A. M. Piotrowski 4, L.
Today s Climate in Perspective: Hendrick Avercamp ( ) ~1608; Rijksmuseum, Amsterdam
 ~1608; Rijksmuseum, Amsterdam") Today s Climate in Perspective: Paleoclimate Evidence Hendrick Avercamp (1585-1634) ~1608; Rijksmuseum, Amsterdam Observations Instrumental surface temperature records? (Le Treut et al., 2007 IPCC AR4
Today s Climate in Perspective: Paleoclimate Evidence Hendrick Avercamp (1585-1634) ~1608; Rijksmuseum, Amsterdam Observations Instrumental surface temperature records? (Le Treut et al., 2007 IPCC AR4
Energy Systems, Structures and Processes Essential Standard: Analyze patterns of global climate change over time Learning Objective: Differentiate
 Energy Systems, Structures and Processes Essential Standard: Analyze patterns of global climate change over time Learning Objective: Differentiate between weather and climate Global Climate Focus Question
Modes of Global Climate Variability during Marine Isotope Stage 3 (60 26 ka)
") 15 MARCH 2010 P I S I A S E T A L. 1581 Modes of Global Climate Variability during Marine Isotope Stage 3 (60 26 ka) NICKLAS G. PISIAS College of Oceanic and Atmospheric Sciences, Oregon State University,
15 MARCH 2010 P I S I A S E T A L. 1581 Modes of Global Climate Variability during Marine Isotope Stage 3 (60 26 ka) NICKLAS G. PISIAS College of Oceanic and Atmospheric Sciences, Oregon State University,
We re living in the Ice Age!
 Chapter 18. Coping with the Weather: Causes and Consequences of Naturally Induce Climate Change 지구시스템의이해 We re living in the Ice Age! 1 Phanerozoic Climate 서늘해지고 더웠고 따뜻했고 3 Climate Rollercoaster 4 2 Time
Module 11: Meteorology Topic 3 Content: Climate Zones Notes
 Introduction Latitude is such an important climate factor that you can make generalizations about a location's climate based on its latitude. Areas near the equator or the low latitudes are generally hot
Climate Roles of Land Surface
 Lecture 5: Land Surface and Cryosphere (Outline) Climate Roles Surface Energy Balance Surface Water Balance Sea Ice Land Ice (from Our Changing Planet) Surface Albedo Climate Roles of Land Surface greenhouse
Surface and Deep Ocean Circulation in the Subpolar North Atlantic During the Mid- Pleistocene Revolution
 University of South Florida Scholar Commons Marine Science Faculty Publications College of Marine Science 12-18-2002 Surface and Deep Ocean Circulation in the Subpolar North Atlantic During the Mid- Pleistocene
16 Global Climate. Learning Goals. Summary. After studying this chapter, students should be able to:
 16 Global Climate Learning Goals After studying this chapter, students should be able to: 1. associate the world s six major vegetation biomes to climate (pp. 406 408); 2. describe methods for classifying
Loess and dust. Jonathan A. Holmes Environmental Change Research Centre
 Loess and dust Jonathan A. Holmes Environmental Change Research Centre Why is dust important? Mineral dust is an important constituent of the solid load in Earth's atmosphere, the total atmospheric aerosol
Paleoclimatology ATMS/ESS/OCEAN 589. Abrupt Climate Change During the Last Glacial Period
 Paleoclimatology ATMS/ESS/OCEAN 589 Ice Age Cycles Are they fundamentaly about ice, about CO2, or both? Abrupt Climate Change During the Last Glacial Period Lessons for the future? The Holocene Early Holocene
Lecture 0 A very brief introduction
 Lecture 0 A very brief introduction Eli Tziperman Climate variability results from a very diverse set of physical phenomena and occurs on a very wide range of time scales. It is difficult to envision a
Weather & Ocean Currents
 Weather & Ocean Currents Earth is heated unevenly Causes: Earth is round Earth is tilted on an axis Earth s orbit is eliptical Effects: Convection = vertical circular currents caused by temperature differences
Orbital-Scale Interactions in the Climate System. Speaker:
 Orbital-Scale Interactions in the Climate System Speaker: Introduction First, many orbital-scale response are examined.then return to the problem of interactions between atmospheric CO 2 and the ice sheets
The Distribution of Cold Environments
 The Distribution of Cold Environments Over 25% of the surface of our planet can be said to have a cold environment, but defining what we actually mean by that can be very challenging. This is because cold
1. Deglacial climate changes
 Review 3 Major Topics Deglacial climate changes (last 21,000 years) Millennial oscillations (thousands of years) Historical Climate Change (last 1000 years) Climate Changes Since the 1800s Climate Change
Mechanisms for an 7-kyr Climate and Sea-Level Oscillation During Marine Isotope Stage 3
 GM01073_CH15.qxd 9/8/07 8:25 AM Page 209 Mechanisms for an 7-kyr Climate and Sea-Level Oscillation During Marine Isotope Stage 3 Peter U. Clark 1, Steven W. Hostetler 2, Nicklas G. Pisias 3, Andreas Schmittner
Land Surface Sea Ice Land Ice. (from Our Changing Planet)
") Lecture 5: Land Surface and Cryosphere (Outline) Land Surface Sea Ice Land Ice (from Our Changing Planet) Earth s s Climate System Solar forcing Atmosphere Ocean Land Solid Earth Energy, Water, and Biochemistry
Lecture 5: Land Surface and Cryosphere (Outline) Land Surface Sea Ice Land Ice (from Our Changing Planet) Earth s s Climate System Solar forcing Atmosphere Ocean Land Solid Earth Energy, Water, and Biochemistry
Earth s Climate System. Surface Albedo. Climate Roles of Land Surface. Lecture 5: Land Surface and Cryosphere (Outline) Land Surface Sea Ice Land Ice
 Land Surface Sea Ice Land Ice") Lecture 5: Land Surface and Cryosphere (Outline) Earth s Climate System Solar forcing Land Surface Sea Ice Land Ice Atmosphere Ocean Land Solid Earth Energy, Water, and Biochemistry Cycles (from Our Changing
Lecture 5: Land Surface and Cryosphere (Outline) Earth s Climate System Solar forcing Land Surface Sea Ice Land Ice Atmosphere Ocean Land Solid Earth Energy, Water, and Biochemistry Cycles (from Our Changing
Tropical Moist Rainforest
 Tropical or Lowlatitude Climates: Controlled by equatorial tropical air masses Tropical Moist Rainforest Rainfall is heavy in all months - more than 250 cm. (100 in.). Common temperatures of 27 C (80 F)
Iberian Margin sea surface temperature during MIS 15 to 9 ( ka): Glacial suborbital variability versus interglacial stability
: Glacial suborbital variability versus interglacial stability") PALEOCEANOGRAPHY, VOL. 26,, doi:10.1029/2010pa001927, 2011 Iberian Margin sea surface temperature during MIS 15 to 9 (580 300 ka): Glacial suborbital variability versus interglacial stability T. Rodrigues,
PALEOCEANOGRAPHY, VOL. 26,, doi:10.1029/2010pa001927, 2011 Iberian Margin sea surface temperature during MIS 15 to 9 (580 300 ka): Glacial suborbital variability versus interglacial stability T. Rodrigues,
Lecture Outlines PowerPoint. Chapter 20 Earth Science 11e Tarbuck/Lutgens
 Lecture Outlines PowerPoint Chapter 20 Earth Science 11e Tarbuck/Lutgens 2006 Pearson Prentice Hall This work is protected by United States copyright laws and is provided solely for the use of instructors
Climate Change 2007: The Physical Science Basis
 Climate Change 2007: The Physical Science Basis Working Group I Contribution to the IPCC Fourth Assessment Report Presented by R.K. Pachauri, IPCC Chair and Bubu Jallow, WG 1 Vice Chair Nairobi, 6 February
Supplemental Information for. Persistent intermediate water warming during cold stadials in the SE Nordic seas. during the last 65 kyr
 GSA DATA REPOSITORY2014248 Supplemental Information for Persistent intermediate water warming during cold stadials in the SE Nordic seas during the last 65 kyr By Mohamed M. Ezat, Tine L. Rasmussen, Jeroen
Ice on Earth: An overview and examples on physical properties
 Ice on Earth: An overview and examples on physical properties - Ice on Earth during the Pleistocene - Present-day polar and temperate ice masses - Transformation of snow to ice - Mass balance, ice deformation,
Natural and anthropogenic climate change Lessons from ice cores
 Natural and anthropogenic climate change Lessons from ice cores Eric Wolff British Antarctic Survey, Cambridge ewwo@bas.ac.uk ASE Annual Conference 2011; ESTA/ESEU lecture Outline What is British Antarctic
3. Climate Change. 3.1 Observations 3.2 Theory of Climate Change 3.3 Climate Change Prediction 3.4 The IPCC Process
 3. Climate Change 3.1 Observations 3.2 Theory of Climate Change 3.3 Climate Change Prediction 3.4 The IPCC Process 3.1 Observations Need to consider: Instrumental climate record of the last century or
Chapter outline. Reference 12/13/2016
 Chapter 2. observation CC EST 5103 Climate Change Science Rezaul Karim Environmental Science & Technology Jessore University of science & Technology Chapter outline Temperature in the instrumental record
North Atlantic Deep Water and Climate Variability During the Younger Dryas Cold Period A.C. Elmore and J.D. Wright
 GSA DATA REPOSITORY 2011052 North Atlantic Deep Water and Climate Variability During the Younger Dryas Cold Period A.C. Elmore and J.D. Wright APPENDIX 1: Methods Data Methods: Jumbo piston core 11JPC
Our climate system is based on the location of hot and cold air mass regions and the atmospheric circulation created by trade winds and westerlies.
 CLIMATE REGIONS Have you ever wondered why one area of the world is a desert, another a grassland, and another a rainforest? Or have you wondered why are there different types of forests and deserts with
Ice core-based climate research in Denmark
 June 16, 2009 Ice core-based climate research in Denmark Sune Olander Rasmussen Center coordinator and postdoc Centre for Ice and Climate Niels Bohr Institute University of Copenhagen Temperature and CO
forest tropical jungle swamp marsh prairie savanna pampas Different Ecosystems (rainforest)
") Different Ecosystems forest A region of land that is covered with many trees and shrubs. tropical jungle (rainforest) swamp A region with dense trees and a variety of plant life. It has a tropical climate.
Different Ecosystems forest A region of land that is covered with many trees and shrubs. tropical jungle (rainforest) swamp A region with dense trees and a variety of plant life. It has a tropical climate.
SUPPLEMENTARY INFORMATION
 In the format provided by the authors and unedited. SUPPLEMENTARY INFORMATION DOI: 10.1038/NGEO2891 Warm Mediterranean mid-holocene summers inferred by fossil midge assemblages Stéphanie Samartin, Oliver
APPENDIX B PHYSICAL BASELINE STUDY: NORTHEAST BAFFIN BAY 1
 APPENDIX B PHYSICAL BASELINE STUDY: NORTHEAST BAFFIN BAY 1 1 By David B. Fissel, Mar Martínez de Saavedra Álvarez, and Randy C. Kerr, ASL Environmental Sciences Inc. (Feb. 2012) West Greenland Seismic
Ocean cycles and climate ENSO, PDO, AMO, AO
 Ocean cycles and climate ENSO, PDO, AMO, AO 3 2.5 2 enso-index 1.5 1 0.5 0-0.5-1 enso 3.4 -index - 1996 to 1999-1.5 1996 1997 1998 1999 Bob Tisdale Bob Tisdale Bob Tisdale ENSO mechanisms animation http://esminfo.prenhall.com/science/geoanimations/animations/26_ninonina.html
SUPPLEMENTARY INFORMATION
 SUPPLEMENTARY INFORMATION doi: 10.108/ngeo75 This section includes additional information for the model parameters as well as the results of a set of sensitivity experiments to illustrate the dependence
Ocean oxygen isotope constraints on mechanisms for millennial-scale climate variability
 PALEOCEANOGRAPHY, VOL. 20,, doi:10.1029/2004pa001063, 2005 Ocean oxygen isotope constraints on mechanisms for millennial-scale climate variability Steffen Malskær Olsen Danish Meteorological Institute,
Ice Ages and Changes in Earth s Orbit. Topic Outline
 Ice Ages and Changes in Earth s Orbit Topic Outline Introduction to the Quaternary Oxygen isotopes as an indicator of ice volume Temporal variations in ice volume Periodic changes in Earth s orbit Relationship
Summary. The Ice Ages and Global Climate
 The Ice Ages and Global Climate Summary Earth s climate system involves the atmosphere, hydrosphere, lithosphere, and biosphere. Changes affecting it operate on time scales ranging from decades to millions
Minimal change in Antarctic Circumpolar Current flow speed between the last glacial and Holocene
 Minimal change in Antarctic Circumpolar Current flow speed between the last glacial and I.N. McCave, S.J. Crowhurst, G. Kuhn, C-D. Hillenbrand and M.P. Meredith Methods Cores Twelve cores forming the transect
What is Climate? Understanding and predicting climatic changes are the basic goals of climatology.
 What is Climate? Understanding and predicting climatic changes are the basic goals of climatology. Climatology is the study of Earth s climate and the factors that affect past, present, and future climatic
AMOC Impacts on Climate
 AMOC Impacts on Climate Rong Zhang GFDL/NOAA, Princeton, NJ, USA Paleo-AMOC Workshop, Boulder, CO, USA May 24, 2016 Atlantic Meridional Overturning Circulation (AMOC) Kuklbrodt et al. 2007 McManus et al.,
Present and Past Warming of the Arctic Morten Hald Department of Geology, University of Tromsø, Norway
 Lectures to the workshop Approaching Arctic Frontiers Areas for Petroleum exploration, 12-13 Nov. 2008 Univ. Tromsø Present and Past Warming of the Arctic Morten Hald Department of Geology, University
Keys to Climate Climate Classification Low Latitude Climates Midlatitude Climates High Latitude Climates Highland Climates Our Changing Climate
 Climate Global Climates Keys to Climate Climate Classification Low Latitude Climates Midlatitude Climates High Latitude Climates Highland Climates Our Changing Climate Keys to Climate Climate the average
SUPPLEMENTARY INFORMATION
 SUPPLEMENTARY INFORMATION Supplementary Figure 1. Preparation line for purifying and separating diatom and radiolarian opal for isotope measurements. Supplementary Figure 2. Examples of different size
M. Ballarotta 1, L. Brodeau 1, J. Brandefelt 2, P. Lundberg 1, and K. Döös 1. This supplementary part includes the Figures S1 to S16 and Table S1.
 Supplementary Information: Last Glacial Maximum World-Ocean simulations at eddy-permitting and coarse resolutions: Do eddies contribute to a better consistency between models and paleo-proxies? M. Ballarotta
Pleistocene Glaciation (Ch.14) Geologic evidence Milankovitch cycles Glacial climate feedbacks
 Geologic evidence Milankovitch cycles Glacial climate feedbacks") Pleistocene Glaciation (Ch.14) Geologic evidence Milankovitch cycles Glacial climate feedbacks End of last ice-age rise of human civilization Modern ice-ages begin Asteroid impact end of dinosaurs Cambrian
Pleistocene Glaciation (Ch.14) Geologic evidence Milankovitch cycles Glacial climate feedbacks End of last ice-age rise of human civilization Modern ice-ages begin Asteroid impact end of dinosaurs Cambrian
The ocean s overall role in climate
 The ocean s overall role in climate - moderates climate in time (diurnally, annually) - redistributes heat spatially in the largescale ocean circulation - lower albedo (sea ice higher albedo) - dry atmosphere
Global Atmospheric Circulation
 Global Atmospheric Circulation Polar Climatology & Climate Variability Lecture 11 Nov. 22, 2010 Global Atmospheric Circulation Global Atmospheric Circulation Global Atmospheric Circulation The Polar Vortex
UNIT 5: ECOLOGY Chapter 15: The Biosphere
 CORNELL NOTES Directions: You must create a minimum of 5 questions in this column per page (average). Use these to study your notes and prepare for tests and quizzes. Notes will be stamped after each assigned
SUPPLEMENTARY INFORMATION
 1. Simulation of Glacial Background Climate Globally averaged surface air is 3 K cooler than in the pre-industrial simulation. This is less than the 4-7 K cooling estimated for the Last Glacial Maximum
Paleoceanography Spring 2008
 MIT OpenCourseWare http://ocw.mit.edu 12.740 Paleoceanography Spring 2008 For information about citing these materials or our Terms of Use, visit: http://ocw.mit.edu/terms. PALEOCEANOGRAPHY 12.740 SPRING
G 3. AN ELECTRONIC JOURNAL OF THE EARTH SCIENCES Published by AGU and the Geochemical Society
 Geosystems G 3 AN ELECTRONIC JOURNAL OF THE EARTH SCIENCES Published by AGU and the Geochemical Society Article Volume 10, Number 4 28 April 2009 Q04U04, doi:10.1029/2008gc002369 ISSN: 1525-2027 Contrasting
Persistent monsoonal forcing of Mediterranean Outflow dynamics during the late Pleistocene
 GSA Data Repository 2015317 Persistent monsoonal forcing of Mediterranean Outflow dynamics during the late Pleistocene by A. Bahr, S. Kaboth, F.J. Jiménez-Espejo, F. J. Sierro, A.H.L. Voelker, L. Lourens,
THE RELATION OF GREAT BASIN LATE QUATERNARY HYDROLOGIC AND CRYOLOGIC VARIABILITY TO NORTH ATLANTIC CLIMATE OSCILLATIONS
 THE RELATION OF GREAT BASIN LATE QUATERNARY HYDROLOGIC AND CRYOLOGIC VARIABILITY TO NORTH ATLANTIC CLIMATE OSCILLATIONS L. Benson a, R. Spencer b, D. Rhode c, L. Louderback d, R. Rye e a U. S. Geological
Wind: Global Systems Chapter 10
 Wind: Global Systems Chapter 10 General Circulation of the Atmosphere General circulation of the atmosphere describes average wind patterns and is useful for understanding climate Over the earth, incoming
common time scale developed for Greenland and Antarctic ice core records. Central to this
 1 Supplemental Material Age scale: For the dating of the EDML and EDC ice cores (Figure S1) we used for the first time a new common time scale developed for Greenland and Antarctic ice core records. Central
Marine Heat Waves: A general overview and case studies in the Mediterranean and around Australia. Eric C. J. Oliver1,2
 Marine Heat Waves: A general overview and case studies in the Mediterranean and around Australia Eric C. J. Oliver1,2 Matthew A. Chamberlain3, Simon J. Wotherspoon1, Neil J. Holbrook1,2 1 Institute for
Paleoclimate indicators
 Paleoclimate indicators Rock types as indicators of climate Accumulation of significant thicknesses of limestone and reef-bearing limestone is restricted to ~20º + - equator Gowganda tillite, Ontario
CL Climate: Past, Present, Future Orals and PICOs Monday, 08 April. Tuesday, 09 April. EGU General Assembly 2013
 CL Climate: Past, Present, Future Orals and PICOs Monday, 08 April MO1, 08:30 10:00 MO2, 10:30 12:00 MO3, 13:30 15:00 MO4, 15:30 17:00 MO5, 17:30 19:00 TU1, 08:30 10:00 CL0, Open Session on Climate: Past,
Temora longicornis and T. stylifera in a changing ocean climate: A macroecological perspective
 Temora longicornis and T. stylifera in a changing ocean climate: A macroecological perspective Claudia Castellani 1 and Eric Goberville 1,2 1 Sir Alister Hardy Foundation for Ocean Science (SAHFOS), Plymouth,
A GCM Reconstruction of the Last Glacial Inception
 A GCM Reconstruction of the Last Glacial Inception Megan Essig 1, Francis Otieno 2, Robert Oglesby 1, David Bromwich 2 1 Department of Geosciences, University of Nebraska, Lincoln 2 Polar Meteorology Group,
Understanding the Polar Regions in Climate Change
 AWG Glenwood Sprs, Oct 2007 Understanding the Polar Regions in Climate Change STEM Polar Connections Outline -- What are the Polar Regions Important to Everyone? Geography of the Poles Oceans, land, sea
Elements of weather and climate Temperature Range of temperature Seasonal temperature pattern Rainfall
 Climate Earth Science Chapter 20 Pages 560-573 Elements of weather and climate Temperature Range of temperature Seasonal temperature pattern Rainfall Overall rainfall Seasonal distribution of rainfall
lecture 12 Paleoclimate
 lecture 12 Paleoclimate OVERVIEW OF EARTH S CLIMATIC HISTORY Geologic time scales http://www.snowballearth.org/index.html Features of the climate during the Cretaceous period the land-sea distribution
The role of teleconnections in extreme (high and low) precipitation events: The case of the Mediterranean region
 precipitation events: The case of the Mediterranean region") European Geosciences Union General Assembly 2013 Vienna, Austria, 7 12 April 2013 Session HS7.5/NP8.4: Hydroclimatic Stochastics The role of teleconnections in extreme (high and low) events: The case of
European Geosciences Union General Assembly 2013 Vienna, Austria, 7 12 April 2013 Session HS7.5/NP8.4: Hydroclimatic Stochastics The role of teleconnections in extreme (high and low) events: The case of
Climate Change. Unit 3
 Climate Change Unit 3 Aims Is global warming a recent short term phenomenon or should it be seen as part of long term climate change? What evidence is there of long-, medium-, and short- term climate change?
Supplementary Figure 1. Foraminifer shell weights and coating composition. Correlation of mean foraminiferal shell weights of (a) G.
 G.") Supplementary Figure 1. Foraminifer shell weights and coating composition. Correlation of mean foraminiferal shell weights of (a) G. bulloides and (b) Uvigerina spp. with respective U/Ca cc+c (grey) and
Supplementary Figure 1. Foraminifer shell weights and coating composition. Correlation of mean foraminiferal shell weights of (a) G. bulloides and (b) Uvigerina spp. with respective U/Ca cc+c (grey) and
Global Paleogeography
 Global Paleogeography Overview of Global Paleogeography Paleogeography is the study of how the Earth s geography has changed during the course of history. Using geological data, scientists reconstruct
Middle Eocene western north Atlantic biostratigraphy and environmental conditions
 Shari Hilding-Kronforst Shari Hilding-Kronforst is currently a Ph.D. candidate at Texas A&M University. Born in Illinois, she received a microscope at age 8 and dinosaur models at age 9. She completed