Hydrogeological Investigation and Modelling Study - Proposed Crains Pit and Quarry Township of Goulbourn, City of Ottawa, Ontario
|
|
|
- Marion Lynch
- 5 years ago
- Views:
Transcription

1 Hydrogeological Investigation and Modelling Study - Proposed Crains Pit and Quarry Township of Goulbourn, City of Ottawa, Ontario Revision: 0 (Final) Prepared for: Crains Construction Ltd Maberly-Elphin Road Maberly, Ontario K0H 2B0 Prepared by: Project Number: Document ID: _Hydrogeology and Modelling Study_R0 January 30, 2015

2 Hydrogeological Investigation and Modelling Study Proposed Crains Pit and Quarry Final Report Doc. ID: _Hydrogeology and Modelling Study_R0.docx Hydrogeological Investigation and Modelling Study Title: Proposed Crains Pit and Quarry Township of Goulbourn, City of Ottawa, Ontario Client: Crains Construction Ltd. Project Number: Document ID: _Hydrogeology and Modelling Study_R0 Revision Number: 0 Date: January 30, 2015 Prepared by: Steve Gaines and Robert Walsh Reviewed by: Glen Briscoe and Mark Priddle (MPCE) Approved by: Kenneth Raven, P.Eng., P.Geo. January 30, 2015 i
3 Hydrogeological Investigation and Modelling Study Proposed Crains Pit and Quarry Final Report Doc. ID: _Hydrogeology and Modelling Study_R0.docx EXECUTIVE SUMMARY Geofirma Engineering Ltd. was engaged by McIntosh Perry Consulting Engineers Ltd. (MPCE) on behalf of Crains Construction Ltd. (Crains ) to complete a Hydrogeological Investigation and Modelling Study. The study has been completed to support the comprehensive Level 1 and Level 2 Hydrogeological Study, which is required under the Aggregate Resources Act (ARA) for the proposed Crains Pit and Quarry, located in the Township of Goulbourn, within the City of Ottawa. The proposed pit and quarry is to be licenced as a Category 3 Class A Pit Above Water and a Category 2 Class A Quarry Below Water. The proposed Crains Pit and Quarry is located at 7731 Fernbank Road on part of Lot 11, Concession 10 of the Geographic Township of Goulbourn, in the City of Ottawa, Ontario. The property is bounded by the Trans Canada Trail to the northwest and by Fernbank Road to the southeast. Agricultural land surrounds the property to the northeast and southwest. A provincially significant wetland is located to the west and northwest of the property and a rural subdivision is located southeast of Fernbank Road, across from the proposed site. The total licence area for the proposed quarry covers an area of approximately 73.6 hectares and the proposed extraction area is 56.8 hectares. The proposed floor elevation for the quarry is 112 metres above sea level (masl). The location of the proposed quarry site and surrounding features is shown on Figure A.1, and a more detailed site layout is provided on Figure A.2, Appendix A. There are several existing pits and quarries located in Goulbourn Township, near the site of the proposed quarry, which are shown on Figures A.1 and A.2 in relation to the proposed pit and quarry development. The proposed quarry is located largely in the Gull River formation. There is also a substantial deposit of sandy gravel above the bedrock at this site. In combination with the discontinuously present quaternary deposits of sand, gravel, or organics, the upper part (~5 m) of the bedrock is weathered and acts as a relatively permeable shallow regional aquifer. At greater depths the hydraulic conductivity is highly variable, evidence that permeability in this unit is dominated by discrete fractures of limited extent. Hydraulic test results from the proposed and adjacent quarries show a slight decrease in hydraulic conductivity with depth as the likelihood of intersecting a permeable fracture is reduced. There is no apparent association between hydrostratigraphic units and geological formations, and no clear evidence for any extensive permeable zone in the deeper parts of the formation. This hydrogeology and modelling study included the installation of four new monitoring wells consisting of thirteen monitoring intervals and monthly groundwater level monitoring in eight historical wells plus the thirteen new intervals. On-site hydraulic testing included slug testing of ten monitoring intervals and 8-hour pump tests were completed in two wells. A groundwater flow model was used to numerically simulate and assess the impacts of changes to the hydrological and groundwater flow regime on surrounding receptors by the proposed pit and quarry. Groundwater flow modelling was used to analyze the cumulative effects of drawdown resulting from the operation of several quarries in relatively close proximity to estimate potential impacts to local receptors, which would not be feasible through hand calculations or empirical methods alone. January 30, 2015 ii
4 Hydrogeological Investigation and Modelling Study Proposed Crains Pit and Quarry Final Report Doc. ID: _Hydrogeology and Modelling Study_R0.docx The potential impact of future quarrying operations was assessed by first developing a calibrated model with no quarries present. Quarries were then added to the model and the model rerun to assess the impact of the excavation and dewatering operations. The base model simulates a pre-quarry flow regime. This model is used as the basis for assessing the impact of quarrying operations and the cumulative impact of quarrying in the area. Two further maximum drawdown scenarios were then simulated. One scenario modelling all currently licenced quarries operating and pumping at their maximum licensed extraction limits and a second scenario with the proposed Crains quarry added to the model, also operating at its proposed extraction limit. The additional cumulative impact of the proposed quarry on the groundwater system was evaluated by comparing the drawdown predictions of the two scenarios. These scenarios are considered to overestimate the maximum drawdown and are improbable as existing quarries are likely to be closed and returned to natural groundwater levels prior to the proposed quarry reaching full extraction. Under the maximum drawdown scenario the one-metre drawdown contour extends at most 750 m beyond the edge of the property. Within the area affected by at least one-metre of drawdown there are nine wells listed in the Ontario Ministry of Environment Water Well Information System (WWIS), excluding monitoring wells on lands owned by adjacent quarry operators. Of the nine wells only three water supply wells had a predicted drawdown of greater than two metres, with the maximum predicted drawdown of 5.8 metres at Well One of these is owned by Cavanagh Construction and is located very close to the Beagle Club quarry. Of the remainder, only two wells show potential for lowering of the water level by more than 10% of the available drawdown, even under the improbable scenario of all quarries operating at full depth simultaneously. The cumulative impacts to the groundwater flow system are expected to be minimal with no observed negative effect on domestic wells. Based on this analysis it is unlikely that the water supply of neighboring homeowners will be noticeably affected by the quarrying operation. The effect of quarry dewatering on the nearby Huntley wetland is expected to be negligible. The one metre drawdown contour does extend into a small portion of the wetland near the northwest boundary of the property. This could potentially increase infiltration in this small portion of the wetland, but the impact will be greatly mitigated by the presence of a low-conductivity glacial till which isolates the wetland from deeper aquifers. Even if we assume that all changes in subsurface seepage rates in the formations below the wetland directly affect its water balance, the net reduction in flows to the wetland caused by the proposed quarry is negligible when compared to the overall water balance for the wetland, which is dominated by precipitation and surface runoff. January 30, 2015 iii
5 Hydrogeological Investigation and Modelling Study Proposed Crains Pit and Quarry Final Report Doc. ID: _Hydrogeology and Modelling Study_R0.docx TABLE OF CONTENTS 1 INTRODUCTION Background Site Description Project Objectives and Scope of Work Report Organization METHODOLOGY Review of Background Information Drilling and Monitoring Well Installation Groundwater and Surface Water Monitoring Program Hydraulic Testing Program Pumping Tests Slug Tests Groundwater Flow Model PHYSICAL SETTING Physiography and Topography Surface Water Drainage Site Stratigraphy Surficial Geology Bedrock Geology Hydrogeology Regional Hydrogeology Site Conditions Groundwater Use Local Permit to Take Water (PTTW) Licences HYDROGEOLOGICAL ASSESSMENT Test Analysis Slug Tests Pumping Tests Hydraulic Testing Results Regional Hydraulic Conductivity Estimates GROUNDWATER FLOW MODEL Conceptual Site Model Boundaries Hydrostratigraphic Units Groundwater Recharge and Drainage Quarries Model Set-up Time discretization Grid Generation Material Properties Calibration of Flow Model Model Scenarios...22 January 30, 2015 iv
6 Hydrogeological Investigation and Modelling Study Proposed Crains Pit and Quarry Final Report Doc. ID: _Hydrogeology and Modelling Study_R0.docx 5.5 Model Limitations MODEL RESULTS Base Model Calibration Predicted Drawdown: Full Development of All Existing Quarries Cumulative Impact of the Proposed Crains Quarry Effects on Private Wells Effects on Wetlands CONCLUSIONS REFERENCES CLOSURE LIST OF FIGURES Figure 1 Summary of Hydraulic Test Results at the Proposed Crains Quarry Site Figure 2 Summary of Hydraulic Test Results at the Proposed Crains Quarry Site and Adjacent Quarry Sites Figure 3 Model domain and surface elevation showing existing quarries and the proposed quarry at full extraction (10:1 vertical exaggeration) Figure 4 Hydraulic head contours (from WWIS) and model boundary selection Figure 5 Recharge zonation and drain network Figure 6 Model grid discretization (10:1 vertical exaggeration) Figure 7 Hydraulic conductivity distribution, existing quarries at full development are also shown Figure 8 Calibration wells and observation points Figure 9 Calibrated model residuals plot and simulated water surface in moderately weathered fractured bedrock approximately 15 m below ground surface Figure 10 Cross plot, calibrated model Figure 11 Calculated drawdown, all currently licensed quarries operating simultaneously at Figure 12 extraction limit Calculated drawdown, all currently licensed quarries and proposed quarry operating simultaneously at extraction limit Figure 13 Calculated additional drawdown from proposed quarry operating at extraction limit Figure 14 Potentially affected wells, showing well IDs and well depth in metres Figure 15 Drawdown in upper weathered bedrock, near Huntley wetland LIST OF TABLES Table 1 Overview of Local Paleozoic Bedrock Formations (after Williams, 1991)... 7 Table 2 Summary of Observed Inflow during Drilling Table 3 Hydraulic Testing Results Table 4 Hydraulic Testing Results Table 5 Model Material Properties Table 6 Wells affected by at least one metre of additional drawdown January 30, 2015 v
7 Hydrogeological Investigation and Modelling Study Proposed Crains Pit and Quarry Final Report Doc. ID: _Hydrogeology and Modelling Study_R0.docx LIST OF APPENDICES APPENDIX A APPENDIX B APPENDIX C APPENDIX D APPENDIX E Site Figures Report Tables Borehole Stratigraphic and Instrumentation Logs Site Photographs Hydraulic Testing Results and Analysis January 30, 2015 vi
8 Hydrogeological Investigation and Modelling Study Proposed Crains Pit and Quarry Final Report Doc. ID: _Hydrogeology and Modelling Study_R0.docx 1 INTRODUCTION Geofirma Engineering Ltd. was engaged by McIntosh Perry Consulting Engineers Ltd. (MPCE) on behalf of Crains Construction Ltd. (Crains ) to complete a Hydrogeological Investigation and Modelling Study. The study has been completed to support the comprehensive Level 1 and Level 2 Hydrogeological Study, which is required under the Aggregate Resources Act (ARA) for the proposed Crains Pit and Quarry, located in the former Township of Goulbourn, within the City of Ottawa, Ontario. 1.1 Background Crains Construction Ltd. proposes to apply for the following aggregate licenses for its Fernbank Road property: 1. Category 3 Class A Pit Above Water 2. Category 2 Class A Quarry Below Water According to the Aggregate Resources of Ontario Provincial Standards, Version 1.0 (MNR, 1997) these license applications will require a Level 1 Hydrogeological evaluation to identify the potential for adverse effects to groundwater and surface water; and a Level 2 Hydrogeological evaluation, which determines the significance of the effect and feasibility of mitigation. Based on the licence applications of nearby pit and quarry operators, and the proximity of sensitive groundwater and surface water receptors to the proposed quarry, both the Level 1 and Level 2 requirements will need to be addressed. This report also addresses the cumulative impact of the proposed quarry and the existing quarries on the hydrogeologic regime of the area. The licence application also requires a series of Natural Environment and Cultural Heritage Resource technical reports that are presented in separate documents completed by McIntosh Perry Consulting Engineers on behalf of Crains. 1.2 Site Description The proposed Crains Pit and Quarry is located at 7731 Fernbank Road on part of Lot 11, Concession 10 of the Geographic Township of Goulbourn, in the City of Ottawa, Ontario. The site is mostly agricultural land with minor wooded areas covering the north and south portions of the property. The property is bounded by the Trans Canada Trail to the northwest and by Fernbank Road to the southeast. Agricultural land surrounds the property to the northeast and southwest. A provincially significant wetland is located to the west and northwest of the property and a rural subdivision is located southeast of Fernbank Road, across from the proposed site. The total licence area for the proposed quarry covers an area of approximately 73.6 hectares and the proposed extraction area is 56.8 hectares. The proposed floor elevation for the quarry is 112 metres above sea level (masl). The location of the proposed quarry site and surrounding features is shown on Figure A.1, and a more detailed site layout is provided on Figure A.2, Appendix A. There are several existing pits and quarries located in Goulbourn Township, near the site of the proposed quarry, which are shown on Figures A.1 and A.2 in relation to the proposed pit and quarry development. The existing quarries (and licenced bottom elevations) include the following: January 30,
9 Hydrogeological Investigation and Modelling Study Proposed Crains Pit and Quarry Final Report Doc. ID: _Hydrogeology and Modelling Study_R0.docx Beagle Club Quarry (118 masl) operated by Thomas Cavanagh Construction Ltd. Bell Quarry (132 masl) operated by Lafarge Canada Inc. Goulbourn Quarry (110 masl) - operated by Thomas Cavanagh Construction Ltd Henderson Quarry (112 masl) - operated by Thomas Cavanagh Construction Ltd. Stittsville Quarry (116 masl) operated by R.W. Tomlinson Ltd There is also an application to the Ontario Ministry of Natural Resources (MNR) by Ontario Inc. (Taggart Construction) to obtain a license under the Aggregate Resources Act for a Category 2 Class A quarry below-water for the Fernbank Quarry (on Fernbank Road and Jinkinson Road east of the Beagle Club Quarry). 1.3 Project Objectives and Scope of Work The following objectives have been identified for the current hydrogeological investigation and modelling study to support the application: Characterize the current geological and hydrogeological conditions of the proposed site and surrounding properties; Identify sensitive receptors (groundwater and surface water) and the potential for adverse effects resulting from development; and Quantitatively assess the impacts of the proposed operation on likely receptors within the zone of influence and evaluate the feasibility of various mitigation measures for the development. To meet the above objectives, the scope of work included the following: Field investigations, including; borehole drilling, well installation and hydraulic testing; Groundwater and surface water monitoring (performed by MPCE); Data analysis and conceptual model development; Construction and calibration of a groundwater flow model; Prediction of hydrogeological impacts; and Report preparation. 1.4 Report Organization The report is organized into nine Sections and five Appendices. Section 1 provides project background, a general site description, and an overview of the objectives and scope of work. Section 2 outlines the assessment methodology, including the current field investigation program and development of a conceptual site model. Section 3 summarizes the physical setting of the proposed pit and quarry, including the geological and hydrogeological setting and local groundwater use. A more detailed hydrogeological assessment incorporating field testing and monitoring data is summarized in Section 4. Section 5 provides an overview of the conceptual site model, model set-up and calibration, as well as model scenarios. Modelling results are summarized in Section 6. Conclusions, references and report closure are provided in Sections 7, 8 and 9, respectively. January 30,
10 Hydrogeological Investigation and Modelling Study Proposed Crains Pit and Quarry Final Report Doc. ID: _Hydrogeology and Modelling Study_R0.docx 2 METHODOLOGY The following section provides an overview of the methodology for conducting the Hydrogeological Investigation and Modelling Study for the proposed Crains pit and quarry operation. The hydrogeological investigation included the following: Review of background information, including available limestone bedrock rock core for characterization of lithology and fractures; Completion of four additional boreholes to permit the installation of multi-level piezometers for hydrogeological testing; Field observations of site drainage and surface water flow; and Completion of hydraulic tests to estimate the hydrogeological properties of the bedrock. The modelling component of the study incorporated results of the site specific hydrogeological investigation into a numerical model to estimate potential impacts to adjacent receptors resulting from dewatering during pit and quarry operations. 2.1 Review of Background Information A review of available data for the site and surrounding area, including nearby pit and quarry operations, was completed as part of this study. This includes compilation and review of Ministry of the Environment water well records, geological mapping completed by the Ministry of Natural Resources and the Ontario Geological Survey, and hydrogeological assessments completed for adjacent quarries. Additional information for adjacent quarry operations was obtained from the MOE following a freedom of information (FOI) request initiated by MPCE. Prior to Geofirma s involvement in the project, five boreholes (advanced to approximately 30 metres) and a series of 20 test pits were completed on-site. Core from three of the boreholes (BH3, BH4 and BH5) was made available for review by Geofirma staff. In addition, a hydrogeological investigation was completed in 2004 (Golder) to support the application for a Category 3, Class A Pit Operation. Golder s investigation included advancement of five boreholes (terminated at bedrock). Regional and site specific information from historical investigations, combined with the observations and results of the current hydrogeological investigation, are discussed in Sections 3 and Drilling and Monitoring Well Installation A total of four wells were completed on-site by Wilf Hall & Sons Well Drilling (Wilf and Sons) of Perth, Ontario and supervised by Geofirma personnel. TW13-01 and TW13-04 were completed on October 21, 2013, while TW13-02 and TW13-03 were completed on March 10, All wells were drilled using an air hammer and constructed in accordance with Ontario Regulation 903, under the Ontario Water Resources Act. A copy of the borehole stratigraphic and instrumentation logs are included in Appendix C. Boreholes were advanced using an air hammer, therefore no core was collected and rock chips were logged for lithological characteristics of the bedrock. A steel casing (159 mm diameter) was installed into the bedrock at an approximate depth of 6.1 metres below ground surface (mbgs). The surface casing was cemented in place and grouted to surface. Boreholes TW13-01, TW13-02 and TW13-03 January 30,
11 Hydrogeological Investigation and Modelling Study Proposed Crains Pit and Quarry Final Report Doc. ID: _Hydrogeology and Modelling Study_R0.docx were completed to a depth of between 30.5 and 35.1 mbgs (105.3 to masl), which aligns with the approximate proposed depth of the quarry floor. TW13-04 was completed to 15.3 mbgs (127.9 masl) to serve as an observation well to monitor groundwater table drawdown during pumping tests from the adjacent domestic well. Three piezometers were installed in each of TW13-01, TW13-02 and TW13-03 to determine the conditions at various depths (deep, moderate, and shallow). Piezometers were constructed of 32 mm (1.25 inch) diameter; schedule 40 PVC with factory-slotted #10 screen, and flush-jointed riser pipe to ground surface. Silica sand was emplaced around screened intervals and was extended approximately 0.3 m above the top of each screened interval to prevent the downward migration of bentonite. Benseal hole-plug was used to seal between each interval; silica sand was placed above the Benseal to prevent the bentonite from fouling the screen of the overlying interval. Borehole and groundwater monitoring well locations are provided in Figure A.2, Appendix A. A copy of borehole stratigraphic logs, including monitoring well instrumentation details, are provided in Appendix C. 2.3 Groundwater and Surface Water Monitoring Program Since May 2013, monthly groundwater and surface water elevations have been collected by McIntosh Perry Consulting Engineers. The monitoring includes eight historical wells BH-04-2, BH-04-3, BH-04-5, A001591, A001592, A001593, A and A The four additional monitoring wells (TW13-01, TW13-02, TW13-03 and TW13-04) and associated intervals, installed by Geofirma in October 2013 and March 2014 have also been included in the monitoring program. Groundwater elevation records are provided in Table B.1, Appendix B. 2.4 Hydraulic Testing Program Hydrogeological properties of the bedrock at the Site were estimated using two types of standard tests; slug tests and pumping tests. Slug tests were completed at TW13-01 TW13-02 and TW13-03 on all four intervals for TW13-01 and the bottom three intervals for TW13-02 and TW Pumping tests were completed on two wells: the existing domestic well and TW Pumping Tests An eight-hour pumping test was conducted on October 24, 2013 on the domestic water well, using TW13-04 as an observation well. The domestic water well was pumped at a known rate for eight hours while recording the water level in the well during pumping and during the recovery period. Manual water level measurements were collected, and the flow rate was recorded using a bucket measurement, and check periodically using a flow totalizer installed in-line with the discharge. The pumping rate was set at a maximum rate of 30 L/min, which was estimated as the rate that could be sustained over the duration of the eight hour test, without causing excessive drawdown at the well and de-saturation of the pump. January 30,
12 Hydrogeological Investigation and Modelling Study Proposed Crains Pit and Quarry Final Report Doc. ID: _Hydrogeology and Modelling Study_R0.docx Slug Tests Slug tests were conducted on each interval of the monitoring wells to estimate the vertical distribution of hydraulic conductivity. Slug testing was completed on TW13-01, TW13-02 and TW The slug tests completed in TW13-01 were conducted using a slug lowered below the water in each of the piezometers. Water level was monitored until water level reached static conditions, then the slug was removed and water level again monitored until static level was reached. Solinst Levelogger were used to collect the water recovery measurements. For the slug tests conducted on TW13-02 and TW13-03 a slug of water was removed from each of the piezometers and Solinst Leveloggers were used to collect water recovery measurements. 2.5 Groundwater Flow Model A groundwater flow model was used to numerically simulate and assess the impacts of changes to the hydrological and groundwater flow regime on surrounding receptors by the proposed pit and quarry. Groundwater flow modelling provides a means for analyzing the cumulative effects of drawdown resulting from the operation of several quarries in relative close proximity to estimate potential impacts to local receptors, which is not feasible through hand calculations or empirical methods alone. For simulation of groundwater impacts of quarrying operations, MODFLOW 2000 (USGS, 2000) has been used. MODFLOW 2000 is a three-dimensional finite difference groundwater simulator widely used in research and industry for simulating and predicting groundwater conditions. Model pre- and post-processing were performed using mview 4.20, a proprietary modelling support tool developed by Geofirma. Pre-processing procedures consist primarily of discretization, specification of boundary conditions, and property assignment. Post-processing includes all summary calculation and visualizations. mview 4.10 has been qualified to Nuclear Waste Management Organization (NWMO) Software Quality procedures. January 30,
13 Hydrogeological Investigation and Modelling Study Proposed Crains Pit and Quarry Final Report Doc. ID: _Hydrogeology and Modelling Study_R0.docx 3 PHYSICAL SETTING 3.1 Physiography and Topography The Site is located within Ottawa-St. Lawrence lowland basin in the physiographic region referred to as the Smiths Falls Limestone Plain, which is surrounded to north and east by the Ottawa Valley Clay Plains (Chapman and Putnam, 1984). The Smiths Falls Plain is characterized by shallow soil cover overlying limestone or dolostone bedrock. Topographic relief is minimal, resulting in relatively poor drainage and abundant wetland areas. A survey of the property was completed by MPCE. The topography varies from approximately 146 metres above sea level (masl) in the north and east portion of the Site, to 133 masl at the extreme northwest corner of the property. 3.2 Surface Water Drainage The proposed development is located within the Jock River sub-watershed, which lies within in the larger Rideau River watershed. The Jock River sub-watershed includes a drainage area of 555 km 2, and incorporates several catchment areas, including the Jinkinson Drain catchment area that captures surface runoff from the Site (RVCA, 2011b). On-site, there is a drainage divide along the east and south of the property and the north, south and west side of the property is bounded by drainage ditches capturing runoff. Surface drainage north of the divide flows into the drainage ditch and west toward the wetland, before flowing south toward the Jock River. Surface runoff on the south section of the site drains toward the south ditch and offsite. The site topography and drainage, as well as catchment zones, are presented on Figure A.3. Mapping shows streams running parallel to the north, east, and west property lines. During MPCE site visits, it was determined that stream flow was only measurable along the most westerly areas of the property (this is likely due to the on-site relief, which is defined by a lowland in the northwest corner of the property and higher ground towards the centre). The main surface water flow on the property is via an unnamed stream that runs along the west side of the property. Flow direction is generally to the northwest, towards a small wetland on the corner of the property. It should be noted that surface water flow appears to be highly localized, as the on-site wetland/swamp appears to drain to the southeast via an unnamed tributary of the Jock River. Surface water flow in the west property line stream has been observed to be intermittent and tied closely to precipitation events. Additionally, bedrock is exposed on the southernmost stretches of the streambed. Thus, this stream is probably recharged from both surface runoff and possibly shallow overburden groundwater. 3.3 Site Stratigraphy Surficial Geology The distribution of surficial sediments covering the property is primarily based on regional mapping completed by the Ministry of Natural Resources, investigations completed at adjacent quarries (such as the Henderson II Quarry), and supplemental field investigations. On the site, MRD-228 maps beach deposits and west of the site the wetland complex is mapped. The provincial surficial geology January 30,
14 Hydrogeological Investigation and Modelling Study Proposed Crains Pit and Quarry Final Report Doc. ID: _Hydrogeology and Modelling Study_R0.docx mapping (MRD-128: revised) mapped the site as coarse textured glaciomarine deposits with beach ridges and near-shore bars on the southeast half of the site and Paleozoic bedrock on the northwest part of the site. Mapping the northwest half of the site as Paleozoic bedrock is an indication of thin soil cover in this area. The distribution of overburden across the site is shown on Figure A.4, Appendix A. Sediments in the area were deposited during the last glaciation (Laurentide Ice Sheet) approximately 10,000 years ago and consist primarily of glaciomarine material, as well as organic deposits associated with adjacent wetland areas. Regional mapping indicates coarse textured glaciomarine soil cover and Paleozoic rock outcrop (very thin soil cover) over the Site. Overburden thickness based on subsurface investigations (test pits and boreholes) completed on-site, range from 0 m to 5.3 m, with an average depth to bedrock of 1.9 m. Soil overlying bedrock consists of brown sand with gravel, which is consistent with the glaciomarine deposits that have been mapped in the area Bedrock Geology The bedrock in the area of the proposed quarry is mapped as the Gull River Formation, and bedrock belonging to the Bobcaygeon Formation is mapped adjacent to the site (OGS map). The upper member of the Gull River Formation consists of finely crystalline limestone with shaly partings and the lower member is described as interbedded limestone and silty dolostone with shaly partings (Williams, 1991). Regionally, the Bobcaygeon and Gull River Formation limestones are the primary units quarried for aggregate use. Where present, the Bobcaygeon Formation is underlain by the Gull River Formation, which overlies the Shadow Lake, Rockcliffe and Oxford Formations. Area bedrock geology is presented in Figure A.5, Appendix A. A description of the Paleozoic formations underlying the site are included in Table 1. Table 1 Overview of Local Paleozoic Bedrock Formations (after Williams, 1991) Formation Description Bobcaygeon Gull River Shadow Lake Rockcliffe Oxford Interbedded lithographic to coarsely crystalline fossiliferous limestone with shaly partings Interbedded limestone and silty dolostone (lower member); finely crystalline limestone with shaly partings (upper member) Silty to sandy dolostone with shaly partings and thin interbeds of calcareous quartz sandstone Interbedded quartz sandstone and shale Dolostone, light to medium brownish to greenish grey, with shaly interbeds up to 30 cm thick Rock core from three on-site boreholes (BH3, BH4 and BH5) was made available for review by Geofirma staff. In general, fracture spacing increases with depth, i.e. rock quality increases with January 30,
15 Hydrogeological Investigation and Modelling Study Proposed Crains Pit and Quarry Final Report Doc. ID: _Hydrogeology and Modelling Study_R0.docx depth. The primary fracture set is related to bedding and is oriented normal to the core axis (80-90 degrees from vertical). A secondary sub-vertical joint set was identified and evidence of calcite infilling and iron staining was noted on some fracture surfaces. In some cases, the sub-vertical joint set was completed infilled (healed) with calcite. Monitoring wells installed by Geofirma in October 2013 and March 2014 were advanced using air hammer techniques, therefore rock core was not available and lithological characteristics were logged using chip samples recovered at surface. Borehole stratigraphic and instrumentation logs for boreholes completed as part of the current hydrogeological investigation are presented in Appendix B. Photographs of the rock core available from Crains are presented in Appendix C. 3.4 Hydrogeology Regional Hydrogeology A comprehensive Watershed Characterization report was completed by the Mississippi-Rideau Source Protection Region (MRSPR) as part of the requirements for the Source Water Protection initiative through the Province of Ontario and the Clean Water Act. The Watershed Characterization report identifies the Ottawa Group as well as the underlying Rockcliffe, Eastview, Billings and Carlsbad formations as a single hydrostratigraphic unit, that yields poor to moderate (<15 L/min) potable water. Due to the presence of sandstone interbeds and dissolution features the Rockcliffe and Gull River formations are conceptualized as a poor domestic supply aquifer (MRSPR, 2008). The fracture density and fracture connectivity are the key features for local-scale permeable zones and in the absence of fractures the Ottawa Group as well as the underlying formations can collectively be conceptualized as a regional aquitards. An upper bedrock aquifer has been identified in the region. This aquifer is not dependant on the lithology of the rock, but it is highly weathered and has a well-developed fracture network that permits a relatively uniform flow pathway. This aquifer is considered to be a domestic supply aquifer based on the typical elevation of domestic water wells in the area. The MRSPR reports a regional estimate of 1x10⁻⁷ m/s and a bulk porosity of 5% for this upper bedrock aquifer Site Conditions Based on the results of five boreholes and three monitoring wells completed as part of the historical hydrogeological investigation completed at the Site (Golder, 2004), no significant groundwater resources are present in the overburden unit. Shallow groundwater at the property is found in the upper, weathered bedrock unit. Groundwater is also encountered at deeper elevations, and the distribution is strongly controlled by the presence or absence of fractures, and their connectivity. During drilling of the four new monitoring wells TW13-01 through TW13-04, evidence of groundwater inflow was identified and the approximate inflow rate is summarized in Table 2. January 30,
16 Hydrogeological Investigation and Modelling Study Proposed Crains Pit and Quarry Final Report Doc. ID: _Hydrogeology and Modelling Study_R0.docx Table 2 Summary of Observed Inflow during Drilling. Borehole ID Approximate Depth (mbgs) Estimated Flow Rate (L/min) TW TW TW TW Four monitoring intervals A though D were installed in each of TW13-01, TW13-02 and TW13-03 to assess groundwater conditions at various depths between ground surface and the proposed quarry floor elevation. A detailed hydrogeological assessment, incorporating the results of pumping tests completed by Geofirma as well as reported hydrogeological parameters for adjacent quarry operations is discussed in Section Groundwater Use Within 3 km of the proposed pit and quarry, there are approximately 380 wells listed on the MOE water well database. The average depth of wells is approximately 40 mbgs, which is consistent with the MRSPR interpretation that the upper bedrock can be considered a regional domestic supply aquifer. The Site is located approximately 7 km from the municipal supply wells for the Village of Munster and 13 km from the King s Park subdivision supply well near the Town of Richmond. The Munster municipal water supply is drawn from two wells, drilled to depths of 116 and 122 metres, and the King s Park wells are completed to depths of 61 and 66 metres. Both municipal well systems draw water primarily from the Nepean Formation aquifers, and the overlying Oxford/March Formations. Figure A.6, Appendix A, illustrates the interpreted capture zones of the local water supply wells relative to the location of the proposed pit and quarry. The proposed quarry is located on the edge of the year capture zone for the King s Park supply well, and is not within the capture zone for the Munster supply well. A vulnerability assessment of the King s Park (Richmond) wells was completed by Golder (2013a) and the proposed quarry lies within Zone D of the wellhead protection area, indicating low vulnerability to the municipal well. Given the low vulnerability associated with the zone, the potential impact to the groundwater quantity or quality at the wells as a result of the proposed pit and quarry development are considered negligible Local Permit to Take Water (PTTW) Licences The Ministry of the Environment database containing permit to take water licences was reviewed to determine the major water uses (other than residential) in the vicinity of the proposed quarry. Permit to take water licensees adjacent to the proposed pit and quarry include golf courses for water supply and irrigation purposes, as well as the surrounding pit and quarry operations from wells and sumps for dewatering, aggregate washing, and miscellaneous industrial purposes. A summary of the active PTTW licences surrounding the proposed Crains pit and quarry are included in Table B.2, Appendix B. January 30,
17 Hydrogeological Investigation and Modelling Study Proposed Crains Pit and Quarry Final Report Doc. ID: _Hydrogeology and Modelling Study_R0.docx 4 HYDROGEOLOGICAL ASSESSMENT 4.1 Test Analysis Slug Tests The slug test data were processed in AQTESOLV TM (Duffield, 2007), an aquifer test analysis software using the Hvorslev (1951) method, which graphically estimated a unit response time (basic time lag, T 0 ) through a linear interpolation of water level recovery measurements on a semi-log graph. The basic time lag (T 0 ) is a measure of time from the start of the slug test until the water level had recovered to roughly 2/3 of the original water level. The basic time lag is then used to calculate the hydraulic conductivity following the method developed by Hvorslev (1951). The results and analysis of the slug tests are provided in Appendix E Pumping Tests Data collected during pumping tests on the domestic well (8 hour) and TW13-04 (1 hour) were also processed in AQTESOLV TM (Duffield, 2007). The data was interpreted using the Theis solution, which is commonly used as a first approximation for interpretation of testing data; however, the solution over estimates drawdown during the later stages of the test, indicating that there is another source of groundwater to the aquifer. The Hantush-Jacob analytical solution (1955), for leaky aquifer conditions, provided the best fit to the observed drawdown and was used to estimate the hydrogeological properties of the bedrock. A copy of the pumping test analysis is included in Appendix E. 4.2 Hydraulic Testing Results The results of the hydraulic testing program completed for the proposed Crains pit and quarry are presented in Table 3. Slug tests were completed at the A, B and C intervals of each test well and analyzed following the Hvorslev method. Pumping tests were completed on test well, TW13-04 and the domestic well located on the property, and interpreted following the Hantush-Jacob method, which is applicable for leaky aquifer conditions. It is worth noting that the pumping tests were first analyzed using the Theis equation, which provided an inadequate fit to the data. Figure 1 presents the results of the hydraulic testing program, illustrating the hydraulic conductivity for each test, as well as the depth and screened interval. January 30,
18 Hydrogeological Investigation and Modelling Study Proposed Crains Pit and Quarry Final Report Doc. ID: _Hydrogeology and Modelling Study_R0.docx Table 3 Hydraulic Testing Results. Interval Interval (mbgs) Interval (masl) Hydraulic Conductivity (m/s) Slug Tests (Hvorslev method) TW13-01A x 10-8 TW13-01B x 10-8 TW13-01C x 10-5 TW13-02A x TW13-02B x TW13-02C x TW13-03A x TW13-03B x TW13-03C x Pumping Tests (Hantush-Jacob method) TW13-04 (1 hr) x 10-5 Domestic Well (8 hr) x 10-5 Figure 1 Summary of Hydraulic Test Results at the Proposed Crains Quarry Site. January 30,
19 Hydrogeological Investigation and Modelling Study Proposed Crains Pit and Quarry Final Report Doc. ID: _Hydrogeology and Modelling Study_R0.docx 4.3 Regional Hydraulic Conductivity Estimates There are several operating and proposed quarries adjacent to the proposed Crains pit and quarry, which are illustrated on Figure A.1, Appendix A. A summary of the geometric mean average hydraulic conductivity values estimated from on-site slug and pumping tests completed at the adjacent quarries is presented in Table 4. Table 4 suggests that there are only minor differences in the hydraulic properties of the shallow and deeper bedrock; however, there is some variation in the estimates of regional hydraulic conductivity. The differences between hydraulic conductivity values reported by location could be influenced, in part, by testing methodology and analysis. Table 4 Hydraulic Testing Results Quarry Name Average Hydraulic Conductivity* (m/s) Shallow Bedrock Average Hydraulic Conductivity* (m/s) Deeper Bedrock Fernbank Quarry 1.4 x x 10-5 Stittsville Quarry 4.5 x x 10-6 Bell Quarry 2.9 x x 10-9 Beagle Club Quarry 2.9 x x 10-8 Henderson Quarry 3.6 x x 10-8 * Geometric average The individual hydraulic test results from adjacent quarries and Crain s quarry are illustrated in Figure 2. There is a very large variation in hydraulic conductivity. Tests located relatively near each other, at the same depth, in the same unit, may produce widely divergent conductivity results. This is a reflection of the heterogeneous and fractured nature of these units. The lack of any pattern or consistency, even in proximate tests, suggests that the fracture system is not extensively connected. There is a weak vertical trend in hydraulic conductivity. Although the variability in hydraulic conductivity persists at all depths where tests have been performed, tests at greater depths are less likely to encounter high permeability features, resulting in a reduction in average permeability. The black line on Figure 2 shows screen-length-weighted geometric mean hydraulic conductivities in three depth intervals. The average hydraulic conductivity is reduced at greater depths. The average conductivity at intermediate depth is 1.7x10⁻⁷ m/s, in agreement with the regional conductivity estimate of 1x10⁻⁷ m/s for the regional upper bedrock aquifer, and the results generally agree with regional estimates of conductivity for the Gull River and Rockcliffe formations ( m/s) (MRSPR, 2008). The permeability estimate for the shallowest horizon is based on a relatively small number of tests at these depths. Individual test results for each well interval are included in Appendix E. January 30,
20 Hydrogeological Investigation and Modelling Study Proposed Crains Pit and Quarry Final Report Doc. ID: _Hydrogeology and Modelling Study_R0.docx Figure 2 Summary of Hydraulic Test Results at the Proposed Crains Quarry Site and Adjacent Quarry Sites. January 30,

21 Hydrogeological Investigation and Modelling Study Proposed Crains Pit and Quarry Final Report Doc. ID: _Hydrogeology and Modelling Study_R0.docx 5 GROUNDWATER FLOW MODEL 5.1 Conceptual Site Model The development of a conceptual site model to guide the construction of a useful and accurate numerical flow model requires an understanding of the watershed characteristics. This includes an understanding of the regional, local and site specific physical attributes, and the various external factors that control groundwater flow within the watershed. The conceptual site model considers the following: quarry location, overburden thickness, hydrostratigraphy, recharge distribution, and drainage features. Figure 3 shows the selected model domain and overall structure with some contextual information. The development of the conceptual model is based primarily on five data sources: 1. Land Information System (LIO), Ontario Ministry of Natural Resources (MNR) 2. Water Well Information System (WWIS), Ontario Ministry of the Environment (MOE) 3. Geological and hydrogeological reporting from the proposed site and adjacent quarry sites including the groundwater monitoring program and quarry licensing documents. 4. The Mississippi-Rideau Source Protection Region Watershed Characterization report (MRSPR, 2008) 5. Assessment Report: Rideau Valley Source Protection Area (RVCA, 2011a) Figure 3 Model domain and surface elevation showing existing quarries and the proposed quarry at full extraction (10:1 vertical exaggeration). January 30,

22 Hydrogeological Investigation and Modelling Study Proposed Crains Pit and Quarry Final Report Doc. ID: _Hydrogeology and Modelling Study_R0.docx Boundaries Boundaries of the flow system were based on surface water sub-catchment boundaries delineated in the Watershed Characterization Report (MSRPR, 2008), and on interpolated hydraulic head equipotential surfaces from WWIS data. To minimise the impact of shortcomings in the WWIS database, the well data was filtered to remove the many irregularities that were present when all the data was used. The data was filtered first to remove wells with obviously incorrect data (e.g. negative water depths). The remaining wells were then filtered by the location method to remove the less accurate locations, since at the scale of the model, even minor inaccuracies may cause problems. Since the water table is thought to be at a relatively shallow depth in the area, wells with water depth greater than 10m were also removed. Finally, a number of wells were removed by inspection if they had water levels that were drastically different than other nearby wells. The equipotential (EP) surface based on these filtered data is shown in Figure 4, which also shows local subwatershed (subcatchment) boundaries. Figure 4 Hydraulic head contours (from WWIS) and model boundary selection. January 30,
23 Hydrogeological Investigation and Modelling Study Proposed Crains Pit and Quarry Final Report Doc. ID: _Hydrogeology and Modelling Study_R0.docx The left and lower right constant head boundaries were selected approximately parallel to EP lines. The lower left no-flow boundary is approximately perpendicular to the interpolated EP lines, as is the upper right no-flow boundary. The upper left boundary is also perpendicular to the EP lines, but is also largely coincident with the surface water subcatchment boundary. It is likely that the presence of quarries near this boundary may already have pushed the subsurface catchment boundary back somewhat due to local dewatering. However, as we are not directly interested in the impact of these quarries, and the quarries are modelled by drain boundary conditions, this should not affect the assessment of the cumulative impact of the proposed quarry. Model boundaries are sufficiently distant from the proposed quarry that they will not directly impact drawdown predictions in the vicinity of the quarry Hydrostratigraphic Units Surficial geology mapping conducted by the Ontario Ministry of Natural Resources (LIO) was used to delineate locations where significant overburden deposits are present. This information was combined with the digital elevation model (from the LIO), and interpolated maps of the bedrock surface (based on data from WWIS) to produce a plausible estimate of overburden distribution and thickness. Hydraulic conductivity of overburden units was assumed to be equal to 10-4 m/s, consistent with a sandy material (de Marsily, 1986). Fractured bedrock units in the model domain consist largely of the Ottawa group limestone and shale units, mostly Gull River formation, overlain by the Bobcaygeon formation in some areas. Within these units, there is little evidence to suggest any correspondence between geology and hydrostratigraphy. The extensive hydraulic testing undertaken by quarry operators in the area provides a substantial number of tests in an area which comprises a reasonably large proportion of the model domain. Based on these tests (shown in Figure 2) the hydraulic conductivity is highly variable and shows a trend of decreasing average permeability with depth. The hydraulic test results from on-site, as well as adjacent properties, show a slight decrease in hydraulic conductivity with depth. There is no apparent association with the geological unit, and no clear evidence for any extensive permeable zone in the deeper parts of the formation. Based largely on these observations, the fractured bedrock aquifer has been divided into three hydrostratigraphic units as a function of depth. The heavily weathered upper bedrock unit and extends over the entire model domain and is expected to be relatively permeable. The permeability of this unit is more uncertain and it was therefore used as a calibration parameter in the model. Directly below this unit, the moderately weathered intermediate unit spans the next 20 m of depth for the entire model domain. Beyond 25 m depth is a slightly less permeable fractured bedrock unit. The permeability of the deep and intermediate units is taken directly from the hydraulic testing performed at the local quarry sites. The relatively permeable Nepean formation sandstone unit has not been included in the model as this unit lies approximately 120 m below the base of the quarry excavation, separated by a substantial barrier of relatively low conductivity rock. In summary, based on regional data and site specific testing and observations, the following four hydrostratigraphic units are proposed: 1. Overburden consisting of sand, sand and gravel, organic deposits, or till (see Figure A.4, Appendix A). Overburden is not regionally extensive, generally occurring in isolated bodies. January 30,
24 Hydrogeological Investigation and Modelling Study Proposed Crains Pit and Quarry Final Report Doc. ID: _Hydrogeology and Modelling Study_R0.docx 2. Heavily weathered fractured bedrock to a depth of 5 m. The top five meters of bedrock is considered to be more heavily fractured and weathered, and therefore more permeable than the underlying bedrock units. 3. Moderately weathered fractured bedrock between a depth of 5 m and 25 m. 4. Less permeable fractured bedrock at greater depths Groundwater Recharge and Drainage According to the Rideau Valley Source Protection Area Assessment Report (RVCA, 2011a), Areas of significant groundwater recharge typically exist on high elevations or where a porous surficial sand or gravel cover exists in a flat lying area, allowing precipitation to infiltrate the deeper groundwater aquifers. Recharge in the model domain was distributed based on this description, occurring where significant thicknesses of sand/gravel/organic overburden were present. The total amount of recharge to these zones was used as a model calibration parameter. The recharge zonation is shown in Figure 5. Groundwater discharge was assumed to occur in low lying areas with mapped drainage features. Drainage features are shown in Figure 4. In the model, drain elevation was set equal to the ground surface elevation (grid block top) minus a factor to account for imprecision in the digital elevation model and for drain bottom elevations which are typically lower than the surrounding ground surface. This drain elevation offset was also used as a model calibration parameter. A value of one metre below the DEM was found to produce the best model fit. January 30,

25 Hydrogeological Investigation and Modelling Study Proposed Crains Pit and Quarry Final Report Doc. ID: _Hydrogeology and Modelling Study_R0.docx Figure 5 Recharge zonation and drain network Quarries Quarries have been conceptualized as inactive volumes in terms of groundwater flow. The bottom and sides of the quarries are conceptualized as drains. 5.2 Model Set-up The groundwater model was developed using mview pre-processing software for grid generation and property assignment, and imported to MODFLOW 2000 for analysis. The model domain was set-up to include the adjacent quarries and surrounding surface water features. The boundaries of the model have been extended well beyond the zone influenced by the proposed quarry. January 30,

26 Hydrogeological Investigation and Modelling Study Proposed Crains Pit and Quarry Final Report Doc. ID: _Hydrogeology and Modelling Study_R0.docx Time discretization Due to inadequate input data on temporal changes, limitations in the WWIS data, and the impossibility of precisely predicting the future operations of local quarries, the models for pre- and post-quarry states have been set up as steady state models. By using a steady-state model, we assume that all quarries are active at their maximum licensed extraction depth at the same time, and are constantly discharging for a very long (essentially infinite) timeframe. In reality, discharge rates vary with time, quarries do not necessarily discharge year round, and some quarries do not discharge water every year. Quarries have a finite operational life, and will not all be operational at the full extraction depth at the same time Grid Generation The model grid was designed using mview pre-processing software and imported into MODFLOW. The finite difference model grid comprises grid blocks, divided into 154 rows, 112 columns, and 34 layers. The total number of active grid blocks was , excluding inactivated quarry blocks in runs where quarries are present. The grid was refined in the vicinity of Crain s proposed quarry where block size was on the order of 25 by 25 metres. The size of the grid blocks was gradually increased towards the outer edge of the model, to a maximum size of 150 by 120 metres. The grid has been rotated by 41 degrees west to align with the orientation of the Crain s property as well as other property lines (and quarry boundaries) in the area. Vertically, the model extends from the ground surface (approximately masl) to a minimum elevation of 50 masl, which is approximately 62 m below the floor of the proposed quarry. The maximum layer thickness is 4.5 m at the base of the model, while the minimum layer thickness is 1.25 m (at the surface). Figure 6 illustrates the grid discretization. Figure 6 Model grid discretization (10:1 vertical exaggeration). January 30,

27 Hydrogeological Investigation and Modelling Study Proposed Crains Pit and Quarry Final Report Doc. ID: _Hydrogeology and Modelling Study_R0.docx Material Properties For a steady-state MODFLOW groundwater model the only material properties are vertical and horizontal hydraulic conductivity. Hydraulic conductivity values for all units are shown in Table 5. Figure 7 shows the distribution of hydraulic conductivity and the location of existing aggregate sites. The distribution of these properties is consistent with the hydrostratigraphic units described in Section Table 5 Model Material Properties Material Horizontal Hydraulic Conductivity (m/s) Vertical Hydraulic Conductivity (m/s) Overburden 1x10⁻⁴ 1x10⁻⁴ Shallow Weathered Bedrock 2x10⁻⁵ 2x10⁻⁵ Intermediate Weathered Bedrock 1.7x x10-7 Deeper Bedrock 2.5x x10-9 Figure 7 Hydraulic conductivity distribution, existing quarries at full development are also shown. January 30,
28 Hydrogeological Investigation and Modelling Study Proposed Crains Pit and Quarry Final Report Doc. ID: _Hydrogeology and Modelling Study_R0.docx 5.3 Calibration of Flow Model To calibrate the model, a combination of head measurements from the MOE WWIS and head measurements in monitoring wells at the proposed quarry site and nearby existing quarry sites were combined to develop a calibration target for the model. The MOE WWIS database contains measurements taken in different years, different seasons, different formations, and to varying levels of accuracy. In addition, the database may be biased towards underestimating the static water level due to inadequate time for post-drilling recovery of the static water level before measurement. This is a well know limitation of this database, meaning that the WWIS data only provides an approximate picture of the overall flow system. Errors were mitigated by filtering WWIS wells to remove potentially erroneous data points. The data was filtered first to remove wells with obviously incorrect data (e.g. negative water depths). The remaining wells were then filtered by the location method to remove the less accurate locations, since at the scale of the model, even minor inaccuracies may cause problems. Because the water table is thought to be relatively shallow in the area, wells with water depth greater than 10 m were also removed. Finally, a number of wells were removed by inspection if they had water levels that were drastically different from other nearby wells. In some areas there are a very large number of wells grouped in a relatively close proximity. To reduce bias in the calibration target these clusters of wells were combined and the average head at the average location of the well cluster was used for calibration. Observation wells at the proposed and adjacent existing quarries were not grouped in this fashion. Wells near existing quarries that have apparently been influenced by dewatering were not included in the calibration of the base model, which is meant to represent a pre-quarrying condition. Where observation wells had multiple measurements at different times or data loggers the average observed head during the duration of observations was used. To generate calculated heads corresponding to observations, the elevation of the observation was assumed to be halfway between the static water level and the bottom of the well for WWIS wells, and the midpoint of the screened interval for observation wells. Calibration was achieved by varying the recharge rate and the weathered bedrock hydraulic conductivity within reasonable limits to minimize the error in calculated head. The calibration statistics assessed were the mean error, mean absolute error, and the root mean squared error. Figure 8 shows the distribution of calibration wells across the model domain. January 30,
29 Hydrogeological Investigation and Modelling Study Proposed Crains Pit and Quarry Final Report Doc. ID: _Hydrogeology and Modelling Study_R0.docx Figure 8 Calibration wells and observation points 5.4 Model Scenarios The strategy employed for assessing the impact of quarrying operations was to first develop a calibrated model with no quarries present. Quarries are then added to the model, which is rerun to assess the impact of the excavation and dewatering. Using the no-quarry scenario for calibration is justified by the fact that the impact of quarrying on groundwater is likely to be limited to the vicinity of the quarrying operation, with most observation wells in the model domain not directly impacted by quarrying. In addition, while there a number of licensed quarries in the area, not all are fully operational, and none have been excavated to their maximum licensed depth. Observation wells near current quarrying operations show evidence of dewatering only where they are relatively close to the excavation. The base model simulates a pre-quarry flow regime. This model is used as the basis for assessing the impact of quarrying operations and the cumulative impact of quarrying in the area. The method of January 30,
30 Hydrogeological Investigation and Modelling Study Proposed Crains Pit and Quarry Final Report Doc. ID: _Hydrogeology and Modelling Study_R0.docx model calibration and the creation of a calibration target were discussed in Section 5.3. Two further scenarios are then simulated. The first is a steady-state model with all local quarries operating and pumping at their maximum licensed extraction limits. This provides a prediction of the potential impact on groundwater of currently licensed quarrying operations. In the final scenario the proposed quarry is added to the model, also at its full proposed extraction limits, providing a quantitative estimate of the potential impact of this proposed quarry. 5.5 Model Limitations Drawdown and subsurface flow (seepage) calculations presented in this report are theoretical estimates, providing a reasonable assessment based on known physical relationships, but limited by the availability of data. The sources of uncertainty include inaccurate monitoring and water well records, variability in hydraulic conductivity, unknown aquifer (fracture system) continuity, uncertain estimates of recharge zonation and magnitude, boundary conditions, and uncertain drain conductivity (i.e. interaction between ground and surface water). The model is intended to provide a screening tool to estimate drawdown and seepage rate changes caused by the proposed quarry, for the purpose of application for a license. January 30,

31 Hydrogeological Investigation and Modelling Study Proposed Crains Pit and Quarry Final Report Doc. ID: _Hydrogeology and Modelling Study_R0.docx 6 MODEL RESULTS In this section the model results and their resultant hydrogeological impacts are discussed. 6.1 Base Model Calibration The base model simulates a pre-quarry flow regime. This model is used as the basis for assessing the impact of quarrying operations and the cumulative impact of the proposed quarry. Figure 9 and Figure 10 summarize the calibration results. Figure 9 shows the contours of simulated head the distribution of residuals in the calibrated model. The errors in the model are generally randomly distributed; there is no apparent pattern. The hydraulic head distribution is plausible, and the overall pattern is similar to the interpolated equipotential surface shown in Figure 4. The elevation high north of the proposed quarry is also a groundwater high, in agreement with the interpolated surface. This groundwater high is caused by recharge into the surficial sand and gravel deposit. Figure 10 is a cross plot comparing modelled and measured heads. The error in the calculated values is evenly distributed about the diagonal, with no apparent trends in the error distribution. The cross plot also shows calibration statistics assessing the model fit to observations. Figure 9 Calibrated model residuals plot and simulated water surface in moderately weathered fractured bedrock approximately 15 m below ground surface. January 30,
32 Hydrogeological Investigation and Modelling Study Proposed Crains Pit and Quarry Final Report Doc. ID: _Hydrogeology and Modelling Study_R0.docx Figure 10 Cross plot, calibrated model. 6.2 Predicted Drawdown: Full Development of All Existing Quarries This scenario demonstrates the impact of currently licensed quarrying operations on the groundwater system. It is a steady-state model, and assumes that all quarries are fully excavated and discharging water, as such it does not represent the current impact of the quarries, and probably represents an overestimated future scenario in terms of total drawdown as all quarries are assumed operational at full extraction depth simultaneously. This is an improbable scenario as existing quarries are likely to be closed and returned to natural groundwater levels prior to the proposed quarry reaching full extraction. The calculated drawdown for all currently licensed quarries is shown in Figure 11. By comparing this drawdown prediction with the drawdown prediction when Crain s quarry is added to the model (see next section), we can assess the cumulative impact of the proposed quarry on the groundwater system. January 30,

33 Hydrogeological Investigation and Modelling Study Proposed Crains Pit and Quarry Final Report Doc. ID: _Hydrogeology and Modelling Study_R0.docx Figure 11 Calculated drawdown, all currently licensed quarries operating simultaneously at extraction limit. 6.3 Cumulative Impact of the Proposed Crains Quarry This scenario demonstrates the impact on the groundwater system of the proposed quarry in addition to currently licensed quarrying operations. It is a steady-state model, and assumes that all quarries are fully excavated and discharging water; as such, it does not represent the current impact of the quarries, and represents an overestimated future scenario in terms of total drawdown as all quarries are assumed operational at full extraction depth simultaneously, and the model is steady-state. On this basis, the calculated drawdown for all quarries is shown in Figure 12. By taking the difference between this model result and the results presented in Figure 11 we obtain the additional drawdown attributable to the proposed quarry, shown in Figure 13. The maximum drawdown is 22.7 metres near the centre of the quarry. The amount of drawdown decreases rapidly beyond the edges of the quarry. The one metre drawdown contour extends at most 750 m beyond the edge of the property. January 30,
34 Hydrogeological Investigation and Modelling Study Proposed Crains Pit and Quarry Final Report Doc. ID: _Hydrogeology and Modelling Study_R0.docx Figure 12 Calculated drawdown, all currently licensed quarries and proposed quarry operating simultaneously at extraction limit. January 30,

35 Hydrogeological Investigation and Modelling Study Proposed Crains Pit and Quarry Final Report Doc. ID: _Hydrogeology and Modelling Study_R0.docx Figure 13 Calculated additional drawdown from proposed quarry operating at extraction limit Effects on Private Wells Within the area affected by at least one metre of drawdown there are ten wells listed in the MOE WWIS, excluding monitoring wells on lands owned by adjacent quarry operators. Table 6 summarizes the affected wells, their total depths, and the modelled drawdown. The potentially affected wells are shown in Figure 14. Given that the static water level is likely between 5 and 10 mbgs in this area, a comparison between the modelled drawdown and total depth of the wells shows that there are only three wells with a predicted reduction in drawdown greater than 10 percent: , , Well has a predicted drawdown of 7.9 metres, but is not a water supply well and can be ignored for this assessment. There is a predicted drawdown of 5.8 metres at well Based on the water well record, the location of this well may be incorrect. Nevertheless, the static water level reported for this well is 16 feet (4.9 m) below ground surface, and the total depth is 100 feet (30.5 m). Water was found at 42 feet and 96 feet. A drawdown of 5.8 metres (19 feet) would reduce the effective length of the well from 84 feet to 65 feet, though the water level would still be 7 feet (2.1 m) higher than the shallowest water found, and 61 feet (18.6 m) above the deepest water found. A similar analysis could not be done for where predicted drawdown is 4.2 m, as inconsistencies in the water well record make it difficult to interpret. If we assume the static level is 10 mbgs, then 4.2 m of drawdown would reduce the effective length of the well from 22 m to 17.8 m. January 30,

36 Hydrogeological Investigation and Modelling Study Proposed Crains Pit and Quarry Final Report Doc. ID: _Hydrogeology and Modelling Study_R0.docx Based on this analysis it is unlikely that the water supply of neighboring homeowners will be noticeably affected by the quarrying operation. Table 6 MOE Well ID Wells affected by at least one metre of additional drawdown. Status Well Depth (m) Modelled Drawdown (m) Reduction in Available Drawdown Monitoring % Water Supply % Water Supply % Water Supply % Water Supply % Water Supply % Water Supply % Water Supply % Water Supply % Water Supply, located beside the Beagle Club quarry % Figure 14 Potentially affected wells, showing well IDs and well depth in metres. January 30,

37 Hydrogeological Investigation and Modelling Study Proposed Crains Pit and Quarry Final Report Doc. ID: _Hydrogeology and Modelling Study_R0.docx Effects on Wetlands A quarry in this location could affect local wetlands, particularly the Huntley wetland located West- Northwest of the proposed quarry. The primary groundwater effect of the quarry would be to divert seepage water away from the wetland, reducing the groundwater contribution to this feature. Figure 15 shows drawdown in the upper weathered bedrock, at the side of the quarry nearest the Huntley wetland. The discontinuous drawdown contours are caused by drying of this shallow layer during modelling, as a result of quarry dewatering. The one-metre drawdown contour extends a very short distance (approximately 50 m) below the wetland where it is closest to the quarry boundary. This could cause minor drainage of this portion of the wetland, however the low permeability glacial till underlying the wetland will mitigate any impact (Golder, 2013b). Based on modelling results, the proposed quarry will reduce the net groundwater inflow into the formations beneath the wetland by m 3 /y, most of which is caused by a reduction in seepage from the quarry property of roughly 6800 m 3 /y, and an increase in seepage toward the proposed quarry of m 3 /y. The remainder of the change results from changes in seepage flows moving into different areas due to the altered groundwater potential surface. Even if we assume that the deeper aquifer is directly interacting with the wetland, thereby discounting the presence of low permeability glacial till isolating the wetland, a reduction of m 3 /y will be negligible when compared to the overall water balance for the wetland, which will be dominated by precipitation and surface runoff. Given that the wetland sits on a low permeability till unit, the actual impact on the water balance will likely be substantially less than m 3 /y. Figure 15 Drawdown in upper weathered bedrock, near Huntley wetland. January 30,
38 Hydrogeological Investigation and Modelling Study Proposed Crains Pit and Quarry Final Report Doc. ID: _Hydrogeology and Modelling Study_R0.docx 7 CONCLUSIONS The proposed quarry is located largely in the Gull River formation. There is also a substantial deposit of sandy gravel above the bedrock at this site. In combination with the discontinuously present quaternary deposits of sand, gravel, or organics, the upper part (~5 m) of the bedrock is weathered and acts as a relatively permeable shallow regional aquifer. At greater depths the hydraulic conductivity is highly variable, evidence that permeability in this unit is dominated by discrete fractures of limited extent. Hydraulic test results from the proposed and adjacent quarries show a slight decrease in hydraulic conductivity with depth as the likelihood of intersecting a permeable fracture is reduced. There is no apparent association between hydrostratigraphic units and geological formations, and no clear evidence for any extensive permeable zone in the deeper parts of the formation. During the operational period when the quarry base is below the groundwater table, dewatering of the quarry will lower the groundwater surface surrounding the quarry. Based on information in the MOE WWIS there are nine water supply wells within the zone influenced by at least one metre of additional drawdown caused by the proposed quarry. One of these is owned by Cavanagh Construction and is located very close to the Beagle Club quarry. Of the remainder, only two wells show potential for lowering of the water level by more than 10% of the available drawdown, even under the improbable scenario of all quarries operating at full depth simultaneously. The cumulative impacts to the groundwater flow system are expected to be minimal with no observed negative effect on domestic wells. The effect of quarry dewatering on the nearby Huntley wetland is expected to be negligible. The one metre drawdown contour does extend into a small portion of the wetland near the northwest boundary of the property. This could potentially increase infiltration in this small portion of the wetland, but the impact will be greatly mitigated by the presence of a low-conductivity glacial till which isolates the wetland from deeper aquifers. Even if we assume that all changes in subsurface seepage rates in the formations below the wetland directly affect its water balance, the net reduction in flows to the wetland caused by the proposed quarry is m 3 /y based on modelling results. This would have a negligible impact when compared to the overall water balance for the wetland, which is dominated by precipitation and surface runoff. January 30,
39 Hydrogeological Investigation and Modelling Study Proposed Crains Pit and Quarry Final Report Doc. ID: _Hydrogeology and Modelling Study_R0.docx 8 REFERENCES De Marsily, G Quantitative Hydrogeology. Academic Press Inc., Orlando, FL. Golder Associates Ltd., 2013a. Groundwater Vulnerability Study, Richmond Village Well System, Richmond, Ontario. Prepared for Richmond Village South Limited, February Golder Associates Ltd., 2013b. Level 1 and Level 2 Hydrogeological and Hydrological Assessments in Support of Site Plan License Application for a Category 2 Class "A" Quarry Below Water Proposed Henderson II Quarry Ottawa, Ontario, prepared for Thomas Cavanagh Construction, June Golder Associates Ltd., Factual Information Associated with Hydrogeological and Hydrological Evaluations of Proposed Quarry Lands, Geographic Township of Goulbourn, City of Ottawa, Ontario, prepared for Ontario Inc., January Golder Associates Ltd., Report on 2009 and 2010 Voluntary Monitoring Programs, Geographic Township of Goulbourn, City of Ottawa, Ontario, prepared for R.W. Tomlinson Limited, Lafarge Canada Inc. and Thomas Cavanagh Construction Limited, July Golder Associates Ltd., Hydrogeological Investigation, Goulbourn Pit, Lot 11, concession 10, Geographic Township of Goulbourn, City of Ottawa, Ontario. September 3. Golder Associates Ltd., Application for a Permit to Take Water Thomas Cavanagh Construction Limited Beagle Club Quarry, Part of Lot 12, Concession X, Geographic Township of Goulbourn, City of Ottawa, Ontario prepared for MOE Kingston Regional Office, April Golder Associates Ltd., Revised Report on Hydrological Study of Dibblee Bell Quarry, Part of Lots 13 and 14, Concession XI, Geographic Township of Goulbourn, City of Ottawa, Ontario prepared for Dibblee Paving & Materials Limited, July Golder Associates Ltd., Application for a Permit to Take Water Bell Quarry, Part of Lots 13 and 14, Concession XI, Geographic Township of Goulbourn, City of Ottawa, Ontario, August Golder Associates Ltd., Hydrogeological Study Proposed Stittsville Quarry, Goulbourn Township, Ontario prepared for R.W. Tomlinson Limited, July Hvorslev, M. J., Time Lag and Soil Permeability in Groundwater Observations, U.S. Army Corps of Engineers, Waterways Exp. Sta. Bull. 36, Vicksburg, Mississippi. Ministry of the Environment, Memorandum from Dana Cruikshank (MOE) to Tara MacDonald (MOE) Re: 2008 and 2009 Annual Reports, Beagle Club Quarry, Part Lot 12, Concession X, Goulbourn Township, City of Ottawa, C of A # GVLLT, November 3, Mississippi Rideau Source Protection Region, Watershed Characterization Report (Preliminary Draft). January 30,
40 Hydrogeological Investigation and Modelling Study Proposed Crains Pit and Quarry Final Report Doc. ID: _Hydrogeology and Modelling Study_R0.docx Rideau Valley Conservation Authority (RVCA), 2011a, Assessment Report Rideau Valley Source Protection Area, Source : Accessed November Rideau Valley Conservation Authority (RVCA), 2011b. Jock River Subwatershed Report 2010 A report on the environmental condition of the Jock River. April. Williams, D.A Paleozoic Geology of the Ottawa-St. Lawrence Lowland, Southern Ontario; Ontario Geological Survey, Open File Report 5770, 292p. USGS, Modflow 2000, The U.S. Geological Survey Modular Ground-Water Model User Guide to Modularization Concepts and the Groundwater Flow Process, Open File Report U.S. Geological Survey, Reston, VA. January 30,


41 Hydrogeological Investigation and Modelling Study Proposed Crains Pit and Quarry Final Report Doc. ID: _Hydrogeology and Modelling Study_R0.docx 9 CLOSURE This report has been prepared for the exclusive use of Crains Construction Ltd. and McIntosh Perry Consulting Engineers Ltd., using a methodology for conducting a hydrogeological investigation and modelling study that is acceptable within the profession. Data obtained from hydrogeological investigations represent the conditions at the time of testing and sampling and are subject to variability with respect to location and time. Geofirma Engineering Ltd. has exercised professional judgment in collecting and analyzing the information and in formulating recommendations based on the results of the study. The mandate at Geofirma is to perform the given tasks within guidelines prescribed by the client and with the quality and due diligence expected within the profession. No other warranty or representation expressed or implied, as to the accuracy of the information or recommendations is included or intended in this report. Geofirma Engineering Ltd. hereby disclaims any liability or responsibility to any person or party, other than the party to whom this report is addressed, for any loss, damage, expense, fines or penalties which may arise or result from the use of any information or recommendations contained in this report by any other party. Any use of this report constitutes acceptance of the limits of Geofirma s liability. Geofirma s liability extends only to its client and only for the total amount of fees received from the client for this specific project and not to other parties who may obtain this report. Respectfully submitted, Geofirma Engineering Ltd. Robert Walsh, Ph.D., P.Eng. Numerical Modeller Steve Gaines, M.A.Sc., P.Geo, P. Eng. Geological Engineer Glen Briscoe, P. Eng. Senior Project Manager January 30,
42 Education: ROBERT WALSH Numerical Modeller GEOFIRMA ENGINEERING LTD. Ph.D., 2007, Applied Geology, University of Tübingen, Tübingen, Germany M.Sc., 2003, Applied Environmental Geoscience, University of Tübingen, Tübingen, Germany B.Sc., 2001, Civil-Environmental Engineering (Co-op program), University of Alberta, Edmonton, Alberta Experience Feb 2008 present Aug 2004 Dec 2007 Mar 2003 Jul 2004 Sep 2001 Oct 2003 Jan 2000 Aug 2000 May 1999 Aug 1999 May 1998 Dec 1998 Numerical Modeller, Geofirma Engineering Ltd., Ottawa, Ontario (formerly Intera Engineering Ltd.) Ph.D. candidate at the University of Tübingen, Tübingen, Germany Thesis: Numerical Modelling of Thermo-Hydro-Mechanical Coupled Processes in Fractured Porous Media Hydrogeological Modeller, Tübinger Grundwasser-Forschungsinstitut, Tübingen, Germany M.Sc. student at the University of Tübingen, Tübingen, Germany Thesis: Testing the Effectiveness of PEST Calibration Software in Complex and Highly Transient Conditions Student Engineer, Extraction Tailings Department, Syncrude Canada Ltd., Fort McMurray, Alberta Research Assistant, Department of Civil and Environmental Engineering, University of Alberta Materials Testing Technician, AGRA Earth and Environmental, Lethbridge, Alberta Professional Affiliations: Professional Engineers of Ontario (PEO), License # Related Professional Experience Lead modeller on a Phase 2 hydrogeological site characterization in support of a site plan license application for a Category 2 Class "A" Quarry Below Water in a fractured limestone setting in the Ottawa valley. Lead modeller for developing a coupled geomechanical and two-phase flow model using the T2GGM and FLAC3D codes showing EDZ development and gas transport. Verified against experimental results from the HG-A Experiment. Lead modeller studying gas generation from steel radioactive waste containers, and the potential effect of this gas on repository performance. Lead modeller studying maxiumum delta pressuring for gas storage operations in spent natural gas reservoirs in southern Ontario. Examined both the 2-phase flow processes and mechanical stability of the system (TOUGH2 and FLAC3D models). Modeller for reactor waste containment study, focusing on gas and water transport in the excavation damaged zone (EDZ) in an argillaceous formation targeted for radwaste disposal. Study focused on timedependent evolution of EDZ properties due to swelling and changes caused changing mechancial boundary conditions. Performed compilation of hydrogeologic properties from field and laboratory testing programs for the Phase 1 site characterization at the Bruce Site. Analyzed geomechanical data to derive bulk rock compressibility and calculate specific storage for the Silurian and Ordovician sedimentary rocks. Used geomechanical data from the DGR site characterisation program to quantify the degree of pore volume expansion during core relaxation.
43 R. Walsh Page 2 Numeric modeller for multi-year reactor fuel waste transport study. Project involves three-dimensional transport (FRAC3DVS) of various nuclides from defective containers in a deep geologic repository (DGR) located in a hypothetical Canadian Shield watershed. Modelling includes incorporation of climate effects and hydromechanically coupled site glaciation over a 1 Ma performance period Numeric modeller for safety assessments being conducted by a joint venture partnership to support the safety case for the proposed Deep Geological Repository at the Bruce Site. Involved in detailed gas and groundwater modelling to predict long-term (1 Ma) facility performance using TOUGH2 and FRAC3DVS. Numeric modeller for a 3D gas-transport model (TOUGH2) for the LASGIT (Large Scale Gas Injection Test) experiment at Aspo Hard Rock Laboratory in Sweden. Developed a geostatistical approach to generating permeability fields within bentonite buffer material. Developed a sourcewater protection model (groundwater flow and transport) for a heavily pumped groundwater aquifer in an industrialized area of the upper Rhine valley. Project involved incorporating dozens of industrial and drinking water wells, changing river levels and river surface slope, spatially and temporally heterogeneous recharge distributions, with complex, discontinuously connected fractured limestone and quaternay sand/gravel aquifers. Programmed utilities enabling the streamlined use of MODFLOW with a large number of stress periods. Developed a novel method for numerically modeling hydromechanical coupling in fractured rock using the GEOSYS modelling code. Wrote software for the generation of realistic rough fracture surfaces, and for the incorporation of these surfaces into finite element meshes. Modelled the effects of thermal transport and strain on hydromechanical behaviour of fractured rock. Examined the efficacy of parameter estimation software given very transient data. Planned and analysed pumping tests and installed and utilised borehole data loggers. Responsible for a weekly water-sampling program at a large oil sand mine. Created computer programs to track tailings process information at a large oil sand mine using Visual Basic and Excel, streamlining data acquisition. Carried out a 4-month study to increase understanding of oil sand tailings slurry properties with respect to construction capability. Developed a model to predict oil sand tailings slurry quality using online parameters in the bitumen extraction plant. Created and evaluated an artificial neural network model for trihalomethane production at a large water treatment plant in Edmonton. Publications: Walsh, R. O. Nasir, N. Calder, S. Sterling, S. Gaines, J. Avis, Combining TOUGH2 and FLAC3D to Solve Problems in Underground Natural Gas Storage. Proceedings: TOUGH Symposium 2015, September, 2015, Berkeley, California. Walsh, R. Nasir, O., Leung,.H., Avis, J Numerical Characterization of the Excavation Damaged Zone in the HG-A Experiment. Proceedings International High-Level Radioactive Waste Management Conference, April 12-16, 2015, Charleston, South Carolina. Walsh, R., Calder, N., and Avis, J A Simple Implementation of 1D Hydro-Mechanical Coupling in TOUGH2. Proceedings TOUGH Symposium 2012, Lawrence Berkeley National Laboratory, Berkeley, California, Sept 17-19, Avis, J., Suckling, P., Calder, N., and R. Walsh, T2GGM A Coupled Gas Generation Model for Deep Geologic Disposal of Radioactive Waste. Proceedings TOUGH Symposium 2012, Lawrence Berkeley National Laboratory, Berkeley, California, Sept 17-19, Walsh, R., McDermott, C., and Kolditz, O., Numerical modeling of stress-permeability coupling in rough fractures. Hydrogeology Journal 16(4): McDermott, C.I, Walsh, R., Mettier, R., Kosakowski, G., Kolditz, O Hybrid analytical and finite element numerical modeling of mass and heat transport in fractured rocks with matrix diffusion, Computational Geosciences 13(3):
44 R. Walsh Page 3 Wang, W., Walsh, R., Shao, H., Xie, M., and Kolditz, O., (2007) Simulation of long-term thermal, hydraulic and mechanical interaction between buffer and salt rock. 6th Conference on the Mechanical Behaviour of Salt: Understanding of the THMC Processes in Salt Rocks, Hannover, Technical Reports Walsh, R. and S. Gaines Delta Pressuring Study: Mandaumin Pool Modelling Report. Prepared for Union Gas Limited. N.Calder, Walsh, R. and O. Nasir Delta Pressuring Study: Dawn Pool Modelling Report. Prepared for Union Gas Limited. Walsh, R. and O. Nasir Delta Pressuring Study: Booth Creek Pool Modelling Report. Prepared for Union Gas Limited. Walsh, R. and O. Nasir Delta Pressuring Study: Bentpath East Pool Modelling Report. Prepared for Union Gas Limited. Walsh, R., O. Nasir and N Sgro Modelling of the HG-A Experiment (FORGE WP4.3). Nuclear Waste Management Organization Technical Report TR Toronto, Canada Walsh, R. and S. Gaines Delta Pressuring Study: Oil Springs East Pool Modelling Report. Prepared for Union Gas Limited. Walsh, R. and S. Gaines Delta Pressuring Study: Oil City Pool Modelling Report. Prepared for Union Gas Limited. Walsh, R. and S. Gaines Delta Pressuring Study: Enniskillen 28 Pool Modelling Report. Prepared for Union Gas Limited. Walsh, R. and S. Gaines Delta Pressuring Study: Bickford Pool Modelling Report. Prepared for Union Gas Limited. Walsh, R Delta Pressuring Study: Dawn 167 Pool Modelling Report. Prepared for Union Gas Limited. Walsh, R. and S. Gaines Delta Pressuring Study: Dawn Pool Modelling Report. Prepared for Union Gas Limited. Walsh, R Phase 2 Delta Pressuring Study: Bentpath Pool Modelling Report. Prepared for Union Gas Limited. Nuclear Waste Management Organization, Adaptive Phased Management Postclosure Safety Assessment of a Used Fuel Repository in Sedimentary Rock, Pre-Project Report. NWMO TR ,. Nuclear Waste Management Organisation, Toronto, Canada. Walsh, R Phase 1 Delta Pressuring Study for Bentpath and Rosedale Pools : Bentpath Pool Modelling Report. Prepared for Union Gas Limited. Walsh, R FORGE Work package 4.3: Modelling the HG-A experiement. Nuclear Waste Management Organisation, Toronto, Canada. Calder, N. and Walsh, R Modelling a Hydraulic Shut-In Test of the LASGIT Experiment. Nuclear Waste Management Organisation, Toronto, Canada. Walsh, R. and Calder, N A Simple 1D Fracture Model of the LASGIT Experiment.. Nuclear Waste Management Organisation, Toronto, Canada.
45 R. Walsh Page 4 Walsh, R Compilation and Consolidation of Field and Laboratory Data for Hydrogeological Properties, DGR Site Characterisation Document, Nuclear Waste Management Organisation, Toronto, Canada. Walsh, R. and J. Avis Glaciation Scenario: Groundwater and Radionuclide Transport Studies. Nuclear Waste Management Organisation, NWMO-TR , Toronto, Canada. J Avis, N Calder, P Humphreys, F King, P Suckling and R Walsh Postclosure Safety Assessment: Gas Modelling. Nuclear Waste Management Organisation, Toronto, Canada. West A., J Avis, N Calder and R Walsh Postclosure Safety Assessment: Groundwater Modelling. Nuclear Waste Management Organization, Toronto, Canada. Sterling, S, R Jackson, R Walsh, D Heagle, and I Clark Assessment of Porosity Data and Gas Phase Presence in DGR Cores, DGR Site Characterisation Document, Nuclear Waste Management Organisation, Toronto, Canada. Walsh, R. and N. Calder Analysis of the 2007 Water and Gas Injection Tests, Nuclear Waste Management Organisation,NWMO-TM-2009-LASGIT, Toronto, Canada. Walsh, R, J. Avis and N. Calder 2008 Postclosure Safety Assessment (V1):Groundwater Modelling. Quintessa Report QRS-1335A-TR14. Henley-on-Thames, United Kingdom. Walsh, R. and N. Calder Using Heterogeneous Permeability Distributions to Analyse the MX80-10 Lab Scale Experiment, Nuclear Waste Management Organisation,NWMO-TM-2008-LASGIT, Toronto, Canada. Calder, N, J. Avis, P Humphreys, F King, P Suckling and R Walsh Postclosure Safety Assessment (V1):Gas Modelling. Quintessa Report QRS-1335A-TR15. Henley-on-Thames, United Kingdom. Little, R., J. Avis, N. Calder, N. Garisto, P Humphreys, F. King, L Limer, R Metcalfe, J. Penfold, J Rees, D Savage, P Suckling, G Towler, R. Walke and R Walsh Postclosure Safety Assessment (V1). Quintessa Report QRS-1335A-TR17. Henley-on-Thames, United Kingdom.
46 APPENDIX A Site Figures Figure A.1 Site Location Figure A.2 Site Layout Figure A.3 Site Topography and PSW Catchment Areas Figure A.4 Surficial Geology Figure A.5 Bedrock Geology Figure A.6 Municipal Well Capture Zones
47 ³!(!(!(!( Hazeldean R Stittsville Main Street LEGEND Highway Road Trans-Canada Trail L Railway!(!( Transmission Line L Thomas Cavanaugh Construction Ltd., L Henderson Quarry L R.W. Tomlinson Ltd., Stittsville Quarry L L L Lafarge Canada, Bell Quarry Fernbank Road Intermittent Watercourse Permanent Watercourse Waterbody Quaternary Watershed Provincially Significant Wetland Âì 7 L L L L L L Dwyer Hill Road L L L L Proposed Pit/Quarry Site L Thomas Cavanaugh Construction Ltd., Beagle Club Quarry L Munster Road Flewellyn Road Thomas Cavanaugh Construction Ltd., Goulbourn Quarry L G:\Data\Project\FernbankRd\Maps\13-213_CrainQuarry\13-213_WibCrainFernbankProperty_Figure1_SiteLocation.mxd d Fallowfield Road Highway 17 Mansfield Road Conley Road Eastern Ontario Municipalities MISSISSIPPI MILLS Highway 7 BECKWITH CITY OF OTTAWA MONTAGUE Kilometres Highway 417 QUEENSWAY Highway 416 NORTH GRENVILLE Highway 417 peland Road RUSSELL NORTH DUNDAS L Wooded Area Permit To Take Water Quarry Pit Pit and Quarry Proposed Crains' Pit/Quarry Site Scale 1:70, Project No Kilometers Projection: UTM NAD 83 Zone 18N Source: LIO, Ontario Ministry of Natural Resources DESIGN: NMP CAD/GIS:NMP/ADG CHECK: GDB REV: 0 Figure A.1 Site Location PROJECT Hydrogeological Investigation and Modelling Study - Proposed Crains' Pit and Quarry, 7731 Fernbank Road, City of Ottawa, Ontario DATE: 1/9/2015
48 ³ LEGEND Road Trans-Canada Trail Intermittent Watercourse Provincially Significant Wetland + U + U Permanent Watercourse TW13-3 Permanent Waterbody Wetlands A U Provincially Significant Wetland Quarry A License Boundary Proposed Crains' Pit/Quarry Site THOMAS CAVANAGH CONSTRUCTION LIMITED Extraction Area License Offset Monitoring Wells + U A U + U + U + U BH U BH04-5 TW U A Figure A.2 Site Layout TW13-4 Scale 1:10,000 + U A TW n k ad PROJECT Hydrogeological Investigation and Modelling Study - Proposed Crains' Pit and Quarry, 7731 Fernbank Road, City of Ottawa, Ontario DESIGN: NMP CAD/GIS:NMP/ADG CHECK: GDB REV: 0 er st Ro ad G:\Data\Project\FernbankRd\Maps\13-213_CrainQuarry\13-213_WibCrainFernbankProperty_Figure2_SiteLayout.mxd 200 Meters Project No un M r Fe n ba 100 Projection: UTM NAD 83 Zone 18N Source: LIO, Ontario Ministry of Natural Resources + U Rural Subdivision Ro 50 DATE: 1/9/2015
49 ³ LEGEND Road Trans-Canada Trail Permanent Watercourse Waterbody Provincially Significant Wetland Proposed Crains' Pit/Quarry Site Ground Surface Contours Drainage Flow Drainage Culvert Drainage Dam Drainage Ditch Weir Figure A.3 Site Topography and PSW Catchment Areas Scale 1:12, Meters Projection: UTM NAD 83 Zone 18N Source: LIO, Ontario Ministry of Natural Resources, McIntosh Perry Surveying Inc., ERSI Project No PROJECT Hydrogeological Investigation and Modelling Study - Proposed Crains' Pit and Quarry, 7731 Fernbank Road, City of Ottawa, Ontario Sources: Esri, HERE, DeLorme, TomTom, Intermap, increment P Corp., GEBCO, USGS, FAO, NPS, NRCAN, GeoBase, IGN, Kadaster NL, Ordnance Survey, Esri Japan, METI, Esri China (Hong Kong), swisstopo, MapmyIndia, OpenStreetMap contributors, and the GIS User Community G:\Data\Project\FernbankRd\Maps\13-213_CrainQuarry\13-213_WibCrainFernbankProperty_Figure3_Topoand Catchment_MacPerryContours.mxd DESIGN: ADG CAD/GIS:ADG CHECK: GDB REV: 0 DATE: 1/9/2015
50 ³ LEGEND Highway Road Trans-Canada Trail Intermittent Watercourse Permanent Watercourse Waterbody Provincially Significant Wetland Proposed Crains' Pit/Quarry Site Other Quarries Surficial Geology Highway 7 Conley Road Paleozoic bedrock Till Foreshore deposits Organic deposits Dwyer Hill Road Fernbank Road Lucas Lane Munster Road Flewellyn Road Fallowfield Road Figure A.4 Surficial Geology Scale 1:60, ,000 1,500 2,000 Meters Projection: UTM NAD 83 Zone 18N Source: LIO, OGS MRD128 Project No Mansfield Road PROJECT Hydrogeological Investigation and Modelling Study - Proposed Crains' Pit and Quarry, 7731 Fernbank Road, City of Ottawa, Ontario Kolo Drive DESIGN: NMP CAD/GIS:NMP/ADG CHECK: GDB REV: 0 DATE: 1/9/2015 G:\Data\Project\FernbankRd\Maps\13-213_CrainQuarry\13-213_WibCrainFernbankProperty_Figure4_SurficialGeology.mxd
51 ³ LEGEND Highway Road Trans-Canada Trail Intermittent Watercourse Permanent Watercourse Waterbody Provincially Significant Wetland Proposed Crains' Pit/Quarry Site Other Quarries Bedrock Geology Highway 7 Bobcaygeon Formation Gull River Formation Oxford Formation Conley Road Dwyer Hill Road Fernbank Road Flewellyn Road Lucas Lane Munster Road Munster Road Fallowfield Road Mansfield Road Scale 1:60, ,000 1,500 2,000 Project No Figure A.5 Bedrock Geology Meters Projection: UTM NAD 83 Zone 18N Source: LIO, OGS MRD219 PROJECT Hydrogeological Investigation and Modelling Study - Proposed Crains' Pit and Quarry, 7731 Fernbank Road, City of Ottawa, Ontario Kolo Drive DESIGN: NMP CAD/GIS:NMP/ADG CHECK: GDB REV: 0 DATE: 1/9/2015 G:\Data\Project\FernbankRd\Maps\13-213_CrainQuarry\13-213_WibCrainFernbankProperty_Figure5_BedrockGeology.mxd


52 ³ Highway 7 Jinkinson Road Munster Road Fernbank Road Flewellyn Road Fallowfield Road Conley Road Shea Road Shea Road Shea Road Richmond Road LEGEND Highway Road Speedway Road Lucas Lane Mansfield Road Huntley Road Garvin Road Joys Road Akins Road Brownlee Road Rushmore Road Eagleson Road Cambrian Road Trans-Canada Trail Intermittent Watercourse Permanent Watercourse Waterbody Provincially Significant Wetland Proposed Crains' Pit/Quarry Site Other Quarries Wellhead Vulnerability Score Joys Road Ottawa Street McBean Street Ashton Station Road Dwyer Hill Road Copeland Road Figure A.6 Municipal Well Capture Zones McCaffrey Trail Bleeks Road Franktown Road Greens Road Scale 1:120, Kilometers McLinton Road Jock Trail Projection: UTM NAD 83 Zone 18N Source: LIO, Ontario Ministry of Natural Resources Project No Copeland Road Woods Road Harbison Road PROJECT Hydrogeological Investigation and Modelling Study - Proposed Crains' Pit and Quarry, 7731 Fernbank Road, City of Ottawa, Ontario Kettles Road DESIGN: NMP CAD/GIS:NMP/ADG CHECK: GDB REV: 0 DATE: 1/9/2015 G:\Data\Project\FernbankRd\Maps\13-213_CrainQuarry\13-213_WibCrainFernbankProperty_Figure6_WellHeadProtectionArea.mxd
53 APPENDIX B Report Tables Table B.1 Groundwater Elevations Table B.2 Summary of Local PTTW Licences
54 Table B.1 Groundwater Elevations Monitoring Well ID Ground Surface Elevation (masl) Groundwater Elevation (masl)* 29-Jun May-13 5-Jun Jun-13 5-Jul Aug Aug-13 3-Oct-13 A A A Dry A A BH Dry Dry BH Dry Dry Dry Dry Dry Dry TW13-01 A TW13-01 B TW13-01 C TW13-01 D TW13-02 A TW13-02 B TW13-02 C TW13-02 D TW13-03 A TW13-03 B TW13-03 C TW13-03 D TW Domestic Well Notes: -- = data not available/not collected * = groundwater elevations collected by MPCE Prepared by: SNG Reviewed by: GDB Date: 23-Jan _Table B 1_R0 1 of 2
55 Table B.1 Groundwater Elevations Monitoring Well ID Ground Surface Elevation (masl) A A A A A BH BH TW13-01 A TW13-01 B TW13-01 C TW13-01 D TW13-02 A TW13-02 B TW13-02 C TW13-02 D TW13-03 A TW13-03 B TW13-03 C TW13-03 D TW Domestic Well Groundwater Elevation (masl)* 6-Nov Nov Nov Nov-13 6-Dec Jan Mar-14 6-May Dry Dry Dry Dry Dry Dry Dry Dry Dry Dry Dry Dry Notes: -- = data not available/not collected * = groundwater elevations collected by MPCE Prepared by: SNG Reviewed by: GDB Date: 23-Jan _Table B 1_R0 2 of 2
56 Table B.2 Summary of Local PTTW Licences Site - Owner MOE Permit Number Address (Goulbourn Township, City of Ottaw) Purpose Source ID Maximum Water Taking Per Minute (L) Maximum Hours per Day/Days per Year Maximum Per Day (L) Expiry (dd/mm/yyy) Well # / Well # / Well #3 90 8/40 33,000 Glen Mar Golf Course - GlenMaur Golf Course Limited 04-P Fernbank Road, Ashton, ON Commercial Irrigation Well #4 90 8/40 33,000 Well #5 90 8/40 33,000 Pond # /40 1,200,000 08/03/2014 Pond # /40 1,200,000 Pond # /40 1,200,000 Pond # /40 1,200,000 Well #3 90 8/60 33,000 Glen Mar Golf Course - GlenMaur Golf Course Limited HYLD8 Lot 9, Conc Fernbank Road, Ashton, ON Commercial Irrigation Water Supply Well #4 90 8/60 33,000 Reservoir Pond Well #1 (Clubhouse) Well #2 (Pro Shop) /60 1,200, /270 21, /270 18,000 01/05/2024 January 28,
57 Table B.2 Summary of Local PTTW Licences Site - Owner MOE Permit Number Address (Goulbourn Township, City of Ottaw) Purpose Source ID Maximum Water Taking Per Minute (L) Maximum Hours per Day/Days per Year Maximum Per Day (L) Expiry (dd/mm/yyy) Well #5 (Hole 7) 90 8/60 33,000 Canadian Golf and Country Club JPC & ZCKP9 Well # / ,548 Well # / ,924 30/09/ /09/2014 Well # / ,000 Canadian Golf and Country Club Ontario Inc E7JAX Lot 10, Conc Golf Club Way, Ashton, ON Commercial Irrigation Well # /150 69,120 Well # / ,920 Pond C /150 2,182,124 Well # /365 40,915 01/04/2021 Water Supply Well # /365 98,196 Well # /365 58,917 Stittsville Quarry - R.W. Tomlinson WNJGY Lots 14 and 15, Conc. 11 Dewatering Quarry Sump /365 7,776,000 06/01/2017 Aggregate Washing Quarry Sump /365 7,776,000 Miscellaneous Quarry Sump /365 1,944,000 January 28,
58 Table B.2 Summary of Local PTTW Licences Site - Owner MOE Permit Number Address (Goulbourn Township, City of Ottaw) Purpose Source ID Maximum Water Taking Per Minute (L) Maximum Hours per Day/Days per Year Maximum Per Day (L) Expiry (dd/mm/yyy) Cumberland Ready Mix a division of R.W. Tomlinson B8R8X Lot 16, Conc. 11 Manufacturing TW / ,000 30/11/2020 Manufacturing TW /313 94,000 Manufacturing TW / ,000 Bell Quarry - Lafarge Canada Inc J3M Lots 13 and 14, Conc. 10 Dewatering Quarry Sump /365 6,255,360 31/10/2017 Aggregate Washing Quarry Sump /365 6,255,360 Miscellaneous Quarry Sump /365 4,320,000 Beagle Club Quarry - Thomas Cavanagh Construction Ltd NFPCU Part of Lot 12, Conc. 10 Dewatering Quarry Sump 12,312 24/365 17,729,280 22/05/2019 Industrial Quarry Sump 12,312 24/ ,000 Henderson Quarry - Thomas Cavanagh Construction Ltd QVK9D Lot 13, Conc. 11 Dewatering Quarry Sump /365 6,480,000 30/06/2019 Aggregate Washing Quarry Sump /365 6,480,000 Industrial Quarry Sump / ,000 January 28,
59 APPENDIX C Borehole Stratigraphic and Instrumentation Logs
60 BOREHOLE STRATIGRAPHIC AND INSTRUMENTATION LOG Borehole Number: TW13-01 Project Number: Client: Crains' Construction Ltd. Site Location: 7731 Fernbank Road, Goulbourn Township, Ottawa Coordinates: E, N (UTM Zone 18) Drilling Method: Air Hammer Drilling Rig: Atlas Copeo T3W MOE Well ID: A Date Completed: 21-Oct-13 Supervisor: JFD Logged By: JFD Ground Surface Elevation: Date of Water Level Measurement: 10-Dec-13 DEPTH BGS SAMPLES LAB SAMPLE BLOW COUNT CGI (ppm) PID (ppm) LOG STRATIGRAPHIC DESCRIPTION INSTALLATION ft m Prepared By: ECK Reviewed By: JFD Doc: _GEOFIRMA BHS_R0B.GPJ Template: GEOFIRMA_TEMPLATE.GDT GROUND SURFACE LIMESTONE Interbedded limestone and silty dolostone (lower member); finely crystalline limestone with shaly partings (upper member), grey (Gull River formation) dark grey dolostone, grey fractured light grey Page 1 of 3 TW13-01 D C B A 32 mm PVC riser Bentonite seal Silica sand 32 mm PVC screen Bentonite seal
61 BOREHOLE STRATIGRAPHIC AND INSTRUMENTATION LOG Borehole Number: TW13-01 Project Number: Client: Crains' Construction Ltd. Site Location: 7731 Fernbank Road, Goulbourn Township, Ottawa Coordinates: E, N (UTM Zone 18) Drilling Method: Air Hammer Drilling Rig: Atlas Copeo T3W MOE Well ID: A Date Completed: 21-Oct-13 Supervisor: JFD Logged By: JFD Ground Surface Elevation: Date of Water Level Measurement: 10-Dec-13 DEPTH BGS SAMPLES LAB SAMPLE BLOW COUNT CGI (ppm) PID (ppm) LOG STRATIGRAPHIC DESCRIPTION INSTALLATION ft m LIMESTONE Interbedded limestone and silty dolostone (lower member); finely crystalline limestone with shaly partings (upper member), grey (Gull River formation) (continued) fracture 57 L/min greenish-grey limestone, dark grey dolostone, light grey limestone, dark grey Silica sand 32 mm PVC screen Bentonite seal Silica sand 32 mm PVC screen Bentonite seal Prepared By: ECK Reviewed By: JFD Doc: _GEOFIRMA BHS_R0B.GPJ Template: GEOFIRMA_TEMPLATE.GDT Page 2 of 3
62 BOREHOLE STRATIGRAPHIC AND INSTRUMENTATION LOG Borehole Number: TW13-01 Project Number: Client: Crains' Construction Ltd. Site Location: 7731 Fernbank Road, Goulbourn Township, Ottawa Coordinates: E, N (UTM Zone 18) Drilling Method: Air Hammer Drilling Rig: Atlas Copeo T3W MOE Well ID: A Date Completed: 21-Oct-13 Supervisor: JFD Logged By: JFD Ground Surface Elevation: Date of Water Level Measurement: 10-Dec-13 DEPTH BGS SAMPLES LAB SAMPLE BLOW COUNT CGI (ppm) PID (ppm) LOG STRATIGRAPHIC DESCRIPTION INSTALLATION ft m LIMESTONE Interbedded limestone and silty dolostone (lower member); finely crystalline limestone with shaly partings (upper member), grey (Gull River formation) (continued) dolostone, light grey limestone, dark grey dolostone, dark grey BOREHOLE TERMINATED Total Depth of TW mbgs Static Water Levels D = 5.84 mbtr C = 5.96 mbtr B = 6.23 mbtr A = 8.19 mbtr Silica sand 32 mm PVC screen Prepared By: ECK Reviewed By: JFD Doc: _GEOFIRMA BHS_R0B.GPJ Template: GEOFIRMA_TEMPLATE.GDT Page 3 of 3
63 BOREHOLE STRATIGRAPHIC AND INSTRUMENTATION LOG Borehole Number: TW13-02 Project Number: Client: Crains' Construction Ltd. Site Location: 7731 Fernbank Road, Goulbourn Township, Ottawa Coordinates: E, N (UTM Zone 18) Drilling Method: Air Hammer Drilling Rig: Atlas Copeo T3W MOE Well ID: A Date Completed: 10-Mar-14 Supervisor: JFD Logged By: JFD Ground Surface Elevation: Date of Water Level Measurement: 23-Apr-14 DEPTH BGS SAMPLES LAB SAMPLE BLOW COUNT CGI (ppm) PID (ppm) LOG STRATIGRAPHIC DESCRIPTION INSTALLATION ft m Prepared By: ECK Reviewed By: JFD Doc: _GEOFIRMA BHS_R0B.GPJ Template: GEOFIRMA_TEMPLATE.GDT GROUND SURFACE SAND with gravel, medium grained, loose, brown, dry LIMESTONE Interbedded limestone and silty dolostone (lower member); finely crystalline limestone with shaly partings (upper member), grey (Gull River Formation) dolostone, grey fracture 5.7 L/min Page 1 of 3 TW13-02 D C B A 32 mm PVC riser Silica sand 32 mm PVC screen Bentonite seal Silica sand 32 mm PVC screen
64 BOREHOLE STRATIGRAPHIC AND INSTRUMENTATION LOG Borehole Number: TW13-02 Project Number: Client: Crains' Construction Ltd. Site Location: 7731 Fernbank Road, Goulbourn Township, Ottawa Coordinates: E, N (UTM Zone 18) Drilling Method: Air Hammer Drilling Rig: Atlas Copeo T3W MOE Well ID: A Date Completed: 10-Mar-14 Supervisor: JFD Logged By: JFD Ground Surface Elevation: Date of Water Level Measurement: 23-Apr-14 DEPTH BGS SAMPLES LAB SAMPLE BLOW COUNT CGI (ppm) PID (ppm) LOG STRATIGRAPHIC DESCRIPTION INSTALLATION ft m LIMESTONE Interbedded limestone and silty dolostone (lower member); finely crystalline limestone with shaly partings (upper member), grey (Gull River Formation) (continued) limestone, black dolostone, black fracture 15 L/min limestone, black Bentonite seal Silica sand 32 mm PVC screen Bentonite seal Silica sand 32 mm PVC screen Prepared By: ECK Reviewed By: JFD Doc: _GEOFIRMA BHS_R0B.GPJ Template: GEOFIRMA_TEMPLATE.GDT Page 2 of 3
65 BOREHOLE STRATIGRAPHIC AND INSTRUMENTATION LOG Borehole Number: TW13-02 Project Number: Client: Crains' Construction Ltd. Site Location: 7731 Fernbank Road, Goulbourn Township, Ottawa Coordinates: E, N (UTM Zone 18) Drilling Method: Air Hammer Drilling Rig: Atlas Copeo T3W MOE Well ID: A Date Completed: 10-Mar-14 Supervisor: JFD Logged By: JFD Ground Surface Elevation: Date of Water Level Measurement: 23-Apr-14 DEPTH BGS SAMPLES LAB SAMPLE BLOW COUNT CGI (ppm) PID (ppm) LOG STRATIGRAPHIC DESCRIPTION INSTALLATION ft m LIMESTONE Interbedded limestone and silty dolostone (lower member); finely crystalline limestone with shaly partings (upper member), grey (Gull River Formation) (continued) dolostone, fracture 15 L/min, black BOREHOLE TERMINATED Total Depth of TW mbgs Static Water Levels D = mbtr C = mbtr B = mbtr A = mbtr Prepared By: ECK Reviewed By: JFD Doc: _GEOFIRMA BHS_R0B.GPJ Template: GEOFIRMA_TEMPLATE.GDT Page 3 of 3
66 BOREHOLE STRATIGRAPHIC AND INSTRUMENTATION LOG Borehole Number: TW13-03 Project Number: Client: Crains' Construction Ltd. Site Location: 7731 Fernbank Road, Goulbourn Township, Ottawa Coordinates: E, N (UTM Zone 18) Drilling Method: Air Hammer Drilling Rig: Atlas Copeo T3W MOE Well ID: A Date Completed: 10-Mar-14 Supervisor: JFD Logged By: JFD Ground Surface Elevation: Date of Water Level Measurement: 23-Apr-14 DEPTH BGS SAMPLES LAB SAMPLE BLOW COUNT CGI (ppm) PID (ppm) LOG STRATIGRAPHIC DESCRIPTION INSTALLATION ft m Prepared By: ECK Reviewed By: JFD Doc: _GEOFIRMA BHS_R0B.GPJ Template: GEOFIRMA_TEMPLATE.GDT GROUND SURFACE SAND with gravel, medium grained, loose, brown, dry LIMESTONE Interbedded limestone and silty dolostone (lower member); finely crystalline limestone with shaly partings (upper menber), grey (Gull River Formation) dolostone, grey Page 1 of 3 TW13-03 D C B A 32 mm PVC riser Silica sand 32 mm PVC screen Bentonite seal
67 BOREHOLE STRATIGRAPHIC AND INSTRUMENTATION LOG Borehole Number: TW13-03 Project Number: Client: Crains' Construction Ltd. Site Location: 7731 Fernbank Road, Goulbourn Township, Ottawa Coordinates: E, N (UTM Zone 18) Drilling Method: Air Hammer Drilling Rig: Atlas Copeo T3W MOE Well ID: A Date Completed: 10-Mar-14 Supervisor: JFD Logged By: JFD Ground Surface Elevation: Date of Water Level Measurement: 23-Apr-14 DEPTH BGS SAMPLES LAB SAMPLE BLOW COUNT CGI (ppm) PID (ppm) LOG STRATIGRAPHIC DESCRIPTION INSTALLATION ft m LIMESTONE Interbedded limestone and silty dolostone (lower member); finely crystalline limestone with shaly partings (upper menber), grey (Gull River Formation) (continued) limestone, black Silica sand 32 mm PVC screen Bentonite seal Silica sand 32 mm PVC screen Bentonite seal Prepared By: ECK Reviewed By: JFD Doc: _GEOFIRMA BHS_R0B.GPJ Template: GEOFIRMA_TEMPLATE.GDT Page 2 of 3
68 BOREHOLE STRATIGRAPHIC AND INSTRUMENTATION LOG Borehole Number: TW13-03 Project Number: Client: Crains' Construction Ltd. Site Location: 7731 Fernbank Road, Goulbourn Township, Ottawa Coordinates: E, N (UTM Zone 18) Drilling Method: Air Hammer Drilling Rig: Atlas Copeo T3W MOE Well ID: A Date Completed: 10-Mar-14 Supervisor: JFD Logged By: JFD Ground Surface Elevation: Date of Water Level Measurement: 23-Apr-14 DEPTH BGS SAMPLES LAB SAMPLE BLOW COUNT CGI (ppm) PID (ppm) LOG STRATIGRAPHIC DESCRIPTION INSTALLATION ft m LIMESTONE Interbedded limestone and silty dolostone (lower member); finely crystalline limestone with shaly partings (upper menber), grey (Gull River Formation) (continued) dolostone, light grey BOREHOLE TERMINATED Total Depth of TW mbgs Static Water Levels D = mbtr C = mbtr B = 3.74 mbtr A = mbtr Silica sand 32 mm PVC screen Prepared By: ECK Reviewed By: JFD Doc: _GEOFIRMA BHS_R0B.GPJ Template: GEOFIRMA_TEMPLATE.GDT Page 3 of 3
69 BOREHOLE STRATIGRAPHIC AND INSTRUMENTATION LOG Borehole Number: TW13-04 Project Number: Client: Crains' Construction Ltd. Site Location: 7731 Fernbank Road, Goulbourn Township, Ottawa Coordinates: E, N (UTM Zone 18) Drilling Method: Air Hammer Drilling Rig: Atlas Copeo T3W MOE Well ID: A Date Completed: 21-Oct-13 Supervisor: JFD Logged By: JFD Ground Surface Elevation: Date of Water Level Measurement: 24-Oct-14 DEPTH BGS SAMPLES LAB SAMPLE BLOW COUNT CGI (ppm) PID (ppm) LOG STRATIGRAPHIC DESCRIPTION INSTALLATION ft m Prepared By: ECK Reviewed By: JFD Doc: _GEOFIRMA BHS_R0B.GPJ Template: GEOFIRMA_TEMPLATE.GDT GROUND SURFACE SAND medium grained, loose, brown, moist LIMESTONE Gull River formation interbedded limestone and silty dolostone (lower menber); finely crystalline limestone with shaly partings (upper menber), grey dark grey dolostone, grey Page 1 of 2 TW13-04 Steel casing
70 BOREHOLE STRATIGRAPHIC AND INSTRUMENTATION LOG Borehole Number: TW13-04 Project Number: Client: Crains' Construction Ltd. Site Location: 7731 Fernbank Road, Goulbourn Township, Ottawa Coordinates: E, N (UTM Zone 18) Drilling Method: Air Hammer Drilling Rig: Atlas Copeo T3W MOE Well ID: A Date Completed: 21-Oct-13 Supervisor: JFD Logged By: JFD Ground Surface Elevation: Date of Water Level Measurement: 24-Oct-14 DEPTH BGS SAMPLES LAB SAMPLE BLOW COUNT CGI (ppm) PID (ppm) LOG STRATIGRAPHIC DESCRIPTION INSTALLATION ft m dolostone, grey (continued) fracture 37.9 L/min BOREHOLE TERMINATED Total Depth of TW mbgs at mbgs Static Water Levels Prepared By: ECK Reviewed By: JFD Doc: _GEOFIRMA BHS_R0B.GPJ Template: GEOFIRMA_TEMPLATE.GDT Page 2 of 2
71 APPENDIX D Core Photographs


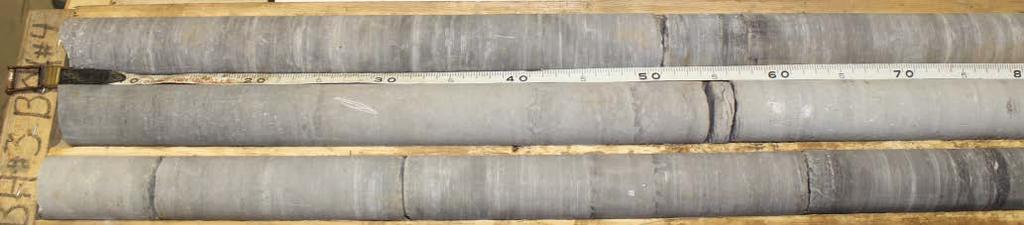
72 BH 3 Box 1 Top 0 m Box 2 Top Box 1 Bottom Box 2 Bottom Box 3 Top Box 4 Top Box 3 Bottom Box 4 Bottom


73 BH 3 Box 5 Top Box 6 Top Box 5 Bottom Box 7 Top Box 6 Bottom Box 8 Top Box 7 Bottom Box 8 Bottom m


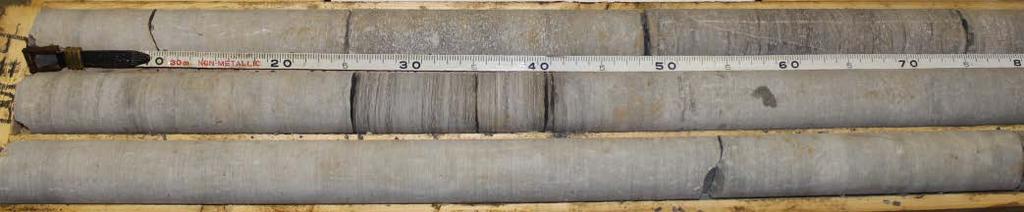
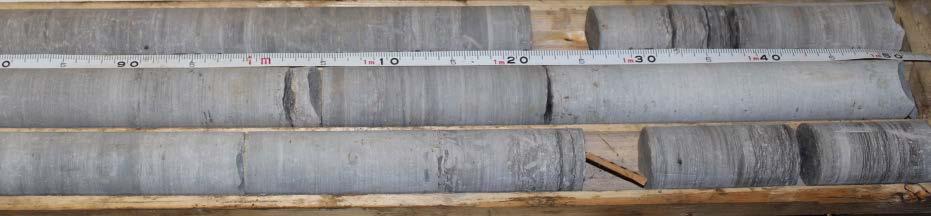
74 BH 4 Box 1 Top 0 m Box 1 Bottom Box 2 Top Box 3 Top Box 2 Bottom Box 3 Bottom Box 4 Top Box 4 Bottom


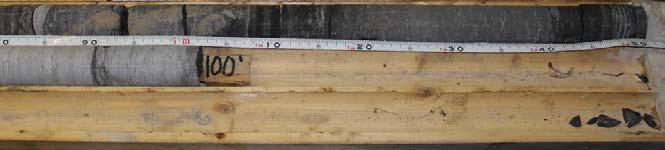
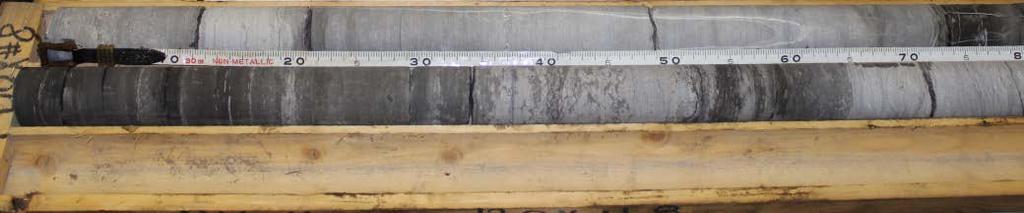
75 BH 4 Box 5 Top Box 6 Top Box 5 Bottom Box 7 Top Box 6 Bottom Box 8 Top Box 7 Bottom Box 8 Bottom m


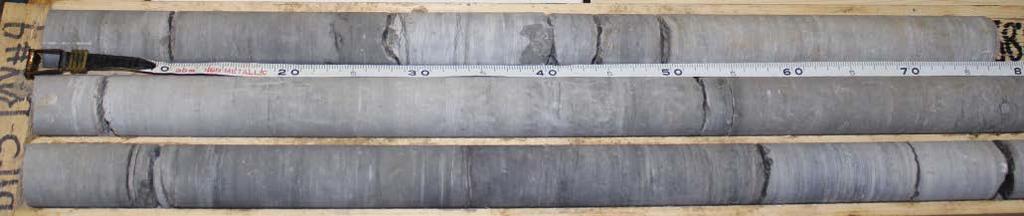
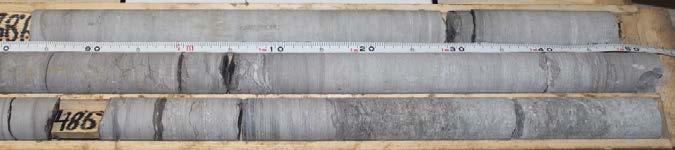
76 BH 5 Box 1 Top 0 m Box 1 Bottom Box 2 Top Box 2 Bottom Box 3 Top Box 3 Bottom Box 4 Top Box 4 Bottom


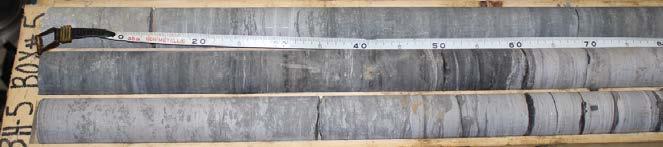
77 BH 5 Box 5 Top Box 5 Bottom Box 6 Top Box 7 Top Box 6 Bottom Box 8 Top Box 7 Bottom Box 8 Bottom m
Hydrogeological Assessment for Part of Lots 2 and 3, Concession 5, Township of Thurlow, County of Hastings 1.0 INTRODUCTION. 1.
 February 10,2017 25506400 Ontario Ltd. Foxboro, ON Attention: Brad Newbatt Re: Hydrogeological Assessment for Part of Lots 2 and 3, Concession 5, Township of Thurlow, County of Hastings 1.0 INTRODUCTION
patersongroup Mineral Aggregate Assessment 3119 Carp Road Ottawa, Ontario Prepared For Mr. Greg LeBlanc March 7, 2014 Report: PH2223-REP.
 Geotechnical Engineering Environmental Engineering group Hydrogeology Geological Engineering Archaeological Studies Materials Testing 3119 Carp Road Prepared For Mr. Greg LeBlanc March 7, 2014 Paterson
Environmental Assessment for a New Landfill Footprint at the West Carleton Environmental Centre
 Waste Management of Canada Corporation Environmental Assessment for a New Landfill Footprint at the West Carleton Environmental Centre GEOLOGY AND HYDROGEOLOGY EXISTING CONDITIONS REPORT Prepared by: WESA
Groundwater Investigation SOUTHGATE GRAVEL PIT Part of Lot 15, Concession 15 (formerly Township of Proton), Township of Southgate.
, Township of Southgate.") Groundwater Investigation SOUTHGATE GRAVEL PIT Part of Lot 15, Concession 15 (formerly Township of Proton), Township of Southgate County of Grey October, 2014 Prepared for: Drysdale Aggregate Consulting
Groundwater Investigation SOUTHGATE GRAVEL PIT Part of Lot 15, Concession 15 (formerly Township of Proton), Township of Southgate County of Grey October, 2014 Prepared for: Drysdale Aggregate Consulting
AGENDA ITEM 6 APPENDIX /0151/DET GROUND WATER & SURFACE WATER MANAGEMENT PLAN
 CAIRNGORMS NATIONAL PARK AUTHORITY Planning Committee Agenda Item 6 Appendix 18 12/10/2018 AGENDA ITEM 6 APPENDIX 18 2018/0151/DET GROUND WATER & SURFACE WATER MANAGEMENT PLAN Dalwhinnie Quarry Ground
TECHNICAL SUPPORT DOCUMENT # 1 COMPARATIVE EVALUATION OF ALTERNATIVE SITES APPENDIX TSD#1-H. Design & Operations Component
 TECHNICAL SUPPORT DOCUMENT # 1 COMPARATIVE EVALUATION OF ALTERNATIVE SITES APPENDIX TSD#1-H Design & Operations Component February 2013 February 2013 Design & Operations Component Appendix TSD#1-H COMPARATIVE
KANSAS GEOLOGICAL SURVEY Open File Report LAND SUBSIDENCE KIOWA COUNTY, KANSAS. May 2, 2007
 KANSAS GEOLOGICAL SURVEY Open File Report 2007-22 LAND SUBSIDENCE KIOWA COUNTY, KANSAS Prepared by Michael T. Dealy L.G., Manager, Wichita Operations SITE LOCATION The site was approximately four miles
11/22/2010. Groundwater in Unconsolidated Deposits. Alluvial (fluvial) deposits. - consist of gravel, sand, silt and clay
 deposits. - consist of gravel, sand, silt and clay") Groundwater in Unconsolidated Deposits Alluvial (fluvial) deposits - consist of gravel, sand, silt and clay - laid down by physical processes in rivers and flood plains - major sources for water supplies
Groundwater in Unconsolidated Deposits Alluvial (fluvial) deposits - consist of gravel, sand, silt and clay - laid down by physical processes in rivers and flood plains - major sources for water supplies
Hydro One (Sept 2014) Hydro One (Sept 2014) Hydro One (Sept 2014)
 Hydro One (Sept 2014) Hydro One (Sept 2014)") TABLE 1 WELL CONSTRUCTION DETAILS MOE WWR No Well ID Location Installation Date Status Easting Coordinates Northing Source Elevation Screened Interval Screened Material Borehole Well Stick-up Ground Top
TABLE 1 WELL CONSTRUCTION DETAILS MOE WWR No Well ID Location Installation Date Status Easting Coordinates Northing Source Elevation Screened Interval Screened Material Borehole Well Stick-up Ground Top
The Geology and Hydrogeology of the Spyhill Area
 The Geology and Hydrogeology of the Spyhill Area Clare North (WorleyParsons Komex) and Martin Ortiz (The City of Calgary) 2-Jul-08 Outline Background Site Location Existing Information New Work Geology
Hydrogeology of Karst NE Wisconsin. Dr. Maureen A. Muldoon UW-Oshkosh Geology Department
 Hydrogeology of Karst NE Wisconsin Dr. Maureen A. Muldoon UW-Oshkosh Geology Department WI Bedrock Outline Karst Landscapes Existing WQ Data Flow in Karst Aquifers Overview of Silurian Aquifer Water Level
Impact of the Danube River on the groundwater dynamics in the Kozloduy Lowland
 GEOLOGICA BALCANICA, 46 (2), Sofia, Nov. 2017, pp. 33 39. Impact of the Danube River on the groundwater dynamics in the Kozloduy Lowland Peter Gerginov Geological Institute, Bulgarian Academy of Sciences,
Evaluation of Subsurface Formation of Pabna District, Bangladesh
 IOSR Journal of Applied Geology and Geophysics (IOSR-JAGG) e-issn: 2321 0990, p-issn: 2321 0982.Volume 1, Issue 4 (Sep. Oct. 2013), PP 30-36 Evaluation of Subsurface Formation of Pabna District, Bangladesh
Buried-valley Aquifers: Delineation and Characterization from Reflection Seismic and Core Data at Caledon East, Ontario
 Buried-valley Aquifers: Delineation and Characterization from Reflection Seismic and Core Data at Caledon East, Ontario Russell, H.A.J. 1, S.E. Pullan 1, J.A. Hunter 1, D.R. Sharpe 1, and S. Holysh 2 1
Delineation of Zones at Risk from Groundwater Inflows at an Underground Platinum Mine in South Africa
 Delineation of Zones at Risk from Groundwater Inflows at an Underground Platinum Mine in South Africa Mr Andreas Stoll andreas.stoll@erm.com Environmental Resources Management Swiss GmbH (ERM), Switzerland
Regional groundwater mapping and model
 Regional groundwater mapping and model Boyd, Dwight 1, Steve Holysh 2, and Jeff Pitcher 1 1 Grand River Conservation Authority, Canada; 2 Regional Municipality of Halton, Canada The Grand River forms one
GPR AS A COST EFFECTIVE BEDROCK MAPPING TOOL FOR LARGE AREAS. Abstract
 GPR AS A COST EFFECTIVE BEDROCK MAPPING TOOL FOR LARGE AREAS Dr. Jutta L. Hager, Hager GeoScience, Inc., Waltham, MA Mario Carnevale, Hager GeoScience, Inc., Waltham, MA Abstract Hager GeoScience, Inc.
Groundwater Hydrology
 EXERCISE 12 Groundwater Hydrology INTRODUCTION Groundwater is an important component of the hydrologic cycle. It feeds lakes, rivers, wetlands, and reservoirs; it supplies water for domestic, municipal,
Soils, Hydrogeology, and Aquifer Properties. Philip B. Bedient 2006 Rice University
 Soils, Hydrogeology, and Aquifer Properties Philip B. Bedient 2006 Rice University Charbeneau, 2000. Basin Hydrologic Cycle Global Water Supply Distribution 3% of earth s water is fresh - 97% oceans 1%
the Quarrying Industry Dewatering and the Quarrying Industry the Quarrying Industry
 Dewatering and the Quarrying Industry Dewatering and Dewatering and the Quarrying Industry the Quarrying Industry Les Brown Eugene P. Daly John Kelly Objectives 1) To present a summary of water management
THE MINISTRY OF ENERGY AND ENERGY INDUSTRIES MINERALS DIVISION MINE DESIGN TEMPLATE OPERATOR NAME: OPERATOR ADDRESS: PHONE NUMBER: FACSIMILE:
 THE MINISTRY OF ENERGY AND ENERGY INDUSTRIES MINERALS DIVISION MINE DESIGN TEMPLATE 1.0 GENERAL INFORMATION OPERATOR NAME: OPERATOR ADDRESS: PHONE NUMBER: FACSIMILE: NAME OF CONTACT: CELLULAR PHONE: EMAIL
REPORT ON ESTIMATES OF GROUNDWATER INFLOW INTO AND DRAWDOWN AROUND THE PROPOSED OPEN PIT SOUTHDOWN IRON ORE PROJECT. Submitted to:
 Pty Ltd A.B.N. 64 6 17 87 1 Havelock Street, West Perth, WA 6 Australia (PO Box 19, West Perth, WA 6872 Australia) Telephone (8) 92 76 Fax (8) 92 7611 http://www.golder.com REPORT ON ESTIMATES OF GROUNDWATER
AWRA PMAS Engineers Club of Philadelphia. A Geologic Perspective on Stormwater
 AWRA PMAS Engineers Club of Philadelphia A Geologic Perspective on Stormwater Toby J. Kessler, P.G. Hydrogeologist Trevor G. Woodward, P.G. Engineering Geologist September 10, 2014 Gilmore & Associates,
!( Residential Receptor
 07699-00(MISC001)GIS-WA422 POR5 POR3 POR2 POR4 POR1 Source: MNR NRVIS, 2011. Produced by CRA under licence from Ontario Ministry of Natural Resources, Queen's Printer 2012 Lambton Landfill Expansion ²
Oak Ridges Moraine Aquifer Vulnerability Mapping
 Accompanying Document to the Reference Map for Ontario Regulation 140/02 (Oak Ridges Moraine Conservation Plan) March 2004 2 1. Purpose of Report Accompanying Document to the Reference Map for Ontario
Case Study: University of Connecticut (UConn) Landfill
 Landfill") Case Study: University of Connecticut (UConn) Landfill Problem Statement:» Locate disposal trenches» Identify geologic features and distinguish them from leachate and locate preferential pathways in fractured
Case Study: University of Connecticut (UConn) Landfill Problem Statement:» Locate disposal trenches» Identify geologic features and distinguish them from leachate and locate preferential pathways in fractured
Finding Large Capacity Groundwater Supplies for Irrigation
 Finding Large Capacity Groundwater Supplies for Irrigation December 14, 2012 Presented by: Michael L. Chapman, Jr., PG Irrigation Well Site Evaluation Background Investigation Identify Hydrogeologic Conditions
Phase 1 Geoscientific Preliminary Assessment Southern Ontario, Sedimentary Communities
 Phase 1 Geoscientific Preliminary Assessment Southern Ontario, Sedimentary Communities Presented to: Community Liaison Committees (Brockton, Huron-Kinloss, South Bruce) March 2014 Project Description»
3.0 GEOLOGY AND HYDROGEOLOGY
 3.0 GEOLOGY AND HYDROGEOLOGY 3.1 Methodology The Geological Survey of Ireland (GSI) publication Geology of South Cork was consulted to establish the nature of the bedrock lithology and Quaternary sediments.
HYDROGEOLOGICAL PROPERTIES OF THE UG2 PYROXENITE AQUIFERS OF THE BUSHVELD COMPLEX
 R. Gebrekristos, P.Cheshire HYDROGEOLOGICAL PROPERTIES OF THE UG2 PYROXENITE AQUIFERS OF THE BUSHVELD COMPLEX R. Gebrekristos Digby Wells Environmental P. Cheshire Groundwater Monitoring Services Abstract
ACTON QUARRY TOWN OF HALTON HILLS 4 TH LINE RESIDENTIAL WATER SUPPLY INTERFERENCE COMPLAINTS THIRD-PARTY HYDROGEOLOGICAL ASSESSMENT AND RESOLUTION
 ACTON QUARRY TOWN OF HALTON HILLS 4 TH LINE RESIDENTIAL WATER SUPPLY INTERFERENCE COMPLAINTS THIRD-PARTY HYDROGEOLOGICAL ASSESSMENT AND RESOLUTION May 2009 File 082042.00 Distribution: 11 c 4 th Line Residents
Determining In Situ Properties of Claystone Aquitards Using Pore Pressure Responses from Grouted-in Pressure Transducers
 Determining In Situ Properties of Claystone Aquitards Using Pore Pressure Responses from Grouted-in Pressure Transducers Laura A. Smith, S. Lee Barbour, M. Jim Hendry University of Saskatchewan, Saskatoon,
NEW PRODUCTS AND ADVANCEMENTS IN 3-D MODELLING PROTOCOLS BASED ON STUDIES IN THICK DRIFT AREAS IN ONTARIO, CANADA
 NEW PRODUCTS AND ADVANCEMENTS IN 3-D MODELLING PROTOCOLS BASED ON STUDIES IN THICK DRIFT AREAS IN ONTARIO, CANADA Abigail K. Burt and Andrew F. Bajc Ontario Geological Survey, 933 Ramsey Lake Road, Sudbury,
APPLICATION OF 1D HYDROMECHANICAL COUPLING IN TOUGH2 TO A DEEP GEOLOGICAL REPOSITORY GLACIATION SCENARIO
 PROCEEDINGS, TOUGH Symposium 2015 Lawrence Berkeley National Laboratory, Berkeley, California, September 28-30, 2015 APPLICATION OF 1D HYDROMECHANICAL COUPLING IN TOUGH2 TO A DEEP GEOLOGICAL REPOSITORY
Evolution of the conceptual hydrogeologic and ground-water flow model for Las Vegas Valley, Clark County, Nevada
 Evolution of the conceptual hydrogeologic and ground-water flow model for Las Vegas Valley, Clark County, Nevada Geological Society of America Annual Meeting November 14, 2 David J. Donovan Southern Nevada
Groundwater Monitoring & Aggregate Operations in the Villeneuve-Calahoo Area. William Gowdy, BSc. P.Geo
 Groundwater Monitoring & Aggregate Operations in the Villeneuve-Calahoo Area William Gowdy, BSc. P.Geo Format of Talk General Background Sand and Gravel Geology & Formation of Sand and Gravel Deposits
' International Institute for Land Reclamation and Improvement. 2 Groundwater Investigations. N.A. de Ridder'? 2.1 Introduction. 2.
 2 Groundwater Investigations N.A. de Ridder'? 2.1 Introduction Successful drainage depends largely on a proper diagnosis of the causes of the excess water. For this diagnosis, one must consider: climate,
ENGINEER S CERTIFICATION OF FAULT AREA DEMONSTRATION (40 CFR )
") PLATTE RIVER POWER AUTHORITY RAWHIDE ENERGY STATION BOTTOM ASH TRANSFER (BAT) IMPOUNDMENTS LARIMER COUNTY, CO ENGINEER S CERTIFICATION OF FAULT AREA DEMONSTRATION (40 CFR 257.62) FOR COAL COMBUSTION RESIDUALS
PLATTE RIVER POWER AUTHORITY RAWHIDE ENERGY STATION BOTTOM ASH TRANSFER (BAT) IMPOUNDMENTS LARIMER COUNTY, CO ENGINEER S CERTIFICATION OF FAULT AREA DEMONSTRATION (40 CFR 257.62) FOR COAL COMBUSTION RESIDUALS
Connecticut's Aquifers
 Page 1 of 5 DEP Search: Connecticut's Aquifers The technical definition of the word "aquifer" is: any geologic formation capable of yielding significant quantities of water to wells. By that definition,
Pressure Grouting of Fractured Bedrock to Control Acid Mine Drainage
 WATER RESOURCES AT RISK May 14-18, 1995 Denver American Institute of Hydrology Pressure Grouting of Fractured Bedrock to Control Acid Mine Drainage S. A. Effner, G. D. Vandersluis, and V. Straskraba Hydro-Geo
REGIONAL GROUNDWATER MAPPING AN ASSESSMENT TOOL FOR INCORPORATING GROUNDWATER INTO THE PLANNING PROCESS
 REGIONAL GROUNDWATER MAPPING AN ASSESSMENT TOOL FOR INCORPORATING GROUNDWATER INTO THE PLANNING PROCESS Steve Holysh, Regional Municipality of Halton, Canada Jeff Pitcher, Grand River Conservation Authority,
For Sale - 56 Acre Sandstone Quarry State Route 511, Oberlin/Kipton, OH 44075
 14647 State Route 511, Oberlin/Kipton, OH 44075 56 ACRES Vermilion Rd Gifford Rd Haigh Rd 44 Summary The Kipton sandstone quarry is included in 56 acre tract owned by Terry A. Johnson, of Huron, Ohio.
Betsy Stevenson and Allison Mohrs (Skagit County Planning and Development Services) Jenny Baker, The Nature Conservancy
 Jenny Baker, The Nature Conservancy") TC Fisher Slough Final Design and Permitting Subject: Well Review Memorandum To: From: Betsy Stevenson and Allison Mohrs (Skagit County Planning and Development Services) Jenny Baker, The ature Conservancy
TC Fisher Slough Final Design and Permitting Subject: Well Review Memorandum To: From: Betsy Stevenson and Allison Mohrs (Skagit County Planning and Development Services) Jenny Baker, The ature Conservancy
Ground-Water Exploration in the Worthington Area of Nobles County: Summary of Seismic Data and Recent Test Drilling Results
 Ground-Water Exploration in the Worthington Area of Nobles County: Summary of Seismic Data and Recent Test Drilling Results Jim Berg and Todd Petersen Geophysicists, DNR Waters January 2000 Table of Contents
DESIGN-PHASE GEOLOGIC FRAMEWORK MODELING FOR LARGE CONSTRUCTION PROJECTS
 DESIGN-PHASE GEOLOGIC FRAMEWORK MODELING FOR LARGE CONSTRUCTION PROJECTS Christine Vilardi, P.G., C.G.W.P. (vilardcl@stvinc.com, STV Inc., New York, New York) and Todd Kincaid, Ph.D. (Hazlett-Kincaid,
Big Rivers Electric Corporation Disposal of Coal Combustion Residuals (CCR) from Electric Utilities Final Rule CCR Impoundment Liner Assessment Report
 from Electric Utilities Final Rule CCR Impoundment Liner Assessment Report") Big Rivers Electric Corporation Disposal of Coal Combustion Residuals (CCR) from Electric Utilities Final Rule CCR Impoundment Liner Assessment Report CCR Surface Impoundment Information Name: Operator:
Big Rivers Electric Corporation Disposal of Coal Combustion Residuals (CCR) from Electric Utilities Final Rule CCR Impoundment Liner Assessment Report CCR Surface Impoundment Information Name: Operator:
Land subsidence due to groundwater withdrawal in Hanoi, Vietnam
 Land Subsidence (Proceedings of the Fifth International Symposium on Land Subsidence, The Hague, October 1995). 1AHS Publ. no. 234, 1995. 55 Land subsidence due to groundwater withdrawal in Hanoi, Vietnam
patersongroup Consulting Engineers April 20, 2010 File: PG1887-LET.01R Novatech Engineering Consultants Suite 200, 240 Michael Cowpland Drive
 patersongroup April 20, 2010 File: PG1887-LET.01R Novatech Engineering Consultants Suite 200, 240 Michael Cowpland Drive Ottawa, Ontario K2M 1P6 Attention: Mr. Adam Thompson Consulting Engineers 28 Concourse
A Risk-based Groundwater Modelling Study for Predicting Thermal Plume Migration from SAGD Well-pads
 A Risk-based Groundwater Modelling Study for Predicting Thermal Plume Migration from SAGD Well-pads Rudy Maji, Ph.D., Golder Associates Solaleh Khezri, M.Sc., AB Scientific Intern (Golder Associates) Don
Geology and Soils. Technical Memorandum
 Geology and Soils Technical Memorandum TO: FDOT FROM: HDR, Inc. DATE: February 2013 PROJECT: St Johns River Crossing FPID No: 208225-3-21-01 Clay, Duval, and St. Johns Counties; Florida Geology and soils
Control of Fractured Bedrock Structure on the Movement of Chlorinated Volatile Organics in Bedrock and Overburden Aquifers, Newark Basin of New Jersey
 Control of Fractured Bedrock Structure on the Movement of Chlorinated Volatile Organics in Bedrock and Overburden Aquifers, Newark Basin of New Jersey Robert M. Bond, PG and Katherine E. Linnell, PG, Langan
Geophysical Surveys for Groundwater Modelling of Coastal Golf Courses
 1 Geophysical Surveys for Groundwater Modelling of Coastal Golf Courses C. RICHARD BATES and RUTH ROBINSON Sedimentary Systems Research Group, University of St. Andrews, St. Andrews, Scotland Abstract
URBAN HYDROLOGY: WATER IN THE CITY OF TSHWANE Plant Sciences Auditorium, University of Pretoria January 2014 URBAN HYDROGEOLOGY
 URBAN HYDROLOGY: WATER IN THE CITY OF TSHWANE Plant Sciences Auditorium, University of Pretoria 23 24 January 2014 URBAN HYDROGEOLOGY MATTHYS A. DIPPENAAR DEPARTMENT GEOLOGY, UNIVERSITY OF PRETORIA HYDROGEOLOGY
10. GEOTECHNICAL EXPLORATION PROGRAM
 Geotechnical site investigations should be conducted in multiple phases to obtain data for use during the planning and design of the tunnel system. Geotechnical investigations typically are performed in
Milford Centre Ltd. Private Plan Change GEOTECHNICAL ASSESSMENT
 Milford Centre Ltd. Private Plan Change GEOTECHNICAL ASSESSMENT Final 15 April 2008 Milford Centre Ltd. Private Plan Change GEOTECHNICAL ASSESSMENT Final 15 April 2008 Sinclair Knight Merz 25 Teed Street
VOLUME III GEOLOGY, HYDROGEOLOGY & GEOTECHNICAL REPORT CAPITAL REGION RESOURCE RECOVERY CENTRE
 3.0 GEOLOGICAL SETTING The geology of the CRRRC Site has been assessed based on a regional, local and Site scale as discussed in the following sections, placing it within the overall context of the Ottawa
Michigan s Geology and Groundwater
 Michigan s Geology and Groundwater Ralph J. Haefner Deputy Director U.S. Geological Survey Michigan-Ohio Water Science Center Lansing, Michigan Outline About the USGS Geology 101 Michigan s geology Bedrock
How & Where does infiltration work? Summary of Geologic History Constraints/benefits for different geologic units
 June 26, 2007: Low Impact Development 1 Associated Earth Sciences, Inc. Associated Earth Sciences, Inc. Presented by: Matthew A. Miller, PE April 24, 2012 How & Where does infiltration work? Summary of
Oriented Core Logging of DGR-5 and DGR-6. Steve Gaines, Kenneth Raven and Michael Melaney
 Technical Report Title: Document ID: Authors: Oriented Core Logging of DGR-5 and DGR-6 TR-09-09 Steve Gaines, Kenneth Raven and Michael Melaney Revision: 0 Date: April 8, 2011 DGR Site Characterization
Wisconsin s Hydrogeology: an overview
 2012 Soil and Water Conservation Society Conference Stevens Point, WI Feb 9, 2012 Wisconsin s Hydrogeology: an overview Ken Bradbury Wisconsin Geological and Natural History Survey University of Wisconsin-Extension
Groundwater Rebound in the South Yorkshire Coalfield: A review of initial modelling
 Groundwater Rebound in the South Yorkshire Coalfield: A review of initial modelling 1 S. P. Burke, 1 H. A.B. Potter and 2 A. Jarvis 1 Environment Agency: Science Group, Olton Court, Olton,Solihull UK 2
Groundwater Resource Evaluation in Support of Dewatering a South Carolina Limestone Quarry
 Groundwater Resource Evaluation in Support of Dewatering a South Carolina Limestone Quarry Daniel T. Brantley 1, John M. Shafer 2, and Michael G. Waddell 3 AUTHORS: 1 Research Associate, Earth Sciences
Table 5-1 Sampling Program Summary for Milltown Ford Avenue Redevelopment Area, NJ.
 Table 5- Sampling Program Summary for Milltown Ford Avenue Redevelopment Area, NJ. Transformer Pads (9 pads: PAD 9) Evaluate if PCBs presently exist in soils adjacent to, and/or beneath the transformer
Surface Processes Focus on Mass Wasting (Chapter 10)
") Surface Processes Focus on Mass Wasting (Chapter 10) 1. What is the distinction between weathering, mass wasting, and erosion? 2. What is the controlling force in mass wasting? What force provides resistance?
Surface Processes Focus on Mass Wasting (Chapter 10) 1. What is the distinction between weathering, mass wasting, and erosion? 2. What is the controlling force in mass wasting? What force provides resistance?
Groundwater Vulnerability Mapping Eastern Newfoundland Executive Summary
 Groundwater Vulnerability Mapping Eastern Newfoundland Executive Summary 123102.00 Executive Summary March 2014 ISO 9001 Registered Company Prepared for: Water Resources Management Division Department
Lower Mainland Surficial Geology From Wisconsin Ice Age to Protocol 21
 Lower Mainland Surficial Geology From Wisconsin Ice Age to Protocol 21 BCEIA BEST Conference 2018 Whistler, BC Kalina Malowany and Virginie Brunetaud Presentation Outline 1. Surficial Geology it s more
GEOLOGY AND MINERAL RESOURCES OF INDIAN RESERVE 26
 ) 41HI3NW94I4 I R NO 26 1*A1 MANITOULIN ISLAND 010 -f?;. GEOLOGY AND MINERAL RESOURCES OF INDIAN RESERVE 26 September 16, 1975 D. G. Innes, Resident Geologist Sudbury District Ministry of Natural Resources
Chapter 2. Regional Landscapes and the Hydrologic Cycle
 Chapter 2. Regional Landscapes and the Hydrologic Cycle W. Lee Daniels Department of Crop and Soil Environmental Sciences, Virginia Tech Table of Contents Introduction... 23 Soils and landscapes of the
- Cased-hole geophysical well logs - Airborne geophysics - Seismic data - LiDAR. GeoConvention 2015: New Horizons 1
 Thermal Effects and Quaternary Hydrogeology: Making Good Decisions in a Complex Geologic Setting Timothy Johnsen, Phd, Quaternary Specialist (tjohnsen@matrix-solutions.com) Alex Haluszka, MSc, P.Geol.,
Appendix D. Sediment Texture and Other Soil Data
 5 6 7 8 Appendix D. Sediment Texture and Other Soil Data This appendix describes the sediment texture of the aquifer system in the Restoration Area. The contents of this appendix describe the: Importance
SIXTH SCHEDULE REPUBLIC OF SOUTH SUDAN MINISTRY OF PETROLEUM, MINING THE MINING (MINERAL TITLE) REGULATIONS 2015
 REGULATIONS 2015") SIXTH SCHEDULE REPUBLIC OF SOUTH SUDAN MINISTRY OF PETROLEUM, MINING THE MINING ACT, 2012 THE MINING (MINERAL TITLE) REGULATIONS 2015 Guidelines should be prepared by the Directorate of Mineral Development
SIXTH SCHEDULE REPUBLIC OF SOUTH SUDAN MINISTRY OF PETROLEUM, MINING THE MINING ACT, 2012 THE MINING (MINERAL TITLE) REGULATIONS 2015 Guidelines should be prepared by the Directorate of Mineral Development
Groundwater Modeling for Flow Systems with Complex Geological and Hydrogeological Conditions
 Available online at www.sciencedirect.com Procedia Earth and Planetary Science 3 ( 2011 ) 23 28 2011 Xi an International Conference on Fine Geological Exploration and Groundwater & Gas Hazards Control
Proposed Cemetery Thornhill Road. Tier One Hydrogeological Risk Assessment. Peter Mitchell Associates
 Proposed Cemetery Thornhill Road Tier One Hydrogeological Risk Assessment Peter Mitchell Associates January 2015 Executive Summary This report uses a desk-based risk assessment technique published by the
TAMPA BAY TRIBUTARIES BASIN. Hydrogeological Setting
 TAMPA BAY TRIBUTARIES BASIN Hydrogeological Setting Aquifers within the Tampa Bay Tributaries Basins ground water flow system include the Floridan aquifer system, the intermediate aquifer system, and the
Re: Steep Slope Assessment for 2465 Waverly Drive, Blind Bay, BC; Legal Address: Lot 39, Section 18, Township 22, Range 10, Plan 25579, W6M, KDYD.
 OEL File 1563-1 May 30, 2017 Doug Wall PO Box 774 Salmon Arm, BC V1E 4N7 Re: Steep Slope Assessment for 2465 Waverly Drive, Blind Bay, BC; Legal Address: Lot 39, Section 18, Township 22, Range 10, Plan
FORENSIC GEOLOGY A CIVIL ACTION
 NAME 89.215 - FORENSIC GEOLOGY A CIVIL ACTION I. Introduction In 1982 a lawsuit was filed on behalf of eight Woburn families by Jan Schlictmann. The suit alleged that serious health effects (childhood
Slope Stability Evaluation Ground Anchor Construction Area White Point Landslide San Pedro District Los Angeles, California.
 Slope Stability Evaluation Ground Anchor Construction Area White Point Landslide San Pedro District Los Angeles, California Submitted To: Mr. Gene Edwards City of Los Angeles Department of Public Works
14 Geotechnical Hazards
 Volume 2: Assessment of Environmental Effects 296 14 Geotechnical Hazards Overview This Chapter provides an assessment of the underlying geotechnical conditions to identify: any potential liquefaction
When Creek Meets Valley Wall: Prioritizing Erosion Mitigation alongside the Oshawa Landfill
 1 When Creek Meets Valley Wall: Prioritizing Erosion Mitigation alongside the Oshawa Landfill Robin McKillop 1, Dan McParland 1 & Cassie Scobie 2 TRIECA conference March 22-23, 2017 1 Palmer Environmental
Procedure for Determining Near-Surface Pollution Sensitivity
 Procedure for Determining Near-Surface Pollution Sensitivity Minnesota Department of Natural Resources Division of Ecological and Water Resources County Geologic Atlas Program March 2014 Version 2.1 I.
Development of geophysical investigation for verifying treatment efficiency of underground cavities
 Development of geophysical investigation for verifying treatment efficiency of underground cavities Hasan A. Kamal* Kuwait Institute for Scientific Research, Infrastructure Risk and Reliability Program,
Seismic Reflection Imaging across the Johnson Ranch, Valley County, Idaho
 Seismic Reflection Imaging across the Johnson Ranch, Valley County, Idaho Report Prepared for the Skyline Corporation Lee M. Liberty Center for Geophysical Investigation of the Shallow Subsurface (CGISS)
Cappog Bridge (PW-3)
") Water Framework Directive Groundwater Monitoring Programme Site Information Cappog Bridge (PW-3) ImagePath1: Cappog Bridge\IEGBNI_NB_G_012_18_0 01_A_SiteLocation.jpg Cappog Bridge PW-3 is one of 8 boreholes
Water Framework Directive Groundwater Monitoring Programme Site Information Cappog Bridge (PW-3) ImagePath1: Cappog Bridge\IEGBNI_NB_G_012_18_0 01_A_SiteLocation.jpg Cappog Bridge PW-3 is one of 8 boreholes
How Do Geology and Physical Streambed Characteristics Affect Water Quality?
 Teacher s Guide How Do Geology and Physical Streambed Characteristics Affect Water Quality? Lesson Description In this lesson, the students research a dynamic, vertical dimension of a watershed - the geological
A method for three-dimensional mapping, merging geologic interpretation, and GIS computation
 A method for three-dimensional mapping, merging geologic interpretation, and GIS computation Soller, David R., U.S. Geological Survey, 908 National Center, Reston, VA 20192 and Richard C. Berg, Illinois
 12 10 8 6 4 2 0 40-50 50-60 60-70 70-80 80-90 90-100 Fresh Water What we will cover The Hydrologic Cycle River systems Floods Groundwater Caves and Karst Topography Hot springs Distribution of water in
1.72, Groundwater Hydrology Prof. Charles Harvey Lecture Packet #5: Groundwater Flow Patterns. Local Flow System. Intermediate Flow System
 1.72, Groundwater Hydrology Prof. Charles Harvey Lecture Packet #5: Groundwater Flow Patterns c Local Flow System 10,000 feet Intermediate Flow System Regional Flow System 20,000 feet Hydrologic section
16 January 2018 Job Number: RICHARD NEWMAN C\- CLARK FORTUNE MCDONALD AND ASSOCIATES PO BOX 553 QUEENSTOWN
 16 January 2018 Job Number: 50595 RICHARD NEWMAN C\- CLARK FORTUNE MCDONALD AND ASSOCIATES PO BOX 553 QUEENSTOWN CHANSEN@CFMA.CO.NZ STORMWATER DISPOSAL ASSESSMENT Dear Richard, RDAgritech were requested
ENCE 3610 Soil Mechanics. Site Exploration and Characterisation Field Exploration Methods
 ENCE 3610 Soil Mechanics Site Exploration and Characterisation Field Exploration Methods Geotechnical Involvement in Project Phases Planning Design Alternatives Preparation of Detailed Plans Final Design
J.H. Campbell Generating Facility Pond A - Location Restriction Certification Report
 J.H. Campbell Generating Facility Pond A - Location Restriction Certification Report Pursuant to: 40 CFR 257.60 40 CFR 257.61 40 CFR 257.62 40 CFR 257.63 40 CFR 257.64 Submitted to: Consumers Energy Company
December 13, Kirk Shields Green Mountain Power 163 Acorn Lane Colchester, VT 05446
 December 13, 2017 Kirk Shields Green Mountain Power 163 Acorn Lane Colchester, VT 05446 RE: End of Field Letter for Archaeological Phase II Site Evaluation at Site VT-CH-1218 within the Proposed Milton
Dept. of Earth and Environmental Sciences, University of Waterloo, 200 University Ave W, Waterloo, Ontario, Canada, N2L 3G1 2
 A modelling strategy to develop a regional Quaternary geological model across rural and urban areas and administrative borders using existing geological information M. Ross 1, M. Parent 2, A. Taylor 1
Ontario Ministry of Northern Development and Mines Submission to the Joint Review Panel Public Hearing Proposed Bruce Deep Geological Repository
 Ontario Ministry of Northern Development and Mines Submission to the Joint Review Panel Public Hearing Proposed Bruce Deep Geological Repository August 27, 2013 Background and Scope June 18, 2013, the
Evaluation of the hydraulic gradient at an island for low-level nuclear waste disposal
 A New Focus on Groundwater Seawater Interactions (Proceedings of Symposium HS1001 at IUGG2007, Perugia, July 2007). IAHS Publ. 312, 2007. 237 Evaluation of the hydraulic gradient at an island for low-level
Evaluation/Monitoring Report No. 152
 Evaluation/Monitoring Report No. 152 150m west of 7 Portmore Rd. Portmore Lower Ballinderry County Antrim LICENCE NO.: AE/07/241 David McIlreavy 1 Site Specific Information Site Name Townland County :
Napa Valley Groundwater Sustainability: A Basin Analysis Report for the Napa Valley Subbasin
 Napa Valley Groundwater Sustainability: A Basin Analysis Report for the Napa Valley Subbasin A report prepared pursuant to California Water Code Section 10733.6(b)(3) EXECUTIVE SUMMARY (354.4(A)) 1 1.0
WaterTech 2017 April 4, 2017
 Haskayne Master Drainage Plan: Hydraulic Relationships Between Groundwater Flow Systems and the Bearspaw Reservoir and Potential for Stormwater Disposal, City of Calgary WaterTech 2017 April 4, 2017 Project
Information Request 12
 Information Request 12 Information Request 12 12-1 Responses to Information Request 12 Response to Information Request 12a Response to Information Request 12b Response to Information Request 12c 12-3 12-7
4.11 Groundwater model
 4.11 Groundwater model 4.11 Groundwater model 4.11.1 Introduction and objectives Groundwater models have the potential to make important contributions in the mapping and characterisation of buried valleys.
GPR survey and field work summary in Siilinjärvi mine during July 2014
 GEOLOGICAL SURVEY OF FINLAND Groundwater Espoo 21.6.2016 67/2016 GPR survey and field work summary in Siilinjärvi mine during July 2014 Samrit Luoma, Juha Majaniemi, Tiina Kaipainen, and Antti Pasanen