IN-NETWORK CHLORINE RESIDUAL MANAGEMENT
|
|
|
- Natalie Fields
- 5 years ago
- Views:
Transcription
1 IN-NETWORK CHLORINE RESIDUAL MANAGEMENT Using GIS to assess flush point efficacy Ian Toohey, P.E. Systems Planning Austin Water

2 TABLE OF CONTENTS 1. Background 3. Surface Creation 2. Residual Sampling Analysis 4. Analysis and Recommendations


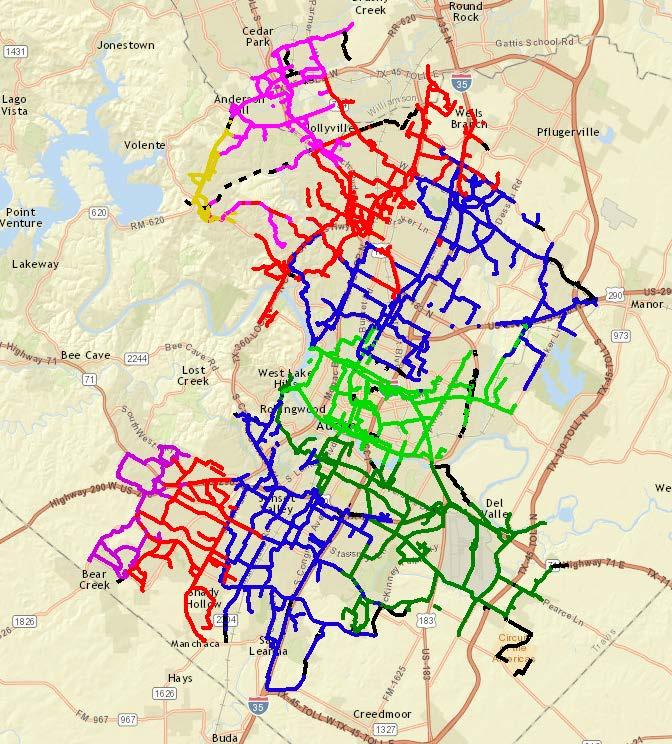
3 1. BACKGROUND SYSTEM OVERVIEW, PRE-WTP4

4 1. BACKGROUND FLUSH POINTS Generally focused on outer edges of the system Reduce water age & improve disinfection residuals Dedicated crews flush & record samples
5 1. BACKGROUND 2013 RESIDUAL SAMPLING ANALYSIS Plot before & after chlorine residual samples from flush events Analyze residual recovery relative to water loss & flush frequency Evaluate candidate sites for increased frequency, reduced frequency, or removal
6 1. BACKGROUND SYSTEM OVERVIEW, POST-WTP4
7 2. RESIDUAL SAMPLING ANALYSIS - UPDATE Capture time frame around the introduction of WTP4 Assess impact of changing flows on residuals in different parts of the system Revisit scheduling of existing flush points

8 2. RESIDUAL SAMPLING ANALYSIS - UPDATE
 The need for flushing is related to maintaining chlorine residuals; 2) We collect chlorine residual samples from all over the City")
9 3. SURFACE CREATION PURPOSE New Flush Points Needed? Hypothesis: 1) The need for flushing is related to maintaining chlorine residuals; 2) We collect chlorine residual samples from all over the City on a monthly basis; 3) Let s make some surfaces and find out where a new flush point should go!
10 3. SURFACE CREATION - PROCEDURE Raster Creation from Points Kernel Interpolation w/ Barriers Month-on- Month Percent Difference Raster Calculator Cumulative Difference Raster Calculator
11 3. RASTER CREATION FROM POINTS Tool: Geostatistical Analyst -> Interpolation -> Kernel Interpolation w/ Barriers Inputs: 1) Point features (chlorine residual sample readings) 2) Barrier features (pressure zone boundaries) 3) Kernel function (Epanechnikov first order polynomial) Challenges: 1) RUNTIME! (7 hours/surface x 22 surfaces) 2) Geostatistical Wizard bogged down 3) Bounding box (no extrapolation)

12 3. MONTH-ON-MONTH PERCENT DIFFERENCE Tool: Spatial Analyst -> Map Algebra -> Raster Calculator APR 2014 APR 2015
13 3. MONTH-ON-MONTH PERCENT DIFFERENCE Tool: Spatial Analyst -> Map Algebra -> Raster Calculator AAAAAAAAAA AAAAAAAAAA AAAAAAAAAA 2014 January February March April May June July August September October November December 2015 January February March April May June July August September October November December
14 3. MONTH-ON-MONTH PERCENT DIFFERENCE Tool: Spatial Analyst -> Map Algebra -> Raster Calculator JAN-FEB Concept: small % differences will accumulate over time SSSSSSSSSSSSSSSSSS (PPPPPPPPPPPPPP DDDDDDDDDDDDDDDDDDDD RRRRRRRRRRRRRR) JJaaaaaaaaaaaa Areas of change will emerge over time as more layers are added
15 3. MONTH-ON-MONTH PERCENT DIFFERENCE Tool: Spatial Analyst -> Map Algebra -> Raster Calculator JAN-MAR Concept: small % differences will accumulate over time SSSSSSSSSSSSSSSSSS (PPPPPPPPPPPPPP DDDDDDDDDDDDDDDDDDDD RRRRRRRRRRRRRR) JJaaaaaaaaaaaa Areas of change will emerge over time as more layers are added
16 3. MONTH-ON-MONTH PERCENT DIFFERENCE Tool: Spatial Analyst -> Map Algebra -> Raster Calculator JAN-APR Concept: small % differences will accumulate over time SSSSSSSSSSSSSSSSSS (PPPPPPPPPPPPPP DDDDDDDDDDDDDDDDDDDD RRRRRRRRRRRRRR) JJaaaaaaaaaaaa Areas of change will emerge over time as more layers are added
17 3. MONTH-ON-MONTH PERCENT DIFFERENCE Tool: Spatial Analyst -> Map Algebra -> Raster Calculator JAN-MAY Concept: small % differences will accumulate over time SSSSSSSSSSSSSSSSSS (PPPPPPPPPPPPPP DDDDDDDDDDDDDDDDDDDD RRRRRRRRRRRRRR) JJaaaaaaaaaaaa Areas of change will emerge over time as more layers are added
 JJaaaaaaaaaaaa Areas of change will emerge over time as more layers are")
18 3. MONTH-ON-MONTH PERCENT DIFFERENCE Tool: Spatial Analyst -> Map Algebra -> Raster Calculator JAN-JUNE Concept: small % differences will accumulate over time SSSSSSSSSSSSSSSSSS (PPPPPPPPPPPPPP DDDDDDDDDDDDDDDDDDDD RRRRRRRRRRRRRR) JJaaaaaaaaaaaa Areas of change will emerge over time as more layers are added
19 3. MONTH-ON-MONTH PERCENT DIFFERENCE Tool: Spatial Analyst -> Map Algebra -> Raster Calculator JAN-JULY Concept: small % differences will accumulate over time SSSSSSSSSSSSSSSSSS (PPPPPPPPPPPPPP DDDDDDDDDDDDDDDDDDDD RRRRRRRRRRRRRR) JJaaaaaaaaaaaa Areas of change will emerge over time as more layers are added
20 3. MONTH-ON-MONTH PERCENT DIFFERENCE Tool: Spatial Analyst -> Map Algebra -> Raster Calculator JAN-AUG Concept: small % differences will accumulate over time SSSSSSSSSSSSSSSSSS (PPPPPPPPPPPPPP DDDDDDDDDDDDDDDDDDDD RRRRRRRRRRRRRR) JJaaaaaaaaaaaa Areas of change will emerge over time as more layers are added
21 3. MONTH-ON-MONTH PERCENT DIFFERENCE Tool: Spatial Analyst -> Map Algebra -> Raster Calculator JAN-SEPT Concept: small % differences will accumulate over time SSSSSSSSSSSSSSSSSS (PPPPPPPPPPPPPP DDDDDDDDDDDDDDDDDDDD RRRRRRRRRRRRRR) JJaaaaaaaaaaaa Areas of change will emerge over time as more layers are added
22 4. ANALYSIS AND RECOMMENDATIONS JAN-SEPT Study areas of relative residual increase/decrease NOTE: East Austin 66 TM maintenance Compare to flush point analysis results as validation
23 4. ANALYSIS AND RECOMMENDATIONS JAN-SEPT Study areas of relative residual increase/decrease NOTE: East Austin 66 TM maintenance Compare to flush point analysis results as validation

24 4. ANALYSIS AND RECOMMENDATIONS JAN-SEPT Shifting locations of removed sites, locating new ones Perform similar analysis to monitor effect of major infrastructure maintenance outages Temporary flush points during rehab work
25 THANK YOU! Ian Toohey, P.E. Systems Planning Austin Water
WHEN IS IT EVER GOING TO RAIN? Table of Average Annual Rainfall and Rainfall For Selected Arizona Cities
 WHEN IS IT EVER GOING TO RAIN? Table of Average Annual Rainfall and 2001-2002 Rainfall For Selected Arizona Cities Phoenix Tucson Flagstaff Avg. 2001-2002 Avg. 2001-2002 Avg. 2001-2002 October 0.7 0.0
Scarborough Tide Gauge
 Tide Gauge Location OS: 504898E 488622N WGS84: Latitude: 54 16' 56.990"N Longitude: 00 23' 25.0279"W Instrument Valeport 740 (Druck Pressure Transducer) Benchmarks Benchmark Description TGBM = 4.18m above
Jackson County 2013 Weather Data
 Jackson County 2013 Weather Data 61 Years of Weather Data Recorded at the UF/IFAS Marianna North Florida Research and Education Center Doug Mayo Jackson County Extension Director 1952-2008 Rainfall Data
TABLE -I RAINFALL RECORDED AT PORT BLAIR (MM) FROM 1949 TO 2009
 FROM 1949 TO 2009") A. RAINFALL TABLE -I RAINFALL RECORDED AT PORT BLAIR (MM) FROM 1949 TO 2009 MONTH/YEAR 1949 1950 1951 1952 1953 1954 1955 1956 1957 1958 JANUARY 0.0 0.8 82.5 0.0 26.9 37.3 71.4 46.2 10.2 28.7 FEBRUARY
A. RAINFALL TABLE -I RAINFALL RECORDED AT PORT BLAIR (MM) FROM 1949 TO 2009 MONTH/YEAR 1949 1950 1951 1952 1953 1954 1955 1956 1957 1958 JANUARY 0.0 0.8 82.5 0.0 26.9 37.3 71.4 46.2 10.2 28.7 FEBRUARY
August 2018 ALGEBRA 1
 August 0 ALGEBRA 3 0 3 Access to Algebra course :00 Algebra Orientation Course Introduction and Reading Checkpoint 0.0 Expressions.03 Variables.0 3.0 Translate Words into Variable Expressions DAY.0 Translate
Location. Datum. Survey. information. Etrometa. Step Gauge. Description. relative to Herne Bay is -2.72m. The site new level.
 Tide Gauge Location OS: 616895E 169377N WGS84: Latitude: 51 o 22.919196 N Longitude: 01 o 6.9335907 E Instrument Type Etrometa Step Gauge Benchmarks Benchmark TGBM = 5.524m above Ordnance Datum Newlyn
Suppression of colonies of Reticulitermes spp. using the Sentricon termite colony elimination system: : A case study in Chatsworth, CA
 Suppression of colonies of Reticulitermes spp. using the Sentricon termite colony elimination system: : A case study in Chatsworth, CA Gail M. Getty, MS, Chris Solek, MS, Ron 1 1 Sbragia, Ph.D., Michael
Public Library Use and Economic Hard Times: Analysis of Recent Data
 Public Library Use and Economic Hard Times: Analysis of Recent Data A Report Prepared for The American Library Association by The Library Research Center University of Illinois at Urbana Champaign April
DAILY QUESTIONS 28 TH JUNE 18 REASONING - CALENDAR
 DAILY QUESTIONS 28 TH JUNE 18 REASONING - CALENDAR LEAP AND NON-LEAP YEAR *A non-leap year has 365 days whereas a leap year has 366 days. (as February has 29 days). *Every year which is divisible by 4
STATISTICAL FORECASTING and SEASONALITY (M. E. Ippolito; )
") STATISTICAL FORECASTING and SEASONALITY (M. E. Ippolito; 10-6-13) PART I OVERVIEW The following discussion expands upon exponential smoothing and seasonality as presented in Chapter 11, Forecasting, in
STATISTICAL FORECASTING and SEASONALITY (M. E. Ippolito; 10-6-13) PART I OVERVIEW The following discussion expands upon exponential smoothing and seasonality as presented in Chapter 11, Forecasting, in
2018 Annual Review of Availability Assessment Hours
 2018 Annual Review of Availability Assessment Hours Amber Motley Manager, Short Term Forecasting Clyde Loutan Principal, Renewable Energy Integration Karl Meeusen Senior Advisor, Infrastructure & Regulatory
Changing Hydrology under a Changing Climate for a Coastal Plain Watershed
 Changing Hydrology under a Changing Climate for a Coastal Plain Watershed David Bosch USDA-ARS, Tifton, GA Jeff Arnold ARS Temple, TX and Peter Allen Baylor University, TX SEWRU Objectives 1. Project changes
Making a Climograph: GLOBE Data Explorations
 Making a Climograph: A GLOBE Data Exploration Purpose Students learn how to construct and interpret climographs and understand how climate differs from weather. Overview Students calculate and graph maximum
Drought Characterization. Examination of Extreme Precipitation Events
 Drought Characterization Examination of Extreme Precipitation Events Extreme Precipitation Events During the Drought For the drought years (1999-2005) daily precipitation data was analyzed to find extreme
APPENDIX M LAKE ELEVATION AND FLOW RELEASES SENSITIVITY ANALYSIS RESULTS
 APPENDIX M LAKE ELEVATION AND FLOW RELEASES SENSITIVITY ANALYSIS RESULTS Appendix M Lake Elevation and Flow Releases Sensitivity Analysis Results Figure M-1 Lake Jocassee Modeled Reservoir Elevations (Current
Mountain View Community Shuttle Monthly Operations Report
 Mountain View Community Shuttle Monthly Operations Report December 6, 2018 Contents Passengers per Day, Table...- 3 - Passengers per Day, Chart...- 3 - Ridership Year-To-Date...- 4 - Average Daily Ridership
JANUARY MONDAY TUESDAY WEDNESDAY THURSDAY FRIDAY SATURDAY SUNDAY
 Vocabulary (01) The Calendar (012) In context: Look at the calendar. Then, answer the questions. JANUARY MONDAY TUESDAY WEDNESDAY THURSDAY FRIDAY SATURDAY SUNDAY 1 New 2 3 4 5 6 Year s Day 7 8 9 10 11
Forecasting. Copyright 2015 Pearson Education, Inc.
 5 Forecasting To accompany Quantitative Analysis for Management, Twelfth Edition, by Render, Stair, Hanna and Hale Power Point slides created by Jeff Heyl Copyright 2015 Pearson Education, Inc. LEARNING
Calculations Equation of Time. EQUATION OF TIME = apparent solar time - mean solar time
 Calculations Equation of Time APPARENT SOLAR TIME is the time that is shown on sundials. A MEAN SOLAR DAY is a constant 24 hours every day of the year. Apparent solar days are measured from noon one day
January 2009 Videmus Stellae
 January 2009 January Schedule of Events Sun Mon Tu e Wed Thu Fri Sat Jan 6th: ATM Sub at Paul Lind s Garage at 1900 Jan 9th: SAC General at Grand Canyon University at 1930 in room 105 of the Fleming Bldg.
Constructing a typical meteorological year -TMY for Voinesti fruit trees region and the effects of global warming on the orchard ecosystem
 Constructing a typical meteorological year -TMY for Voinesti fruit trees region and the effects of global warming on the orchard ecosystem ARMEANU ILEANA*, STĂNICĂ FLORIN**, PETREHUS VIOREL*** *University
Procedure 2 of Section 2 of ICAR Guidelines Computing of Accumulated Lactation Yield. Computing Lactation Yield
 of ICAR Guidelines Computing of Accumulated Lactation Yield Table of Contents 1 The Test Interval Method (TIM) (Sargent, 1968)... 4 2 Interpolation using Standard Lactation Curves (ISLC) (Wilmink, 1987)...
Predicates and Quantifiers
 Predicates and Quantifiers Lecture 9 Section 3.1 Robb T. Koether Hampden-Sydney College Wed, Jan 29, 2014 Robb T. Koether (Hampden-Sydney College) Predicates and Quantifiers Wed, Jan 29, 2014 1 / 32 1
CHAPTER 4 CRITICAL GROWTH SEASONS AND THE CRITICAL INFLOW PERIOD. The numbers of trawl and by bag seine samples collected by year over the study
 CHAPTER 4 CRITICAL GROWTH SEASONS AND THE CRITICAL INFLOW PERIOD The numbers of trawl and by bag seine samples collected by year over the study period are shown in table 4. Over the 18-year study period,
ISO Lead Auditor Lean Six Sigma PMP Business Process Improvement Enterprise Risk Management IT Sales Training
 Training Calendar 2014 Public s (ISO LSS PMP BPI ERM IT Sales Training) www.excelledia.com (ISO, LSS, PMP, BPI, ERM, IT, Sales Public s) 1 Schedule Registration JANUARY FEBRUARY 2 days 26 JAN 27 JAN 3
GTR # VLTs GTR/VLT/Day %Δ:
 MARYLAND CASINOS: MONTHLY REVENUES TOTAL REVENUE, GROSS TERMINAL REVENUE, WIN/UNIT/DAY, TABLE DATA, AND MARKET SHARE CENTER FOR GAMING RESEARCH, DECEMBER 2017 Executive Summary Since its 2010 casino debut,
P7.7 A CLIMATOLOGICAL STUDY OF CLOUD TO GROUND LIGHTNING STRIKES IN THE VICINITY OF KENNEDY SPACE CENTER, FLORIDA
 P7.7 A CLIMATOLOGICAL STUDY OF CLOUD TO GROUND LIGHTNING STRIKES IN THE VICINITY OF KENNEDY SPACE CENTER, FLORIDA K. Lee Burns* Raytheon, Huntsville, Alabama Ryan K. Decker NASA, Marshall Space Flight
Budget Estimates period of the No
 GOVERNMENT OF MAHARASHTRA ACCOUNTS AT A GLANCE (At the end of AUGUST 2017) (UNAUDITED PROVISIONAL FIGURES) Monthly Key Indicator for the month of AUGUST 2017 Description Budget Estimates 2017-18 Actuals
Practice Test Chapter 8 Sinusoidal Functions
 FOM 12 Practice Test Chapter 8 Sinusoidal Functions Name: Multiple Choice Identify the choice that best completes the statement or answers the question. Block: _ 1. Convert 120 into radians. A. 2" 3 B.
Jackson County 2018 Weather Data 67 Years of Weather Data Recorded at the UF/IFAS Marianna North Florida Research and Education Center
 Jackson County 2018 Weather Data 67 Years of Weather Data Recorded at the UF/IFAS Marianna North Florida Research and Education Center Doug Mayo Jackson County Extension Director 1952-2008 Rainfall Data
Lab Activity: Climate Variables
 Name: Date: Period: Water and Climate The Physical Setting: Earth Science Lab Activity: Climate Variables INTRODUCTION:! The state of the atmosphere continually changes over time in response to the uneven
Prince Edward County Appellation 2015 Growing Season Summary
 Overview Prince Edward County Appellation 215 Growing Season Summary The 215 growing season in the Prince Edward County appellation ended with above normal heat units. Daytime temperatures typically averaged
ISO Lead Auditor Lean Six Sigma PMP Business Process Improvement Enterprise Risk Management IT Sales Training
 Training Calendar 2014 Public s (ISO LSS PMP BPI ERM IT Sales Training) (ISO, LSS, PMP, BPI, ERM, IT, Sales Public s) 1 Schedule Registration JANUARY ) FEBRUARY 2 days 26 JAN 27 JAN 3 days 28 JAN 30 JAN
GAMINGRE 8/1/ of 7
 FYE 09/30/92 JULY 92 0.00 254,550.00 0.00 0 0 0 0 0 0 0 0 0 254,550.00 0.00 0.00 0.00 0.00 254,550.00 AUG 10,616,710.31 5,299.95 845,656.83 84,565.68 61,084.86 23,480.82 339,734.73 135,893.89 67,946.95
Determine the trend for time series data
 Extra Online Questions Determine the trend for time series data Covers AS 90641 (Statistics and Modelling 3.1) Scholarship Statistics and Modelling Chapter 1 Essent ial exam notes Time series 1. The value
Regression Analysis II
 Regression Analysis II Measures of Goodness of fit Two measures of Goodness of fit Measure of the absolute fit of the sample points to the sample regression line Standard error of the estimate An index
ISO Lead Auditor Lean Six Sigma PMP Business Process Improvement Enterprise Risk Management IT Sales Training
 Training Calendar 2014 Public s (ISO LSS PMP BPI ERM IT Sales Training) (ISO, LSS, PMP, BPI, ERM, IT, Sales Public s) 1 Schedule Registration JANUARY IMS ) FEBRUARY 2 days 26 JAN 27 JAN 3 days 28 JAN 30
VIRGINIA S I-77 VARIABLE SPEED LIMIT SYSTEM FOR LOW VISIBILITY CONDITIONS
 VIRGINIA S I-77 VARIABLE SPEED LIMIT SYSTEM FOR LOW VISIBILITY CONDITIONS Christopher D. McDonald, PE, PTOE Regional Operations Director, Southwest Region NRITS and ITS Arizona Annual Conference October
Chiang Rai Province CC Threat overview AAS1109 Mekong ARCC
 Chiang Rai Province CC Threat overview AAS1109 Mekong ARCC This threat overview relies on projections of future climate change in the Mekong Basin for the period 2045-2069 compared to a baseline of 1980-2005.
Promoting Rainwater Harvesting in Caribbean Small Island Developing States Water Availability Mapping for Grenada Preliminary findings
 Promoting Rainwater Harvesting in Caribbean Small Island Developing States Water Availability Mapping for Grenada Preliminary findings National Workshop Pilot Project funded by The United Nations Environment
Drought in Southeast Colorado
 Drought in Southeast Colorado Nolan Doesken and Roger Pielke, Sr. Colorado Climate Center Prepared by Tara Green and Odie Bliss http://climate.atmos.colostate.edu 1 Historical Perspective on Drought Tourism
Budget Estimate
 nwjhkk"k@phone-2223251 Government of Bihar Accounts at a Glance {at the end of April, 2017} (UNAUDITED PROVISIONAL FIGURES) Monthly Key Indicators for the month of April, 2017 Description Budget Estimate
A Report on a Statistical Model to Forecast Seasonal Inflows to Cowichan Lake
 A Report on a Statistical Model to Forecast Seasonal Inflows to Cowichan Lake Prepared by: Allan Chapman, MSc, PGeo Hydrologist, Chapman Geoscience Ltd., and Former Head, BC River Forecast Centre Victoria
July 2017 LOGISTICAL HARMONY
 Li s&staging(wpedestriansidewalkprot.) (4/18/through7/18/2017) July2017 101BelvidereEastFaçadeWorkPipeStaging (4/18/through7/18/2017) 101BelvidereEastFaçadeWork (through8/31/2017) Legend RampaccesstoTMCX
Life Cycle of Convective Systems over Western Colombia
 Life Cycle of Convective Systems over Western Colombia Meiry Sakamoto Uiversidade de São Paulo, São Paulo, Brazil Colombia Life Cycle of Convective Systems over Western Colombia Convective System (CS)
Kootenai Basin Water Supply Update and Sturgeon Flow Augmentation Kootenai Valley Resource Initiative
 Kootenai Basin Water Supply Update and Sturgeon Flow Augmentation Kootenai Valley Resource Initiative Greg Hoffman Fishery Biologist / Kootenai River Basin Flood Engineer Libby Dam 15 May 2017 US Army
Arun Platform Tide Gauge
 Arun Platform Tide Gauge Location OS: 506423E 97778N WGS84: Latitude: 50 46 11.39042"N Longitude: 00 29 31.73595"W Instrument Valeport 730 (Druck Pressure Transducer) TGBM Benchmarks Benchmark Description
2015 Fall Conditions Report
 2015 Fall Conditions Report Prepared by: Hydrologic Forecast Centre Date: December 21 st, 2015 Table of Contents Table of Figures... ii EXECUTIVE SUMMARY... 1 BACKGROUND... 2 SUMMER AND FALL PRECIPITATION...
Effective Gross Revenue 3,335,005 3,130,591 3,320,552 3,338,276 3,467,475 3,606,962 3,509,653 3,981,103 3,984,065 4,147,197 4,300,790
 Schedule Of Prospective Cash Flow In Inflated Dollars for the Fiscal Year Beginning 1/1/2011 Potential Gross Revenue Base Rental Revenue $3,331,625 $3,318,220 $3,275,648 $3,270,394 $3,368,740 $3,482,312
Missouri River Basin Water Management
 Missouri River Basin Water Management US Army Corps of Engineers Missouri River Navigator s Meeting February 12, 2014 Bill Doan, P.E. Missouri River Basin Water Management US Army Corps of Engineers BUILDING
Highlights of the 2006 Water Year in Colorado
 Highlights of the 2006 Water Year in Colorado Nolan Doesken, State Climatologist Atmospheric Science Department Colorado State University http://ccc.atmos.colostate.edu Presented to 61 st Annual Meeting
PROJECT REPORT (ASL 720) CLOUD CLASSIFICATION
 CLOUD CLASSIFICATION") PROJECT REPORT (ASL 720) CLOUD CLASSIFICATION SUBMITTED BY- PRIYANKA GUPTA 2011CH70177 RINI KAPOOR 2011CH70179 INDIVIDUAL CONTRIBUTION- Priyanka Gupta- analysed data of region considered in India (West:80,
PROJECT REPORT (ASL 720) CLOUD CLASSIFICATION SUBMITTED BY- PRIYANKA GUPTA 2011CH70177 RINI KAPOOR 2011CH70179 INDIVIDUAL CONTRIBUTION- Priyanka Gupta- analysed data of region considered in India (West:80,
YACT (Yet Another Climate Tool)? The SPI Explorer
? The SPI Explorer") YACT (Yet Another Climate Tool)? The SPI Explorer Mike Crimmins Assoc. Professor/Extension Specialist Dept. of Soil, Water, & Environmental Science The University of Arizona Yes, another climate tool for
YACT (Yet Another Climate Tool)? The SPI Explorer Mike Crimmins Assoc. Professor/Extension Specialist Dept. of Soil, Water, & Environmental Science The University of Arizona Yes, another climate tool for
Monthly Long Range Weather Commentary Issued: APRIL 1, 2015 Steven A. Root, CCM, President/CEO
 Monthly Long Range Weather Commentary Issued: APRIL 1, 2015 Steven A. Root, CCM, President/CEO sroot@weatherbank.com FEBRUARY 2015 Climate Highlights The Month in Review The February contiguous U.S. temperature
Sierra Weather and Climate Update
 Sierra Weather and Climate Update 2014-15 Kelly Redmond Western Regional Climate Center Desert Research Institute Reno Nevada Yosemite Hydroclimate Workshop Yosemite Valley, 2015 October 8-9 Percent of
Special Release (2006=100) (2006=100)
 (2006=100)") Special Release PHILIPPINE STATISTICS AUTHORITY PROVINCE OF AKLAN Volume IV Number 7 August INQUIRIES: For more information write or call: Philippine Statistics Authority N. Roldan St., Poblacion, Kalibo,
Special Release PHILIPPINE STATISTICS AUTHORITY PROVINCE OF AKLAN Volume IV Number 7 August INQUIRIES: For more information write or call: Philippine Statistics Authority N. Roldan St., Poblacion, Kalibo,
Butte County Drought Task Force December 1, :00 AM noon 202 Mira Loma Drive, Tahoe Room Oroville, CA. Agenda
 WATER AND RESOURCE CONSERVATION 308 Nelson Avenue, Oroville, CA 95965 Telephone: (530) 538-4343 Fax: (530) 538-3807 www.buttecounty.net/waterandresource bcwater@buttecounty.net Paul Gosselin, Director
2018 Technical Standards and Safety Authority and Ministry of Advanced Education & Skills Development Examination Schedule
 Ministry of Advanced Education & Skills Development ination Schedule Last Updated: June 7, 2018 Document Uncontrolled if Printed ination Schedule Preface: The following sets out and identifies the 2018
November 2018 Weather Summary West Central Research and Outreach Center Morris, MN
 November 2018 Weather Summary Lower than normal temperatures occurred for the second month. The mean temperature for November was 22.7 F, which is 7.2 F below the average of 29.9 F (1886-2017). This November
Jackson County 2014 Weather Data
 Jackson County 2014 Weather Data 62 Years of Weather Data Recorded at the UF/IFAS Marianna North Florida Research and Education Center Doug Mayo Jackson County Extension Director 1952-2008 Rainfall Data
Principles of Mathematics 12: Explained!
 www.math12.com 18 Part I Ferris Wheels One of the most common application questions for graphing trigonometric functions involves Ferris wheels, since the up and down motion of a rider follows the shape
PROGRESS ACCOMPLISHED THIS PERIOD
 Semi-Annual Report Period Covered: September 1, 21 through February 28, 217 Prepared By: Richard Radigan Title: Monitoring of a Constructed Oyster Reef in the St. Lucie Estuary Agency: Florida Fish & Wildlife
Recovery Analysis Methods and Data Requirements Study
 Elevation Recovery Analysis Methods and Data Requirements Study Update to NTB Phase II Local Technical Peer Review Group December 3, 2003 Time 1 Schedule for Pumpage Reductions 180 160 140 120 158 121
REDWOOD VALLEY SUBAREA
 Independent Science Review Panel Conceptual Model of Watershed Hydrology, Surface Water and Groundwater Interactions and Stream Ecology for the Russian River Watershed Appendices A-1 APPENDIX A A-2 REDWOOD
The Palfai Drought Index (PaDI) Expansion of applicability of Hungarian PAI for South East Europe (SEE) region Summary
 Expansion of applicability of Hungarian PAI for South East Europe (SEE) region Summary") The Palfai Drought Index () Expansion of applicability of Hungarian PAI for South East Europe (SEE) region Summary In Hungary the Palfai drought index (PAI) worked out for users in agriculture and in water
The Palfai Drought Index () Expansion of applicability of Hungarian PAI for South East Europe (SEE) region Summary In Hungary the Palfai drought index (PAI) worked out for users in agriculture and in water
Nicor Gas Rider 6 History Gas Supply Cost Factors (Cents Per Therm) MONTH GCR (R/) UFR (S/) GCNR (T/) UFNR (U/) GC CGC DGC NCGC TSA CSBC SSCR BSA
 MONTH GCR (R/) UFR (S/) GCNR (T/) UFNR (U/) GC CGC DGC NCGC TSA CSBC SSCR BSA") MONTH GCR (R/) UFR (S/) GCNR (T/) UFNR (U/) GC CGC DGC NCGC TSA CSBC SSCR BSA 2018 July 38.00 0.60 37.69 0.29 37.40 32.56 58.58 4.84-0.03 2.02 0.02 2.01 June 36.00 0.57 35.70 0.27 35.43 30.39 58.79 5.04-0.02
MONTH GCR (R/) UFR (S/) GCNR (T/) UFNR (U/) GC CGC DGC NCGC TSA CSBC SSCR BSA 2018 July 38.00 0.60 37.69 0.29 37.40 32.56 58.58 4.84-0.03 2.02 0.02 2.01 June 36.00 0.57 35.70 0.27 35.43 30.39 58.79 5.04-0.02
Monthly Long Range Weather Commentary Issued: February 15, 2015 Steven A. Root, CCM, President/CEO
 Monthly Long Range Weather Commentary Issued: February 15, 2015 Steven A. Root, CCM, President/CEO sroot@weatherbank.com JANUARY 2015 Climate Highlights The Month in Review During January, the average
Wind Resource Data Summary Cotal Area, Guam Data Summary and Transmittal for December 2011
 Wind Resource Data Summary Cotal Area, Guam Data Summary and Transmittal for December 2011 Prepared for: GHD Inc. 194 Hernan Cortez Avenue 2nd Floor, Ste. 203 Hagatna, Guam 96910 January 2012 DNV Renewables
Non-Glacial Watersheds of Uttarakhand
 Impact of Climate Change in the Non- Glacial Fed Himalayan River System: A Case Study From the Kosi River in District Almora, Uttarakhand State (India) J.S.Rawat Director Centre of Excellence for Natural
Accounts at a Glance (As at the end of JULY 2013)
") Accounts at a Glance (As at the end of JULY 2013) 1 Sl. No Budget estimates 2013-14 Actuals upto July 2013 (Rupees in crore) % of Actuals to Budget Estimates Current 2013-14 Corresponding period of the
Accounts at a Glance (As at the end of JULY 2013) 1 Sl. No Budget estimates 2013-14 Actuals upto July 2013 (Rupees in crore) % of Actuals to Budget Estimates Current 2013-14 Corresponding period of the
BESPOKEWeather Services Tuesday Morning Update: SLIGHTLY BEARISH
 Weather guidance overnight continued to tick demand expectations higher even after some very impressive afternoon guidance yesterday. We still see weather as extremely supportive for natural gas prices,
CHAPTER-11 CLIMATE AND RAINFALL
 CHAPTER-11 CLIMATE AND RAINFALL 2.1 Climate Climate in a narrow sense is usually defined as the "average weather", or more rigorously, as the statistical description in terms of the mean and variability
Bryan Butler. National Radio Astronomy Observatory. November 23, 1998
 MMA Memo. No. 238 Precipitable Water at KP 1993{1998 Bryan Butler National Radio Astronomy Observatory November 23, 1998 Introduction This memo is essentially a clone of MMA Memo No. 237 (also VLA Scientic
2019 Settlement Calendar for ASX Cash Market Products. ASX Settlement
 2019 Settlement Calendar for ASX Cash Market Products ASX Settlement Settlement Calendar for ASX Cash Market Products 1 ASX Settlement Pty Limited (ASX Settlement) operates a trade date plus two Business
Final Report. COMET Partner's Project. University of Texas at San Antonio
 Final Report COMET Partner's Project University: Name of University Researcher Preparing Report: University of Texas at San Antonio Dr. Hongjie Xie National Weather Service Office: Name of National Weather
CIMA Professional
 CIMA Professional 201819 Manchester Interactive Timetable Version 3.1 Information last updated 12/10/18 Please note: Information and dates in this timetable are subject to change. A better way of learning
CIMA Professional
 CIMA Professional 201819 Birmingham Interactive Timetable Version 3.1 Information last updated 12/10/18 Please note: Information and dates in this timetable are subject to change. A better way of learning
CLIMOGRAPH UNIT: s^io
 Narrre: Block: Date: CLIMOGRAPH UNIT: s^io The climate can be defined as the average amount of rainfall, and the average temperature in a region. The climate of a region affects the type of soil that is
Multivariate Regression Model Results
 Updated: August, 0 Page of Multivariate Regression Model Results 4 5 6 7 8 This exhibit provides the results of the load model forecast discussed in Schedule. Included is the forecast of short term system
School Year Calendar,
 School Year Calendar, 0- August 0 0 First day for Start of st quarter September 0 Labor Day 0 ; schools closed for st -quarter progress reports 0 st -quarter progress reports Updated as of May 0; see www.baltimorecityschools.org
Curriculum Map Grade 8 Math
 Curriculum Map Grade 8 Math Sept. Oct. Nov. Dec. Jan. September 6 October 5 October 9 November 2 November 5 - November 30 December 3 December 21 January 2 January 16 G R A D E 8 Solving Equations: ~Solving
Astrological Calendar. for Central Time
 2014 for Central Time January 2014 Capricorn Compliments of: Clayten Tylor Esoteric Astrologer (604)331-0251 Jan 15, 2014 Full Moon 10:53:09 PM CST Jan 1, 2014 New Moon 05:15:21 AM CST January 2014 Sun
Fibonacci Numbers. November 7, Fibonacci's Task: Figure out how many pairs of rabbits there will be at the end of one year, following rules.
 Fibonacci Numbers November 7, 2010 Fibonacci's Task: Figure out how many pairs of rabbits there will be at the end of one year, following rules. Rules: 1. Start with a pair of new rabbits, born in December.
Graphing Sea Ice Extent in the Arctic and Antarctic
 Graphing Sea Ice Extent in the Arctic and Antarctic 1. Large amounts of ice form in some seasons in the oceans near the North Pole and the South Pole (the Arctic Ocean and the Southern Ocean). This ice,
Special Release (2006=100) (2006=100)
 (2006=100)") Special Release PHILIPPINE STATISTICS AUTHORITY PROVINCE OF AKLAN Volume IV Number 12 January 2016 INQUIRIES: For more information write or call: Philippine Statistics Authority N. Roldan St., Poblacion,
Special Release PHILIPPINE STATISTICS AUTHORITY PROVINCE OF AKLAN Volume IV Number 12 January 2016 INQUIRIES: For more information write or call: Philippine Statistics Authority N. Roldan St., Poblacion,
Table 01A. End of Period End of Period End of Period Period Average Period Average Period Average
 SUMMARY EXCHANGE RATE DATA BANK OF ZAMBIA MID-RATES Table 01A Period K/USD K/GBP K/ZAR End of Period End of Period End of Period Period Average Period Average Period Average Monthly January 6.48 6.46 9.82
Discrete distribution. Fitting probability models to frequency data. Hypotheses for! 2 test. ! 2 Goodness-of-fit test
 Discrete distribution Fitting probability models to frequency data A probability distribution describing a discrete numerical random variable For example,! Number of heads from 10 flips of a coin! Number
March 5, British Columbia Utilities Commission 6 th Floor, 900 Howe Street Vancouver, BC V6Z 2N3
 Tom A. Loski Chief Regulatory Officer March 5, 2010 British Columbia Utilities Commission 6 th Floor, 900 Howe Street Vancouver, BC V6Z 2N3 16705 Fraser Highway Surrey, B.C. V4N 0E8 Tel: (604) 592-7464
El Nino 2015 in South Sudan: Impacts and Perspectives. Raul Cumba
 El Nino 2015 in South Sudan: Impacts and Perspectives Raul Cumba El Nino 2015-2016 The El Nino Event of 2015-2016 The 2015/16 El Nino Event Officially declared in March 2015 Now approaching peak intensity
Master Map Algebra (Master) Content Skills Assessment Instructional Strategies Notes. A. MM Quiz 1. A. MM Quiz 2 A. MM Test
 Content Skills Assessment Instructional Strategies Notes. A. MM Quiz 1. A. MM Quiz 2 A. MM Test") Blair High School Teacher: Brent Petersen Master Map Algebra (Master) August 2010 Connections to Algebra Learn how to write and -Variables in Algebra -Exponents and Powers -Order of Operations -Equations
Blair High School Teacher: Brent Petersen Master Map Algebra (Master) August 2010 Connections to Algebra Learn how to write and -Variables in Algebra -Exponents and Powers -Order of Operations -Equations
PRELIMINARY DRAFT FOR DISCUSSION PURPOSES
 Memorandum To: David Thompson From: John Haapala CC: Dan McDonald Bob Montgomery Date: February 24, 2003 File #: 1003551 Re: Lake Wenatchee Historic Water Levels, Operation Model, and Flood Operation This
January 25, Summary
 January 25, 2013 Summary Precipitation since the December 17, 2012, Drought Update has been slightly below average in parts of central and northern Illinois and above average in southern Illinois. Soil
Tornado Hazard Risk Analysis: A Report for Rutherford County Emergency Management Agency
 Tornado Hazard Risk Analysis: A Report for Rutherford County Emergency Management Agency by Middle Tennessee State University Faculty Lisa Bloomer, Curtis Church, James Henry, Ahmad Khansari, Tom Nolan,
Budget Estimates
 Sl. No. Description GOVERNMENT OF BIHAR ACCOUNTS AT A GLANCE (At the end of February, 2019) (UNAUDITED PROVISIONAL FIGURES) Monthly Key indicator for the month of February, 2019 Budget Estimates 2018-19
Budget Estimates
 Sl. No. GOVERNMENT OF BIHAR ACCOUNTS AT A GLANCE (At the end of November, 2018) (UNAUDITED PROVISIONAL FIGURES) Monthly Key indicator for the month of November, 2018 Description Budget Estimates 2018-19
Saving for the New Year
 To start the new year, I have decided to start a savings account so that I can buy myself a little something special on New Year s Day next year. I have decided to put one dime in a jar on the 1st day
Variability of Reference Evapotranspiration Across Nebraska
 Know how. Know now. EC733 Variability of Reference Evapotranspiration Across Nebraska Suat Irmak, Extension Soil and Water Resources and Irrigation Specialist Kari E. Skaggs, Research Associate, Biological
CURRICULUM MAP TEMPLATE. Priority Standards = Approximately 70% Supporting Standards = Approximately 20% Additional Standards = Approximately 10%
 CURRICULUM MAP TEMPLATE Priority Standards = Approximately 70% Supporting Standards = Approximately 20% Additional Standards = Approximately 10% Algebra 1b 212 Time Line September/ October Essential Questions
Champaign-Urbana 1998 Annual Weather Summary
 Champaign-Urbana 1998 Annual Weather Summary ILLINOIS STATE WATER SURVEY Audrey Bryan, Weather Observer 2204 Griffith Dr. Champaign, IL 61820 wxobsrvr@sparc.sws.uiuc.edu The development of the El Nìno