Railvolution 2010 Analytical Tools to Support TOD Success Portland OR October 20, 2010 Scott Bernstein & Linda Young, Center for Neighborhood
|
|
|
- Merry Goodwin
- 5 years ago
- Views:
Transcription


1 National TOD Database Railvolution 2010 Analytical Tools to Support TOD Success Portland OR October 20, 2010 Scott Bernstein & Linda Young, Center for Neighborhood Technology
 in 337 regions of the US w/80% of US population H+T Affordability Index Equation H+T Index = (Housing Costs +")
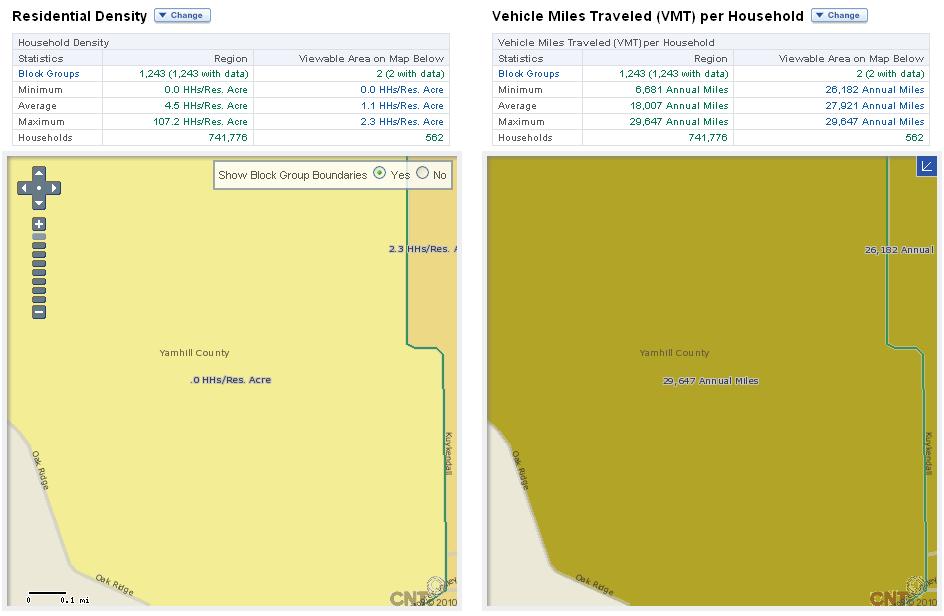
2 What is the H+T Affordability Index? A tool to measure the 2 largest household costs housing and transportation by neighborhood. Prepared for all 161,000 neighborhoods (Census Block Groups) in 337 regions of the US w/80% of US population H+T Affordability Index Equation H+T Index = (Housing Costs + Transportation Costs) Income or Htaindex.org
3 The Meaning of Drive tilyou Qualify Transport Costs Can Approach or Exceed Housing Costs for Working Households % Income miles out Miles

4

5

6

7

8
9
10

11
12

13

14
15 or abogo.cnt.org
16

17
18 Why a TOD Database? Revealing the value of transit requires data from many sources Needed a tool that allows you to quickly warehouse data for the purpose of creating new knowledge and understandings Existing networks weren t dedicated to producing the tool or toddata.cnt.org
 then HUD then by FTA/HUD/Surdna Tool to")

19 Got Transit? History - CTOD Database Initially funded by FTA (2005) then HUD then by FTA/HUD/Surdna Tool to measure & project transit demand Identifies existing & potential TOD Markets & their benefits Goal: Accelerate practice & commitment to high performance TOD Realizing the Potential: Expanding Housing Opportunities Near Transit by Center for Transit-Oriented Development for FTA and HUD


20 CTOD TOD Database--Updated (Total = 4,610 Transit Stations) Includes: Heavy Rail Rail Rapid Transit Light Rail Trolley Streetcar Bus Rapid Transit Monorail Skyway Source: 2003 National Transit Atlas Database, Transit Agencies, Federal Transit Administration, CNT (Stations as of December, 2007)
21 Spans 3,572 Existing Stations Across 9 Service Types Existing Stations by Service Type SKYWAY Monorail Cable Car Service Type People Mover BRT Light Rail Trolley/StreetCar Commuter Rail RRT Stations Stations
22 Building the Database Methodology Created using the 2003 National Transit Atlas Database (NTAD) Contacted transit agencies for updated route & station GIS files Types of data collected: 2000 Census demographics LED & CTPP Employment & Business Type Statistics Housing and Transportation (H+T SM ) Affordability Index


23 Data at a Neighborhood Level GIS used to proportionally assign the data Drilling down to the neighborhood using census tracts, block groups and blocks Census Boundaries don t align perfectly with Transit Zones, particularly Census Tracts Census Block Groups offer finer detail Census Blocks allow us to really focus on the detailed characteristics of a neighborhood
 Transit Region Presented in standard and custom report formats Displayed on a map-based website Can be downloaded in Microsoft Word table or Excel spreadsheet")
24 User Friendly Features One Stop Shop - Over 40,000 characteristics for 4,610 stations Data on 3 levels: Transit Zone (1/2 mile radius buffer around each station) Aggregate of Transit Zones (accounts for overlap between Transit Zones) Transit Region Presented in standard and custom report formats Displayed on a map-based website Can be downloaded in Microsoft Word table or Excel spreadsheet Barrio Logan, San Diego, CA
 Place of residence/work, and origin/destination Fruitvale Transit Village,")
25 Data from Census 2000 Summary File 1 Housing units, occupancy status, tenure, household size, race/ethnicity, gender Summary File 3 Income, median value of owner occupied housing, gross rent, vacancy status, vehicle ownership, mode to work, travel time to work Census Transportation Planning Package (CTPP) Place of residence/work, and origin/destination Fruitvale Transit Village, Oakland
26 Longitudinal Employment- Household Data (LED) Joint effort US Census and Bureau of Transportation Statistics data reported by household and workplace for most states Quarterly workforce indicators Average earnings, number of establishments, job creation/destruction, new hires Residence area characteristics Count of workers by sector, quarterly earnings, worker age, median distance traveled to work Workplace area characteristics Count of jobs by sector, worker age, and monthly earnings


27 Housing +Transportation Affordability Index 41 Characteristics for each Census Block Group 161,000 Block Groups in all 337 Metro Areas Same Underlying Geography as the TOD Database
28 Preview The National TOD Database Fruitvale Transit Village, Oakland, CA

29 Metro Denver Example
30 Clicking on Denver Pulls Up a View of Region Highlighting Existing Fixed Guideway in Orange and Proposed in Purple

31 Reports Portal Provides Shortcut to Census SF1 and 3, CTPP, LED + HTA Index, 40,000 measurements for each transit stop
32 Existing System View Shows Current and Approved RTD Lines w/half-mile Buffers, Can Also Select Quarter-Mile

33 View Shows Eventual Build-Out for All Existing & Proposed Lines

34 Selecting Population Density, Report for All Stations Generated as Either a Table

35 As a List

36 Or You Can Decide to Download as a Spreadsheet

37 Shown Here as a Word/Excel Spreadsheet
38 Selecting a Station Generates a Popup Window
39 For This Station at 18 th & Stout Showing Population, Net & Gross Density, Block Size
40 And Switching from Data to Streetview Gives a 360 Degree Scroll
41 Same View for Union Station
42 Or for Pepsi Center/Elitch Gardens
43 And Again With Streetview
44 Contrasting These Denver Stations with Planned East Corridor Station Toward Airport: Low Density, Little Urban Form Near Montbello, Green Valley Ranch, Foreclosure Hot-Spots
45 As Shown by the Streetview
46 Switching to HT View at the North Metro 162d Avenue Stop H+T over 70% for AMI
47 Good Value Creation Potential But Will Take Some Work to Reduce H+T To Affordability
48 System Easily Shows Structure of Existing and Proposed Systems for Benchmarking--Chicago
49 San Juan PR
50 Charlotte NC
51 Portland OR
52 LA & Southland CA
53 Greater Metro NYC
54 New Orleans LA
55 Tucson AZ Modern Streetcar
56 Will Meet Phoenix LRT If Sun Corridor Rail Connects the Two
57 SF Bay Area
58 Washington DC Meets Northern VA & Baltimore MD
59 Which Continues to Pursue Expansion
60 Cleveland GRTA Hosting Leadership Development on Regional Economic Strategy
61 Extensive Coverage in Metro Philadelphia
62 Sound Transit Connects Seattle Tacoma and Cascadia Region


63 Using the Tool to Sort Station Areas by Place Type
64 Generate Standard Reports Residential densities Journey to work Where workers live by occupation Auto and non-auto commute to work by industry Vehicles per worker for households under poverty status Or create custom reports of your choosing!


65 Using the Database to Promote Sustainable & Livable Communities Planners and Developers interested in identifying underutilized TOD markets for residential, commercial and economic development Transit agencies interested in the joint development potential of their real estate holdings Transportation planners interested in origin and destination commute patterns within a specific transit zone or corridor MPOs/Regional Councils preparing consolidated land use and transportation plans looking to identify priority development areas Researchers working at local and/or national level on transit access issues related to affordable housing, minority, low-income, elderly, or disabled persons Pearl District, Portland, OR Portland, OR

66 Developing Strategic TOD Plans for Deploying Underutilized Assets

67 Helping Justify Reduced Parking in TOD Areas Housing For People Not Cars

68 Identifying Strong & Weak Local Retail Market Potential
 Needed a focus on community benefits to get public & private buy-in Resulted in support from community leaders, investors, Gov. Baldacci, legislature & USDOT")
69 The Downeaster as a Model for Continued and Enhanced Regional Cooperation and Strategy Serves a largely rural corridor NE from Boston through NH to Portland ME (the other) Needed a focus on community benefits to get public & private buy-in Resulted in support from community leaders, investors, Gov. Baldacci, legislature & USDOT

70 Boston Portland CBSA 288 Stations in in Downeaster Corridor Expansion to Freeport, Brunswick 396,000 HHs in 2000, 16% of total Will grow to 752,000 or 24% in 2030 Growth of 356,000 almost ½ of Projected Regional Growth Only NY, LA, Bay Area & Chicago Will See More TOD HHs Corridor to NE is a chain of rural cities Extension two stops to Freeport & Brunswick will link to Maine Eastern RR to Rockland


71 Portland Old Orchard Bch Saco-Biddeford Wells Examined each station area s Demographics, housing, Commercial, economics Dover Durham Boston Woburn Haverhill Exeter
72 Downeaster Expansion Benefits Study in 2008 Projected by Cumulative construction of $7.2B Const/rehab of 42k hu + 6.8M sf commercial Over 17,000 jobs $244 million in annual transport cost savings $2.4 B in annual resident and visitor purchasing power $75 M in annual new state and local tax revenue Affordable housing required by State law Broke ground last month! Will be completed Fall 2012

73 Putting the TOD Database to Work New map-based website Beta-test just completed-thank you! Now available
74 Coming Soon to a Station Near You Collect & synthesize feedback Make system improvements & enhance applications EG, Include updated Census 2010 (in 2012) and ACS data this winter Dissemination Create users guide & users group Develop a train the trainer curriculum Prepare & implement a marketing plan
75 Thank You! CTOD Contacts for the National TOD Database Are: Nadine Fogarty Maria Choca Urban Linda Young Abby Thorne-Lyman
Speakers: Jeff Price, Federal Transit Administration Linda Young, Center for Neighborhood Technology Sofia Becker, Center for Neighborhood Technology
 Speakers: Jeff Price, Federal Transit Administration Linda Young, Center for Neighborhood Technology Sofia Becker, Center for Neighborhood Technology Peter Haas, Center for Neighborhood Technology Craig
GIS Analysis of Crenshaw/LAX Line
 PDD 631 Geographic Information Systems for Public Policy, Planning & Development GIS Analysis of Crenshaw/LAX Line Biying Zhao 6679361256 Professor Barry Waite and Bonnie Shrewsbury May 12 th, 2015 Introduction
Orien Ori t en a t tion a Webi W nar: ebi CPD Maps 2
 Orientation Webinar: CPD Maps 2 Agenda 1. Background - econ Planning Suite 2. Expanded Planning Data 3. CPD Maps Overview 4. Demonstration Guide Me Wizard Map Selection Identify Tool Printing and Saving
Westside Extension Los Angeles, California
 Westside Extension Los Angeles, California Rail~Volution 2010 Portland, Oregon Monica Villalobos AECOM History of Westside Suburban Growth in the Westside (1920 1970 s) LA Centers Concept + Employment
Transit Service Gap Technical Documentation
 Transit Service Gap Technical Documentation Introduction This document is an accompaniment to the AllTransit TM transit gap methods document. It is a detailed explanation of the process used to develop
INSIDE. Metric Descriptions by Topic Area. Data Sources and Methodology by Topic Area. Technical Appendix
 As part of the Chicago Neighborhoods 2015 (CN2015) project, the Institute for Housing Studies at DePaul University collected data and built metrics to help The Chicago Community Trust and the City of Chicago
Geospatial Analysis of Job-Housing Mismatch Using ArcGIS and Python
 Geospatial Analysis of Job-Housing Mismatch Using ArcGIS and Python 2016 ESRI User Conference June 29, 2016 San Diego, CA Jung Seo, Frank Wen, Simon Choi and Tom Vo, Research & Analysis Southern California
BROOKINGS May
 Appendix 1. Technical Methodology This study combines detailed data on transit systems, demographics, and employment to determine the accessibility of jobs via transit within and across the country s 100
Spatial and Socioeconomic Analysis of Commuting Patterns in Southern California Using LODES, CTPP, and ACS PUMS
 Spatial and Socioeconomic Analysis of Commuting Patterns in Southern California Using LODES, CTPP, and ACS PUMS Census for Transportation Planning Subcommittee meeting TRB 95th Annual Meeting January 11,
The econ Planning Suite: CPD Maps and the Con Plan in IDIS for Consortia Grantees Session 1
 The econ Planning Suite: CPD Maps and the Con Plan in IDIS for Consortia Grantees Session 1 1 Training Objectives Use CPD Maps to analyze, assess, and compare levels of need in your community Use IDIS
Regional Performance Measures
 G Performance Measures Regional Performance Measures Introduction This appendix highlights the performance of the MTP/SCS for 2035. The performance of the Revenue Constrained network also is compared to
Regional Performance Measures
 G Performance Measures Regional Performance Measures Introduction This appendix highlights the performance of the MTP/SCS for 2035. The performance of the Revenue Constrained network also is compared to
Planning for Economic and Job Growth
 Planning for Economic and Job Growth Mayors Innovation Project Winter 2012 Meeting January 21, 2012 Mary Kay Leonard Initiative for a Competitive Inner City AGENDA The Evolving Model for Urban Economic
Spatial Organization of Data and Data Extraction from Maptitude
 Spatial Organization of Data and Data Extraction from Maptitude N. P. Taliceo Geospatial Information Sciences The University of Texas at Dallas UT Dallas GIS Workshop Richardson, TX March 30 31, 2018 1/
Frequently Asked Questions
 What is the Regional Transit Engagement Series? As one of the fastest growing regions in the country, there is recognition that long-term transit planning efforts should be accelerated if we are to remain
Spatiotemporal Analysis of Commuting Patterns in Southern California Using ACS PUMS, CTPP and LODES
 Spatiotemporal Analysis of Commuting Patterns in Southern California Using ACS PUMS, CTPP and LODES 2017 ACS Data Users Conference May 11-12, 2017 Alexandria, VA Jung Seo, Tom Vo, Frank Wen and Simon Choi
FHWA Planning Data Resources: Census Data Planning Products (CTPP) HEPGIS Interactive Mapping Portal
 HEPGIS Interactive Mapping Portal") FHWA Planning Data Resources: Census Data Planning Products (CTPP) HEPGIS Interactive Mapping Portal Jeremy Raw, P.E. FHWA, Office of Planning, Systems Planning and Analysis August 2017 Outline Census
FHWA Planning Data Resources: Census Data Planning Products (CTPP) HEPGIS Interactive Mapping Portal Jeremy Raw, P.E. FHWA, Office of Planning, Systems Planning and Analysis August 2017 Outline Census
Environmental Analysis, Chapter 4 Consequences, and Mitigation
 Environmental Analysis, Chapter 4 4.17 Environmental Justice This section summarizes the potential impacts described in Chapter 3, Transportation Impacts and Mitigation, and other sections of Chapter 4,
New Partners for Smart Growth: Building Safe, Healthy, and Livable Communities Mayor Jay Williams, Youngstown OH
 New Partners for Smart Growth: Building Safe, Healthy, and Livable Communities Mayor Jay Williams, Youngstown OH The City of Youngstown Youngstown State University Urban Strategies Inc. Youngstown needed
Economic and Social Urban Indicators: A Spatial Decision Support System for Chicago Area Transportation Planning
 Economic and Social Urban Indicators: A Spatial Decision Support System for Chicago Area Transportation Planning Piyushimita Thakuriah (Vonu), P.S. Sriraj, Paul Metaxatos, Inshu Minocha & Tanushri Swarup
Census Transportation Planning Products (CTPP)
") Census Transportation Planning Products (CTPP) Penelope Weinberger CTPP Program Manager - AASHTO September 15, 2010 1 What is the CTPP Program Today? The CTPP is an umbrella program of data products, custom
Census Transportation Planning Products (CTPP) Penelope Weinberger CTPP Program Manager - AASHTO September 15, 2010 1 What is the CTPP Program Today? The CTPP is an umbrella program of data products, custom
The Church Demographic Specialists
 The Church Demographic Specialists Easy-to-Use Features Map-driven, Web-based Software An Integrated Suite of Information and Query Tools Providing An Insightful Window into the Communities You Serve Key
Local Economic Activity Around Rapid Transit Stations
 Local Economic Activity Around Rapid Transit Stations The Case of Chicago s Orange Line Julie Cooper, MPP 2014 Harris School of Public Policy Transport Chicago June 6, 2014 Motivation Impacts of transit
Developing Innovation Village, Baltimore
 Developing Innovation Village, Baltimore Rick Jenarine, Ridhima Mehrotra, Andrew Seguin, Claire Warner Under the supervision of Professor Chao Liu URSP688L: Planning Technologies The University of Maryland
Analyzing the Market Share of Commuter Rail Stations using LEHD Data
 Analyzing the Market Share of Commuter Rail Stations using LEHD Data Using Census Data for Transportation Applications Conference, Irvine, CA October 26, 2011 1. What is the size of Metrolink s commute
Using American Factfinder
 Using American Factfinder What is American Factfinder? American Factfinder is a search engine that provides access to the population, housing and economic data collected by the U.S. Census Bureau. It can
Forecasts for the Reston/Dulles Rail Corridor and Route 28 Corridor 2010 to 2050
 George Mason University Center for Regional Analysis Forecasts for the Reston/Dulles Rail Corridor and Route 28 Corridor 21 to 25 Prepared for the Fairfax County Department of Planning and Zoning Lisa
Spatiotemporal Analysis of Commuting Patterns: Using ArcGIS and Big Data
 Spatiotemporal Analysis of Commuting Patterns: Using ArcGIS and Big Data 2017 ESRI User Conference July 13, 2017 San Diego, VA Jung Seo, Tom Vo, Frank Wen and Simon Choi Research & Analysis Southern California
Initial Findings from Regional Initiatives Planning Enhancement Fair Housing & Equity Assessment
 NEW YORK AND CONNECTICUT SUSTAINABLE COMMUNITIES Initial Findings from Regional Initiatives Planning Enhancement Fair Housing & Equity Assessment July 30, 2013 White Plains Library Federal grant to improve
Measuring connectivity in London
 Measuring connectivity in London OECD, Paris 30 th October 2017 Simon Cooper TfL City Planning 1 Overview TfL Connectivity measures in TfL PTALs Travel time mapping Catchment analysis WebCAT Current and
Section 2. Indiana Geographic Information Council: Strategic Plan
 Section 2. Indiana Geographic Information Council: Strategic Plan Introduction A geographic information system (GIS) is an automated tool that allows the collection, modification, storage, analysis, and
Massachusetts Institute of Technology Department of Urban Studies and Planning
 Massachusetts Institute of Technology Department of Urban Studies and Planning 11.204: Planning, Communications & Digital Media Fall 2002 Lecture 6: Tools for Transforming Data to Action Lorlene Hoyt October
East Bay BRT. Planning for Bus Rapid Transit
 East Bay BRT Planning for Bus Rapid Transit Regional Vision Draper Prison The Bottleneck is a State-Level issue, Salt Lake County 2050 Population: 1.5M Draper Prison hopefully with some State-Level funding!
Mapping Accessibility Over Time
 Journal of Maps, 2006, 76-87 Mapping Accessibility Over Time AHMED EL-GENEIDY and DAVID LEVINSON University of Minnesota, 500 Pillsbury Drive S.E., Minneapolis, MN 55455, USA; geneidy@umn.edu (Received
Data Matrix User Guide
 Data Matrix User Guide 1. Introduction The 2017 Data Matrix is designed to support the 2017 iteration of the Regional Skills Assessments (RSAs) in Scotland. The RSAs align with the Regional Outcome Agreement
GIS Geographical Information Systems. GIS Management
 GIS Geographical Information Systems GIS Management Difficulties on establishing a GIS Funding GIS Determining Project Standards Data Gathering Map Development Recruiting GIS Professionals Educating Staff
Figure 8.2a Variation of suburban character, transit access and pedestrian accessibility by TAZ label in the study area
 Figure 8.2a Variation of suburban character, transit access and pedestrian accessibility by TAZ label in the study area Figure 8.2b Variation of suburban character, commercial residential balance and mix
Managing Growth: Integrating Land Use & Transportation Planning
 Managing Growth: Integrating Land Use & Transportation Planning Metro Vancouver Sustainability Community Breakfast Andrew Curran Manager, Strategy June 12, 2013 2 Integrating Land Use & Transportation
A User s Guide to the Federal Statistical Research Data Centers
 A User s Guide to the Federal Statistical Research Data Centers Mark Roberts Professor of Economics and Director PSU FSRDC September 2016 M. Roberts () RDC User s Guide September 2016 1 / 14 Outline Introduction
Can Public Transport Infrastructure Relieve Spatial Mismatch?
 Can Public Transport Infrastructure Relieve Spatial Mismatch? Evidence from Recent Light Rail Extensions Kilian Heilmann University of California San Diego April 20, 2015 Motivation Paradox: Even though
Are You Maximizing The Value Of All Your Data?
 Are You Maximizing The Value Of All Your Data? Using The SAS Bridge for ESRI With ArcGIS Business Analyst In A Retail Market Analysis SAS and ESRI: Bringing GIS Mapping and SAS Data Together Presented
Foreword. Vision and Strategy
 GREATER MANCHESTER SPATIAL FRAMEWORK Friends of Walkden Station Consultation Response January 2017 Foreword Friends of Walkden Station are a group of dedicated volunteers seeking to raise the status and
Impacts of Transit Rail Lines on Property Values
 Impacts of Transit Rail Lines on Property Values Rail~Volution 2007 Introduction The Question Research Tools Methodology Examples Results Question Won t transit in my backyard hurt my property value?
A Comprehensive Method for Identifying Optimal Areas for Supermarket Development. TRF Policy Solutions April 28, 2011
 A Comprehensive Method for Identifying Optimal Areas for Supermarket Development TRF Policy Solutions April 28, 2011 Profile of TRF The Reinvestment Fund builds wealth and opportunity for lowwealth communities
An Assessment of People, Place and Business on Syracuse s Near Northside
 An Assessment of People, Place and Business on Syracuse s Near Northside May 2013 Report produced by Jon Glass, Kelly Montague and Mark Pawliw Edited by Jon Glass and Jonnell Robinson Syracuse Community
Study Overview. the nassau hub study. The Nassau Hub
 Livable Communities through Sustainable Transportation the nassau hub study AlternativeS analysis / environmental impact statement The Nassau Hub Study Overview Nassau County has initiated the preparation
HORIZON 2030: Land Use & Transportation November 2005
 PROJECTS Land Use An important component of the Horizon transportation planning process involved reviewing the area s comprehensive land use plans to ensure consistency between them and the longrange transportation
Lee County, Florida 2015 Forecast Report Population, Housing and Commercial Demand
 Lee County, Florida 2015 Forecast Report Population, Housing and Commercial Demand Thank you for purchasing this report, which contains forecasts of population growth, housing demand and demand for commercial
An online data and consulting resource of THE UNIVERSITY OF TOLEDO THE JACK FORD URBAN AFFAIRS CENTER
 An online data and consulting resource of THE JACK FORD URBAN AFFAIRS CENTER THE CENTER FOR GEOGRAPHIC INFORMATION SCIENCE AND APPLIED GEOGRAPHICS DEPARTMENT OF GEOGRAPHY AND PLANNING THE UNIVERSITY OF
15.0 Operations and Maintenance Cost Calculations
 15.0 Operations and Maintenance Cost Calculations 15.1 Introduction Operations and Maintenance (O&M) costs were calculated for each of the four alternatives being considered in the analysis. No Build Alternative
Opportunities to Strengthen Transit-Oriented Development through the New Starts Process
 Opportunities to Strengthen Transit-Oriented Development through the New Starts Process Congressional Testimony of Shelley Poticha, President Reconnecting America Presented before the Subcommittee on Highways
2010 Census Data Release and Current Geographic Programs. Michaellyn Garcia Geographer Seattle Regional Census Center
 2010 Census Data Release and Current Geographic Programs Michaellyn Garcia Geographer Seattle Regional Census Center 2010 Center of Population Located approximately 2.7 miles northeast of Plato, Missouri
California Urban Infill Trip Generation Study. Jim Daisa, P.E.
 California Urban Infill Trip Generation Study Jim Daisa, P.E. What We Did in the Study Develop trip generation rates for land uses in urban areas of California Establish a California urban land use trip
Get Over, and Beyond, the Half-Mile Circle (for Some Transit Options)
") Get Over, and Beyond, the Half-Mile Circle (for Some Transit Options) Arthur C. Nelson, Ph.D., FAICP Associate Dean for Research & Discovery College of Architecture, Planning and Landscape Architecture
Get Over, and Beyond, the Half-Mile Circle (for Some Transit Options) Arthur C. Nelson, Ph.D., FAICP Associate Dean for Research & Discovery College of Architecture, Planning and Landscape Architecture
Vibrancy and Property Performance of Major U.S. Employment Centers. Appendix A
 Appendix A DOWNTOWN VIBRANCY SCORES Atlanta 103.3 Minneapolis 152.8 Austin 112.3 Nashville 83.5 Baltimore 151.3 New Orleans 124.3 Birmingham 59.3 New York Midtown 448.6 Charlotte 94.1 Oakland 157.7 Chicago
Impact of Metropolitan-level Built Environment on Travel Behavior
 Impact of Metropolitan-level Built Environment on Travel Behavior Arefeh Nasri 1 and Lei Zhang 2,* 1. Graduate Research Assistant; 2. Assistant Professor (*Corresponding Author) Department of Civil and
Urban Planning Word Search Level 1
 Urban Planning Word Search Level 1 B C P U E C O S Y S T E M P A R E U O E U R B A N P L A N N E R T N S T D H E C O U N T Y G E R E R D W R E N I C I T Y C O U N C I L A A A S U G G C I L A G P R I R
Hillsborough County MPO Transit Study. Technical Team August 23, 2007
 Hillsborough County MPO Transit Study Technical Team August 23, 2007 Meeting Agenda Technology Choices Needs and Opportunities Transit Concepts Comparative Land Use Analysis Measures of Effectiveness System
Kitsap County 2016 Comprehensive Plan Update. Appendix A: Growth Estimates
 Kitsap County 2016 Comprehensive Plan Update Appendix A: Growth Estimates Appendix A 1 April 2016 Kitsap County 2016 Comprehensive Plan Update Appendix A: Growth Estimates Land Capacity Land capacity
The Elusive Connection between Density and Transit Use
 The Elusive Connection between Density and Transit Use Abstract: The connection between density and transportation is heralded by planners, yet results are often elusive. This paper analyzes two regions,
River North Multi-Modal Transit Analysis
 River North Multi-Modal Transit Analysis November 7, 2006 Dan Meyers, AICP URS Corporation 612-373-6446 / dan_meyers@urscorp.com River North Study Area Reasons for initiating the study Downtown areas north
Recovery Renewal Rebuilding
 Recovery Renewal Rebuilding Federal Reserve Foreclosure Series Washington, D.C. October 20, 2008 Mayor Jay Williams, Youngstown OH The City of Youngstown Youngstown State University Urban Strategies Inc.
Using the ACS to track the economic performance of U.S. inner cities
 Using the ACS to track the economic performance of U.S. inner cities 2017 ACS Data Users Conference May 11, 2017 Austin Nijhuis, Senior Research Analyst Initiative for a Competitive Inner (ICIC) ICIC ICIC
OREGON POPULATION FORECAST PROGRAM
 OREGON POPULATION FORECAST PROGRAM PROGRAM OVERVIEW BACKGROUND Beginning in 1973 with the passage of Senate Bill (SB) 100, Oregon s growth management system has relied on population forecasts as the primary
Regional Growth Strategy Regional TOD Advisory Committee
 Regional Strategy Regional TOD Advisory Committee September 21, 2018 Overview Regional Geographies Transit-Oriented Development Goal Scenarios Next Steps 2 Schedule + Process September 6 Management Policy
Trip Generation Model Development for Albany
 Trip Generation Model Development for Albany Hui (Clare) Yu Department for Planning and Infrastructure Email: hui.yu@dpi.wa.gov.au and Peter Lawrence Department for Planning and Infrastructure Email: lawrence.peter@dpi.wa.gov.au
Density and Walkable Communities
 Density and Walkable Communities Reid Ewing Professor & Chair City and Metropolitan Planning University of Utah ewing@arch.utah.edu Department of City & Metropolitan Planning, University of Utah MRC Research
ONE REGION: PLANNING FOR A STRONG AND JUST METROPOLIS. NYLON # 14: Regional Planning. October 31, 2018
 DRAFT ONE REGION: PLANNING FOR A STRONG AND JUST METROPOLIS NYLON # 14: Regional Planning October 31, 2018 Carolyn Grossman Meagher, Director, Regional Planning Division the New Yorker March 1976. A New
Jobs-Housing Fit: Linking Housing Affordability and Local Wages
 Jobs-Housing Fit: Linking Housing Affordability and Local Wages Alex Karner, PhD Assistant Professor School of City and Regional Planning Georgia Institute of Technology Chris Benner, PhD Dorothy E. Everett
Regional Transit Development Plan Strategic Corridors Analysis. Employment Access and Commuting Patterns Analysis. (Draft)
") Regional Transit Development Plan Strategic Corridors Analysis Employment Access and Commuting Patterns Analysis (Draft) April 2010 Contents 1.0 INTRODUCTION... 4 1.1 Overview and Data Sources... 4 1.2
Regional Transit Development Plan Strategic Corridors Analysis Employment Access and Commuting Patterns Analysis (Draft) April 2010 Contents 1.0 INTRODUCTION... 4 1.1 Overview and Data Sources... 4 1.2
MULTIPLE CHOICE. Choose the one alternative that best completes the statement or answers the question.
 AP Test 13 Review Name MULTIPLE CHOICE. Choose the one alternative that best completes the statement or answers the question. 1) Compared to the United States, poor families in European cities are more
The Attractive Side of Corpus Christi: A Study of the City s Downtown Economic Growth
 The Attractive Side of Corpus Christi: A Study of the City s Downtown Economic Growth GISC PROJECT DR. LUCY HUANG SPRING 2012 DIONNE BRYANT Introduction Background As a GIS Intern working with the City
ADDRESSING TITLE VI AND ENVIRONMENTAL JUSTICE IN LONG-RANGE TRANSPORTATION PLANS
 ADDRESSING TITLE VI AND ENVIRONMENTAL JUSTICE IN LONG-RANGE TRANSPORTATION PLANS Activities from the National Capital Region Transportation Planning Board Sergio Ritacco Transportation Planner 2017 Association
Location Suitability Analysis
 2010 Fall 406 Final Project Location Suitability Analysis New Burger stores in San Fernando Valley Presenter: Rich Lee I. Introduction In-N-Out Burger is famous in South West America. Established in 1948
Leveraging Urban Mobility Strategies to Improve Accessibility and Productivity of Cities
 Leveraging Urban Mobility Strategies to Improve Accessibility and Productivity of Cities Aiga Stokenberga World Bank GPSC African Regional Workshop May 15, 2018 Roadmap 1. Africa s urbanization and its
CERTIFIED RESOLUTION. introduction: and dated May 29, 2017, as attached, as appropriate
 15322 Buena Vista Avenue, White Rock BC, Canada V4B 1Y6 www.whiterockcity.ca City of White Rock P: 604.541.22121 F: 604.541.9348 /2tC% City Clerk s Office IT E ROC K June 13,2017 Stephanie Lam, Deputy
Chao Liu, Ting Ma, and Sevgi Erdogan National Center for Smart Growth Research & Education (NCSG) University of Maryland, College Park
 University of Maryland, College Park") Chao Liu, Ting Ma, and Sevgi Erdogan National Center for Smart Growth Research & Education (NCSG) University of Maryland, College Park 2015 GIS in Transit, September 1-3, 2015 Shared-use Vehicle Services
Chao Liu, Ting Ma, and Sevgi Erdogan National Center for Smart Growth Research & Education (NCSG) University of Maryland, College Park 2015 GIS in Transit, September 1-3, 2015 Shared-use Vehicle Services
Transferability of Household Travel Data Across Geographic Areas Using NHTS 2001
 Transferability of Household Travel Data Across Geographic Areas Using NHTS 2001 Jane Lin PhD Assistant Professor Department of Civil and Materials Engineering Institute for Environmental Science and Policy
Demographic Data in ArcGIS. Harry J. Moore IV
 Demographic Data in ArcGIS Harry J. Moore IV Outline What is demographic data? Esri Demographic data - Real world examples with GIS - Redistricting - Emergency Preparedness - Economic Development Next
King City URA 6D Concept Plan
 King City URA 6D Concept Plan King City s Evolution Among the fastest growing cities 2000 Census 1,949 2010 Census 3,111 60% increase 2016 Census estimate 3,817 23% increase Average annual rate 4.3% Surpassing
Encapsulating Urban Traffic Rhythms into Road Networks
 Encapsulating Urban Traffic Rhythms into Road Networks Junjie Wang +, Dong Wei +, Kun He, Hang Gong, Pu Wang * School of Traffic and Transportation Engineering, Central South University, Changsha, Hunan,
The Use of Geographic Information Systems (GIS) by Local Governments. Giving municipal decision-makers the power to make better decisions
 by Local Governments. Giving municipal decision-makers the power to make better decisions") The Use of Geographic Information Systems (GIS) by Local Governments Giving municipal decision-makers the power to make better decisions Case Study: Examples of GIS Usage by Local Governments in North
The Use of Geographic Information Systems (GIS) by Local Governments Giving municipal decision-makers the power to make better decisions Case Study: Examples of GIS Usage by Local Governments in North
The CRP stresses a number of factors that point to both our changing demographics and our future opportunities with recommendations for:
 Plan Overview The CRP represents the first broad planning initiative covering Lake, Porter and LaPorte counties. Unlike previous plans released by NIRPC, which focused primarily on transportation, the
The 3V Approach. Transforming the Urban Space through Transit Oriented Development. Gerald Ollivier Transport Cluster Leader World Bank Hub Singapore
 Transforming the Urban Space through Transit Oriented Development The 3V Approach Gerald Ollivier Transport Cluster Leader World Bank Hub Singapore MDTF on Sustainable Urbanization The China-World Bank
Lee County, Alabama 2015 Forecast Report Population, Housing and Commercial Demand
 Lee County, Alabama 2015 Forecast Report Population, Housing and Commercial Demand Thank you for purchasing this report, which contains forecasts of population growth, housing demand and demand for commercial
Understanding China Census Data with GIS By Shuming Bao and Susan Haynie China Data Center, University of Michigan
 Understanding China Census Data with GIS By Shuming Bao and Susan Haynie China Data Center, University of Michigan The Census data for China provides comprehensive demographic and business information
REO 100% Leased Four (4) Unit Mixed-Use Property Along Ashland
 Unit Mixed-Use Property Along Ashland") 5015 SOUTH ASHLAND AVENUE CHICAGO, IL 60609 DETAILS Sale Price $119,000 Lot Size 0.06 Acres Building Size 3,784 SF Occupancy 100% Year Built 1893 Market Cook County Sub Market South Chicago Cross Streets
5015 SOUTH ASHLAND AVENUE CHICAGO, IL 60609 DETAILS Sale Price $119,000 Lot Size 0.06 Acres Building Size 3,784 SF Occupancy 100% Year Built 1893 Market Cook County Sub Market South Chicago Cross Streets
Use of US Census Data for Transportation Modeling and Planning
 Use of US Census Data for Transportation Modeling and Planning Yongqiang Wu, P.E. CTS Engineering, Inc. Southeast Florida FSUTMS User Group Meeting September 14, 2018 Outline Overview of Census Products
Geographic Systems and Analysis
 Geographic Systems and Analysis New York University Robert F. Wagner Graduate School of Public Service Instructor Stephanie Rosoff Contact: stephanie.rosoff@nyu.edu Office hours: Mondays by appointment
Access Across America: Transit 2017
 Access Across America: Transit 2017 Final Report Prepared by: Andrew Owen Brendan Murphy Accessibility Observatory Center for Transportation Studies University of Minnesota CTS 18-12 1. Report No. CTS
PALS: Neighborhood Identification, City of Frederick, Maryland. David Boston Razia Choudhry Chris Davis Under the supervision of Chao Liu
 PALS: Neighborhood Identification, City of Frederick, Maryland David Boston Razia Choudhry Chris Davis Under the supervision of Chao Liu University of Maryland School of Architecture, Planning & Preservation
2040 MTP and CTP Socioeconomic Data
 SE Data 6-1 24 MTP and CTP Socioeconomic Data Purpose of Socioeconomic Data The socioeconomic data (SE Data) shows the location of the population and employment, median household income and other demographic
APPENDIX C-3 Equitable Target Areas (ETA) Technical Analysis Methodology
 Technical Analysis Methodology") APPENDIX C-3 Equitable Target Areas (ETA) Technical Analysis Methodology Contents Introduction... 1 ETA Index Methodology... 1 ETA Index Development... 1 Other EJ Measures... 4 The Limited English Proficiency
APPENDIX C-3 Equitable Target Areas (ETA) Technical Analysis Methodology Contents Introduction... 1 ETA Index Methodology... 1 ETA Index Development... 1 Other EJ Measures... 4 The Limited English Proficiency
Demographic Data. How to get it and how to use it (with caution) By Amber Keller
 By Amber Keller") Demographic Data How to get it and how to use it (with caution) By Amber Keller 101 Where does it come from? o The American Community Survey o Socio-economic characteristics of a population o Administered
Demographic Data How to get it and how to use it (with caution) By Amber Keller 101 Where does it come from? o The American Community Survey o Socio-economic characteristics of a population o Administered
2/25/2019. Taking the northern and southern hemispheres together, on average the world s population lives 24 degrees from the equator.
 Where is the world s population? Roughly 88 percent of the world s population lives in the Northern Hemisphere, with about half north of 27 degrees north Taking the northern and southern hemispheres together,
The Role of Transitways in Our Region s Economic Competitiveness. The 23rd CTS Annual Research Conference St. Paul, MN May 23, 2012
 The Role of Transitways in Our Region s Economic Competitiveness The 23rd CTS Annual Research Conference St. Paul, MN May 23, 2012 1 2 Twin Cities Competitive Clusters 3 Competitive Clusters interconnected
Demographic Change Near Rail Stations
 4/10/2015 Demographic Change Near Rail Stations University of North Carolina at Chapel Hill Department of City and Regional Planning TABLE OF CONTENTS Introduction... 3 1. Literature Review... 3 2. Methodology...
Land Use Advisory Committee. Updating the Transit Market Areas
 Land Use Advisory Committee Updating the Transit Market Areas March 20, 2014 Agenda Transit Market Areas Purpose of Transit Market Areas Transit Market Index Current Market Area boundaries Updating the
John Thomas & Lori Zeller US Environmental Protection Agency Office of Sustainable Communities. Rich Kuzmyak & Alex Bell Renaissance Planning Group
 Transportation Research Board ADD30 - Transportation and Land Development Committee Methods to Better Account for Land Use in Planning Multimodal Transportation Systems and Sustainable Communities Moderator:
T H E E C O N O M Y A N D M U LT I F A M I LY M A R K E T S J U N E
 T H E E C O N O M Y A N D M U LT I F A M I LY M A R K E T S IN THE WASHINGTON METRO AREA J U N E 2 0 1 5 A G E N DA 1. National and Regional Economy 2. Demographic Shifts Impact Multifamily Design 3. Washington