Nokomis Neighborhood Circulator. Feasibility Study
|
|
|
- Alicia Jordan
- 5 years ago
- Views:
Transcription
1 Nokomis Neighborhood Circulator Feasibility Study Prepared by Natalie Ross Graduate Research Assistant, University of Minnesota Conducted on behalf of the Nokomis East Neighborhood Association May, 2005 This report (NPCR 1221) is also available on the CURA website:
2 September, 2005 Neighborhood Planning for Community Revitalization (NPCR) supported the work of the author of this work, but has not reviewed it for publication. The content is solely the responsibility of the author and is not necessarily endorsed by NPCR. NPCR is coordinated by the Center for Urban and Regional Affairs at the University of Minnesota. NPCR is supported by grants from The Minneapolis Foundation, the McKnight Foundation, The Bremer Foundation, and The St. Paul Travelers Foundation. Neighborhood Planning for Community Revitalization 330 Hubert H. Humphrey Center th Avenue South Minneapolis, MN phone: 612/ website:
3 Nokomis Neighborhood Circulator Feasibility Study Natalie Ross May,
4 Executive Summery The Nokomis East Neighborhood Association (NENA) is interested in creating a new bus service in the area bounded by Lake Nokomis, Minnehaha Creek, The Hiawatha LRT line and Highway 62. Within this area, a neighborhood circulator is envisioned to connect Nokomis residents with local business as well as the Hiawatha LRT. Though the service would try to cater to the transit reliant populations, it also is aimed at increasing public transit ridership of all residents to help reduce traffic congestion as well as build community. Various methods are used in this paper to assess the feasibility and service options for a Neighborhood Circulator in the Nokomis East Neighborhood. Several similar bus services are addressed in the Peer Comparison section, where cities such as Orlando and Atlanta s service design characteristics are assess as to their relevance to Nokomis East. Demographic analysis is also employed to assess what type of ridership to expect from a Neighborhood Circulator service. Specific demographics such as elderly population, non-elderly low income population, zero and one car households and percentage of persons with disabilities were helpful in determining transit dependant populations which are more likely to ride a public bus. To put the demographics into perspective, Metro Transit s Market Area Standards were used to suggest what type of service our area should have (including type of bus, frequency of service, number of stops, etc.). Finally, a neighborhood survey was conducted to assess current transit use as well as opinion on a new bus, and which locations residents would be interested in going to. The results were graphically represented to find patterns in responses. The survey was intended to help develop a bus route through respondents preferences in circulator destinations, and these responses were mapped as well. From all this analysis, a better picture of the neighborhood s transit statistics can be made. We can see where the transit dependant populations reside, what destinations are most attractive to residents, as well as how residents currently use public transit. From this analysis, a more detailed marketing strategy for the Neighborhood Circulator can be created, as well as an efficient route. 1
5 Introduction Many transit-related changes have taken place in Minneapolis over the last few years, including the implementation of the Hiawatha Light Rail line, Bus system restructuring, and an eye opening strike in Though downtown has most noticeably felt the effects of transit development, many Minneapolis neighborhoods are also dealing with the new changes. In the study area of the Nokomis East neighborhood, four buses have been either restructured or replaced, two light rail stops were built, and a number of transit related issues and opportunities have arisen. In the following report, some alternative transit issues and opportunities will be discussed, with a focus on a proposed neighborhood mini-bus route which would better connect citizens with the Hiawatha LRT as well as local business and employers. Study Area Nokomis East is a southeast Minneapolis community made up of approximately 15,000 people. Nokomis East is bounded by four strong physical borders which have an effect of making the area distinct from other neighborhoods, and helpful in isolating transit activity and data for research purposes. These boarders include Minnehaha Park and the Mississippi River to the East; the Cross-town Highway/ Airport to the South, Lake Nokomis/ Cedar Avenue to the west and Minnehaha Parkway to the North. There is a small, but distinct commercial area as well as dispersed commercial uses in other areas. The majority of housing in the neighborhood is single family, with a number of high density buildings and a limited amount of other rental housing. Most employment is outside the neighborhood (see figure 1). Though the neighborhood is fairly quiet and residential, there have been concerns of increased traffic near commercial areas as well as surrounding the light rail station on 50 th Street. Combined with observed low ridership of the numbers 19, 27 and 515 busses, it seems that alternative transportation options are not being fully utilized in the area, and perhaps a more convenient and frequent bus would better serve the community. Similar sentiments are shared by other metropolitan communities such as Lakewood, a suburb of Denver which is looking to shuffle people around the suburbs instead of the current 2

6 Figure 1 3
7 approach of shuttling them to and from downtown Denver. 1 This approach decreases traffic, and increases the ease of frequenting local business, instead of driving out of the area. With a well used neighborhood bus route in place, local citizens would be more likely to promote local business growth in the areas that are convenient and easy to get to. The idea of a neighborhood bus could be useful in getting people out of their cars when they are only making short trips that are outside of walking distance. This could include trips to the grocery store, visiting the local beach on Lake Nokomis, catching a ride to the light rail or a night of bowling at Skylane Bowling Center. Some good candidates for these types of trips could be elderly citizens who wish to be more independently mobile as well as one car households who need more transportation flexibility. Background Research To begin researching the feasibility of a neighborhood bus line for the Nokomis East area, the project team (two NENA staff members, a NENA Board Member, and the research assistant) first looked at a general research framework used for bus route development. The Community Transportation Association of America published a number of community guides for transit planning strategies. One particular document, titled Getting Started, urged the importance of creating a vision statement through local transit coalitions who would identify local stakeholders for the project as well as developing a service policy. 2 Because the purpose of this research project was to determine the feasibility and a possible route of a neighborhood bus line, the more detailed planning of a vision statement and service policy was beyond the scope of this study. With regard to the service and route design, the document titled Developing, Designing and Delivering Community Transportation Services names three important steps for analyzing bus transit needs. First Peer Comparisons (examples of implemented neighborhood bus lines) can be researched and evaluated for potential problems and possibilities towards the development of our own line. Second, the analysis of demographics and demographic models as well as service area geography are noted as important predicting factors of ridership as well as a way to structure routes. 3 Some predicting demographics noted in the article were total population, elderly population, non-elderly, low income population, zero and one car families and persons 4
8 with disabilities. Finally, community interviewing and surveying are noted as a good way to gain knowledge of demographic base and public opinion about bus transit possibilities. Interest groups, community leaders and specific target populations are suggested interview and survey subjects. 4 Peer Comparisons Several examples of neighborhood bus routes exist throughout the country. With each example, the planning process, demographic collection and routing are all very much determined by the geographic location and urban context of each bus. Studies range from small towns, to suburbs and city centers. The circulator studies included in this report as peer comparisons were not all coming from communities exactly like Nokomis East. Instead, the studies were selected for their similarity to Nokomis East in scale as well as having the characteristic of connecting residential and commercial areas. Each study focused on a different aspect of the circulator planning and evaluation process, ranging from discussing the initial reasons for implementing a circulator to observations on how well it was used in its beginnings stages and who ended up using it. Below, six circulator studies from around the country are summarized with regard to their relevance to the prospective Nokomis East circulator proposal. Gwinnett County The first peer comparison looked at was Georgia s Transit Circulator Study, written within the larger research of the Gwinnett County Livable Center Initiative Project. This study was not site specific, but focused on the Atlanta region and the possible uses of circulator-type transit. Because the study is based on creating more livable communities, the initial motivations for creating the study are relevant to NENA s circulator goals. Gwinnett s study was born out of a desire to solve congestion problems, but also stated a goal to strengthen the link between transit and communities by improving personal mobility, and transportation system performance [by] linking as many major trip generators within the activity center as feasible. 5 Some of these trip generators include high density residential, workplaces, shopping, commercial and civic/ cultural/ community destinations. 6 The idea for the Nokomis East circulator began with similar goals in mind, specifically to reduce congestion and increase the connections between residents and local business. 5
9 The Gwinnett County Transit Circulator Study defined a circulator as: A type of transit service designed to complement the local transit network by featuring specialized services to smaller markets. Circulators are most often designed to supplement or substitute for [major arterial bus transit lines], where these routes may be impractical due to street patterns, building access, densities, or operating cost. Most circulator services are designed to connect to one or more transit centers where customers can transfer to local and regional transit services. 7 This definition puts the circulator bus at the center of possible solutions for congestion problems as well as a way to connect residential and local commercial areas. Gwinnett County Transit decided on implementing a circulator system in four phases within a 20 year time frame. To monitor use and begin building funding, Gwinnett plans to start the first 5 years with a vanpool service for local employees within the study area. Year 5 to 10 would begin the initial circulator service with high frequencies within a small trip area, still focusing on employee trips and high density commercial areas. The next phase would add circulator routes that connected with high density residential, and in the last 5 years, the routes would become fixed guideways. 8 With these types of routes they hope to target office-to-lunch, home-to-office, and home-to-recreational trips. Through developing transit connections as well as renewing transit facilities (sidewalks, buss stops, transfer centers, etc.), Gwinnett County Transit hopes to create a catalyst for strengthening livability and sustainability. This more holistic way of managing must involve citizens, businesses, employers and government officials to have success. Roseville Roseville, a mid-sized city just north of Sacramento, was another relevant peer comparison. It has a population of about 90,000, which is comparable to Nokomis East s 15,000. The study focused on development purposes and strategies. Roseville s Short Range Transit Plan frames the circulator in the category of local route services and contains elements of dial-a-ride services (frequently referred to as Para-transit). The implementation and improvement of these services are spurred by local officials and the general public s desire to expand the broad public transit options of larger cities to Roseville s local residents. 9 This goal comes under the assumption that the city will continue growing in size and economic stature so that transit demand will grow respectively. Ultimately, citizens want an increase in connectivity, and an increase in bus 6
10 frequency. This is the strength of circulator-type transit, which has the capability to run shorter and more frequent routes on minor roads and non-arterial streets. Within Roseville s service plan proposal several short range, circulator-type services are applicable to the Nokomis East neighborhood circulator study. One idea is to constrict the circulator s operating hours, eliminating some low ridership night and evening times (after 6 pm on weekdays), and instead provide evening dial-a-ride services. This frees money for more needed services, and still allows for flexibility. Another proposal is on-demand service for specific areas not served by Roseville Transit. Ondemand service provides limited fixed routes with established on-demand hotspots which can deviate within half a mile of the fixed route. The advantages for this service are its higher frequency of 30 minutes, and the reduction of more expensive dial-a-ride services. 10 These proposals could be helpful in designing Nokomis East s routing strategy to accommodate demand in the most efficient manner. Orlando One particular study that could be helpful in determining a routing strategy was the East-West Circulator Study for downtown Orlando. The study set out to establish criteria with which to evaluate potential routes within a decided circulator area. Possible routes ranged from 1.5 to 3 miles in length, and could be either a one-way loop or a straight route that backtracked to its origin. Most routes would run weekdays from 6:00 AM to 12:00 PM, Saturdays from 10:00 AM to 12:00 PM, and Sundays 10:00 AM to 10:00 PM. There are planned 5-10 minute headways during the week and minute headways on the weekend. The proposed circulator was meant for short term implementation as a pilot bus, and the decided route would be evaluated and realigned as needed after a given time. 11 Evaluation criteria of these route alternatives consider qualitative and quantitative characteristics while maximizing services and minimizing costs. The first criterion measures how well each route serves major trip generators, including commercial, community and residential complexes. Direct access to a high number of destinations would create the best score. The ease of use and understanding for potential riders is also an important criterion, pointing out that simple two-way routes are easier to understand and use because the bus can be picked up at the same place it drops off. This 7
11 is opposed to one-way loops which can be complicated to decipher. A solid connection to residential areas is also deemed important, including home to work, and home to shopping/ leisure trips. A more complicated criterion is a measure of minimizing traffic impacts, in which highly congested intersections must be identified, and the effect of the route on that intersection evaluated. The study used an equation of the linear miles of roadway and number of congested intersections impacted by each alternate route to determine this score. Finally, operating and capital costs are taken into account, based on a number of characteristics that are outside the scope of the NENA study. 12 After evaluating each alternative route the study team decided on a two-way route with the highest score for ease or use, fewest impacts on the most congested intersections, and required the lowest combined capital and operating costs. These criteria could easily be adjusted for the Nokomis East Neighborhood Circulator and used to come to consensus on a particular route. More research would be needed to determine capital and operational costs as well as traffic impacts at given intersections. Baltimore/ Seattle Of course, busses are not the only mode of circulator transit. Many cities are beginning to utilize streetcars as a way to connect residential and commercial areas as well as to feed light rail and facilitate shorter trips. Both Baltimore and Seattle have chosen to use rail circulators to foster redevelopment and provide a link to the larger transportation system. In the case of Baltimore, street cars were an ideal option to provide circulator functions because of the structure of the city (in particular the Charles Street Corridor on which the study focuses). The narrow streets and lack of parking in high density commercial and residential areas are not well suited to high volumes of traffic. Implementing a street car also frees more parking spaces where a bus would need room to pull up to the curb. 13 Another factor sited in both Baltimore s Charles Street Circulator Feasibility Study and the City of Seattle s Center City Circulator Report was the complaint of citizens about the noise level of frequent busses. Many people commented that the noise and exhaust were unacceptable pollutions, so the cities were willing to find funding to install more extensive infrastructure to accommodate street car lines. 14 8
12 Community Oriented Transit Examples NENA is not in a position to implement a streetcar line, but there have been a number of complaints about the noise and pollution produced by the busses that do pass through the neighborhood. To take these concerns into account when implementing a circulator, NENA may consider the streetcar s useful characteristics as well as other transit options such as vanpools, shared ride taxis or Jitneys. One helpful source for alternative transit options is a study done by the Alameda-Contra Costa Transit District in California titled Community Oriented Transit Best Practices. This paper featured six examples of community based transit that were deemed best by the following criteria: -Matching services to market needs, -Customer service and community orientation, -Maintaining a cost-effective cost per passenger, -Collaborative partnerships to leverage resources and engender local ownership, Integration with - regional transit service backbone, -Flexibility to meet needs, and -An entrepreneurial management with the leadership of a key person. 15 PRTC OmniLink Of the six best examples, two were most relevant to the NENA study area. First, the Potomac and Rappahannock Transportation Commission of Virginia created a route deviation service in the early 1990 s to give more accessibility to an area of lower public transit demand. The service accommodates an area in which a fixed route would not be cost effective, but where there is still a significant demand for public transit options. Most trips are made during the week as employment trips to Washington DC. Although the types of trips made in this region are quite different from the predicted trips made by the Nokomis East circulator, the type of service and transit technology are relevant. The PRTC OmniLink received a grant from the Federal Transit Administration to test an Intelligent Transportation System. This technology grant gave the bus service a computer automated way to track and respond to clients in a route deviation system quickly and efficiently. Computer screens show the driver the exact deviated route to the client, and can book up to 2 hours before pickup time (compared to a mandatory 24 hour notice prior to its implementation). 16 This system is also applicable to a pilot circulator in that the route can be readjusted in accordance with demand if deviations are concentrated in particular locations. And because ridership information is automatically stored in a database, it lends itself to more convenient analysis. A grant would be necessary to make 9
13 this type of bus technology affordable, but if implemented correctly it could be much more effective than a fixed route. Menlo Park Midday The last peer comparison looked at in this paper is the Menlo Park Community Service Route located in the Bay Area. This bus service, one of the Best Practice routes included in the Community Oriented Transit Study, was designed to serve the needs of elderly communities of Menlo Park. Services are focused on destination locations such as community centers, grocery stores, downtown commercial areas, medical centers and senior housing. The Nokomis East Neighborhood also has a large elderly population whom are likely to be some of the most frequent users of a circulator service. Therefore the Menlo Park Community Service route is an excellent example to study. Customer service is stressed in the Menlo Park Midday, with bus drivers trained to help passengers with packages as well as being generally patient and directive. The headways are one hour apart, coming at the same time every hour which is easy to remember and use. Although service at one time had extended hours from early morning to evening, they have been reduced down to 9:30 am to 3:30 pm, based on demand. The service is slow and accommodating, so that seniors can be helped and given time to get on and off the bus. Another important aspect of this circulator route is that it connects with an important transit hub in Menlo Park. This gives an area with less accessible street patterns accessibility to the greater transit network in the area. 17 As can be seen from the above examples, there are a number of options available for alternative community based transit. None of the studies exactly replicates the geographic and demographic makeup of the Nokomis East Neighborhood, but when several related studies are looked at together, several possible solutions could be derived. To make a more decisive conclusion about what type of service or routing to implement, more information needs to be taken into account. In the following pages demographic information as well as current neighborhood survey data will be analyzed to give a more complete picture of the possibilities for circulator implementation. 10
14 Demographics There are numerous ways to approach demographics as indicators of potential transit needs or wants. It would be a simple task to determine what type of transit service would be suitable for a given neighborhood if rigid standard rules existed; but they do not. Instead there exist many different guidelines that vary from place to place. The project team used these guidelines to frame our own observations and interpretations of the demographics found in the Nokomis neighborhood, and have also looked in more detail at certain demographics that were mentioned in many publications as being indicative of transit ridership. To begin our demographic inquiry, some general elements common to functional public transit were investigated. The Gwinnett County Livable Center Initiative Project outlined some of these common elements that were found in successful circulators. Most importantly, there must be a dense enough population to sustain the proposed type of transit. A sufficient percentage of the population must also be transitdependant. Groups such as senior citizens, moderate to low income riders, and households with two workers and one car were listed as transit-dependant. A circulator should also have connections to larger transit networks as well as mixed use settings and special amenities. The Gwinnett County Project also outlined the optimum operating characteristics to get the highest ridership. Those include short headways (15 min), convenience comparable to a car, low fares, and special equipment features such as handicap accessibility. With regard to routedesign, it was suggested that the best balance between maximum connectivity and minimum resources be found, and that bus stops serve multiple neighborhood destinations. 18 Many of these elements can be found in the Nokomis East neighborhood. The Hiawatha Light Rail would connect with all potential circulator routes, providing easy access to downtown as well as several transit hubs for rail and bus. Minnehaha Park, Minnehaha Creek, and Lake Nokomis all are great amenities that could be served by the proposed circulator. The makeup of the neighborhood is mixed in nature, made up of residential, commercial and recreational land use (see Figure 1), and is compact enough so that most stops in the center as well as on the perimeter of the neighborhood would serve multiple destinations. 11
15 More specific guidelines come through demographics related to transit dependant populations. Many publications offer similar demographic suggestions to assess the potential ridership of a neighborhood or community. The Rural Transit Assistance Program recommended looking at total population, elderly population, non-elderly low income population, zero and one car households, and percentage of persons with disabilities. 19 In the Bus Routing and Coverage section of the Transit Cooperative Research Program Report 95, these demographic recommendations were repeated, and several other transit indicators were also listed such as age group and education level. Annual household income was also included, but transit use numbers indicated that ridership is not linear and does not simply decline with the rise of income. Instead it suggests that low and high levels of income indicate potential ridership, not just those below poverty level. 20 Deciding which demographics to use required taking into account the type of service intended for the proposed circulator. Nokomis East is already served by 3 metro area busses, operating big bus/ regular route service. The demographics needed to support a neighborhood circulator are somewhat different than those needed to support big bus routes. Some of these indicators were though to be irrelevant to the circulators purpose of moving residents around the neighborhood to decrease traffic and increase connectivity, and were therefore not included in this study. Median income was not used for reasons listed in the previous paragraph, and job density numbers were not included because of lack of data. What we did use is listed below: -Land Use (Figure 1) -Population density by age group (Figure 2 and 3) -Number of vehicles per household (Figure 4) -Percentage of disabled population (Figure 5) -Education levels (Figure 6) -Ridership data from bus routes 19, 22, 15 and 7 (Figures 7-10) 12

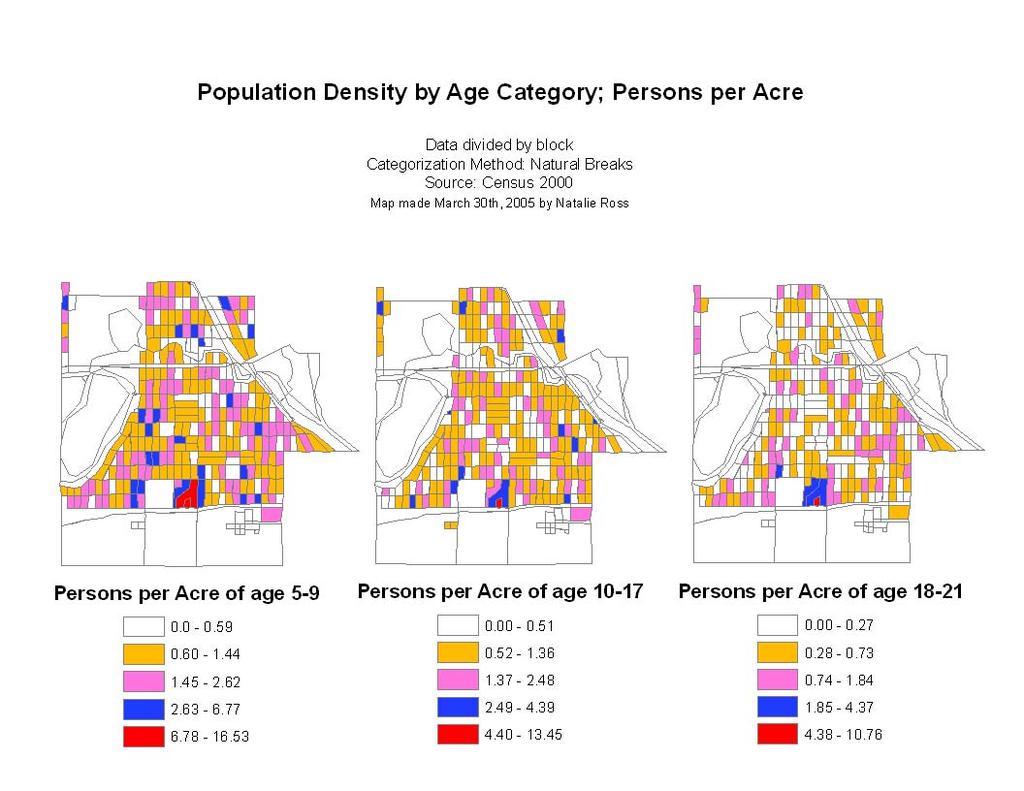
16 Figures 2 & 3 13

17 Figure 4 14


18 Figure 5 & 6 15
 16")
19 Figures 7 & 8 (see Appendices 1 & 2 for detailed tables) 16


20 Figures 9 & 10 (See Appendices 3 & 4 for detailed tables) 17
21 To put this demographic data into a meaningful framework, Metro Transit s wide research database was put to use. Through talking with senior transit planner John Dillery, some demographic standards for regional transit were found to put perspective on our market area. The metro transit standards break up transit areas into 4 categories (areas I, II, III and IV). Area I supports the most frequent and regular route service based on high population and job densities, large trip volumes and a concentration of transit dependant populations. At the other end, area IV has lower transit demand due to lower densities of the aforementioned characteristics, therefore its service is more sporadic and specialized. 21 The total population density of Nokomis East, (11.5 people per acre) falls into the Area II category ( people per acre), which is defined as having contiguous high transit dependency areas 22. Figures 2 and 3 break up the population densities into age brackets, based on the assumption that different age groups have different transit demands. The California DOT assigned the age-groups of 25-34, and 70 and over as having the highest potential demand 23. Figure 3 shows that the high density spots for both of these age groups are very concentrated in particular blocks. This could be particularly helpful in determining a rout. Other primary criteria that Metro Transit used in its market area standards included job density, trip volumes and patterns, and transit dependant populations. These criteria are not assigned specific thresholds to determine which market area a characteristic should belong. As mentioned earlier, employment density was left out because of the lack of data from Nokomis East. Transit patterns and dependant populations are not specifically defined either, so these characteristics can all be assumed to fall in line with Area II. Metro Transit suggests that the service provided in this area be primarily focused on big bus/ regular route service, and complimented by paratransit (which includes neighborhood circulators). So far the regular service is in place in Nokomis East, but we are still in need of more specialized paratransit. Further suggestions for Area II type transit have to do with specific spacing and service design standards such as route productivity. 24 Passenger numbers were calculated for Nokomis 18
22 East s previous bus routes before changes were made in 2003 for routes 7, 15, 19 and 22. According to John Dillery, a standard count for route productivity is passenger rides per month. Those numbers can be seen in ridership tables in Appendices 1-4. However, the passenger numbers listed in the Metro Transit included only regular route numbers, and listed paratransit as N/A for all areas. It seems that demographic models and service level predictions vary so much from place to place that it is hard to derive a transit plan from this information. If financially possible, it could be more informative to run a year-long pilot service, assessing ridership and user trends along the way. Although preliminary demographic inquiry gives a helpful framework to a market area, often a real world trial for a given service is the only real way to assess demand. Neighborhood Survey Methodology The third part of this study involved surveying neighborhood residents about their opinions regarding the implementation of a new circulator bus. Because both peer comparisons as well as demographics are very speculative in nature, surveying provides a more concrete and current look at the potential demand for a transit service. Surveying is a complex process, involving time, money and interpretive skill. To create a successful survey, one must take into account several factors including the wording of questions, sampling and distribution methods, etc. The North Central Regional Educational Library (NCREL) offers a few publications addressing survey development and questionnaire guidelines which we used to help structure our own survey. To begin with, every surveyor must start by questioning their purpose. In the case of Nokomis East s Circulator survey, we wanted to determine the extent to which residents saw themselves using the service. We were also interested in potential destinations that residents would most frequently go to, helping us to determine a routing scheme. More specific demographic questions could have also been helpful, but the additional questions would make the survey too long and complicated. NCREL s publication Guidelines for Survey Development explained that the more simple and concise a survey s questioning is, the better. They suggested using common words, and 19
23 asking short questions which were personal or factual. The Guidelines for Survey Development also warned against asking hypothetical questions, but because NENA was interested in opinions and potential interest in a non-existent service, hypothetical questions were hard to avoid. 25 The final survey gave a brief introduction of the neighborhood circulator project and a disclaimer as to the purpose of the survey. The 4 main questions were as follows: Q1. Do you currently take the bus to/from work? Please circle one a) Frequently b) Occasionally c) Seldom or never Q2. Which route do you most frequently use? Please circle one a)#19 b)# 27 c)#515 d)# 55 (bus) e)#55 (LRT) Q3. If your route were eliminated and replaced by a neighborhood route that would take you to the light rail, would you be: Please circle one a) very inconvenienced b) somewhat inconvenienced c) not affected Q4. How frequently do you currently use the light rail? Please circle one a) several times/ week b) several times/ month c) occasionally d) Seldom/ never Respondents were then given a neighborhood map divided into 14 sections and asked to locate the section in which they reside. Space was provided for further comments, and on the final page a list of 22 potential circulator destinations was presented in chart format, leaving space for the respondent to check how often they would use a circulator to get to that particular location (Never, Occasionally, or Frequently), and also what time of day they would ride. These questions focused quite narrowly on transit use history and potential circulator demand. Because the circulator service is designed to cater to a very general population in the neighborhood, no one area or pocket was singled out for sampling. Instead we conducted a random/ systematic sample of the area by numbering each block, and selecting 3 blocks from each section using the random numbers table. This ensured we were getting a random sample, but also getting an equal representation from each part of the neighborhood. It was also decided that a mail survey was most appropriate because of the large quantity of surveys we wanted to send. The questions were simple enough so that most people would not need to be led through the survey, and the timeline was such that responses were needed A.S.A.P. To ensure a high response rate, pre-paid postage was included with each survey, and a note asking recipients to return the completed 20
24 survey within 48 hours. This technique proved effective because we received nearly 40% of the surveys back (125 out of 340). The opportunity to survey again presented itself at NENA s Annual Neighborhood meeting, so this time the project team handed out surveys to everyone present (not just a random sample). This introduced some bias into the surveying procedure because people self select to come to the meeting, creating an unequal representation of the neighborhood. But it was decided that a higher number of responses was more important than a completely unbiased result, so 60 more surveys were returned at the meeting, giving us a total response of 185. The next step was to analyze the data for its potential use in determining demand as well as specifying route delineation. Analysis The first step we took in analysis was to create graphical representations of the data. Looking at data in raw chart form can be very daunting, especially if there is a lot of it. But if a data set has any spatial components (the neighborhood section ID s in our case), mapping can be a very helpful tool, showing spatial patterns or trends that would not be visible in raw data form. The information we were interested in seeing included those destinations most frequently chosen by respondents, and which origin section chose that destination most often. Additionally, we wanted to see the percentage of responses to each of the 4 questions asked on the first page of the survey, and how different those percentages were among the various sections of the neighborhood. Because responses from each section of the neighborhood were not equal, some had to be eliminated. Sections N and M, located below the cross town highway 62, together reported only 3 responses (compared to section F which received 28). Sections A and B were not surveyed in the first place because they are located outside the neighborhood boundaries, but were included in the survey map to house several potential destinations outside the neighborhood. Final analysis was only calculated for section C through L. Figure 11 shows the location and name of each destination point included in the survey. For a more complete chart of destination question results, see Appendix 5. Figures visualize the destination results in various ways. In Figure 12, the total responses to the question of How often would you ride a neighborhood bus to X 21
25 location were separated into the 3 options of Never, Occasionally, and Frequently. The greatest response for almost all destinations was Never, followed by Occasionally and only a few Frequentlys. In all, about 75% of the total responses to the destination question were Never, 15% Occasionally and 6% Frequently. Figure 13 and 14 show the total combined responses of Occasionally or Frequently for each section of the neighborhood. These maps gave a better graphical representation of where people did want to go, and how that differed between neighborhood sections. The data was not normalized (divided by a whole to create a percentage), so the sections with higher response rates have bigger circles for all destination points. Most of the positive responses were concentrated in the northern section of the neighborhood, above 54 th St. The 50 th street LRT station had many positive responses in most neighborhood sections along with businesses near 34 th / 50 th St., 46 th St. Walgreen s and Blockbuster, Nokomis Beach, and 54 th / 34 th Ave. businesses. Certain trends are visible in these maps, pointing out that destinations close to an origin section are often less popular, probably because they don t need transportation to get there. This is evident in section C s low response rate for Nokomis Beach, and section G s low response rate for Home Video/ Wellness Center and Morris Park. For more detailed information about survey results, see appendix 5. Another way of looking at this data is focusing on which origin sections most frequently chose certain locations. Figures isolate each destination which received at least 15 positive responses, and identify the origin sections with the highest response rate for that particular destination. The color gradient shows the highest responding sections in order, the darkest being the highest response. The sections were picked based on natural breaks in the data. Some destinations had 4 or 5 sections with high response rates while some only had 2. There seem to be no clear cut pattern in the relationship between destination, and origin section; sometimes the destination is located in the section with the highest response and other times the sections furthest from a destination point are most eager to get there. Combining this map and other demographic maps could also be interesting to see if there are demographic patterns that match up with certain destination groupings. 22
26 Figure 11 23
27 Figure 12 24

28 Figures 13 & 14 25

29 Figure 15 26
30 Figure 16 27
31 Figure 17 28
32 Figure 18 29
33 Figure 19 30
34 Mapping the results of the 4 questions on the first page of the survey was also successful in visualizing spatial patterns in the data. The numbers of responses for each question were normalized by the total number of responses to get a percentage for each possible answer, creating several maps for each question to compare together. There were very interesting spatial patterns in nearly every question, showing that people in different sections of the neighborhood used and thought of public transportation quite differently. Figure 20 shows the responses to the question, Do You Currently Take the Bus to or from Work? The majority of the responses (50-93%) were Seldom/ Never for all sections. However the largest percentage was in the south-western part of the neighborhood, while the largest percentage answering Frequently was from the northeast. One could come to two conclusions with these results, either the southwest is in great need of public transit and the northeast is already well served, or conversely that the southwest is not interested in using public transit and the northeast would be a better target for a circulator. In Figure 21, the question, Which Route do you Most Frequently Use was asked, showing a predictable result that the highest percentages for each route were located on or adjacent to that route. The entire neighborhood, however, all had very high percentages of respondents that used the Hiawatha LRT most frequently. These results point to two positive potentials for the implementation of a circulator, in that there will be default ridership on and around its route just because it is there, and that its convenient connection with the Hiawatha LRT will be attractive to most of the neighborhood. The most uniform response came from question 3, How Affected will you be if one of the Existing Routes is Changed or Eliminated and Replaced by a Neighborhood Circulator? % of all sections answered Not Affected, and the perimeter of the neighborhood was even higher, all above 75%. Although it is not in our power or interest to change any existing services, the fact that most people would not even be Somewhat Effected by a change in those services in an interesting fact. The last question, asking How Often do you Ride the LRT showed a similar patter to question 2; the closer you are the LRT, the more likely you are to ride it frequently. 31
35 Figure 20 32

36 Figure 21 33

37 Figure 22 34

38 Figure 23 35
39 Although from looking at the maps it would seem that there is a great diversity among neighborhood sections, we cannot always trust a map to tell us if results are statistically significant because of the various ways one can categorize graphical data. To determine if there really is a great difference in opinion between neighborhood sections, a statistical test was run to find significance levels in the differences between data for each answer from the 4 questions. A contingency analysis test was run on all the questions to find whether or not there is a relationship between responses to each question and their geographic location. If the resulting statistic is less than.05, then one can safely say that there is a significant relationship. The results of the Nokomis Survey data returned extremity small numbers, averaging 1.0E-20. Although this test doesn t give us any specific insight into Nokomis East s potential demand for transit service or its current transit use, it does tell us that the conclusions we come up with based on the maps of questions 1-4 are rooted in a data set with statistically significant geographic patterning. Conclusion The combination of peer comparison, demographic analysis and neighborhood surveying gives us a solid picture of the type of demand we might predict for the Nokomis East Community. Several options for a neighborhood circulator were discussed, including route deviation, limited hour test services and various other pilot programs. The information found in the demographic and survey sections of this report were aimed at providing a more complete picture of Nokomis East s population and their potential for transit demand. However, a perfect service or routing scheme cannot be derived from such speculative data. The trends shown through the neighborhood survey mirror trends of the entire country; that most people find their own cars to be more convenient than public transit. To curb problems such as traffic congestion, limited pedestrian space and a lack of parking, it is necessary to find a way to convince those non-transit dependant populations to use public transit. In the case of the proposed Nokomis Neighborhood Circulator, a greater determining factor than demographics is likely to be a high quality pilot program and aggressive marketing strategies. Public transit is not just for those in 36
40 need of mobility, but is also a means to develop community and create a safer and more efficient environment for everyone. 1 LeRoy Standish, Circulator Bus Idea Circulates. Regional Transportation District: West Corridor, March 14, 2002 (Accessed Feb. 22, 2005). 2 Rural Transit Assistance Program, Getting Started; Creating a Vision & Strategy. Community Transportation Association of America, 2001 (Accessed Feb. 3, 2005). 3 Rural Transit Assistance Program, Developing, Designing and Delivering Transportation Services. Community Transportation Association of America, 2001 (Accessed Feb. 3, 2005). 4 Rural Transit Assistance Program, Getting Started; Creating a Vision & Strategy. Community Transportation Association of America, 2001 (Accessed Feb. 3, 2005). 5 Manuel Padron & Associates, Gwinnett County Livable Center Initiative Project; Transit Circulator Study. Atlanta Regional Commission, Dec. 3, 2001 (Accessed Feb 22, 2005). 6 Manuel Padron & Associates, Gwinnett County Livable Center Initiative Project; Transit Circulator Study. Atlanta Regional Commission, Dec. 3, 2001 (Accessed Feb 22, 2005). 7 Manuel Padron & Associates, Gwinnett County Livable Center Initiative Project; Transit Circulator Study. Atlanta Regional Commission, Dec. 3, 2001 (Accessed Feb 22, 2005). 8 Manuel Padron & Associates, Gwinnett County Livable Center Initiative Project; Transit Circulator Study. Atlanta Regional Commission, Dec. 3, 2001 (Accessed Feb 22, 2005). 9 LSC Transportation Consultants, Inc., Roseville Transit Short Range Transit Plan. Placer County Transportation Planning Agency, Dec. 2, 2004 (Accessed Feb 22, 2005) LSC Transportation Consultants, Inc., Roseville Transit Short Range Transit Plan. Placer County Transportation Planning Agency, Dec. 2, 2004 (Accessed Feb 22, 2005) BRW, Inc., Final Downtown Orlando East-West Circulator Study. City of Orlando.net, Nov. 17, 2000 (Accessed March 30, 2005). t-west%20circulator%20study.pdf 12 BRW, Inc., Final Downtown Orlando East-West Circulator Study. City of Orlando.net, Nov. 17, 2000 (Accessed March 30, 2005). t-west%20circulator%20study.pdf 13 Kittelson & Associates, Inc. and Shiels Obletz Johnsen, Charles Street Circulator. Charles Street Development Corporation, 2004 (Accessed March 30, 2005) Seattle Department of Transportation, Center City Circulator Report. Seattle.Gov, Dec (Accessed March 30, 2005). Kittelson & Associates, Inc. and Shiels Obletz Johnsen, Charles Street Circulator. Charles Street Development Corporation, 2004 (Accessed March 30, 2005). 37
41 15 Eric Bruun, Ph.D in association with Alameda-Contra Costa Transit District, Community Oriented Transit; Best Practices. Cities 21 Transit Resource Center, Nov. 5, 2004 (Accessed April 14, 2005) Eric Bruun, Ph.D in association with Alameda-Contra Costa Transit District, Community Oriented Transit; Best Practices. Cities 21 Transit Resource Center, Nov. 5, 2004 (Accessed April 14, 2005) Eric Bruun, Ph.D in association with Alameda-Contra Costa Transit District, Community Oriented Transit; Best Practices. Cities 21 Transit Resource Center, Nov. 5, 2004 (Accessed April 14, 2005) Manuel Padron & Associates, Gwinnett County Livable Center Initiative Project; Transit Circulator Study. Atlanta Regional Commission, Dec. 3, 2001 (Accessed Feb 22, 2005) Rural Transit Assistance Program, Getting Started; Creating a Vision & Strategy. Community Transportation Association of America, 2001 (Accessed Feb. 3, 2005) Transit Cooperative Research Program, Bus Routing and Coverage. Federal Transit Administration, Jan (Accessed April 14, 2005) Minneapolis/ St. Paul Metropolitan Council, Appendix M; Regional Transit Standards Transportation Policy Plan, Dec. 15, 2004 (Accessed May 11, 2005) Minneapolis/ St. Paul Metropolitan Council, Appendix M; Regional Transit Standards Transportation Policy Plan, Dec. 15, 2004 (Accessed May 11, 2005) Business, Transportation and Housing Agency, An Analysis of Public Transportation to Attract Non- Traditional Transit Riders in California. California Department of Transportation, April 2003 (Accessed May 11, 2005) Minneapolis/ St. Paul Metropolitan Council, Appendix M; Regional Transit Standards Transportation Policy Plan, Dec. 15, 2004 (Accessed May 11, 2005) Learning Point Associates, Guidelines for Survey Development. North Central Regional Educational Library, 2004 (Accessed April 2, 2005) 38
Neighborhood Locations and Amenities
 University of Maryland School of Architecture, Planning and Preservation Fall, 2014 Neighborhood Locations and Amenities Authors: Cole Greene Jacob Johnson Maha Tariq Under the Supervision of: Dr. Chao
East Bay BRT. Planning for Bus Rapid Transit
 East Bay BRT Planning for Bus Rapid Transit Regional Vision Draper Prison The Bottleneck is a State-Level issue, Salt Lake County 2050 Population: 1.5M Draper Prison hopefully with some State-Level funding!
Appendixx C Travel Demand Model Development and Forecasting Lubbock Outer Route Study June 2014
 Appendix C Travel Demand Model Development and Forecasting Lubbock Outer Route Study June 2014 CONTENTS List of Figures-... 3 List of Tables... 4 Introduction... 1 Application of the Lubbock Travel Demand
BROOKINGS May
 Appendix 1. Technical Methodology This study combines detailed data on transit systems, demographics, and employment to determine the accessibility of jobs via transit within and across the country s 100
Forecasts for the Reston/Dulles Rail Corridor and Route 28 Corridor 2010 to 2050
 George Mason University Center for Regional Analysis Forecasts for the Reston/Dulles Rail Corridor and Route 28 Corridor 21 to 25 Prepared for the Fairfax County Department of Planning and Zoning Lisa
Data Collection. Lecture Notes in Transportation Systems Engineering. Prof. Tom V. Mathew. 1 Overview 1
 Data Collection Lecture Notes in Transportation Systems Engineering Prof. Tom V. Mathew Contents 1 Overview 1 2 Survey design 2 2.1 Information needed................................. 2 2.2 Study area.....................................
GIS Analysis of Crenshaw/LAX Line
 PDD 631 Geographic Information Systems for Public Policy, Planning & Development GIS Analysis of Crenshaw/LAX Line Biying Zhao 6679361256 Professor Barry Waite and Bonnie Shrewsbury May 12 th, 2015 Introduction
Typical information required from the data collection can be grouped into four categories, enumerated as below.
 Chapter 6 Data Collection 6.1 Overview The four-stage modeling, an important tool for forecasting future demand and performance of a transportation system, was developed for evaluating large-scale infrastructure
City of Hermosa Beach Beach Access and Parking Study. Submitted by. 600 Wilshire Blvd., Suite 1050 Los Angeles, CA
 City of Hermosa Beach Beach Access and Parking Study Submitted by 600 Wilshire Blvd., Suite 1050 Los Angeles, CA 90017 213.261.3050 January 2015 TABLE OF CONTENTS Introduction to the Beach Access and Parking
Mapping Accessibility Over Time
 Journal of Maps, 2006, 76-87 Mapping Accessibility Over Time AHMED EL-GENEIDY and DAVID LEVINSON University of Minnesota, 500 Pillsbury Drive S.E., Minneapolis, MN 55455, USA; geneidy@umn.edu (Received
Transit Time Shed Analyzing Accessibility to Employment and Services
 Transit Time Shed Analyzing Accessibility to Employment and Services presented by Ammar Naji, Liz Thompson and Abdulnaser Arafat Shimberg Center for Housing Studies at the University of Florida www.shimberg.ufl.edu
River North Multi-Modal Transit Analysis
 River North Multi-Modal Transit Analysis November 7, 2006 Dan Meyers, AICP URS Corporation 612-373-6446 / dan_meyers@urscorp.com River North Study Area Reasons for initiating the study Downtown areas north
Study Overview. the nassau hub study. The Nassau Hub
 Livable Communities through Sustainable Transportation the nassau hub study AlternativeS analysis / environmental impact statement The Nassau Hub Study Overview Nassau County has initiated the preparation
Figure 8.2a Variation of suburban character, transit access and pedestrian accessibility by TAZ label in the study area
 Figure 8.2a Variation of suburban character, transit access and pedestrian accessibility by TAZ label in the study area Figure 8.2b Variation of suburban character, commercial residential balance and mix
CERTIFIED RESOLUTION. introduction: and dated May 29, 2017, as attached, as appropriate
 15322 Buena Vista Avenue, White Rock BC, Canada V4B 1Y6 www.whiterockcity.ca City of White Rock P: 604.541.22121 F: 604.541.9348 /2tC% City Clerk s Office IT E ROC K June 13,2017 Stephanie Lam, Deputy
Monmouth County Adam Nassr (Partner: Brian Berkowitz, Ocean County)
") Monmouth County Adam Nassr (Partner: Brian Berkowitz, Ocean County) 1. County Summary Monmouth County, founded in 1675, is the northernmost county along the Jersey Shore in the state of New Jersey. It
Monmouth County Adam Nassr (Partner: Brian Berkowitz, Ocean County) 1. County Summary Monmouth County, founded in 1675, is the northernmost county along the Jersey Shore in the state of New Jersey. It
WOODRUFF ROAD CORRIDOR ORIGIN-DESTINATION ANALYSIS
 2018 WOODRUFF ROAD CORRIDOR ORIGIN-DESTINATION ANALYSIS Introduction Woodruff Road is the main road to and through the commercial area in Greenville, South Carolina. Businesses along the corridor have
Social Studies Grade 2 - Building a Society
 Social Studies Grade 2 - Building a Society Description The second grade curriculum provides students with a broad view of the political units around them, specifically their town, state, and country.
Forecasts from the Strategy Planning Model
 Forecasts from the Strategy Planning Model Appendix A A12.1 As reported in Chapter 4, we used the Greater Manchester Strategy Planning Model (SPM) to test our long-term transport strategy. A12.2 The origins
Environmental Analysis, Chapter 4 Consequences, and Mitigation
 Environmental Analysis, Chapter 4 4.17 Environmental Justice This section summarizes the potential impacts described in Chapter 3, Transportation Impacts and Mitigation, and other sections of Chapter 4,
Traffic Impact Study
 Traffic Impact Study Statham DRI One University Parkway Prepared for: Barrow County Prepared by: October 2012 Table of Contents Executive Summary i Section 1. Introduction 1 Project Description 1 Methodology
Alternatives Analysis
 Alternatives Analysis Prepared for: Metropolitan Atlanta Rapid Transit Authority Prepared by: AECOM/Jacobs-JJG Joint Venture Atlanta, GA November 2012 Page Left Intentionally Blank ii TABLE OF CONTENTS
Proposed Scope of Work Village of Farmingdale Downtown Farmingdale BOA Step 2 BOA Nomination Study / Draft Generic Environmental Impact Statement
 Proposed Scope of Work Village of Farmingdale Downtown Farmingdale BOA Step 2 BOA Nomination Study / Draft Generic Environmental Impact Statement The scope of work that follows incorporates and covers
Subject: Note on spatial issues in Urban South Africa From: Alain Bertaud Date: Oct 7, A. Spatial issues
 Page 1 of 6 Subject: Note on spatial issues in Urban South Africa From: Alain Bertaud Date: Oct 7, 2009 A. Spatial issues 1. Spatial issues and the South African economy Spatial concentration of economic
California Urban Infill Trip Generation Study. Jim Daisa, P.E.
 California Urban Infill Trip Generation Study Jim Daisa, P.E. What We Did in the Study Develop trip generation rates for land uses in urban areas of California Establish a California urban land use trip
CLAREMONT MASTER PLAN 2017: LAND USE COMMUNITY INPUT
 Planning and Development Department 14 North Street Claremont, New Hampshire 03743 Ph: (603) 542-7008 Fax: (603) 542-7033 Email: cityplanner@claremontnh.com www.claremontnh.com CLAREMONT MASTER PLAN 2017:
Local Economic Activity Around Rapid Transit Stations
 Local Economic Activity Around Rapid Transit Stations The Case of Chicago s Orange Line Julie Cooper, MPP 2014 Harris School of Public Policy Transport Chicago June 6, 2014 Motivation Impacts of transit
The 3V Approach. Transforming the Urban Space through Transit Oriented Development. Gerald Ollivier Transport Cluster Leader World Bank Hub Singapore
 Transforming the Urban Space through Transit Oriented Development The 3V Approach Gerald Ollivier Transport Cluster Leader World Bank Hub Singapore MDTF on Sustainable Urbanization The China-World Bank
Regional Transit Development Plan Strategic Corridors Analysis. Employment Access and Commuting Patterns Analysis. (Draft)
") Regional Transit Development Plan Strategic Corridors Analysis Employment Access and Commuting Patterns Analysis (Draft) April 2010 Contents 1.0 INTRODUCTION... 4 1.1 Overview and Data Sources... 4 1.2
Regional Transit Development Plan Strategic Corridors Analysis Employment Access and Commuting Patterns Analysis (Draft) April 2010 Contents 1.0 INTRODUCTION... 4 1.1 Overview and Data Sources... 4 1.2
Regional Growth Strategy Work Session Growth Management Policy Board
 Regional Growth Strategy Work Session Growth Management Policy Board September 6, 2018 1 Overview Recap June GMPB work session Objectives and outcomes Regional geographies Growth scenarios Breakout Discussion:
Land Use Advisory Committee. Updating the Transit Market Areas
 Land Use Advisory Committee Updating the Transit Market Areas March 20, 2014 Agenda Transit Market Areas Purpose of Transit Market Areas Transit Market Index Current Market Area boundaries Updating the
Committee Meeting November 6, 2018
 Committee Meeting November 6, 2018 Agenda Where we are in the process Land Use Plan Transportation Element Housing & Neighborhoods Elements Next Steps Schedule November 6: Plan Elements December: Plan
Recovery Renewal Rebuilding
 Recovery Renewal Rebuilding Federal Reserve Foreclosure Series Washington, D.C. October 20, 2008 Mayor Jay Williams, Youngstown OH The City of Youngstown Youngstown State University Urban Strategies Inc.
Transit Market Index. Validating Local Potential for Transit Ridership
 Transit Market Index Validating Local Potential for Transit Ridership Transit Market Areas Characteristics 2010 TPP Characterized by different levels of transit service. Core Areas, 1 & 2: A variety of
Density and Walkable Communities
 Density and Walkable Communities Reid Ewing Professor & Chair City and Metropolitan Planning University of Utah ewing@arch.utah.edu Department of City & Metropolitan Planning, University of Utah MRC Research
Regional Snapshot Series: Transportation and Transit. Commuting and Places of Work in the Fraser Valley Regional District
 Regional Snapshot Series: Transportation and Transit Commuting and Places of Work in the Fraser Valley Regional District TABLE OF CONTENTS Complete Communities Daily Trips Live/Work Ratio Commuting Local
Trip Generation Study: A 7-Eleven Gas Station with a Convenience Store Land Use Code: 945
 Trip Generation Study: A 7-Eleven Gas Station with a Convenience Store Land Use Code: 945 Introduction The Brigham Young University Institute of Transportation Engineers student chapter (BYU ITE) completed
Date: June 19, 2013 Meeting Date: July 5, Consideration of the City of Vancouver s Regional Context Statement
 Section E 1.5 To: From: Regional Planning and Agriculture Committee Lee-Ann Garnett, Senior Regional Planner Planning, Policy and Environment Department Date: June 19, 2013 Meeting Date: July 5, 2013 Subject:
Council Workshop on Neighbourhoods Thursday, October 4 th, :00 to 4:00 p.m. Burlington Performing Arts Centre
 Council Workshop on Neighbourhoods Thursday, October 4 th, 2012 1:00 to 4:00 p.m. Burlington Performing Arts Centre Agenda Introductions Warm-Up Exercise Presentation Exercise Neighbourhood Planning Break
Initial Findings from Regional Initiatives Planning Enhancement Fair Housing & Equity Assessment
 NEW YORK AND CONNECTICUT SUSTAINABLE COMMUNITIES Initial Findings from Regional Initiatives Planning Enhancement Fair Housing & Equity Assessment July 30, 2013 White Plains Library Federal grant to improve
Impressive Growth & Relaxed Elegance.
 Impressive Growth & Relaxed Elegance www.culpeperva.org About Culpeper Nestled between Charlottesville and the District of Columbia, Culpeper is a hub of commerce and culture proud to be home to a broad
Impact of Metropolitan-level Built Environment on Travel Behavior
 Impact of Metropolitan-level Built Environment on Travel Behavior Arefeh Nasri 1 and Lei Zhang 2,* 1. Graduate Research Assistant; 2. Assistant Professor (*Corresponding Author) Department of Civil and
Transit Service Gap Technical Documentation
 Transit Service Gap Technical Documentation Introduction This document is an accompaniment to the AllTransit TM transit gap methods document. It is a detailed explanation of the process used to develop
Note on Transportation and Urban Spatial Structure
 Note on Transportation and Urban Spatial Structure 1 By Alain Bertaud, Washington, ABCDE conference, April 2002 Email: duatreb@msn.com Web site: http://alain-bertaud.com/ http://alainbertaud.com/ The physical
METRO Blue Line LRT Extension (BLRT) 5514 West Broadway Avenue, Suite 200, Crystal, MN
 5514 West Broadway Avenue, Suite 200, Crystal, MN") Robbinsdale Open House July 28, 2015 *All comments are recorded verbatim from comment cards and discussion worksheets. No grammatical, word choice changes or spelling has been corrected. If handwriting
Robbinsdale Open House July 28, 2015 *All comments are recorded verbatim from comment cards and discussion worksheets. No grammatical, word choice changes or spelling has been corrected. If handwriting
New Partners for Smart Growth: Building Safe, Healthy, and Livable Communities Mayor Jay Williams, Youngstown OH
 New Partners for Smart Growth: Building Safe, Healthy, and Livable Communities Mayor Jay Williams, Youngstown OH The City of Youngstown Youngstown State University Urban Strategies Inc. Youngstown needed
Frequently Asked Questions
 What is the Regional Transit Engagement Series? As one of the fastest growing regions in the country, there is recognition that long-term transit planning efforts should be accelerated if we are to remain
Urban Planning Word Search Level 1
 Urban Planning Word Search Level 1 B C P U E C O S Y S T E M P A R E U O E U R B A N P L A N N E R T N S T D H E C O U N T Y G E R E R D W R E N I C I T Y C O U N C I L A A A S U G G C I L A G P R I R
15.0 Operations and Maintenance Cost Calculations
 15.0 Operations and Maintenance Cost Calculations 15.1 Introduction Operations and Maintenance (O&M) costs were calculated for each of the four alternatives being considered in the analysis. No Build Alternative
GIS Geographical Information Systems. GIS Management
 GIS Geographical Information Systems GIS Management Difficulties on establishing a GIS Funding GIS Determining Project Standards Data Gathering Map Development Recruiting GIS Professionals Educating Staff
Economic and Social Urban Indicators: A Spatial Decision Support System for Chicago Area Transportation Planning
 Economic and Social Urban Indicators: A Spatial Decision Support System for Chicago Area Transportation Planning Piyushimita Thakuriah (Vonu), P.S. Sriraj, Paul Metaxatos, Inshu Minocha & Tanushri Swarup
Managing Growth: Integrating Land Use & Transportation Planning
 Managing Growth: Integrating Land Use & Transportation Planning Metro Vancouver Sustainability Community Breakfast Andrew Curran Manager, Strategy June 12, 2013 2 Integrating Land Use & Transportation
Foreword. Vision and Strategy
 GREATER MANCHESTER SPATIAL FRAMEWORK Friends of Walkden Station Consultation Response January 2017 Foreword Friends of Walkden Station are a group of dedicated volunteers seeking to raise the status and
Encapsulating Urban Traffic Rhythms into Road Networks
 Encapsulating Urban Traffic Rhythms into Road Networks Junjie Wang +, Dong Wei +, Kun He, Hang Gong, Pu Wang * School of Traffic and Transportation Engineering, Central South University, Changsha, Hunan,
FHWA GIS Outreach Activities. Loveland, Colorado April 17, 2012
 FHWA GIS Outreach Activities Loveland, Colorado April 17, 2012 GIS for Improved Decision Making FHWA believes that geographic information systems and other geospatial technologies (remote sensing and GPS)
NATHAN HALE HIGH SCHOOL PARKING AND TRAFFIC ANALYSIS. Table of Contents
 Parking and Traffic Analysis Seattle, WA Prepared for: URS Corporation 1501 4th Avenue, Suite 1400 Seattle, WA 98101-1616 Prepared by: Mirai Transportation Planning & Engineering 11410 NE 122nd Way, Suite
MULTIPLE CHOICE. Choose the one alternative that best completes the statement or answers the question.
 AP Test 13 Review Name MULTIPLE CHOICE. Choose the one alternative that best completes the statement or answers the question. 1) Compared to the United States, poor families in European cities are more
Appendix C Final Methods and Assumptions for Forecasting Traffic Volumes
 Fairview Ave. and Main St. Improvements and Local Streets Plan Appendices Ada County Highway District Appendix C Final Methods and Assumptions for Forecasting Traffic Volumes January 3, 207 Appendices
Assessing spatial distribution and variability of destinations in inner-city Sydney from travel diary and smartphone location data
 Assessing spatial distribution and variability of destinations in inner-city Sydney from travel diary and smartphone location data Richard B. Ellison 1, Adrian B. Ellison 1 and Stephen P. Greaves 1 1 Institute
King City URA 6D Concept Plan
 King City URA 6D Concept Plan King City s Evolution Among the fastest growing cities 2000 Census 1,949 2010 Census 3,111 60% increase 2016 Census estimate 3,817 23% increase Average annual rate 4.3% Surpassing
Cipra D. Revised Submittal 1
 Cipra D. Revised Submittal 1 Enhancing MPO Travel Models with Statewide Model Inputs: An Application from Wisconsin David Cipra, PhD * Wisconsin Department of Transportation PO Box 7913 Madison, Wisconsin
EXAMINING THE DEMOGRAPHICS OF THE DOG RIVER WATERSHED
 EXAMINING THE DEMOGRAPHICS OF THE DOG RIVER WATERSHED Phillip B. Whatley, Department of Earth Sciences, University of South Alabama, Mobile, AL, 36688. Email: pbw401@jaguar1.usouthal.edu. Examining the
The Role of Transitways in Our Region s Economic Competitiveness. The 23rd CTS Annual Research Conference St. Paul, MN May 23, 2012
 The Role of Transitways in Our Region s Economic Competitiveness The 23rd CTS Annual Research Conference St. Paul, MN May 23, 2012 1 2 Twin Cities Competitive Clusters 3 Competitive Clusters interconnected
NEW YORK DEPARTMENT OF SANITATION. Spatial Analysis of Complaints
 NEW YORK DEPARTMENT OF SANITATION Spatial Analysis of Complaints Spatial Information Design Lab Columbia University Graduate School of Architecture, Planning and Preservation November 2007 Title New York
Speakers: Jeff Price, Federal Transit Administration Linda Young, Center for Neighborhood Technology Sofia Becker, Center for Neighborhood Technology
 Speakers: Jeff Price, Federal Transit Administration Linda Young, Center for Neighborhood Technology Sofia Becker, Center for Neighborhood Technology Peter Haas, Center for Neighborhood Technology Craig
III. FORECASTED GROWTH
 III. FORECASTED GROWTH In order to properly identify potential improvement projects that will be required for the transportation system in Milliken, it is important to first understand the nature and volume
Appendix BAL Baltimore, Maryland 2003 Annual Report on Freeway Mobility and Reliability
 (http://mobility.tamu.edu/mmp) Office of Operations, Federal Highway Administration Appendix BAL Baltimore, Maryland 2003 Annual Report on Freeway Mobility and Reliability This report is a supplement to:
1600 Prairie Drive , FAX
 Hennepin County Transportation Department Transportation Department 612-596-0300, Phone 1600 Prairie Drive 612-321-3410, FAX Medina, MN 55340-5421 www.hennepin.us December 30, 2015 Subject: Bottineau Boulevard
Transport Planning in Large Scale Housing Developments. David Knight
 Transport Planning in Large Scale Housing Developments David Knight Large Scale Housing Developments No longer creating great urban spaces in the UK (Hall 2014) Transport Planning Transport planning processes
3.0 ANALYSIS OF FUTURE TRANSPORTATION NEEDS
 3.0 ANALYSIS OF FUTURE TRANSPORTATION NEEDS In order to better determine future roadway expansion and connectivity needs, future population growth and land development patterns were analyzed as part of
Trip and Parking Generation Study of Orem Fitness Center-Abstract
 Trip and Parking Generation Study of Orem Fitness Center-Abstract The Brigham Young University Institute of Transportation Engineers student chapter (BYU ITE) completed a trip and parking generation study
The Urbana Free Library Parking and Transportation Study
 CHAMPAIGN COUNTY REGIONAL PLANNING COMMISSION The Urbana Free Library Parking and Transportation Study Final Report 7/18/2013 Champaign Urbana Urbanized Area Transportation Study (CUUATS) TABLE OF CONTENTS
ADDRESSING TITLE VI AND ENVIRONMENTAL JUSTICE IN LONG-RANGE TRANSPORTATION PLANS
 ADDRESSING TITLE VI AND ENVIRONMENTAL JUSTICE IN LONG-RANGE TRANSPORTATION PLANS Activities from the National Capital Region Transportation Planning Board Sergio Ritacco Transportation Planner 2017 Association
COUNCIL POLICY MANUAL
 COUNCIL POLICY MANUAL SECTION: PUBLIC WORKS SUBJECT: SNOW & ICE CONTROL POLICY 2012/2013 GOAL: Pages: 1 of 10 Approval Date: Dec. 3, 2012 Res. # 1001/2012 To annually identify the winter maintenance costs
An online data and consulting resource of THE UNIVERSITY OF TOLEDO THE JACK FORD URBAN AFFAIRS CENTER
 An online data and consulting resource of THE JACK FORD URBAN AFFAIRS CENTER THE CENTER FOR GEOGRAPHIC INFORMATION SCIENCE AND APPLIED GEOGRAPHICS DEPARTMENT OF GEOGRAPHY AND PLANNING THE UNIVERSITY OF
The purpose of this report is to recommend a Geographic Information System (GIS) Strategy for the Town of Richmond Hill.
 Strategy for the Town of Richmond Hill.") Staff Report for Committee of the Whole Meeting Department: Division: Subject: Office of the Chief Administrative Officer Strategic Initiatives SRCAO.18.12 GIS Strategy Purpose: The purpose of this report
Staff Report for Committee of the Whole Meeting Department: Division: Subject: Office of the Chief Administrative Officer Strategic Initiatives SRCAO.18.12 GIS Strategy Purpose: The purpose of this report
I. M. Schoeman North West University, South Africa. Abstract
 Urban Transport XX 607 Land use and transportation integration within the greater area of the North West University (Potchefstroom Campus), South Africa: problems, prospects and solutions I. M. Schoeman
CIV3703 Transport Engineering. Module 2 Transport Modelling
 CIV3703 Transport Engineering Module Transport Modelling Objectives Upon successful completion of this module you should be able to: carry out trip generation calculations using linear regression and category
Technical Memorandum #2 Future Conditions
 Technical Memorandum #2 Future Conditions To: Dan Farnsworth Transportation Planner Fargo-Moorhead Metro Council of Governments From: Rick Gunderson, PE Josh Hinds PE, PTOE Houston Engineering, Inc. Subject:
Dublin Chamber submission on Dublin City Development Plan : Outdoor Advertising Strategy
 Dublin Chamber submission on Dublin City Development Plan 2011 2017: Outdoor Advertising Strategy January 2012 Key Points: Sustainable and appropriate advertising can play an important positive role in
Prepared for: San Diego Association Of Governments 401 B Street, Suite 800 San Diego, California 92101
 Activity-Based Travel Model Validation for 2012 Using Series 13 Data: Coordinated Travel Regional Activity Based Modeling Platform (CT-RAMP) for San Diego County Prepared for: San Diego Association Of
Creating a Pavement Management System Using GIS
 Christopher Castruita PPD 631 Prof. Barry Waite & Prof. Bonnie Shrewsbury Creating a Pavement Management System Using GIS Problem Definition As is the case with many cities, the city of La Cañada Flintridge
Appendix: Development Patterns and Design
 Appendix: Development Patterns and Design Development Patterns Figure 1 lists the amount of land converted from undeveloped to some other form of land for the 13 county and 20 county Atlanta Region. In
Measuring connectivity in London
 Measuring connectivity in London OECD, Paris 30 th October 2017 Simon Cooper TfL City Planning 1 Overview TfL Connectivity measures in TfL PTALs Travel time mapping Catchment analysis WebCAT Current and
The National Spatial Strategy
 Purpose of this Consultation Paper This paper seeks the views of a wide range of bodies, interests and members of the public on the issues which the National Spatial Strategy should address. These views
APPENDIX C-3 Equitable Target Areas (ETA) Technical Analysis Methodology
 Technical Analysis Methodology") APPENDIX C-3 Equitable Target Areas (ETA) Technical Analysis Methodology Contents Introduction... 1 ETA Index Methodology... 1 ETA Index Development... 1 Other EJ Measures... 4 The Limited English Proficiency
APPENDIX C-3 Equitable Target Areas (ETA) Technical Analysis Methodology Contents Introduction... 1 ETA Index Methodology... 1 ETA Index Development... 1 Other EJ Measures... 4 The Limited English Proficiency
Metro SafeTrack Impact on Individual Travel Behavior & Regional Traffic Conditions. 1. Introduction. 2. Focus of this Volume & Issue
 Metro SafeTrack Impact on Individual Travel Behavior & Regional Traffic Conditions Volume 1 Issue 1 June 10, 16 1. Introduction The National Transportation Center (NTC@Maryland) at the University of Maryland
Urban White Paper on Tokyo Metropolis 2002
 Urban White Paper on Tokyo Metropolis 2002 By Bureau of City Planning Tokyo Metropolitan Government Part I. "Progress in IT and City Building" Effects of computer networks on cities and cities' response
Taming the Modeling Monster
 Taming the Modeling Monster Starring: Ellen Greenberg Scott McCarey Jim Charlier Audience Poll, part 1 Elected Officials Board Members Public Staff Consultants Journalists Other Audience Poll, part 2 Modeling
Opportunities to Strengthen Transit-Oriented Development through the New Starts Process
 Opportunities to Strengthen Transit-Oriented Development through the New Starts Process Congressional Testimony of Shelley Poticha, President Reconnecting America Presented before the Subcommittee on Highways
City of Saginaw Right of Way Division Snow and Ice Removal Policy January 18, 2016
 Snow and Ice Removal Policy January 18, 2016 It is the policy of the to provide snowplowing and ice removal services in order to: Provide safe traveling conditions for motorists and pedestrians Assist
Analyzing Suitability of Land for Affordable Housing
 Analyzing Suitability of Land for Affordable Housing Vern C. Svatos Jarrod S. Doucette Abstract: This paper explains the use of a geographic information system (GIS) to distinguish areas that might have
Intercity Bus Stop Analysis
 by Karalyn Clouser, Research Associate and David Kack, Director of the Small Urban and Rural Livability Center Western Transportation Institute College of Engineering Montana State University Report prepared
UN-GGIM: Strengthening Geospatial Capability
 Fifth Plenary Meeting of UN-GGIM: Europe Brussels, 6-7 June 2018 UN-GGIM: Strengthening Geospatial Capability Walking the talk to leave no one behind Greg Scott, UN-GGIM Secretariat Environmental Statistics
APPENDIX IV MODELLING
 APPENDIX IV MODELLING Kingston Transportation Master Plan Final Report, July 2004 Appendix IV: Modelling i TABLE OF CONTENTS Page 1.0 INTRODUCTION... 1 2.0 OBJECTIVE... 1 3.0 URBAN TRANSPORTATION MODELLING
Market Street PDP. Nassau County, Florida. Transportation Impact Analysis. VHB/Vanasse Hangen Brustlin, Inc. Nassau County Growth Management
 Transportation Impact Analysis Market Street PDP Nassau County, Florida Submitted to Nassau County Growth Management Prepared for TerraPointe Services, Inc. Prepared by VHB/Vanasse Hangen Brustlin, Inc.
GIS for the Non-Expert
 GIS for the Non-Expert Ann Forsyth University of Minnesota February 2006 GIS for the Non-Expert 1. Definitions and problems 2. Measures being tested in Twin Cities Walking Study Basic approach, data, variables
Crow River Plaza - Retail Development South Diamond Lake Rd. Rogers, MN FOR LEASE 1,024 SF Retail Space. Lease Rate: $16.
 FEATURES: - Available in Rogers, MN Lease Rate: $16.00 / psf NNN - Excellent location with freeway signage on I-94! - Near large retailers such as Target, Kohls, & Applebees. Taxes $3.65 / psf Cam $3.20
Local Area Key Issues Paper No. 13: Southern Hinterland townships growth opportunities
 Draft Sunshine Coast Planning Scheme Review of Submissions Local Area Key Issues Paper No. 13: Southern Hinterland townships growth opportunities Key Issue: Growth opportunities for Southern Hinterland
CHAPTER 4: INVENTORY & LEVEL OF SERVICE ANALYSIS
 CHAPTER 4: INVENTORY & LEVEL OF SERVICE ANALYSIS A. Introduction This section provides an overview and analysis of the parks, recreation, trails, and open space system in Cary, North Carolina. First, the