Multiresolution Analysis of Urban Reflectance
|
|
|
- Marcus Farmer
- 5 years ago
- Views:
Transcription
1 Multiresolution Analysis of Urban Reflectance Christopher Small Lamont Doherty Earth Observatory Columbia University Palisades, NY USA Reprinted from: IEEE/ISPRS joint Workshop on Remote Sensing and Data Fusion over Urban Areas, Paper 23 Rome, Italy 8-9 November, 2001 Copyright 2001 IEEE. Reprinted from IEEE/ISPRS joint Workshop on Remote Sensing and Data Fusion over Urban Areas. This material is posted here with permission of the IEEE. Internal or personal use of this material is permitted. However, permission to reprint/republish this material for advertising or promotional purposes or for creating new collective works for resale or redistribution must be obtained from the IEEE by sending a blank message to pubs-permissions@ieee.org. By choosing to view this document, you agree to all provisions of the copyright laws protecting it.
2 IEEE/ISPRS joint Workshop on Remote Sensing and Data Fusion over Urban Areas, Paper 23 1 Multiresolution Analysis of Urban Reflectance Christopher Small Abstract Quantitative analysis of urban reflectance characteristics can provide insights into the spatial and temporal variations in urban reflectance that modulate solar energy fluxes through the urban environment. Characterization of urban reflectance may also facilitate development of algorithms for classification of urban landcover. The characteristic scale of urban reflectance variations is generally between 10 and 20 m and therefore comparable to the Ground Instantaneous Field of View of most operational sensors. This results in spectral heterogeneity that limits the accuracy of pixel-based classifications of urban imagery. Multisensor analyses of urban reflectance indicate that many urban areas can be described as mixtures of three or four spectral endmembers. Most urban building materials lie along a continuum between high and low albedo endmembers but vegetation is a persistent and distinct component of the urban mosaic. Nonlinear mixing generally diminishes with increasing vegetation cover such that linear mixing models may be generally appropriate for urban vegetation estimation. Preliminary analyses of Landsat imagery in a number of urban areas worldwide suggests that linear mixing models with three and four endmember may be generally applicable to urban areas. Spectral heterogeneity at scales of tens of meters may be a more consistent characteristic of urban reflectance than any single reflectance spectrum. Index Terms AVIRIS, Ikonos, scale, urban, vegetation. INTRODUCTION NTRA-urban variations in optical reflectance exert a strong Iinfluence on environmental conditions and energy fluxes by selective absorption and reflection of solar radiation. These energy fluxes are a major determinant in the physical conditions of the primary human habitat. Recent estimates indicate that over 45% of the world's human population now lives in urban areas with over 60% projected by 2030 [1]. Our understanding of the built environment depends upon our ability to observe and quantify the physical conditions of urban areas. Understanding the characteristics of urban reflectance is also necessary to develop robust classification methods to quantify the spatial extent of human settlement patterns. Spatial and temporal distribution of human settlements has environmental and socioeconomic consequences but current knowledge of settlement distribution lacks both detail and consistency. Urban vegetation has a strong influence on the spatial and temporal variations in urban reflectance. Vegetation influences urban environmental conditions and energy fluxes by selective reflection and absorption of solar radiation [2] and by modulation of evapotranspiration [3],[4]. The presence and abundance of vegetation in urban areas has long been C. Small is an associate research scientist and a NASA SEDAC project scientist at the Lamont Doherty Earth Observatory of Columbia University, Palisades, NY USA ( , small@ldeo.columbia.edu). recognized as a strong influence on energy demand and the urban heat island [5]. Urban vegetation may also influence air quality and human health [6] because trees provide surface area for sequestration of particulate matter and ozone. The objective of this paper is to summarize results of recent and ongoing studies of urban reflectance characteristics. The work is intended to advance two distinct lines of research. Characterization of urban reflectance requires quantification of spatial and spectral variability across a range of scales. In this case, the central question is how the aggregate properties of the urban mosaic influence energy flux on different temporal and spatial scales. Characterization of urban reflectance also facilitates the use of optical remote sensing for large scale mapping of human settlement patterns. For this application, it is necessary to quantify spectral consistencies among different urban areas. CHARACTERISTIC SCALES OF URBAN REFLECTANCE The overall reflectance of the urban mosaic is determined by the combination of building materials and the characteristic scale of individual features of consistent reflectance (roofs, streets, trees, etc). Optical sensors have limited swath widths and spatial resolutions so the measured radiance is a result of both the Ground Instantaneous Field of View (GIFOV) of the sensor and the scale of the features in the urban mosaic. If the GIFOV is much smaller than the scale of the features then they will be adequately sampled and thereby recognizable in the image. If the GIFOV is comparable to the scale of the features then the measured radiance will generally result from a combination of surfaces of different reflectances within the GIFOV. To understand the characteristics of urban reflectance it is necessary to quantify the scales of individual features. The two dimensional (2D) spatial autocorrelation of an image provides information about the spatial scale of the variance. The width of the central peak of the autocorrelation function is determined by the scale at which the largest amplitude features decorrelate and thereby provides one indication of the dominant scale of image texture. This is particularly well suited to urban areas because settlement patterns often have quasi-periodic spatial structures that are easily quantified by the autocorrelation function. Figure 1 shows the result of a study of 12 contrasting urban areas worldwide [7] with a consistent 10 to 20 meter scale length. This suggests that most urban structures have scales comparable to the GIFOV of operational sensors like Landsat and SPOT. This, in turn, explains why images of urban areas rarely resolve individual structures and are characterized by spectrally mixed pixels. It is therefore appropriate to consider urban reflectance in the context of spectral mixing.
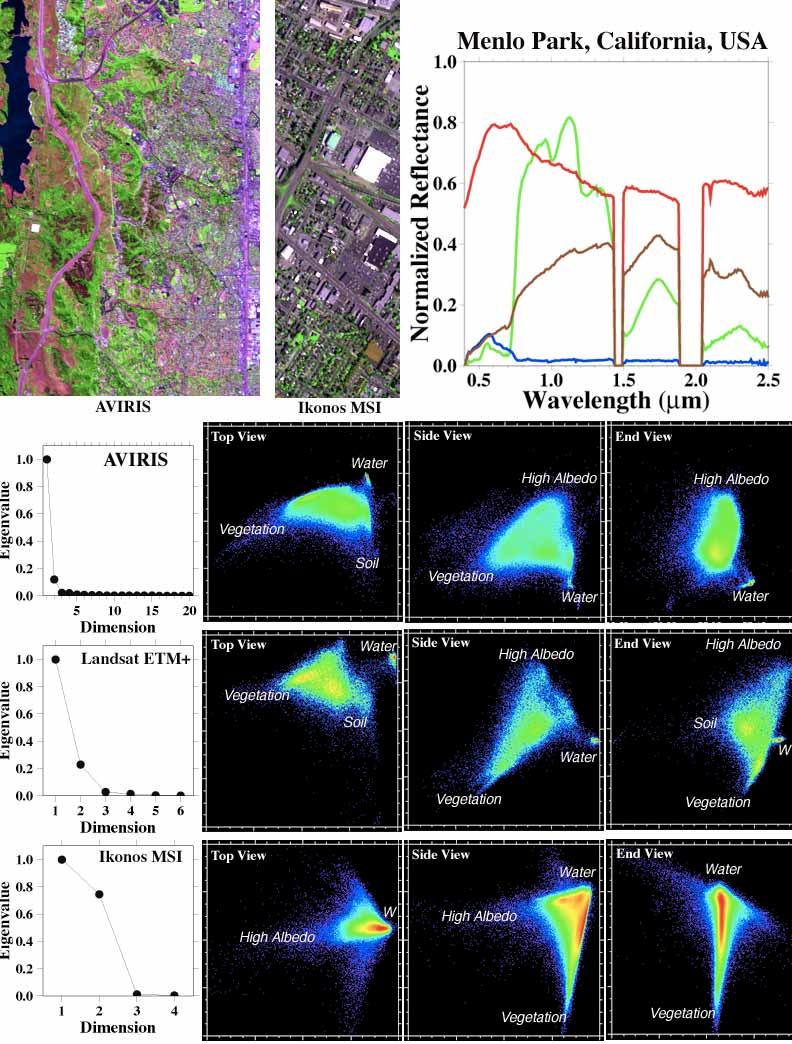
3 IEEE/ISPRS joint Workshop on Remote Sensing and Data Fusion over Urban Areas, Paper 23 2 materials within mixed pixels [9] - particularly for use with imaging spectrometers in geologic remote sensing [10]. If the areal abundance of vegetation present within an urban pixel can be estimated accurately then it may be possible to monitor the spatial and temporal variations in urban vegetation - even when the vegetation occurs at scales finer than the spatial resolution of the sensor. Analysis of Landsat TM imagery suggests that the spectral reflectance of the New York metropolitan area can be described as linear mixing of three distinct spectral endmembers [11]. Dimensionality of a spectral mixing space can be estimated from the variance partition indicated by a Principal Component rotation of the image bands. The eigenvalue distribution associated with the rotation gives a quantitative estimate of the amount of variance in each transformed dimension and the resulting images show the spatial distribution of spectrally distinct endmembers (e.g. [9],[10]). Scatterplots of the low order components show the topology of the mixing space and indicate spectral endmembers by their locations at the periphery of the mixing space. Fig. 1.Characteristic scales of urban reflectance. The histograms show distributions of scale lengths for 6276 urban sites in 12 cities derived from Ikonos 1 m panchromatic imagery. Each scale estimate is the result of a 2D spatial autocorrelation of a 200x200m site. The majority of sites have characteristic scales between 10 and 20 m. Sites with larger scale lengths are generally large undeveloped areas, intraurban agriculture or water. SPECTRAL MIXING The characteristic spatial scale and the spectral variability of urban landcover poses serious problems for traditional image classification algorithms. In urban areas where the reflectance spectra of the landcover vary appreciably at scales comparable to, or smaller than, the Ground Instantaneous Field Of View (GIFOV) of most satellite sensors, the spectral reflectance of an individual pixel will generally not resemble the reflectance of a single landcover class but rather a mixture of the reflectances of two or more classes present within the GIFOV. Because they are combinations of spectrally distinct landcover types, mixed pixels in urban areas are frequently misclassified as other landcover classes. Conversely, the definition of an urban spectral class will often incorporate pixels of other non-urban classes as well. Building materials dominate net reflectance in most cities but in many cases vegetation also has a very strong influence on urban reflectance. If an urban area contains significant amounts of vegetation then the reflectance spectra measured by the sensor will be influenced by the reflectance characteristics of the vegetation. Macroscopic combinations of homogeneous "endmember" materials within the GIFOV often produce a composite reflectance spectrum that can be described as a linear combination of the spectra of the endmembers [8]. If mixing between the endmember spectra is predominantly linear, and the endmembers are known apriori, it may be possible to "unmix" individual pixels by estimating the fraction of each endmember in the composite reflectance of a mixed pixel [9],[10]. A variety of methods have been developed to estimate the areal abundance of endmember MULTISENSOR ANALYSES It is possible to assess the consistency of the urban spectral mixing space by comparing images of the same site collected by sensors with different spatial and spectral resolutions. A Minimum Noise Fraction (MNF) principal component transformation applied to AVIRIS, Landsat and Ikonos imagery scenes consistently shows two dominant eigenvalues and a sub-planar triangular mixing space. The triangular distribution in MNF space bears an obvious similarity to the well known Tasseled Cap distribution discovered by Kauth and Thomas in The feature space distributions are similar in the sense that all contain a vegetation endmember that is distinct from a mixing continuum between high and low albedo endmembers and, in some cases, a soil endmember. Figures 2 and 3 show examples of the spectral mixing space for parts of the New York and San Francisco metro areas with eigenvalue distributions suggesting that the majority of scene variance is contained within a two dimensional mixing plane for each sensor. Fig. 2. (next page) Multisensor analysis of the spectral mixing space for Brooklyn, New York, USA. False-color composites for AVIRIS (20m, RGB=2.2/0.8/0.5 µm) and Ikonos MSI (4m, RGB=0.6/0.8/0.4 µm) show different degrees of spectral mixing. AVIRIS spectra show the High Albedo (red), Low Albedo (blue) and vegetation (green) endmembers residing at the apexes of the mixing space. The eigenvalue distributions for each sensor (left column) indicate that most of the variance is contained in the first two dimensions corresponding to the principal components shown in the Side View scatterplot. The topology of the three dominant dimensions of the mixing space is shown by the scatterplots as different projections of the 3D cloud of pixels associated with the three low order principal components. The side view shows the first (x) and second (y) dimensions while the top and end views incorporate the third dimension. The variance of each dimension is proportional to the relative amplitude of the normalized eigenvalues but the dimensions are rescaled here to show the structure more clearly. In each case, the horizontal axis of the side view is associated with the most distinct endmembers so the distributions would appear as sub-planar triangles if plotted to scale. Detailed color figures available at: www. LDEO.columbia.edu/~small/Urban.html

4
5
 and Ikonos MSI (4m, RGB=0.6/0.8/0.4 µm) show similar but distinct mixing spaces as in previous figure.")
6 IEEE/ISPRS joint Workshop on Remote Sensing and Data Fusion over Urban Areas, Paper 23 6 Fig. 3. (previous page) Multisensor analysis of the spectral mixing space for Menlo Park, California, USA. False-color composites for AVIRIS (20m, RGB=2.2/0.8/0.5 µm) and Ikonos MSI (4m, RGB=0.6/0.8/0.4 µm) show similar but distinct mixing spaces as in previous figure. A soil endmember spectrum is also shown here since sparsely vegetated soil is a significant component of the mixing space in semiarid environments. Note the presence of a slight red edge in the soil endmember. GLOBAL ANALYSIS OF URBAN REFLECTANCE In order to extend the insights gained from the multisensor analyses discussed previously to other urban areas, it is necessary to determine the degree to which urban reflectance and mixing spaces are consistent across a larger sample. In general, we would not expect urban areas in the U.S.A. to be representative of urban areas worldwide. Analysis of Ikonos MSI imagery does show a remarkable consistency for American cities and for several cities outside the U.S.A. but the limited spectral dimensionality of Ikonos does not discriminate differences in the SWIR. Landsat TM/ETM+ imagery provides both a larger sample of cities and greater spectral dimensionality. Preliminary spectral analyses of Landsat imagery from 27 urban areas worldwide does suggest that three and four endmember mixing models do have general applicability to most urban areas. Figure 4 shows collections of eigenvalue spectra from MNF rotations of two different scales of Landsat imagery. The prevalence of two or three dominant eigenvalues in almost all of the spectra supports the generality of the low dimensional mixing space. sensors with GIFOVs of 10 s of meters is dominated by spectrally mixed pixels. This spectral heterogeneity violates the cardinal assumption of most statistical classification algorithms and contributes to the difficulties commonly experienced with spectral classification of the built environment. Multisensor analyses of urban reflectance allow the spectral mixing space to be quantified at a range of spatial and spectral resolutions. Comparison of AVIRIS hyperspectral imagery with Landsat ETM+ and Ikonos MSI imagery demonstrates the consistency of three and four endmember mixing spaces in the two urban areas considered. Mixing between high and low albedo endmembers and a vegetation endmember explains the majority of the spectral variance in the urban areas investigated here. Nonlinear mixing is present but consistently diminishes with increasing vegetation cover. Preliminary analyses of Landsat TM/ETM+ imagery in a variety of urban areas worldwide suggests that the three and four endmember mixing spaces observed here may be representative of urban areas elsewhere. These preliminary analyses also indicate that spectral heterogeneity at scales of tens of meters may be a more consistent characteristic of urban reflectance than the prevalence of any single spectral signature. If this is the case then it may be possible to develop classification algorithms for urban landcover than use spectral heterogeneity at these scales to discriminate between anthropogenic and natural landcovers. ACKNOWLEDGMENT This work was supported in part by the Columbia Earth Institute and CIESIN through the NASA SocioEconomic Data Applications Center (SEDAC)). Ikonos data were provided by NASA Scientific Data Purchase program. Fig. 4. Spectral dimensionality of major urban areas worldwide. Principal component analysis of Landsat TM/ETM+ imagery of 27 urban areas shows consistent spectral dimensionality for most areas. Eigenvalue spectra from Minimum Noise Fraction rotations generally have distinct breakpoints separating the two or three dimensions containing most of the variance from the remaining three or four dimensions with less information. Spectral mixing spaces associated with the three dominant dimensions usually have three or four spectral endmembers similar to the mixing spaces shown in Figures 2 and 3. The 30x30 km scale of the study areas on the left includes significant amounts of undeveloped land containing spectral endmembers not found in the urban core. Eigenvalue spectra on the right correspond to urban core areas, 3x3 km in area, containing fewer landcover types than the larger areas. The three endmembers in the two dominant dimensions of these core areas are consistently vegetation, high albedo and low albedo. CONCLUSIONS The urban mosaic is composed of a variety of components of varying scale and spectral properties. Spatial autocorrelation analyses of 1m Ikonos panchromatic imagery for 12 cities worldwide indicates that the characteristic scale of urban landcover is generally between 10 and 20m. This explains why imagery of urban areas collected by operational REFERENCES [1] United Nations, Prospects for Urbanization. United Nations (ST/ESA/SER.A/166), Sales No. E.97.XIII.3, Revision 1999 [2] Goward, S. N., G. D. Cruickshanks, and A. S. Hope, Observed relation between thermal emission and spectral radiance of a vegetated landscape, Remote Sensing of Environment, 18, , 1985 [3] Price, J. C., Using spatial context in satellite data to infer regional scale evapotranspiration, I.E.E.E. Transactions on Geoscience and Remote Sensing, 28, 5, , [4] Carlson, T. N., R. R. Gillies, and E. M. Perry, A method to make use of thermal infrared temperature and NDVI measurements, Remote Sensing Reviews, 9, , [5] Oke, T. R., The energetic basis of the urban heat island, Quarterly Journal of the Royal Meteorological Society, 108, 1, 24, [6] Wagrowski, D. M., and R. A. Hites, Polycyclic aromatic hydrocarbon accumulation in urban, suburban and rural vegetation, Environmental Science & Technology, 31, 1, , 1997 [7] Small,C., Characteristic scales of urban reflectance, IEEE Trans.Geoscience & Remote Sensing, Submitted [8] Singer, R. B., and T. B. McCord, Mars: Large scale mixing of bright and dark surface materials, 10th Lunar and Planetary Science Conference, , [9] Adams, J. B., M. O. Smith, and P. E. Johnson, Spectral mixture modeling; A new analysis of rock and soil types at the Viking Lander 1 site, J. Geophys. Res., 91, , [10] Boardman, J. W., Inversion of imaging spectrometry data using singular value decomposition, edited by IGARSS'89 12th Canadian Symposium on Remote Sensing, , [11] Small, C, Estimation of urban vegetation abundance by spectral mixture analysis, Intl. Journal of Remote Sensing, v.22, p , 2001.
A GLOBAL ANALYSIS OF URBAN REFLECTANCE. Christopher SMALL
 A GLOBAL ANALYSIS OF URBAN REFLECTANCE Christopher SMALL Lamont Doherty Earth Observatory Columbia University Palisades, NY 10964 USA small@ldeo.columbia.edu ABSTRACT Spectral characterization of urban
Spatiotemporal Monitoring of Urban Vegetation
 Spatiotemporal Monitoring of Urban Vegetation Christopher Small Lamont Doherty Earth Observatory, Columbia University, USA small@ldeo.columbia.edu Roberta Balstad Miller CIESIN Columbia University, USA
Global Analysis of Urban Population Distributions and the Physical Environment
 Global Analysis of Urban Population Distributions and the Physical Environment Christopher Small Lamont Doherty Earth Observatory Columbia University Palisades, NY 10964 USA small@ldeo.columbia.edu Urbanization
Research Article A Quantitative Assessment of Surface Urban Heat Islands Using Satellite Multitemporal Data over Abeokuta, Nigeria
 International Atmospheric Sciences Volume 2016, Article ID 3170789, 6 pages http://dx.doi.org/10.1155/2016/3170789 Research Article A Quantitative Assessment of Surface Urban Heat Islands Using Satellite
Hyperspectral Data as a Tool for Mineral Exploration
 1 Hyperspectral Data as a Tool for Mineral Exploration Nahid Kavoosi, PhD candidate of remote sensing kavoosyn@yahoo.com Nahid Kavoosi Abstract In Geology a lot of minerals and rocks have characteristic
Many of remote sensing techniques are generic in nature and may be applied to a variety of vegetated landscapes, including
 Remote Sensing of Vegetation Many of remote sensing techniques are generic in nature and may be applied to a variety of vegetated landscapes, including 1. Agriculture 2. Forest 3. Rangeland 4. Wetland,
Remote sensing of sealed surfaces and its potential for monitoring and modeling of urban dynamics
 Remote sensing of sealed surfaces and its potential for monitoring and modeling of urban dynamics Frank Canters CGIS Research Group, Department of Geography Vrije Universiteit Brussel Herhaling titel van
Urban remote sensing: from local to global and back
 Urban remote sensing: from local to global and back Paolo Gamba University of Pavia, Italy A few words about Pavia Historical University (1361) in a nice town slide 3 Geoscience and Remote Sensing Society
HYPERSPECTRAL IMAGING
 1 HYPERSPECTRAL IMAGING Lecture 9 Multispectral Vs. Hyperspectral 2 The term hyperspectral usually refers to an instrument whose spectral bands are constrained to the region of solar illumination, i.e.,
Progress Report Year 2, NAG5-6003: The Dynamics of a Semi-Arid Region in Response to Climate and Water-Use Policy
 Progress Report Year 2, NAG5-6003: The Dynamics of a Semi-Arid Region in Response to Climate and Water-Use Policy Principal Investigator: Dr. John F. Mustard Department of Geological Sciences Brown University
Analyzing High Dimensional Multispectral Data
 Analyzing High Dimensional Multispectral Data Chulhee Lee and David A. Landgrebe School of Electrical Engineering Purdue University, W. Lafayette, IN 4797-1285 Tel:(317)494-3486, FAX:(317)494-3358 landgreb@ecn.purdue.edu
A COMPARISON OF SPECTRAL MIXTURE ANALYSIS METHODS FOR URBAN LANDSCAPE USING LANDSAT ETM+ DATA: LOS ANGELES, CA
 A COMPARISO OF SPECTRAL MIXTURE AALYSIS METHODS FOR URBA LADSCAPE USIG LADSAT ETM+ DATA: LOS AGELES, CA Xianfeng Chen a and Lin Li b a Slippery Rock University of Pennsylvania, Slippery Rock, PA 657, USA
URBAN MAPPING AND CHANGE DETECTION
 URBAN MAPPING AND CHANGE DETECTION Sebastian van der Linden with contributions from Akpona Okujeni Humboldt-Unveristät zu Berlin, Germany Introduction Introduction The urban millennium Source: United Nations,
Defining microclimates on Long Island using interannual surface temperature records from satellite imagery
 Defining microclimates on Long Island using interannual surface temperature records from satellite imagery Deanne Rogers*, Katherine Schwarting, and Gilbert Hanson Dept. of Geosciences, Stony Brook University,
Urban Mapping & Change Detection. Sebastian van der Linden Humboldt-Universität zu Berlin, Germany
 Urban Mapping & Change Detection Sebastian van der Linden Humboldt-Universität zu Berlin, Germany Introduction - The urban millennium Source: United Nations Introduction Text Source: Google Earth Introduction
Remote sensing Based Assessment of Urban Heat Island Phenomenon in Nagpur Metropolitan Area
 International Journal of Information & Computation Technology. ISSN 0974-2239 Volume 4, Number 11 (2014), pp. 1069-1074 International Research Publications House http://www. irphouse.com Remote sensing
Sparse Representation-based Analysis of Hyperspectral Remote Sensing Data
 Sparse Representation-based Analysis of Hyperspectral Remote Sensing Data Ribana Roscher Institute of Geodesy and Geoinformation Remote Sensing Group, University of Bonn 1 Remote Sensing Image Data Remote
Estimation of Wavelet Based Spatially Enhanced Evapotranspiration Using Energy Balance Approach
 Estimation of Wavelet Based Spatially Enhanced Evapotranspiration Using Energy Balance Approach Dr.Gowri 1 Dr.Thirumalaivasan 2 1 Associate Professor, Jerusalem College of Engineering, Department of Civil
Learning Objectives. Thermal Remote Sensing. Thermal = Emitted Infrared
 November 2014 lava flow on Kilauea (USGS Volcano Observatory) (http://hvo.wr.usgs.gov) Landsat-based thermal change of Nisyros Island (volcanic) Thermal Remote Sensing Distinguishing materials on the ground
Data Fusion and Multi-Resolution Data
 Data Fusion and Multi-Resolution Data Nature.com www.museevirtuel-virtualmuseum.ca www.srs.fs.usda.gov Meredith Gartner 3/7/14 Data fusion and multi-resolution data Dark and Bram MAUP and raster data Hilker
Urban Mapping. Sebastian van der Linden, Akpona Okujeni, Franz Schug 11/09/2018
 Urban Mapping Sebastian van der Linden, Akpona Okujeni, Franz Schug 11/09/2018 Introduction to urban remote sensing Introduction The urban millennium Source: United Nations, 2014 Urban areas mark extremes
Exploring the Use of Urban Greenspace through Cellular Network Activity
 Exploring the Use of Urban Greenspace through Cellular Network Activity Ramón Cáceres 1, James Rowland 1, Christopher Small 2, and Simon Urbanek 1 1 AT&T Labs Research, Florham Park, NJ, USA {ramon,jrr,urbanek}@research.att.com
THE UTILITY OF HYPERSPECTRAL DATA ON EXPLORATION OF SANDSTONE-HOSTED URANIUM DEPOSITS *
 THE UTILITY OF HYPERSPECTRAL DATA ON EXPLORATION OF SANDSTONE-HOSTED URANIUM DEPOSITS * Jie-lin Zhang Beijing Research Institute of Uranium Geology Key Laboratory of Remote Sensing Beijing 100029, China,
Seek of Specific Soils in Puerto Rico using IKONOS
 Geological Aplication of Remote Sensing Copyright 2004 Department of Geology University of Puerto Rico, Mayagüez Seek of Specific Soils in Puerto Rico using IKONOS D. HERNÁNDEZ University of Puerto Rico
Remote Sensing Based Inversion of Gap Fraction for Determination of Leaf Area Index. Alemu Gonsamo 1 and Petri Pellikka 1
 Remote Sensing Based Inversion of Gap Fraction for Determination of Leaf Area Index Alemu Gonsamo and Petri Pellikka Department of Geography, University of Helsinki, P.O. Box, FIN- Helsinki, Finland; +-()--;
DEPENDENCE OF URBAN TEMPERATURE ELEVATION ON LAND COVER TYPES. Ping CHEN, Soo Chin LIEW and Leong Keong KWOH
 DEPENDENCE OF URBAN TEMPERATURE ELEVATION ON LAND COVER TYPES Ping CHEN, Soo Chin LIEW and Leong Keong KWOH Centre for Remote Imaging, Sensing and Processing, National University of Singapore, Lower Kent
Comparison between Land Surface Temperature Retrieval Using Classification Based Emissivity and NDVI Based Emissivity
 Comparison between Land Surface Temperature Retrieval Using Classification Based Emissivity and NDVI Based Emissivity Isabel C. Perez Hoyos NOAA Crest, City College of New York, CUNY, 160 Convent Avenue,
Hyperspectral Atmospheric Correction
 Hyperspectral Atmospheric Correction Bo-Cai Gao June 2015 Remote Sensing Division Naval Research Laboratory, Washington, DC USA BACKGROUND The concept of imaging spectroscopy, or hyperspectral imaging,
Vegetation Change Detection of Central part of Nepal using Landsat TM
 Vegetation Change Detection of Central part of Nepal using Landsat TM Kalpana G. Bastakoti Department of Geography, University of Calgary, kalpanagb@gmail.com Abstract This paper presents a study of detecting
The Wide Dynamic Range Vegetation Index and its Potential Utility for Gap Analysis
 Summary StatMod provides an easy-to-use and inexpensive tool for spatially applying the classification rules generated from the CT algorithm in S-PLUS. While the focus of this article was to use StatMod
SPECTROMETRY AND HYPERSPECTRAL REMOTE SENSING OF URBAN ROAD INFRASTRUCTURE. Martin Herold, Margaret E. Gardner, Val Noronha and. Dar A.
 SPECTROMETRY AND HYPERSPECTRAL REMOTE SENSING OF URBAN ROAD INFRASTRUCTURE Martin Herold, Margaret E. Gardner, Val Noronha and Dar A. Roberts Introduction Detailed and accurate information about the road
DAMAGE DETECTION OF THE 2008 SICHUAN, CHINA EARTHQUAKE FROM ALOS OPTICAL IMAGES
 DAMAGE DETECTION OF THE 2008 SICHUAN, CHINA EARTHQUAKE FROM ALOS OPTICAL IMAGES Wen Liu, Fumio Yamazaki Department of Urban Environment Systems, Graduate School of Engineering, Chiba University, 1-33,
New Opportunities in Urban Remote Sensing. Philip Christensen Arizona State University
 New Opportunities in Urban Remote Sensing Philip Christensen Arizona State University Advantages: Uniform, global data Role of Remote Sensing Repeatable at regular intervals over long periods of time Broad
METRIC tm. Mapping Evapotranspiration at high Resolution with Internalized Calibration. Shifa Dinesh
 METRIC tm Mapping Evapotranspiration at high Resolution with Internalized Calibration Shifa Dinesh Outline Introduction Background of METRIC tm Surface Energy Balance Image Processing Estimation of Energy
MODIS Snow Cover Mapping Decision Tree Technique: Snow and Cloud Discrimination
 67 th EASTERN SNOW CONFERENCE Jiminy Peak Mountain Resort, Hancock, MA, USA 2010 MODIS Snow Cover Mapping Decision Tree Technique: Snow and Cloud Discrimination GEORGE RIGGS 1, AND DOROTHY K. HALL 2 ABSTRACT
Using MERIS and MODIS for Land Cover Mapping in the Netherlands
 Using MERIS and for Land Cover Mapping in the Netherlands Raul Zurita Milla, Michael Schaepman and Jan Clevers Wageningen University, Centre for Geo-Information, NL Introduction Actual and reliable information
Land cover/land use mapping and cha Mongolian plateau using remote sens. Title. Author(s) Bagan, Hasi; Yamagata, Yoshiki. Citation Japan.
 Bagan, Hasi; Yamagata, Yoshiki. Citation Japan.") Title Land cover/land use mapping and cha Mongolian plateau using remote sens Author(s) Bagan, Hasi; Yamagata, Yoshiki International Symposium on "The Imp Citation Region Specific Systems". 6 Nove Japan.
Title Land cover/land use mapping and cha Mongolian plateau using remote sens Author(s) Bagan, Hasi; Yamagata, Yoshiki International Symposium on "The Imp Citation Region Specific Systems". 6 Nove Japan.
Deriving Uncertainty of Area Estimates from Satellite Imagery using Fuzzy Land-cover Classification
 International Journal of Information and Computation Technology. ISSN 0974-2239 Volume 3, Number 10 (2013), pp. 1059-1066 International Research Publications House http://www. irphouse.com /ijict.htm Deriving
AssessmentofUrbanHeatIslandUHIusingRemoteSensingandGIS
 Global Journal of HUMANSOCIAL SCIENCE: B Geography, GeoSciences, Environmental Science & Disaster Management Volume 16 Issue 2 Version 1.0 Type: Double Blind Peer Reviewed International Research Journal
APPLICATIONS WITH METEOROLOGICAL SATELLITES. W. Paul Menzel. Office of Research and Applications NOAA/NESDIS University of Wisconsin Madison, WI
 APPLICATIONS WITH METEOROLOGICAL SATELLITES by W. Paul Menzel Office of Research and Applications NOAA/NESDIS University of Wisconsin Madison, WI July 2004 Unpublished Work Copyright Pending TABLE OF CONTENTS
Analysis of Urban Surface Biophysical Descriptors and Land Surface Temperature Variations in Jimeta City, Nigeria
 Global Journal of Human Social Science Vol. 10 Issue 1 (Ver 1.0), April 2010 Page 19 Analysis of Urban Surface Biophysical Descriptors and Land Surface Temperature Variations in Jimeta City, Nigeria Ambrose
Estimation of Vertical Distributions of Water Vapor from Spaceborne Observations of Scattered Sunlight
 Estimation of Vertical Distributions of Water Vapor from Spaceborne Observations of Scattered Sunlight Dale P. Winebrenner Applied Physics Laboratory, Box 355640 University of Washington Seattle, WA 98195
Characterizing fractional vegetation cover and land surface temperature based on sub- pixel fractional impervious surfaces from Landsat TM/ETM+
 1 2 Characterizing fractional vegetation cover and land surface temperature based on sub- pixel fractional impervious surfaces from Landsat TM/ETM+ 3 4 Youshui Zhang a, b, *, Angela Harris a, Heiko Balzter
An Automated Object-Oriented Satellite Image Classification Method Integrating the FAO Land Cover Classification System (LCCS).
.") An Automated Object-Oriented Satellite Image Classification Method Integrating the FAO Land Cover Classification System (LCCS). Ruvimbo Gamanya Sibanda Prof. Dr. Philippe De Maeyer Prof. Dr. Morgan De
An Automated Object-Oriented Satellite Image Classification Method Integrating the FAO Land Cover Classification System (LCCS). Ruvimbo Gamanya Sibanda Prof. Dr. Philippe De Maeyer Prof. Dr. Morgan De
Analysing Land Surface Emissivity with Multispectral Thermal Infrared Data
 2nd Workshop on Remote Sensing and Modeling of Surface Properties 9-11 June 2009, Météo France, Toulouse, France Analysing Land Surface Emissivity with Multispectral Thermal Infrared Data Maria Mira, Thomas
1. Introduction. Chaithanya, V.V. 1, Binoy, B.V. 2, Vinod, T.R. 2. Publication Date: 8 April DOI: https://doi.org/ /cloud.ijarsg.
 Cloud Publications International Journal of Advanced Remote Sensing and GIS 2017, Volume 6, Issue 1, pp. 2088-2096 ISSN 2320 0243, Crossref: 10.23953/cloud.ijarsg.112 Research Article Open Access Estimation
Greening of Arctic: Knowledge and Uncertainties
 Greening of Arctic: Knowledge and Uncertainties Jiong Jia, Hesong Wang Chinese Academy of Science jiong@tea.ac.cn Howie Epstein Skip Walker Moscow, January 28, 2008 Global Warming and Its Impact IMPACTS
GMES: calibration of remote sensing datasets
 GMES: calibration of remote sensing datasets Jeremy Morley Dept. Geomatic Engineering jmorley@ge.ucl.ac.uk December 2006 Outline Role of calibration & validation in remote sensing Types of calibration
School on Modelling Tools and Capacity Building in Climate and Public Health April Remote Sensing
 2453-5 School on Modelling Tools and Capacity Building in Climate and Public Health 15-26 April 2013 Remote Sensing CECCATO Pietro International Research Institute for Climate and Society, IRI The Earth
Impacts of sensor noise on land cover classifications: sensitivity analysis using simulated noise
 Impacts of sensor noise on land cover classifications: sensitivity analysis using simulated noise Scott Mitchell 1 and Tarmo Remmel 2 1 Geomatics & Landscape Ecology Research Lab, Carleton University,
DETECTING AIR POLLUTION FROM SPACE USING IMAGE-BASED METHOD
 DETECTING AIR POLLUTION FROM SPACE USING IMAGE-BASED METHOD D.G. Hadjimitsis 1, 2, 3 and C.R.I Clayton 2 1 Frederick Institute of Technology, Department of Civil Engineering, 7, Y. Frederickou St., Palouriotisa,
GNR401 Principles of Satellite Image Processing
 Principles of Satellite Image Processing Instructor: Prof. CSRE, IIT Bombay bkmohan@csre.iitb.ac.in Slot 5 Guest Lecture PCT and Band Arithmetic November 07, 2012 9.30 AM 10.55 AM IIT Bombay Slide 1 November
Object-Oriented Oriented Method to Classify the Land Use and Land Cover in San Antonio using ecognition Object-Oriented Oriented Image Analysis
 Object-Oriented Oriented Method to Classify the Land Use and Land Cover in San Antonio using ecognition Object-Oriented Oriented Image Analysis Jayar S. Griffith ES6973 Remote Sensing Image Processing
MODULE 5 LECTURE NOTES 5 PRINCIPAL COMPONENT ANALYSIS
 MODULE 5 LECTURE NOTES 5 PRINCIPAL COMPONENT ANALYSIS. (PCA) Principal component analysis (PCA), also known as Karhunen-Loeve analysis, transforms the information inherent in multispectral remotely sensed
KNOWLEDGE-BASED CLASSIFICATION OF LAND COVER FOR THE QUALITY ASSESSEMENT OF GIS DATABASE. Israel -
 KNOWLEDGE-BASED CLASSIFICATION OF LAND COVER FOR THE QUALITY ASSESSEMENT OF GIS DATABASE Ammatzia Peled a,*, Michael Gilichinsky b a University of Haifa, Department of Geography and Environmental Studies,
COMPARASION OF NDBI AND NDVI AS INDICATORS OF SURFACE URBAN HEAT ISLAND EFFECT IN LANDSAT 8 IMAGERY: A CASE STUDY OF IASI
 DOI 10.1515/pesd-2017-0032 PESD, VOL. 11, no. 2, 2017 COMPARASION OF NDBI AND NDVI AS INDICATORS OF SURFACE URBAN HEAT ISLAND EFFECT IN LANDSAT 8 IMAGERY: A CASE STUDY OF IASI Paul Macarof 1, Florian Statescu
Atmospheric Correction Using Hyperion
 Atmospheric Correction Using Hyperion Progress and Issues Investigation: Correlative Analysis of EO-1, Landsat, and Terra Data of the DOE ARM CART Sites: An Investigation of Instrument Performance and
Urban Growth Analysis: Calculating Metrics to Quantify Urban Sprawl
 Urban Growth Analysis: Calculating Metrics to Quantify Urban Sprawl Jason Parent jason.parent@uconn.edu Academic Assistant GIS Analyst Daniel Civco Professor of Geomatics Center for Land Use Education
F. Esposito, E. Palomba, L. Colangeli and the PFS team
 F. Esposito, E. Palomba, L. Colangeli and the PFS team Remote observations of planetary surfaces are complicated by the surface photometric function and, sometimes, by atmospheric scattering. The reflectivity
A new perspective on aerosol direct radiative effects in South Atlantic and Southern Africa
 A new perspective on aerosol direct radiative effects in South Atlantic and Southern Africa Ian Chang and Sundar A. Christopher Department of Atmospheric Science University of Alabama in Huntsville, U.S.A.
LANDSAF SNOW COVER MAPPING USING MSG/SEVIRI DATA
 LANDSAF SNOW COVER MAPPING USING MSG/SEVIRI DATA Niilo Siljamo and Otto Hyvärinen Finnish Meteorological Institute, Erik Palménin aukio 1, P.O.Box 503, FI-00101 Helsinki, Finland Abstract Land Surface
Coastal Characterization Using EO-1 Hyperion Data
 Coastal Characterization Using EO-1 Hyperion Data Dr. Hsiao-hua K. Burke EO-1 SVT Meeting 18-21 November 2002 Sponsor: NOAA NESDIS GOES 2002-1 Channel Positions of Various Ocean- Color Sensors, 1978-2000*
Alteration zone Mapping in the Meiduk and Sar Cheshmeh Porphyry Copper Mining Districts of Iran using Advanced Land Imager (ALI) Satellite Data
 Satellite Data") Alteration zone Mapping in the Meiduk and Sar Cheshmeh Porphyry Copper Mining Districts of Iran using Advanced Land Imager (ALI) Satellite Data Amin Beiranvand Pour*, Mazlan Hashim Geoscience and Digital
Alteration zone Mapping in the Meiduk and Sar Cheshmeh Porphyry Copper Mining Districts of Iran using Advanced Land Imager (ALI) Satellite Data Amin Beiranvand Pour*, Mazlan Hashim Geoscience and Digital
Outline. Artificial night lighting as seen from space. Artificial night lighting as seen from space. Applications based on DMSP nighttime lights
 -1 - Outline Satellite observed nighttime lights as an indicator of human induced stress on coral C. Aubrecht, C.D. Elvidge August 22, 2008 Kuffner Observatory Vienna, Austria Artificial night lighting
Landuse and Landcover change analysis in Selaiyur village, Tambaram taluk, Chennai
 Landuse and Landcover change analysis in Selaiyur village, Tambaram taluk, Chennai K. Ilayaraja Department of Civil Engineering BIST, Bharath University Selaiyur, Chennai 73 ABSTRACT The synoptic picture
Mineral Mapping with AVIRIS and EO-1 Hyperion **
 Mineral Mapping with AVIRIS and EO-1 Hyperion ** Fred A. Kruse 1 1.0 Introduction Imaging Spectrometry data or Hyperspectral Imagery (HSI) acquired using airborne systems have been used in the geologic
AUTOMATED BUILDING DETECTION FROM HIGH-RESOLUTION SATELLITE IMAGE FOR UPDATING GIS BUILDING INVENTORY DATA
 13th World Conference on Earthquake Engineering Vancouver, B.C., Canada August 1-6, 2004 Paper No. 678 AUTOMATED BUILDING DETECTION FROM HIGH-RESOLUTION SATELLITE IMAGE FOR UPDATING GIS BUILDING INVENTORY
Overview of Remote Sensing in Natural Resources Mapping
 Overview of Remote Sensing in Natural Resources Mapping What is remote sensing? Why remote sensing? Examples of remote sensing in natural resources mapping Class goals What is Remote Sensing A remote sensing
Applications of GIS and Remote Sensing for Analysis of Urban Heat Island
 Chuanxin Zhu Professor Peter V. August Professor Yeqiao Wang NRS 509 December 15, 2016 Applications of GIS and Remote Sensing for Analysis of Urban Heat Island Since the last century, the global mean surface
John R. Mecikalski #1, Martha C. Anderson*, Ryan D. Torn #, John M. Norman*, George R. Diak #
 P4.22 THE ATMOSPHERE-LAND EXCHANGE INVERSE (ALEXI) MODEL: REGIONAL- SCALE FLUX VALIDATIONS, CLIMATOLOGIES AND AVAILABLE SOIL WATER DERIVED FROM REMOTE SENSING INPUTS John R. Mecikalski #1, Martha C. Anderson*,
Seasonal Variations of the Urban Heat Island Effect:
 Seasonal Variations of the Urban Heat Island Effect: Examining the Differences in Temperature Between the City of Philadelphia and its Outlying Suburbs By: Frank Vecchio 1 P a g e We re calling for a high
A MULTI-SCALE OBJECT-ORIENTED APPROACH TO THE CLASSIFICATION OF MULTI-SENSOR IMAGERY FOR MAPPING LAND COVER IN THE TOP END.
 A MULTI-SCALE OBJECT-ORIENTED APPROACH TO THE CLASSIFICATION OF MULTI-SENSOR IMAGERY FOR MAPPING LAND COVER IN THE TOP END. Tim Whiteside 1,2 Author affiliation: 1 Natural and Cultural Resource Management,
C N E S, U M R I R I S A
 M O N I T O R I N G U R B A N A R E A S W I T H S E N T I N E L - 2. APPLICATION TO THE UPDATE OF THE COPERNICUS HIGH RESOLUTION LAYER IMPERVIOUSNESS DEGREE O c t o b e r 2 5 th 2016, Brussels A n t o
Object-based classification of residential land use within Accra, Ghana based on QuickBird satellite data
 International Journal of Remote Sensing Vol. 28, No. 22, 20 November 2007, 5167 5173 Letter Object-based classification of residential land use within Accra, Ghana based on QuickBird satellite data D.
The O 2 A-band Spectrometer on the NASA Orbiting Carbon Observatory-2 (OCO-2)
") Workshop on Remote sensing in the O 2 A-band The O 2 A-band Spectrometer on the NASA Orbiting Carbon Observatory-2 (OCO-2) David Crisp for the OCO-2 Science Team Jet Propulsion Laboratory, California Institute
Workshop on Remote sensing in the O 2 A-band The O 2 A-band Spectrometer on the NASA Orbiting Carbon Observatory-2 (OCO-2) David Crisp for the OCO-2 Science Team Jet Propulsion Laboratory, California Institute
Sub-pixel regional land cover mapping. with MERIS imagery
 Sub-pixel regional land cover mapping with MERIS imagery R. Zurita Milla, J.G.P.W. Clevers and M. E. Schaepman Centre for Geo-information Wageningen University 29th September 2005 Overview Land Cover MERIS
A Quantitative and Comparative Analysis of Linear and Nonlinear Spectral Mixture Models Using Radial Basis Function Neural Networks
 2314 IEEE TRANSACTIONS ON GEOSCIENCE AND REMOTE SENSING, VOL. 39, NO. 8, AUGUST 2001 Pasadena, CA for the use of their data. They would also like to acknowledge the useful comments by one anonymous reviewer.
Assessing Drought in Agricultural Area of central U.S. with the MODIS sensor
 Assessing Drought in Agricultural Area of central U.S. with the MODIS sensor Di Wu George Mason University Oct 17 th, 2012 Introduction: Drought is one of the major natural hazards which has devastating
Figure S1. CRISM maps of modeled mineralogy projected over CTX imagery (same
 GSA DATA REPOSITORY 2015222 Cannon and Mustard Additional examples Figure S1. CRISM maps of modeled mineralogy projected over CTX imagery (same parameters as Figure 1). A: Taytay Crater (CRISM ID: HRL00005B77).
Undergraduate Research Final Report: Estimation of suspended sediments using MODIS 250 m bands in Mayagüez Bay, Puerto Rico
 Undergraduate Research Final Report: Estimation of suspended sediments using MODIS 250 m bands in Mayagüez Bay, Puerto Rico Abstract: José F. Martínez Colón Undergraduate Research 2007 802-03-4097 Advisor:
The Spectral Radiative Effects of Inhomogeneous Clouds and Aerosols
 The Spectral Radiative Effects of Inhomogeneous Clouds and Aerosols S. Schmidt, B. Kindel, & P. Pilewskie Laboratory for Atmospheric and Space Physics University of Colorado SORCE Science Meeting, 13-16
Region Growing Tree Delineation In Urban Settlements
 2008 International Conference on Advanced Computer Theory and Engineering Region Growing Tree Delineation In Urban Settlements LAU BEE THENG, CHOO AI LING School of Computing and Design Swinburne University
RADAR BACKSCATTER AND COHERENCE INFORMATION SUPPORTING HIGH QUALITY URBAN MAPPING
 RADAR BACKSCATTER AND COHERENCE INFORMATION SUPPORTING HIGH QUALITY URBAN MAPPING Peter Fischer (1), Zbigniew Perski ( 2), Stefan Wannemacher (1) (1)University of Applied Sciences Trier, Informatics Department,
Analysis of the unmixing on thermal hyperspectral imaging
 Analysis of the unmixing on thermal hyperspectral imaging Manuel Cubero-Castan PhD Supervisors: Jocelyn CHANUSSOT and Xavier BRIOTTET Co-supervisors: Véronique ACHARD and Michal SHIMONI PhD Defense 24th
Lênio Soares Galvão Raimundo Almeida Filho Ícaro Vitorello
 Use of ASTER short-wave infrared bands for the spectral discrimination of hydrothermally altered-materials: evaluation in a tropical savannah environment Lênio Soares Galvão Raimundo Almeida Filho Ícaro
Spatial analysis of global urban extent from DMSP-OLS night lights
 Remote Sensing of Environment 96 (2005) 277 291 www.elsevier.com/locate/rse Spatial analysis of global urban extent from DMSP-OLS night lights Christopher Small a, *, Francesca Pozzi b, C. D. Elvidge c
Evaluation of land surface temperature (LST) patterns in the urban agglomeration of Krakow using different satellite data and GIS
 patterns in the urban agglomeration of Krakow using different satellite data and GIS") Evaluation of land surface temperature (LST) patterns in the urban agglomeration of Krakow using different satellite data and GIS Jakub P. Walawender 1,2 1 Satellite Remote Sensing Centre, Institute of
Evaluation of land surface temperature (LST) patterns in the urban agglomeration of Krakow using different satellite data and GIS Jakub P. Walawender 1,2 1 Satellite Remote Sensing Centre, Institute of
Yanbo Huang and Guy Fipps, P.E. 2. August 25, 2006
 Landsat Satellite Multi-Spectral Image Classification of Land Cover Change for GIS-Based Urbanization Analysis in Irrigation Districts: Evaluation in Low Rio Grande Valley 1 by Yanbo Huang and Guy Fipps,
Land Surface Temperature Measurements From the Split Window Channels of the NOAA 7 Advanced Very High Resolution Radiometer John C.
 Land Surface Temperature Measurements From the Split Window Channels of the NOAA 7 Advanced Very High Resolution Radiometer John C. Price Published in the Journal of Geophysical Research, 1984 Presented
GIS.
 GIS 389 Vol., No.3, Autumn 00 89-0 GIS Iranian Remote Sensing & GIS ( : ) ETM+ *.. 390/3/7 : 389/5/3 : (LST).. 00 3 ETM+.. MNF NDVI. SEBAL. FVC NDVI... (FVC) SEBAL (LULC) (LST) :. 887708 : : * Email: taleai@kntu.ac.ir
NASA s Airborne Visible/Infrared Imaging Spectrometer (AVIRIS) AVIRIS: PEARL HARBOR, HAWAII
 AVIRIS: PEARL HARBOR, HAWAII") AVIRIS: PEARL HARBOR, HAWAII 000412 NASA s Airborne Visible/Infrared Imaging Spectrometer (AVIRIS) LCLUC Update Robert O. Green (Tom Chrien, presenting) Jet Propulsion Laboratory Overview Objective & Approach
AVIRIS: PEARL HARBOR, HAWAII 000412 NASA s Airborne Visible/Infrared Imaging Spectrometer (AVIRIS) LCLUC Update Robert O. Green (Tom Chrien, presenting) Jet Propulsion Laboratory Overview Objective & Approach
Seminar III Spring Semester (8 May 2015) Chuphan Chompuchan ( 蘇潘 ) Dept. of Soil and Water Conservation National Chung Hsing University
 Chuphan Chompuchan ( 蘇潘 ) Dept. of Soil and Water Conservation National Chung Hsing University") Seminar III Spring Semester (8 May 2015) Chuphan Chompuchan ( 蘇潘 ) 8101042007 Dept. of Soil and Water Conservation National Chung Hsing University Introduction Normalized Burn Ratio (NBR) Ground measurement:
Seminar III Spring Semester (8 May 2015) Chuphan Chompuchan ( 蘇潘 ) 8101042007 Dept. of Soil and Water Conservation National Chung Hsing University Introduction Normalized Burn Ratio (NBR) Ground measurement:
Projects in the Remote Sensing of Aerosols with focus on Air Quality
 Projects in the Remote Sensing of Aerosols with focus on Air Quality Faculty Leads Barry Gross (Satellite Remote Sensing), Fred Moshary (Lidar) Direct Supervision Post-Doc Yonghua Wu (Lidar) PhD Student
Key words: Hyperspectral, imaging, object identification, urban, investigation
 URBAN SENSING BY HYPERSPECTRAL DATA Lanfen ZHENG, Qingxi TONG, Bing ZHANG, Xing LI, Jiangui LIU The Institute of Remote Sensing Applications, Chinese Academy of Sciences P. O. Box 9718, 100101, Beijing,
Impacts of Atmospheric Corrections on Algal Bloom Detection Techniques
 1 Impacts of Atmospheric Corrections on Algal Bloom Detection Techniques Ruhul Amin, Alex Gilerson, Jing Zhou, Barry Gross, Fred Moshary and Sam Ahmed Optical Remote Sensing Laboratory, the City College
This is trial version
 Journal of Rangeland Science, 2012, Vol. 2, No. 2 J. Barkhordari and T. Vardanian/ 459 Contents available at ISC and SID Journal homepage: www.rangeland.ir Full Paper Article: Using Post-Classification
Critical review of the Climate Change Impact on urban areas by assessment of Heat Island effect
 Critical review of the Climate Change Impact on urban areas by assessment of Heat Island effect Case of Pune, India Town Planning, Civil Department Prof. Omkar Parishwad, ogp.civil@coep.ac.in Climate Change
OBJECT BASED IMAGE ANALYSIS FOR URBAN MAPPING AND CITY PLANNING IN BELGIUM. P. Lemenkova
 Fig. 3 The fragment of 3D view of Tambov spatial model References 1. Nemtinov,V.A. Information technology in development of spatial-temporal models of the cultural heritage objects: monograph / V.A. Nemtinov,
Rating of soil heterogeneity using by satellite images
 Rating of soil heterogeneity using by satellite images JAROSLAV NOVAK, VOJTECH LUKAS, JAN KREN Department of Agrosystems and Bioclimatology Mendel University in Brno Zemedelska 1, 613 00 Brno CZECH REPUBLIC
VCS MODULE VMD0018 METHODS TO DETERMINE STRATIFICATION
 VMD0018: Version 1.0 VCS MODULE VMD0018 METHODS TO DETERMINE STRATIFICATION Version 1.0 16 November 2012 Document Prepared by: The Earth Partners LLC. Table of Contents 1 SOURCES... 2 2 SUMMARY DESCRIPTION