The advantages of the services on the web-gis:
|
|
|
- Ursula O’Neal’
- 5 years ago
- Views:
Transcription

1 The advantages of the services on the web-gis: Availability - Get access to the system can be in any place and at any time, it is enough to have at his workplace Internet access. Easy - Work in an ordinary browser. The system does not require maintenance by the administrator or the GIS specialist. Teamwork - To share your project with colleagues or with the whole world - just send a link or embed the project in your own website using the API. Access control - You can create both public and private projects, giving them access only to selected users - to view or edit.

 Address search")
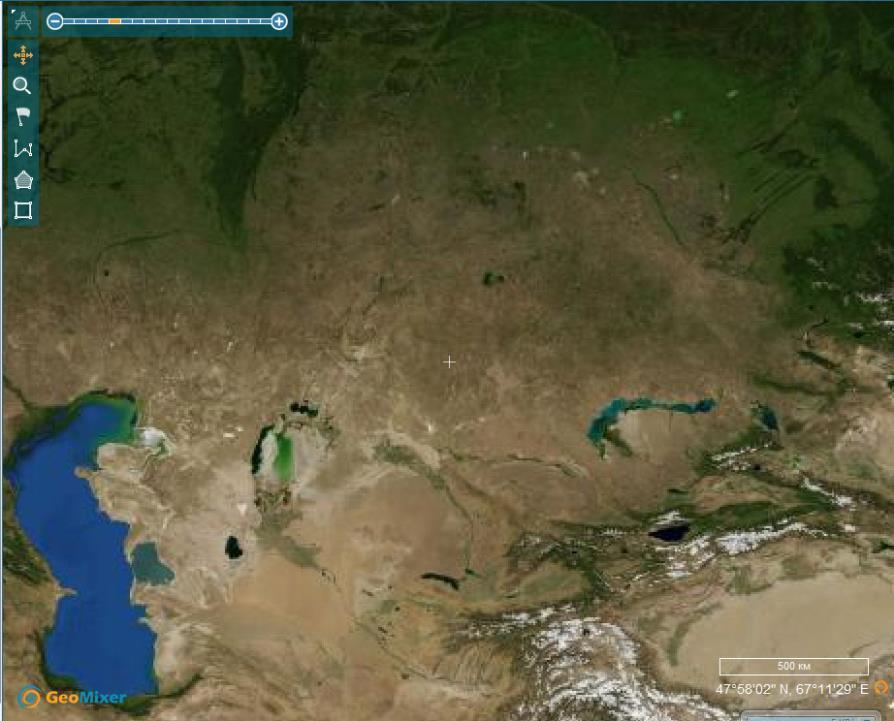
2 Potential of Geoportal Data Merge external Geoportal and local custom server Mosaic covering satellite images Raster layers (satellite images, Aerial photographs, raster maps in the format? GeoTiff, ERDAS Imagine, JPEG, PNG, etc.) Vector layers (points, lines,? Polygonal objects in formats? ESRI ShapeFile, MapInfo MIF / TAB, GPS-tracks in GPX format, Text and tabular data, From Excel and MS SQL 2008) Address search Drawing objects, Alignment markers View and download data Access rights to the geo-data

 to the Internet or corporate GIS with access to geodata large")
3 Web-GIS технологии Web-GIS - (web based Information service) - web-oriented information services or systems. Web-GIS-technology technology to create web mapping services, geographic information portals (geoportals) to the Internet or corporate GIS with access to geodata large companies, with a regular Internet browser. Рисунки: В. В. Гохман «DATA+»
4 Web-GIS технологии Solution GeoMixer WEB-GIS - a custom web interface for geodata and geo-service, having the tools to create and edit projects. ESRI GIS Portal Toolkit (USA) - This product is open source, which allows the detection and use of geospatial resources, including data sets, raster, and Web services. Geoportal Server supports standards-based center and metadata discovery applications.

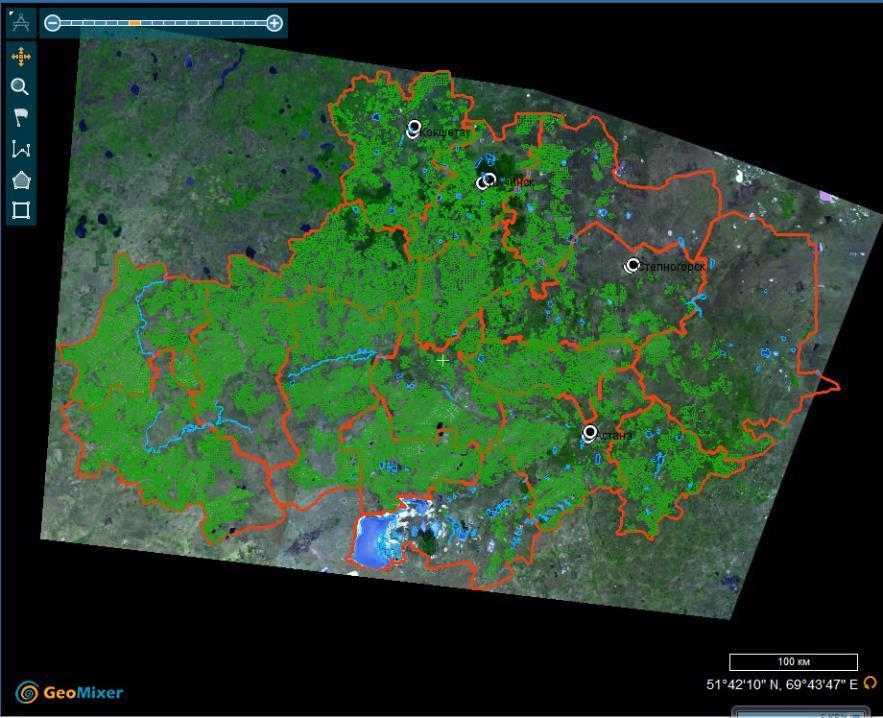
5 Geoportal results of monitoring of Agriculture


6 User s interface of portal Scaling Picture hybrids and maps Tree layers Tools Drawing a vectors and tasters data
7 List of space images to be uploaded into the geoportal replace by photo (if available) 1. Topographic base 2. Map of snow melting replace by photo (if available) 3. Current Veg. index (VCI) 4. The boundaries of the veg. distribution (NDVI) 5. Climate data from the meteo stations 6. Data on wheat stock market and seasonal productivity. Kazagro Marketing 3

8 Using of GIS technology

9 The number of agricultural fields Region crops (pieces ) deposit (pieces ) fallow (pieces ) Akmola North Kaz Kostanai Total
 - The name of the farm; - The number of fields in the nomenclature of the economy; - Year of observation; - The culture of the field;")
10 The attribute information includes - general information the name of the area in which there is a field; field area (in hectares); culture field in the last 2 years (crop, fallow, steam) - Additional information (ground-based observations from ground station area) - The name of the farm; - The number of fields in the nomenclature of the economy; - Year of observation; - The culture of the field; - The dates and types of farming operations; - observation data of snow cover; - Evaluation of the depth of wetting and soil moisture; - Biometric measurements (3 times per season); - Productivity.
11

12

13 Индекс IVI Вода Снег Почва Растительный покров
14 Индекс IVI Вода Снег Почва Растительный покров
15 Индекс IVI Вода Снег Почва Растительный покров

16 Индекс IVI Вода Снег Почва Растительный покров

17
18
19
20

21

22

23 Занесение поля в базу данных
24 Vegetation Index - Direct estimation vegetation state Vegetation condition is determined based on measurements in different spectral bands based on absorption and reflection characteristics of plants, The main index is NDVI: Greenness indices; Indexes of efficiency of use of light; Soil indexes; Indices moisture content; And etc. NDVI NIR NIR red red


25 MONITORING OF VEGETATION STATES Calculation of vegetative indexes Vegetative indexes Formulas everyday ten-day


26 Spectral pattern of typical crop state in Northern Kazakhstan The relationship between the spectral reflection in the visible and infrared wavelengths and the condition of the vegetation in the fields Curves spectrometric measurements of spring wheat in different conditions Map of condition of grain crops in Kostanay region fallow Wavelength, nm excellent good satisfactory condition of grain crops Excellent Good Satisfactory Bad 26


27 Dynamic spectral pattern of typical crop field in Northern Kazakhstan Reflectance 0,2 0,18 0,16 0,14 0,12 0,1 0,08 0,06 EOS MODIS Band 1 ( nm) 0,04 0,02 harvesting planting 0 3 May 28 May 22 June 17 July 11 Aug 05 Sept 30 Sept 25 Oct Yield forecast
 The historical (since")
28 Information on the progress of the growing season on the field Analysis of information on the state of the vegetation chosen field: Operative (no less than once a week) The historical (since 2001)
29 Засуха The deviation from the normal course of development of crops (destruction of crops by the drought)
30 ndvi ndvi Early warning of drought, Akmola region 0,5 2010, Акмолинская область According Vitkovskaya I., Kauazov A., Batyrbayeva M. at all. 0,4 0,3 0,2 0,1 0-0,1 1d_apr 2d_apr 3d_apr 1d_may 2d_may 3d_may 1d_june 2d_june 3d_june 1d_july декады 2d_july 3d_july 1d_aug 2d_aug 3d_aug 1d_sept 2d_sept 0,5 3d_sept 2012, Акмолинская область 2010 ср. многол max min 0,4 1 Decade of June 0,3 0,2 Compare the current values of the index NDVI multi-year highs, lows and averages allows for early detection of the onset of drought in a given territory 0,1 0-0,1 1d_apr 2d_apr 3d_apr 1d_may 2d_may 3d_may 1d_june 2d_june 3d_june 1d_july декады 2d_july 3d_july 1d_aug 2d_aug 3d_aug 1d_sept 2d_sept 3d_sept 2012 ср. многол max min 2 Decade of May
31 The shift of the season - late sowing
32 Comparisons to the same crop in different years -18% The difference in the amount of above-ground biomass of the current season and another

33


34 Бюллетени состояния растительности в отдельных регионах


35 Пресс-релизы об аномальном состоянии растительности


36 Satellite service (basic functionalities) Analysis of vegetation in a particular state of the field at any moment growing season; Comparison of crop conditions and their status in the previous seasons, and other fields; Determine the type of cultivated crop field in the current season and in previous seasons; Assessment of impacts of negative factors (frost, drought, insect infestations, etc.); The ability to provide timely information

37 The advantage of users 1. Digitalize their fields according to the current or previous years; 2. The possibility of making observations and marking in online mode; 3. Swift control of the state of crops and to the formation of operational reports to the Ministry of Agriculture; 4. Rapid assessment of productivity in each field; 5. Analysis of the spatial variation yields (soil fertility) in the large fields 6. Analysis of long-term productivity of land
Transboundary water management with Remote Sensing. Oluf Jessen DHI Head of Projects, Water Resources Technical overview
 Transboundary water management with Remote Sensing Oluf Jessen DHI Head of Projects, Water Resources Technical overview ozj@dhigroup.com Transboundary water management Water management across national
Web GIS in Agriculture Land Use, Crop Management and Planning. Kevin Knapp Bryan Baker, Phd.
 Web GIS in Agriculture Land Use, Crop Management and Planning Kevin Knapp Bryan Baker, Phd. Two Case Studies Two Custom Developed Web Applications Both Integrate different technologies Primary Requirement
Web GIS Based Disaster Portal Project ESRI INDIA
 Web GIS Based Disaster Portal Project ESRI INDIA Contents Requirements Overview Product Technology Used KSNDMC Application Architecture Tool Developed Benefits for the End User Problems faced during implementation
NR402 GIS Applications in Natural Resources
 NR402 GIS Applications in Natural Resources Lesson 1 Introduction to GIS Eva Strand, University of Idaho Map of the Pacific Northwest from http://www.or.blm.gov/gis/ Welcome to NR402 GIS Applications in
Building a National Data Repository
 Building a National Data Repository Mladen Stojic, Vice President - Geospatial 1/30/2013 2012 Intergraph Corporation 1 Information has meaning and gives power only when shared and distributed. Information,
ISO MODIS NDVI Weekly Composites for Canada South of 60 N Data Product Specification
 ISO 19131 MODIS NDVI Weekly Composites for South of 60 N Data Product Specification Revision: A Data specification: MODIS NDVI Composites for South of 60 N - Table of Contents - 1. OVERVIEW... 3 1.1. Informal
Predicting Future CO2 Amounts and Monitoring Seasonal CO2 Fluctuations QUANTIFYING CO2 ANNUAL INCREASE
 http://visibleearth.nasa.gov/view.php?id=5772 3 Predicting Future CO2 Amounts and Monitoring Seasonal CO2 Fluctuations QUANTIFYING CO2 ANNUAL INCREASE Aguilera, Kimberly GEO 3276: GIS & GPS Applications
Modular Web Framework for the BRANDENBURGVIEWER
 Modular Web Framework for the BRANDENBURGVIEWER Geoinformation System (GIS) 2 GIS = geo + information + system + + Survey of data Organization of data Processing and Analysis Presentation geodata infrastructure
STEREO ANALYST FOR ERDAS IMAGINE Stereo Feature Collection for the GIS Professional
 STEREO ANALYST FOR ERDAS IMAGINE Stereo Feature Collection for the GIS Professional STEREO ANALYST FOR ERDAS IMAGINE Has Your GIS Gone Flat? Hexagon Geospatial takes three-dimensional geographic imaging
Geospatial Products V8i (SELECTseries 1)
") Geospatial Products V8i (SELECTseries 1) Keith Raymond Product Manager Geospatial Desktop Products Presentation Overview What are the various products? Why would you need them? Demonstrations 2 WWW.BENTLEY.COM
Geospatial Products V8i (SELECTseries 1) Keith Raymond Product Manager Geospatial Desktop Products Presentation Overview What are the various products? Why would you need them? Demonstrations 2 WWW.BENTLEY.COM
Grant Agreement No. EIE/07/595/SI BEn
 Biomass energy register for sustainable site development for European regions Grant Agreement No. EIE/07/595/SI2.499697 BEn Biomass energy register for sustainable site development for European regions
An Instructional Module. FieldScope Unit 1. Introduction to National Geographic Society s FieldScope Program.
 An Instructional Module FieldScope Unit 1 www.budburst.org/fieldscope Introduction to National Geographic Society s FieldScope Program Unit Contents Overview 3 Learning Objectives Time Commitment Technical
Discovery and Access of Geospatial Resources using the Geoportal Extension. Marten Hogeweg Geoportal Extension Product Manager
 Discovery and Access of Geospatial Resources using the Geoportal Extension Marten Hogeweg Geoportal Extension Product Manager DISCOVERY AND ACCESS USING THE GEOPORTAL EXTENSION Geospatial Data Is Very
SOLUTIONS ADVANCED GIS. TekMindz are developing innovative solutions that integrate geographic information with niche business applications.
 ADVANCED GIS SOLUTIONS TekMindz are developing innovative solutions that integrate geographic information with niche business applications. TEK INDZ TM GIS Services Overview At the leading edge of geospatial
Global Geospatial Information Management Country Report Finland. Submitted by Director General Jarmo Ratia, National Land Survey
 Global Geospatial Information Management Country Report Finland Submitted by Director General Jarmo Ratia, National Land Survey Global Geospatial Information Management Country Report Finland Background
Copyright The McGraw-Hill Companies, Inc. Permission required for reproduction or display.
 CHAPTER 5 GIS DATA Acquisition 5.1 Existing GIS Data 5.1.1 Federal Geographic Data Committee 5.1.2 Geospatial One-Stop Box 5.1 Clearinghouse and Portal 5.1.3 U.S. Geological Survey 5.1.4 U.S. Census Bureau
Remote Sensing Geographic Information Systems Global Positioning Systems
 Remote Sensing Geographic Information Systems Global Positioning Systems Assessing Seasonal Vegetation Response to Drought Lei Ji Department of Geography University of Nebraska-Lincoln AVHRR-NDVI: July
European Space Agency
 Guidelines - Guidelines how/when to interact during the WebEx session: - Due to the number of attendees, please keep always your webcam and microphone switched-off - You can use anytime the chat to all
These modules are covered with a brief information and practical in ArcGIS Software and open source software also like QGIS, ILWIS.
 Online GIS Training and training modules covered are: 1. ArcGIS, Analysis, Fundamentals and Implementation 2. ArcGIS Web Data Sharing 3. ArcGIS for Desktop 4. ArcGIS for Server These modules are covered
THE OVERALL EAGLE CONCEPT
 Sentinel Hub THE OVERALL EAGLE CONCEPT GEBHARD BANKO, 30. MAY 2018, COPENHAGEN ISO TC 211, STANDARDS IN ACTION SEMINAR CONTENT Background and Motivation Criteria and Structure of Data Model Semantic decomposition
Sources of Imagery and GIS Data Layers (Last updated October 2005)
") Sources of Imagery and GIS Data Layers (Last updated October 2005) The question of where to find data is one often asked by beginners in precision agriculture and other geospatial projects. The following
Sources of Imagery and GIS Data Layers (Last updated October 2005) The question of where to find data is one often asked by beginners in precision agriculture and other geospatial projects. The following
Introduction to Satellite Derived Vegetation Indices
 Introduction to the Use of Geospatial Information Technology for Drought Risk Management 13-17 November, 2017 Tonle Bassac II Restaurant, Phnom Penh, Cambodia Introduction to Satellite Derived Vegetation
DROUGHT ASSESSMENT USING SATELLITE DERIVED METEOROLOGICAL PARAMETERS AND NDVI IN POTOHAR REGION
 DROUGHT ASSESSMENT USING SATELLITE DERIVED METEOROLOGICAL PARAMETERS AND NDVI IN POTOHAR REGION Researcher: Saad-ul-Haque Supervisor: Dr. Badar Ghauri Department of RS & GISc Institute of Space Technology
Introduction to Geographic Information Systems (GIS): Environmental Science Focus
: Environmental Science Focus") Introduction to Geographic Information Systems (GIS): Environmental Science Focus September 9, 2013 We will begin at 9:10 AM. Login info: Username:!cnrguest Password: gocal_bears Instructor: Domain: CAMPUS
Introduction to Geographic Information Systems (GIS): Environmental Science Focus September 9, 2013 We will begin at 9:10 AM. Login info: Username:!cnrguest Password: gocal_bears Instructor: Domain: CAMPUS
An internet based tool for land productivity evaluation in plot-level scale: the D-e-Meter system
 An internet based tool for land productivity evaluation in plot-level scale: the D-e-Meter system Tamas Hermann 1, Ferenc Speiser 1 and Gergely Toth 2 1 University of Pannonia, Hungary, tamas.hermann@gmail.com
Geospatial Fire Behavior Modeling App to Manage Wildfire Risk Online. Kenyatta BaRaKa Jackson US Forest Service - Consultant
 Geospatial Fire Behavior Modeling App to Manage Wildfire Risk Online Kenyatta BaRaKa Jackson US Forest Service - Consultant Fire Behavior Modeling and Forest Fuel Management Modeling Fire Behavior is an
Global UAV-based solutions for the industry and agriculture.
 Global UAV-based solutions for the industry and agriculture. Remote sensing of vegetation from drones (UAS). The example of the Trimble Unmanned Aerial Solution Emmanuel de Maistre, co-founder & CEO demaistre@redbird.fr
THE ESTIMATE OF THE SPATIAL-TEMPORAL FEATURES OF VEGETATION COVER OF KAZAKHSTAN BASED ON TIME SERIES SATELLITE INDECES IN
 THE ESTIMATE OF THE SPATIAL-TEMPORAL FEATURES OF VEGETATION COVER OF KAZAKHSTAN BASED ON TIME SERIES SATELLITE INDECES IN - I.Vitkovskaya a. M. Batyrbayeva a, L.Spivak b a The National Centre of Space
v WMS Tutorials GIS Module Importing, displaying, and converting shapefiles Required Components Time minutes
 v. 11.0 WMS 11.0 Tutorial Importing, displaying, and converting shapefiles Objectives This tutorial demonstrates how to import GIS data, visualize it, and convert it into WMS coverage data that could be
Display data in a map-like format so that geographic patterns and interrelationships are visible
 Vilmaliz Rodríguez Guzmán M.S. Student, Department of Geology University of Puerto Rico at Mayagüez Remote Sensing and Geographic Information Systems (GIS) Reference: James B. Campbell. Introduction to
GIS at the Midwestern Regional Climate Center: A peek behind the curtain. Zoe Zaloudek, Geospatial Application Developer
 GIS at the Midwestern Regional Climate Center: A peek behind the curtain Zoe Zaloudek, Geospatial Application Developer CPASW, May 2018 What is the MRCC? GIS-based Maps and Products Regional Mesonet Program
Geospatial capabilities, spatial data and services provided by Military Geographic Service
 Geospatial capabilities, spatial data and services provided by Military Geographic Service LtC Mariyan Markov PhD CONTENTS 1. INTRODUCTION - Workflow - Data sources remote sensing, direct field observation.
Drought Estimation Maps by Means of Multidate Landsat Fused Images
 Remote Sensing for Science, Education, Rainer Reuter (Editor) and Natural and Cultural Heritage EARSeL, 2010 Drought Estimation Maps by Means of Multidate Landsat Fused Images Diego RENZA, Estíbaliz MARTINEZ,
Development of a Web-Based GIS Management System for Agricultural Authorities in Iraq
 Development of a Web-Based GIS Management System for Agricultural Authorities in Iraq USCID Water Management Conference Phoenix, Arizona April 18, 2013 Gabriele Bonaiti Extension Program Specialist David
The EOC Geoservice: Standardized Access to Earth Observation Data Sets and Value Added Products
 The EOC Geoservice: Standardized Access to Earth Observation Data Sets and Value Added Products Klaus Dengler, Torsten Heinen, Albert Huber, Katrin Molch, Eberhard Mikusch DLR German Remote Sensing Data
ESRI educational site license in Bahir Dar University. Tegegn Molla Abebe Mengaw Geospatial Data and Technology Center, BDU
 ESRI educational site license in Bahir Dar University Tegegn Molla Abebe Mengaw Geospatial Data and Technology Center, BDU September, 2016 Mission, Vision Purpose and Values of the GDTC Mission of GDTC
Operational MRCC Tools Useful and Usable by the National Weather Service
 Operational MRCC Tools Useful and Usable by the National Weather Service Vegetation Impact Program (VIP): Frost / Freeze Project Beth Hall Accumulated Winter Season Severity Index (AWSSI) Steve Hilberg
Land Degradation Monitoring Tool
 Land Degradation Monitoring Tool -Guidance Document - Land Degradation Monitoring Tool; Version 1 September 27, 2017 Part of the project Enabling the use of global data sources to assess and monitor land
GIS compilation of coastline variability spanning 60 years in the Mackenzie Delta and Tuktoyaktuk in the Beaufort Sea
 GEOLOGICAL SURVEY OF CANADA OPEN FILE 7685 GIS compilation of coastline variability spanning 60 years in the Mackenzie Delta and Tuktoyaktuk in the Beaufort Sea S. Hynes, S.M. Solomon, and D. Whalen 2014
Utah UIC Geospatial Integration EIEN Project
 Utah UIC Geospatial Integration EIEN Project ESRI UC, June 2007 Bert Granberg Utah Automated Geographic Reference Center Utah Automated Geographic Reference Center (AGRC) AGRC Responsibilities Facilitate
Analyzing and Visualizing Precipitation and Soil Moisture in ArcGIS
 Analyzing and Visualizing Precipitation and Soil Moisture in ArcGIS Wenli Yang, Pham Long, Peisheng Zhao, Steve Kempler, and Jennifer Wei * NASA Goddard Earth Science Data and Information Services Center
Geospatial Technologies for the Agricultural Sciences
 Geospatial Technologies for the Agricultural Sciences Maggi Kelly Assoc. Cooperative Extension Specialist Department of Environmental Science, Policy & Management Director, GIIF UC Berkeley Karin Tuxen
Leveraging the OGC Capabilities of ArcGIS Server
 Leveraging the OGC Capabilities of ArcGIS Server Satish Sankaran Interoperability and Standards Team Yingqi Tang Server Team Jessica Parteno Geodatabase Team ArcGIS Server is Open & Interoperable Using
QUALITY CONTROL ROLE IN PROCESS OF ESTABLISHMENT OF NSDI
 QUALITY CONTROL ROLE IN PROCESS OF ESTABLISHMENT OF NSDI S. Lemajić a,lj. Rašić b a Croatian Geodetic Institute, Savska 41/XVI, Zagreb, Croatia slavko.lemajic@cgi.hr b State Geodetic Administration, Lastovska
GIS Software. Evolution of GIS Software
 GIS Software The geoprocessing engines of GIS Major functions Collect, store, mange, query, analyze and present Key terms Program collections of instructions to manipulate data Package integrated collection
Droughts are normal recurring climatic phenomena that vary in space, time, and intensity. They may affect people and agriculture at local scales for
 I. INTRODUCTION 1.1. Background Droughts are normal recurring climatic phenomena that vary in space, time, and intensity. They may affect people and agriculture at local scales for short periods or cover
SoilView: Development of a Custom GIS Application for Publishing Soil Surveys
 SoilView: Development of a Custom GIS Application for Publishing Soil Surveys Allan Johnson and Mike Wigginton Abstract Currently, digital soils information can be obtained from many sources. Numerous
Innovation. The Push and Pull at ESRI. September Kevin Daugherty Cadastral/Land Records Industry Solutions Manager
 Innovation The Push and Pull at ESRI September 2004 Kevin Daugherty Cadastral/Land Records Industry Solutions Manager The Push and The Pull The Push is the information technology that drives research and
Land Board, NW Services and SDI Tambet Tiits, FRICS
 Land Board, NW Services and SDI Tambet Tiits, FRICS 07.09.2016 200th anniversary of the Struve Geodetic Arc Friedrich Georg Wilhelm Struve and Carl Friedrich Tenner Struve Geodetic Arc The Struve Geodetic
Gistat: moving towards a location information management system
 Gistat: moving towards a location information management system (merging geographical, statistical and historical information) Pina Grazia Ticca Marco Ballin Istat - Italy Aguascalientes, Mexico 2-4 December
Geometric Algorithms in GIS
 Geometric Algorithms in GIS GIS Visualization Software Dr. M. Gavrilova GIS Software for Visualization ArcView GEO/SQL Digital Atmosphere AutoDesk Visual_Data GeoMedia GeoExpress CAVE? Visualization in
GTK GeoKernel and Data Management. Material from Niina Ahtonen, Esa Kauniskangas and Tero Rönkkö
 GTK GeoKernel and Data Management Esa Kauniskangas 31.5.2010 Material from Niina Ahtonen, Esa Kauniskangas and Tero Rönkkö 1 GTK s operational areas Northern Finland Office Rovaniemi Western Finland Office
Techniques for Science Teachers: Using GIS in Science Classrooms.
 Techniques for Science Teachers: Using GIS in Science Classrooms. After ESRI, 2008 GIS A Geographic Information System A collection of computer hardware, software, and geographic data used together for
Bentley Map Advancing GIS for the World s Infrastructure
 Bentley Map Advancing GIS for the World s Infrastructure Presentation Overview Why would you need Bentley Map? What is Bentley Map? Where is Bentley Map Used? Red text signifies new things in Bentley Map
Software requirements * : Part III: 2 hrs.
 Title: Product Type: Developer: Target audience: Format: Software requirements * : Data: Estimated time to complete: Mapping snow cover using MODIS Part I: The MODIS Instrument Part II: Normalized Difference
Search for the Gulf of Carpentaria in the remap search bar:
 This tutorial is aimed at getting you started with making maps in Remap (). In this tutorial we are going to develop a simple classification of mangroves in northern Australia. Before getting started with
Rural Louisiana. A quarterly publication of the Louisiana Tech Rural Development Center
 Rural Louisiana A quarterly publication of the Louisiana Tech Rural Development Center Volume 4, No. 1, Fall 2009 Editor: Aaron K. Lusby Director, Asst. Professor Newsletter design: Stephanie Tidwell Student
Integrated application of Land Surveying and Mappipng. Data on Web-GIS
 Integrated application of Land Surveying and Mappipng Data on Web-GIS Abstract The data system of the land surveying and drawing is the core of the land information system. It includes the following contents:
GIS Lecture 5: Spatial Data
 GIS Lecture 5: Spatial Data GIS 1 Outline Vector Data Formats Raster Data Formats Map Projections Coordinate Systems US Census geographic files US Census data files GIS Data Sources GIS 2 Vector Data Formats
Overview. Everywhere. Over everything.
 Cadenza Desktop Cadenza Web Cadenza Mobile Cadenza Overview. Everywhere. Over everything. The ultimate GIS and reporting suite. Provide, analyze and report data efficiently. For desktop, web and mobile.
One platform for desktop, web and mobile
 One platform for desktop, web and mobile Search and filter Get access to all data thematically filter data in context factually and spatially as well as display it dynamically. Export a selection or send
CWB Weather Outlook & Weather Network Initiative. January 11, 2008
 CWB Weather Outlook & Weather Network Initiative January 11, 2008 Weather Outlook Fall and Winter Situation in Western Canada Global Crop/Weather Situation Strong La Nina off South America Impacts for
A Distributed GIS Architecture for Research in Baalbek Based on CISAR
 234 Frank Henze A Distributed GIS Architecture for Research in Baalbek Based on CISAR Abstract: Research underway in Baalbek extends from the immediate vicinity of the excavation areas to the monumental
National GIS Platform for Digital India. Dr.(Mrs.) Vandana Sharma Deputy Director General National Informatics Centre
 Vandana Sharma Deputy Director General National Informatics Centre") National GIS Platform for Digital India Dr.(Mrs.) Vandana Sharma Deputy Director General National Informatics Centre sharma.vandana@nic.in NIC DEITY - National e-governance Infrastructure Meghraj Cloud
National GIS Platform for Digital India Dr.(Mrs.) Vandana Sharma Deputy Director General National Informatics Centre sharma.vandana@nic.in NIC DEITY - National e-governance Infrastructure Meghraj Cloud
POSSIBILITY FOR APPLICATION OF GIS TECHNOLOGIES IN RTB BOR GROUP
 MINING AND METALLURGY INSTITUTE BOR UDK: 622 ISSN: 2334-8836 (Štampano izdanje) ISSN: 2406-1395 (Online) UDK: 681.33:622.343(045)=111 doi:10.5937/mmeb1603021v Nenad Vušović *, Marko Vuković **, Igor Svrkota
What s New in Collector for ArcGIS (Aurora)
") What s New in Collector for ArcGIS (Aurora) Derek Law (dlaw@esri.com) Esri Apps Product Management @GIS_Bandit Oct 10 th, 2018 Agenda Product overview Use cases Preparing data for Collector for ArcGIS
What s New in Collector for ArcGIS (Aurora) Derek Law (dlaw@esri.com) Esri Apps Product Management @GIS_Bandit Oct 10 th, 2018 Agenda Product overview Use cases Preparing data for Collector for ArcGIS
GeoSUR SRTM 30-m / TPS
 GeoSUR SRTM 30-m / TPS Wm Matthew Cushing (USGS) 16 May 2013 U.S. Department of the Interior U.S. Geological Survey SRTM Mission Shuttle Radar Topography Mission (SRTM) Space Shuttle Endeavour during the
CAPE FARM MAPPER - an integrated spatial portal
 CAPE FARM MAPPER - an integrated spatial portal Skukuza Dr Mike Wallace June 2017 Overview of GIS applications in WCDoA Spatial information and technology has become indispensable across a wide range of
HISTORY OF GIS AND ESRI
 HISTORY OF GIS AND ESRI First Developed by Dr. Roger Tomlinson in Canada 1960 (CGIS Canadian geographic system) The system was designed to inventory land use and assist in the management of natural resources
Wetland Mapping. Wetland Mapping in the United States. State Wetland Losses 53% in Lower US. Matthew J. Gray University of Tennessee
 Wetland Mapping Caribbean Matthew J. Gray University of Tennessee Wetland Mapping in the United States Shaw and Fredine (1956) National Wetlands Inventory U.S. Fish and Wildlife Service is the principle
Existing Open Source Tools and Possibilities for Cadastre Systems
 Existing Open Source Tools and Possibilities for Cadastre Systems Gertrude Pieper Espada FIG Congress Sydney, 11-16 April 2010 What is FLOSS? What is open source? What open source software tools are available?
Towards Data-Driven Precision Agriculture using Open Data and Open Source Software
 Towards Data-Driven Precision Agriculture using Open Data and Open Source Software Jacob Høxbroe Jeppesen a,*, Rune Hylsberg Jacobsen a, Rasmus Nyholm Jørgensen a, Thomas Skjødeberg Toftegaard a a Department
Agricultural land-use from space. David Pairman and Heather North
 Agricultural land-use from space David Pairman and Heather North Talk Outline Motivation Challenges Different approach Paddock boundaries Classifications Examples Accuracy Issues Data sources Future possibilities
Development of Webbased. Tool for Tennessee
 Development of Webbased Farm Mapping Tool for Tennessee Southern Region Water Quality Conference, Oct. 24 2005 Forbes Walker and Alan Jolly Biosystems Engineering and SOIL SCIENCE Nutrient Management Planning
Geography for the 2020 Round of Census
 Boundaries Key Census Data EA Id Population Male Female EA Id Area EA Id Num HH Avg HH size Geography for the 2020 Round of Census Linda Peters, Esri lpeters@esri.com Integration of Statistical and Geospatial
Abstract. TECHNOFAME- A Journal of Multidisciplinary Advance Research. Vol.2 No. 2, (2013) Received: Feb.2013; Accepted Oct.
 Received: Feb.2013; Accepted Oct.") Vol.2 No. 2, 83-87 (2013) Received: Feb.2013; Accepted Oct. 2013 Landuse Pattern Analysis Using Remote Sensing: A Case Study of Morar Block, of Gwalior District, M.P. Subhash Thakur 1 Akhilesh Singh 2
Vol.2 No. 2, 83-87 (2013) Received: Feb.2013; Accepted Oct. 2013 Landuse Pattern Analysis Using Remote Sensing: A Case Study of Morar Block, of Gwalior District, M.P. Subhash Thakur 1 Akhilesh Singh 2
Technical Drafting, Geographic Information Systems and Computer- Based Cartography
 Technical Drafting, Geographic Information Systems and Computer- Based Cartography Project-Specific and Regional Resource Mapping Services Geographic Information Systems - Spatial Analysis Terrestrial
Country Report. KAZAKHSTAN DAN of SENTINEL ASIA INITIATIVE
 Country Report KAZAKHSTAN DAN of SENTINEL ASIA INITIATIVE Putrajaya, 2011 LAND RESOURCES OF KAZAKHSTAN Area 2,72 mln km 2 Population 16 Mln Land use Area Mln. ha % Territory of Republic 272,4 Agriculture
identify tile lines. The imagery used in tile lines identification should be processed in digital format.
 Question and Answers: Automated identification of tile drainage from remotely sensed data Bibi Naz, Srinivasulu Ale, Laura Bowling and Chris Johannsen Introduction: Subsurface drainage (popularly known
EnvSci 360 Computer and Analytical Cartography
 EnvSci 360 Computer and Analytical Cartography Lecture 7 Mapping Images, Surfaces, and 3-D Data Brief Overview of Imagery What is Imagery? A spatial data model that defines space as an array of equally
Introduction-Overview. Why use a GIS? What can a GIS do? Spatial (coordinate) data model Relational (tabular) data model
 data model Relational (tabular) data model") Introduction-Overview Why use a GIS? What can a GIS do? How does a GIS work? GIS definitions Spatial (coordinate) data model Relational (tabular) data model intro_gis.ppt 1 Why use a GIS? An extension
Introduction-Overview Why use a GIS? What can a GIS do? How does a GIS work? GIS definitions Spatial (coordinate) data model Relational (tabular) data model intro_gis.ppt 1 Why use a GIS? An extension
The use of satellite images to forecast agricultural production
 The use of satellite images to forecast agricultural production Artur Łączyński Central Statistical Office, Agriculture Department Niepodległości 208 Warsaw, Poland E-mail a.laczynski@stat.gov.pl DOI:
Outline Brief Overview MapPlace Website Data Delivery & Map Themes Digital Geology
 BRITISH COLUMBIA GEOLOGICAL SURVEY Kirk Hancock Pat Desjardins Nick Massey BRITISH COLUMBIA Ministry of Energy and Mines Ward Kilby acknowledged developer of MapPlace Outline Brief Overview MapPlace Website
Monitoring of grass cutting with Sentinel-1 time series
 Monitoring of grass cutting with Sentinel-1 time series pilot results and vision for operational service based on big data tools and cloud computing Kaupo Voormansik 21st MARS Conference November 25, 2015
C O P E R N I C U S F O R G I P R O F E S S I O N A L S
 C O P E R N I C U S F O R G I P R O F E S S I O N A L S Downstream Applications MALTA 2017-06-26 Pascal Lory, EUROGI EU EU EU www.copernicus.eu S c o p e Identifying urban housing density: Stella Ofori-Ampofo,
Dynamic Ontology Service for Historical Persons and Places Based on Crowdsourcing
 Dynamic Ontology Service for Historical Persons and Places Based on Crowdsourcing 22.1.2016, COST RRL WG2 Workshop Jouni Tuominen Semantic Computing Research Group (SeCo), http://seco.cs.aalto.fi, Aalto
The state-of-the-art of the Finnish SDI. Arctic SDI WG Meeting
 The state-of-the-art of the Finnish SDI Arctic SDI WG Meeting Moscow 8.9.2011 Esa Tiainen Development Centre 1 NATIONAL LAND SURVEY DOWN TO EARTH Contents Legal framework Coordination structure Network
Course overview. Grading and Evaluation. Final project. Where and When? Welcome to REM402 Applied Spatial Analysis in Natural Resources.
 Welcome to REM402 Applied Spatial Analysis in Natural Resources Eva Strand, University of Idaho Map of the Pacific Northwest from http://www.or.blm.gov/gis/ Where and When? Lectures Monday & Wednesday
GIS AND REMOTE SENSING FOR WATER RESOURCE MANAGEMENT
 GIS AND REMOTE SENSING FOR WATER RESOURCE MANAGEMENT G. GHIANNI, G. ADDEO, P. TANO CO.T.IR. Extension and experimental station for irrigation technique - Vasto (Ch) Italy. E-mail : ghianni@cotir.it, addeo@cotir.it,
Assessing Drought in Agricultural Area of central U.S. with the MODIS sensor
 Assessing Drought in Agricultural Area of central U.S. with the MODIS sensor Di Wu George Mason University Oct 17 th, 2012 Introduction: Drought is one of the major natural hazards which has devastating
ArcMap - EXPLORING THE DATABASE Part I. SPATIAL DATA FORMATS Part II
 Week 5 ArcMap - EXPLORING THE DATABASE Part I SPATIAL DATA FORMATS Part II topics of the week Exploring the Database More on the Table of Contents Exploration tools Identify, Find, Measure, Map tips, Hyperlink,
CENSUS MAPPING WITH GIS IN NAMIBIA. BY Mrs. Ottilie Mwazi Central Bureau of Statistics Tel: October 2007
 CENSUS MAPPING WITH GIS IN NAMIBIA BY Mrs. Ottilie Mwazi Central Bureau of Statistics E-mail: omwazi@npc.gov.na Tel: + 264 61 283 4060 October 2007 Content of Presentation HISTORICAL BACKGROUND OF CENSUS
Forecasting wheat yield in the Canadian Prairies using climatic and satellite data
 Prairie Perspectives 81 Forecasting wheat yield in the Canadian Prairies using climatic and satellite data V. Kumar, University of Manitoba C. E. Haque, Brandon University Abstract: Wheat yield forecasting
Data Aggregation with InfraWorks and ArcGIS for Visualization, Analysis, and Planning
 Data Aggregation with InfraWorks and ArcGIS for Visualization, Analysis, and Planning Stephen Brockwell President, Brockwell IT Consulting, Inc. Join the conversation #AU2017 KEYWORD Class Summary Silos
Land Surface Temperature Measurements From the Split Window Channels of the NOAA 7 Advanced Very High Resolution Radiometer John C.
 Land Surface Temperature Measurements From the Split Window Channels of the NOAA 7 Advanced Very High Resolution Radiometer John C. Price Published in the Journal of Geophysical Research, 1984 Presented
EUMETSAT s Support to Climate Services and User Support. Joachim Saalmüller
 EUMETSAT s Support to Climate Services and User Support Joachim Saalmüller 1 User Forum in Africa September 2016 Outline of my talk EUMETSAT in support of climate services Exploring our data and subscribing
PNCD ORIZONT
 PNCD ORIZONT 2000 2000-2002 Assimilation of remotely-sensed data of high repetitivity in process models ICPA Bucharest - ICPPT Fundulea contribution to the ADAM Project (2000-2002 period) Project manager:
QUICK IMAGE PROCESSING METHOD OF HJ SATELLITES APPLIED IN AGRICULTURE MONITORING
 International Journal of Complex Systems Computing, Sensing and Control Vol. 2, No. 1-2, pp. 1-8, 2014 Copyright 2014, TSI Press Printed in the USA. All rights reserved QUICK IMAGE PROCESSING METHOD OF
Week 8 Cookbook: Review and Reflection
 : Review and Reflection Week 8 Overview 8.1) Review and Reflection 8.2) Making Intelligent Maps: The map sheet as a blank canvas 8.3) Making Intelligent Maps: Base layers and analysis layers 8.4) ArcGIS
What is CERA? Coastal Emergency Risks Assessment
 What is CERA? Coastal Emergency Risks Assessment Visualization tool using OGC standards Displays the outputs from the ADCIRC storm surge model or other coastal models Represents the maps on interactive