Clark Regional Wastewater District
|
|
|
- Cathleen Marsh
- 6 years ago
- Views:
Transcription


1 2017 Clark Regional Wastewater District Infiltration and Inflow Report For Salmon Creek Treatment Plant February 12, 2018 In Compliance with the NPDES Waste Discharge Permit No. WA Special Condition S4.E
2
3 TABLE OF CONTENTS 2017 Clark Regional Wastewater District INFILTRATION AND INFLOW REPORT Overview... 1 Monitoring Program and Rehabilitation Projects... 3 Appendix Appendix A - Annual Infiltration/Inflow (I/I) Report (DOE form) Appendix B - Flow Analysis Data Appendix C - Monthly Flow and Appendix D - ERU and Sewer Line Data
4
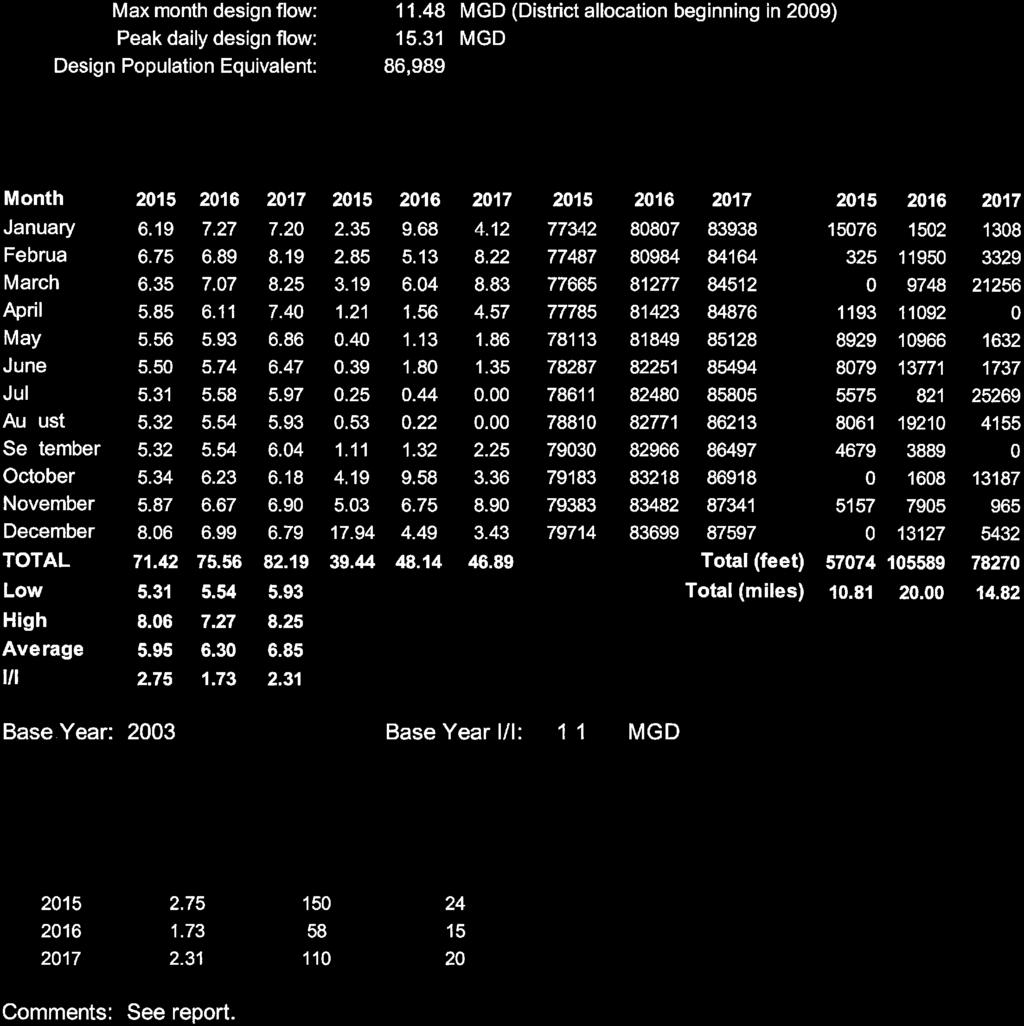
5 2017 Infiltration and Inflow Report Overview The Clark Regional Wastewater District (District) was formed in The District has always maintained a comprehensive construction specification, inspection and maintenance program to minimize infiltration and inflow (I/I) into the system. As a result, the system flow characteristics perform well below the non-excessive criteria as established in the EPA Infiltration/Inflow Analysis and Project Certification (Ecology publication 97-03). Beginning in 2016, the District began conveying a portion of the flow generated in the City of Ridgefield service area to the Salmon Creek Treatment Plant. Currently, all flow tributary to the Pioneer Canyon Pump Station is conveyed through the Discovery Corridor Wastewater Transmission System and ultimately to the Salmon Creek Treatment Plant. The average daily flow from the Pioneer Canyon Pump Station is about 0.14 (663 Equivalent Residential Units (ERUs). The Ridgefield Treatment Plant processes the remaining flow generated in Ridgefield. The additional flow to Salmon Creek is incorporated into this report. ANALYSIS The District s average dry weather and wet weather I/I rates are well below excessive. Average dry weather flows greater than 120 gallons per capita per day (gpcd) indicate excessive infiltration. Infiltration occurs during periods of high seasonal groundwater and dry weather with little or no rainfall. The District s infiltration remains well below excessive at only 79 gpcd. Average wet weather flows greater than 275 gpcd indicate excessive inflow. Inflow occurs during periods of wet weather with significant rainfall resulting in ponding and surface runoff. The District s inflow remains well below excessive at only 113 gpcd. For the purpose of this report, population calculations have been based on population equivalents. This method calculates a population based on the total number of ERUs multiplied by the planning assumption of people per ERU. This assumption is 2.43 people per ERU for the Salmon Creek Treatment Plant (CH2M HILL, 2004 SCTP Phase 4). The calculation for population equivalent includes commercial and industrial ERUs in addition to residents of the area. At the beginning of 2017, the District had approximately 33,877 ERU s with a population equivalent of roughly 82,320 in the Salmon Creek tributary area. The City of Ridgefield component adds another 567 ERUs with a population equivalent of about 1,379. Page 1
6 As shown in Appendix A, the District s 2017 I/I of 2.31 represent a 110% increase compared to the 2003 base year. To better understand I/I trends in the system, the District reviews the average monthly flows and rainfall for the available records between January 1997 and December That data shows that 2013 and 2003 represent the lowest I/I years on record. The District s I/I averaged 1.59 over the past 20 years. Reviewing years with similar rainfall patterns, the 2017 I/I does not appear to be out of trend with historical performance. Also, the excessive inflow and infiltration calculations do not lead us to believe that the system is experiencing higher than normal I/I. TABLE I/I AND RAINFALL Year Min of Average Monthly Flow Max of Average Monthly Flow I / I Annual Average Page 2
7 Monitoring Program and Rehabilitation Projects INTRODUCTION The District places an emphasis on good design and inspection to minimize I/I into the system. However, as pipes age, a variety of methods for the monitoring and identification of I/I are necessary to use. This includes yearly review of pump station records, treatment plant flow reports, trunk line flow monitoring, smoke testing, visual inspection of manholes and closed circuit television (CCTV) camera inspection. Through these efforts, the District is able to locate areas of concern for follow-up investigation and correction. CROSS-CONNECTIONS For issues on private property (i.e., stormwater cross connections, roof drains or broken laterals), the District contacts the homeowner and works with them to correct the situation. The District typically addresses issues that are within public right-of-way. All side sewer connections (between right-of-way and building envelope) are permitted and inspected by the District. NEW CONSTRUCTION The District addresses I/I by inspecting all new systems during construction, including all mainlines, manholes and individual laterals. In addition, during plan review and field inspection, the District reviews the need for inflow dishes or watertight locking lids to control inflow. The District addresses infiltration by requiring manhole joints to be externally sealed in areas of high groundwater, vacuum testing of 50% of all new manholes and air testing of all new gravity mainlines. FLOW MONITORING The District owns several FloDar ultrasonic flow meters that are used to measure flows where I/I may be suspected. The District also monitors all pump stations as well as four (4) motor operated valves (MOV s). Daily and annual review of the pump run times and flow data help to identify the potential for I/I. In addition, the two satellite service areas (Meadow Glade and Hockinson) that are served by STEP systems have individual flow meters at their termination. The District continues to deploy and collect flow data from FloDar ultrasonic flow meters during both wet and dry weather flows. That data is currently being used to calibrate the District s wet and dry weather flow model as part of the General Sewer Plan update. Page 3
8 REHABILITATION The District inspects all gravity mains and trunk sewers with CCTV cameras a minimum of every eight years to assess condition, I/I and other related issues. Results help inform the District s Six-Year Capital Program. The six-year program includes an I/I program as well as a Spot Repair program component. Both programs provide for completion of specific projects targeting the reduction of I/I in the system. The District completed manhole grouting at 15 locations in 2016, which will stop an estimated 25 gallons per minute of I/I, or 36,000 gallons per day. The District completed two (2) cured-in-place pipe contracts in 2017, to stop infiltration and rehabilitate existing concrete pipes. The next manhole grouting contract will be issued in Page 4
9 APPENDIX A ANNUAL INFILTRATION/INFLOW (I/I) REPORT
10


11
12
13 APPENDIX B FLOW ANALYSIS DATA
14
15 Salmon Creek Wastewater Management System - Clark Regional Wastewater District ANNUAL INFILTRATION/INFLOW REPORT 1/1/2017 to 12/31/2017 FLOW AND PRECIPITATION DATA POPULATION AND SEWER LINE DATA Average Monthly Flow () Total Monthly Precipitation (Inches) Population Served (Population Equivalent) Sewer Lines Added (Feet) MONTH Year Year MONTH Year Year January January February February March March B-1 April April May May June June July July August August September September October October November November December December Avg Flow / Total Rain Present Equivalent Total (feet) Low Month Total (miles) High Month Comments: Measured data presented in this report reflects the Clark Regional Wastewater District's capacity usage only. Battle Ground usage is reported separately.
16 Salmon Creek Wastewater Management System - Clark Regional Wastewater District ANNUAL INFILTRATION/INFLOW REPORT 1/1/2017 to 12/31/2017 DETERMINATION OF NON EXCESSIVE INFILTRATION DETERMINATION OF NON EXCESSIVE INFLOW EPA Infiltration Criteria 120 gpcd EPA Inflow Criteria 275 gpcd District Infiltration 79 gpcd District Inflow 113 gpcd B-2 Population Population Period Flow Rain Equivalent Period Flow Rain Equivalent Jan Feb Jan Feb Jan Feb Jan Feb Jan Feb Jan Feb Jan Feb Average Flow Highest () Inches Rain Average Flow Inches Rain () Comments: The seven day period of January 25 through Comments: The seven day period of February 14 through February January 31, 2017 was identified as a dry weather 20, 2017 was identified as a period of significant rainfall period within a period of seasonal high with surface ponding and runoff. February 20 was the groundwater. highest recorded daily flow during a storm event.
17 Salmon Creek Wastewater Management System - Clark Regional Wastewater District ANNUAL INFILTRATION/INFLOW REPORT 1/1/2017 to 12/31/2017 INFILTRATION/INFLOW SUMMARY PLANT DESIGN CAPACITY Year I/I % of % Over Max Base I/I Design Flow % 17% % 9% % 13% Peak Design Flow: Max Month Design Flow: Base Year: 2003 Design Population Equivalent: 86,989 People I/I: % 24% % 15% % 20% Comments: See Overview for I/I discussion. B-3 Average Flow () Average Flow and Precipitation Precipitation (Inches) Month 3 Average Flow () Total Monthly Precipitation (Inches) Comments: Design capacity represents total plant capacity. Present population and infiltration/inflow data included in this report represent Clark Regional Wastewater's usage only. Battle Ground usage is reported separately.
18
19 APPENDIX C MONTHLY FLOW AND RAINFALL
20
21 C-1 Salmon Creek Wastewater Treatment Plant Flow and Report Date Meadow Glade GPD Hockinson GPD Total BG Inf BG Only Total BG Eff Diff SC Inf SC Eff Diff BG SC 1/1/ /2/ /3/ /4/ /5/ /6/ /7/ /8/ /9/ /10/ /11/ /12/ /13/ /14/ /15/2017* 250, /16/2017* 250, /17/2017* 300, /18/ /19/ /20/ /21/ /22/ /23/ /24/ /25/ /26/ /27/ /28/ /29/ /30/ /31/ Total Min Max Average *Estimated Meadow Glade GPD
22 Salmon Creek Wastewater Treatment Plant Flow and Report C-2 Date Meadow Glade GPD Hockinson GPD Total BG Inf BG Only Total BG Eff Diff SC Inf SC Eff Diff BG SC 2/1/ /2/ /3/ /4/ /5/ /6/ /7/ /8/ /9/ /10/ /11/ /12/ /13/ /14/ /15/ /16/ /17/ /18/ /19/ /20/ /21/ /22/ /23/ /24/ /25/ /26/ /27/ /28/ Total Min Max Average
23 Salmon Creek Wastewater Treatment Plant Flow and Report C-3 Date Meadow Glade GPD Hockinson GPD Total BG Inf BG Only Total BG Eff Diff SC Inf SC Eff Diff BG SC 3/1/ /2/ /3/ /4/ /5/ /6/ /7/ /8/ /9/ /10/ /11/ /12/ /13/ /14/ /15/ /16/ /17/ /18/ /19/ /20/ /21/ /22/ /23/ /24/ /25/ /26/ /27/ /28/ /29/ /30/ /31/ Total Min Max Average
24 Salmon Creek Wastewater Treatment Plant Flow and Report C-4 Date Meadow Glade GPD Hockinson GPD Total BG Inf BG Only Total BG Eff Diff SC Inf SC Eff Diff BG SC 4/1/ /2/ /3/ /4/ /5/ /6/ /7/ /8/ /9/ /10/ /11/ /12/ /13/ /14/ /15/ /16/ /17/ /18/ /19/ /20/ /21/ /22/ /23/ /24/ /25/ /26/ /27/ /28/ /29/ /30/ Total Min Max Average
25 Salmon Creek Wastewater Treatment Plant Flow and Report C-5 Date Meadow Glade GPD Hockinson GPD Total BG Inf BG Only Total BG Eff Diff SC Inf SC Eff Diff BG SC 5/1/ /2/ /3/ /4/ /5/ /6/ /7/ /8/ /9/ /10/ /11/ /12/ /13/ /14/ /15/ /16/ /17/ /18/ /19/ /20/ /21/ /22/ /23/ /24/ /25/ /26/ /27/ /28/ /29/ /30/ /31/ Total Min Max Average
26 Salmon Creek Wastewater Treatment Plant Flow and Report C-6 Date Meadow Glade GPD Hockinson GPD Total BG Inf BG Only Total BG Eff Diff SC Inf SC Eff Diff BG SC 6/1/ /2/ /3/ /4/ /5/ /6/ /7/ /8/ /9/ /10/ /11/ /12/ /13/ /14/ /15/ /16/ /17/ /18/ /19/ /20/ /21/ /22/ /23/ /24/ /25/ /26/ /27/ /28/ /29/ /30/ Total Min Max Average
27 Salmon Creek Wastewater Treatment Plant Flow and Report C-7 Date Meadow Glade GPD Hockinson GPD Total BG Inf BG Only Total BG Eff Diff SC Inf SC Eff Diff BG SC 7/1/ /2/ /3/ /4/ /5/ /6/ /7/ /8/ /9/ /10/ /11/ /12/ /13/ /14/ /15/ /16/ /17/ /18/ /19/ /20/ /21/ /22/ /23/ /24/ /25/ /26/ /27/ /28/ /29/ /30/ /31/ Total Min Max Average
28 Salmon Creek Wastewater Treatment Plant Flow and Report C-8 Date Meadow Glade GPD Hockinson GPD Total BG Inf BG Only Total BG Eff Diff SC Inf SC Eff Diff BG SC 8/1/ /2/ /3/ /4/ /5/ /6/ /7/ /8/ /9/ /10/ /11/ /12/ /13/ /14/ /15/ /16/ /17/ /18/ /19/ /20/ /21/ /22/ /23/ /24/ /25/ /26/ /27/ /28/ /29/ /30/ /31/ Total Min Max Average
29 Salmon Creek Wastewater Treatment Plant Flow and Report C-9 Date Meadow Glade GPD Hockinson GPD Total BG Inf BG Only Total BG Eff Diff SC Inf SC Eff Diff BG SC 9/1/ /2/ /3/ /4/ /5/ /6/ /7/ /8/ /9/ /10/ /11/ /12/ /13/ /14/ /15/ /16/ /17/ /18/ /19/ /20/ /21/ /22/ /23/ /24/ /25/ /26/ /27/ /28/ /29/ /30/ Total Min Max Average
30 Salmon Creek Wastewater Treatment Plant Flow and Report C-10 Date Meadow Glade GPD Hockinson GPD Total BG Inf BG Only Total BG Eff Diff SC Inf SC Eff Diff BG SC 10/1/ /2/ /3/ /4/ /5/ /6/ /7/ /8/ /9/ /10/ /11/ /12/ /13/ /14/ /15/ /16/ /17/ /18/ /19/ /20/ /21/ /22/ /23/ /24/ /25/ /26/ /27/ /28/ /29/ /30/ /31/ Total Min Max Average
31 Salmon Creek Wastewater Treatment Plant Flow and Report C-11 Date Meadow Glade GPD Hockinson GPD Total BG Inf BG Only Total BG Eff Diff SC Inf SC Eff Diff BG SC 11/1/ /2/ /3/ /4/ /5/ /6/ /7/ /8/ /9/ /10/ /11/ /12/ /13/ /14/ /15/ /16/ /17/ /18/ /19/ /20/ /21/ /22/ /23/ /24/ /25/ /26/ /27/ /28/ /29/ /30/ Total Min Max Average
32 Salmon Creek Wastewater Treatment Plant Flow and Report C-12 Date Meadow Glade GPD Hockinson GPD Total BG Inf BG Only Total BG Eff Diff SC Inf SC Eff Diff BG SC 12/1/ /2/ /3/ /4/ /5/ /6/ /7/ /8/ /9/ /10/ /11/ /12/ /13/ /14/ /15/ /16/ /17/ /18/ /19/ /20/ /21/ /22/ /23/ /24/ /25/ /26/ /27/ /28/ /29/ /30/ /31/ Total Min Max Average
33 APPENDIX D ERU AND SEWER LINE DATA
34
35 CLARK REGIONAL WASTEWATER DISTRICT SALMON CREEK TREATMENT PLANT SEWER CONNECTION REPORT Year: Jan Dec 2017 Year to Date Multi Family/ Total Grand Line Construction Total ERU'S New Total Guesthomes Res/ New Total Total Line Total SCTP - All Month Residential Residential (*.8) Multi-Family Commercial Commercial ERU's Developer District Construction Miles Res 1,283.0 Multi-Family Balance ERU's Comm 30.3 Forward Total 1,598.5 Jan VTP Feb Res 50.0 Mar Multi-Family 48.0 D-1 Apr Comm 21.2 May Total Jun RTP Jul Res 84.0 Aug Multi-Family - Sep Comm - Oct Total 84.0 Nov Permits Dec SCTP 1320 Subtotals RTP 82 Total ERU's VTP 61 Total 1463 See reverse for explanation
36 D-2 January July September December SCTP Bowyers MarketPlace Retail D SCTP Brush Prairie Apartments SCTP Brush Prairie Apartments SCTP Brush Prairie Apartments NE 119th St Ste NE 122nd Ave NE 122nd Ave NE 122nd Ave Clear Choice Chiropractic 0.1 Bldg AA 9.6 Bldg S 11.2 Bldg K 8.0 SCTP Legacy Salmon Creek MOB A Bldg FF 9.6 Community Center/Office 1.0 Bldg L NE 139th St Ste 245 Bldg GG 6.4 SCTP Union Park Apartments Bldg V 8.0 Dr. Berinstein NE 124th Ave NE 139th St Ste 235 SCTP Yu Retail Bldg C 19.2 SCTP Blue Gables Tea House Childrens Center NE Highway NE 78th St SCTP Heathen Brewing Metro PCS 0.2 SCTP Montage Kennels Chandelier Bakery NE 119th St 1.4 SCTP ULID NE 72nd Ave 3.8 SCTP Northgate Shopping Center NE Highway NE Hazel Dell Ave Abarrotes Lupita 0.1 Pro Nails 0.2 February SCTP Union Prairie Business Park 3A October SCTP NE 20th Ave Commercial SCTP Aadland Office Building NE 113th St SCTP Brush Prairie Apartments NE 20th Ave 2702 NE 78th St Ste 104 Shell Building NE 122nd Ave Dominos Pizza 1.0 Dental Expansion 0.1 SCTP Union Prairie Business Park 3B Bldg R 11.2 SCTP Heritage Village ` NE 113th St Bldg T NE 81st St Phoenix Excavating 1.2 Bldg P 8.0 Office 1.0 March 2.5 Bldg Q SCTP Felida Village SCTP Union Park Apartments 3600 NW 119th St August NE 124th Ave Mt Tabor Pizza 2.8 SCTP Brush Prairie Apartments Bldg B 9.6 SCTP Lydia Center NE 122nd Ave NE 15th Ave Ste 103 Bldg BB 11.2 Audio Source 0.2 Bldg DD 8.0 November 9811 NE 15th Ave Ste 105 Bldg EE 9.6 SCTP Brush Prairie Apartments Brothers Cascadia Brewing 1.2 Bldg CC NE 122nd Ave Bldg M 8.0 SCTP Union Park Apartments Office Bldg N 8.0 June NE 124th Ave 1.0 Bldg U 11.2 SCTP Brush Prairie Apartments SCTP Yu Retail SCTP Heritage Village Apartments NE 122nd Ave 8605 NE Highway NE 81st St Bldg B 8.0 Gogo Sushi 1.8 Bldg A 3.2 Bldg C 9.6 SCTP Yearout Business Park Bldg B 3.2 Bldg Z NE 95th St Bldg G Precision Auto 1.7 Bldg H 15.2 SCTP Legacy Restoration SCTP ULID 1 Bldg K NW 36th Ave NE Highway 99 Bldg L 11.2 SCTP Miller Paint Cristo Vive 0.2 SCTP Union Park Apartments NE 20th Ave SCTP Legacy Salmon Creek MOB A NE 124th Ave Bridge Chiropractic NE 139th St Ste 205 Bldg G 9.6 SCTP Kirkwood Offices Building 2 LMG Neurology Clinic NE 129th St Ste SCTP Legacy Hospital WFG National Title NE 139th St Ste Child and Adolescent Clinic 1.4 SCTP Westland Industrial Bldgs D1 D NE 144th St Shell Building D1 1.0 Shell Building D
37 CLARK REGIONAL WASTEWATER DISTRICT MEADOWGLADE AREA SALMON CREEK TREATMENT PLANT SEWER CONNECTION REPORT Year: Jan Dec 2017 Multi Family/ Total Grand Line Construction Total New Total Guesthomes Res/ New Total Total Line Total Month Residential Residential (*.8) Multi-Family Commercial Commercial ERU's Developer District Construction Miles Balance ERU's Forward Jan Feb D-3 Mar Apr May Jun Jul Aug Sep Oct Nov Dec Subtotals Total ERU's
38 D-4
39 CLARK REGIONAL WASTEWATER DISTRICT HOCKINSON AREA SALMON CREEK TREATMENT PLANT SEWER CONNECTION REPORT Year: Jan Dec 2017 Multi Family/ Total Grand Line Construction Total New Total Guesthomes Res/ New Total Total Line Total Month Residential Residential (*.8) Multi-Family Commercial Commercial ERU's Developer District Construction Miles Balance ERU's Forward Jan Feb Mar D-5 Apr May Jun Jul Aug Sep Oct Nov Dec Subtotals Total ERU's See next page for explanation
40 SCTP H SCTP H May Hockinson Market Expansion NE 182nd Ave December Hockinson Middle School NE 182nd Ave Increased capacity D-6
41 CLARK REGIONAL WASTEWATER DISTRICT RIDGEFIELD AREA SALMON CREEK TREATMENT PLANT SEWER CONNECTION REPORT Year: Jan Dec 2017 Multi Family/ Total Grand Line Construction Total New Total Guesthomes Res/ New Total Total Line Total Month Residential Residential (*.8) Multi-Family Commercial Commercial ERU's Developer District Construction Miles Balance ERU's Forward Jan Feb Mar D-7 Apr May Jun Jul Aug Sep Oct Nov Dec Subtotals Total ERU's See next page for explanation
42 SCTP R April ICD Coating 7350 S Union Ridge Parkway Ste 101 Boss Products D-8
Clark Regional Wastewater District
 2016 Clark Regional Wastewater District Infiltration and Inflow Report For Salmon Creek Treatment Plant February 13, 2017 In Compliance with the NPDES Waste Discharge Permit No. WA-002363-9 Special Condition
WHEN IS IT EVER GOING TO RAIN? Table of Average Annual Rainfall and Rainfall For Selected Arizona Cities
 WHEN IS IT EVER GOING TO RAIN? Table of Average Annual Rainfall and 2001-2002 Rainfall For Selected Arizona Cities Phoenix Tucson Flagstaff Avg. 2001-2002 Avg. 2001-2002 Avg. 2001-2002 October 0.7 0.0
Estimating Sewage System Flows
 9 Estimating Sewage System Flows DWSD Wholesale Sewer Rates 201 In this module, you will learn the sources of dry and wet weather flows and how these flows are estimated. Three different tools are used
Chiang Rai Province CC Threat overview AAS1109 Mekong ARCC
 Chiang Rai Province CC Threat overview AAS1109 Mekong ARCC This threat overview relies on projections of future climate change in the Mekong Basin for the period 2045-2069 compared to a baseline of 1980-2005.
Jackson County 2013 Weather Data
 Jackson County 2013 Weather Data 61 Years of Weather Data Recorded at the UF/IFAS Marianna North Florida Research and Education Center Doug Mayo Jackson County Extension Director 1952-2008 Rainfall Data
REDWOOD VALLEY SUBAREA
 Independent Science Review Panel Conceptual Model of Watershed Hydrology, Surface Water and Groundwater Interactions and Stream Ecology for the Russian River Watershed Appendices A-1 APPENDIX A A-2 REDWOOD
PRELIMINARY ENGINEERING REPORT FOR SANITARY SEWER COLLECTION SYSTEM OSKALOOSA, IOWA 2017
 PRELIMINARY ENGINEERING REPORT FOR SANITARY SEWER COLLECTION SYSTEM OSKALOOSA, IOWA 2017 PRELIMINARY ENGINEERING REPORT FOR SANITARY SEWER COLLECTION SYSTEM OSKALOOSA, IOWA 2017 I hereby certify that this
February 10, Mr. Jeff Smith, Chairman Imperial Valley Water Authority E County Road 1000 N Easton, IL Dear Chairman Smith:
 February 1, 1 Mr. Jeff Smith, Chairman Imperial Valley Water Authority 8 E County Road 1 N Easton, IL Dear Chairman Smith: The Illinois State Water Survey (ISWS), under contract to the Imperial Valley
Champaign-Urbana 2001 Annual Weather Summary
 Champaign-Urbana 2001 Annual Weather Summary ILLINOIS STATE WATER SURVEY 2204 Griffith Dr. Champaign, IL 61820 wxobsrvr@sws.uiuc.edu Maria Peters, Weather Observer January: After a cold and snowy December,
Flow Monitoring in the Collection System September 11, 2014
 Flow Monitoring in the Collection System September 11, 2014 FISHBECK, THOMPSON, CARR, & HUBER INC. Lori Lloyd, PE, LEED AP BD+C Definitions Why Flow Monitor? Flow Monitoring Applications Site Selection
Stream Discharge and the Water Budget
 Regents Earth Science Unit 6: Water Cycle & Climate Name: Lab # Stream Discharge and the Water Budget Introduction: The United States Geological Survey (USGS) measures and publishes values for the daily
Typical Hydrologic Period Report (Final)
") (DELCORA) (Final) November 2015 (Updated April 2016) CSO Long-Term Control Plant Update REVISION CONTROL REV. NO. DATE ISSUED PREPARED BY DESCRIPTION OF CHANGES 1 4/26/16 Greeley and Hansen Pg. 1-3,
(DELCORA) (Final) November 2015 (Updated April 2016) CSO Long-Term Control Plant Update REVISION CONTROL REV. NO. DATE ISSUED PREPARED BY DESCRIPTION OF CHANGES 1 4/26/16 Greeley and Hansen Pg. 1-3,
Drought Characterization. Examination of Extreme Precipitation Events
 Drought Characterization Examination of Extreme Precipitation Events Extreme Precipitation Events During the Drought For the drought years (1999-2005) daily precipitation data was analyzed to find extreme
Rainfall Observations in the Loxahatchee River Watershed
 Rainfall Observations in the Loxahatchee River Watershed Richard C. Dent Loxahatchee River District September 1997 Introduction Rain is a common occurrence in south Florida, yet its presence or absence
Jackson County 2018 Weather Data 67 Years of Weather Data Recorded at the UF/IFAS Marianna North Florida Research and Education Center
 Jackson County 2018 Weather Data 67 Years of Weather Data Recorded at the UF/IFAS Marianna North Florida Research and Education Center Doug Mayo Jackson County Extension Director 1952-2008 Rainfall Data
Memo. I. Executive Summary. II. ALERT Data Source. III. General System-Wide Reporting Summary. Date: January 26, 2009 To: From: Subject:
 Memo Date: January 26, 2009 To: From: Subject: Kevin Stewart Markus Ritsch 2010 Annual Legacy ALERT Data Analysis Summary Report I. Executive Summary The Urban Drainage and Flood Control District (District)
The Climate of Payne County
 The Climate of Payne County Payne County is part of the Central Great Plains in the west, encompassing some of the best agricultural land in Oklahoma. Payne County is also part of the Crosstimbers in the
The Climate of Grady County
 The Climate of Grady County Grady County is part of the Central Great Plains, encompassing some of the best agricultural land in Oklahoma. Average annual precipitation ranges from about 33 inches in northern
The Climate of Murray County
 The Climate of Murray County Murray County is part of the Crosstimbers. This region is a transition between prairies and the mountains of southeastern Oklahoma. Average annual precipitation ranges from
Champaign-Urbana 2000 Annual Weather Summary
 Champaign-Urbana 2000 Annual Weather Summary ILLINOIS STATE WATER SURVEY 2204 Griffith Dr. Champaign, IL 61820 wxobsrvr@sws.uiuc.edu Maria Peters, Weather Observer January: January started on a mild note,
The Climate of Seminole County
 The Climate of Seminole County Seminole County is part of the Crosstimbers. This region is a transition region from the Central Great Plains to the more irregular terrain of southeastern Oklahoma. Average
The Climate of Bryan County
 The Climate of Bryan County Bryan County is part of the Crosstimbers throughout most of the county. The extreme eastern portions of Bryan County are part of the Cypress Swamp and Forest. Average annual
NATIONAL HYDROPOWER ASSOCIATION MEETING. December 3, 2008 Birmingham Alabama. Roger McNeil Service Hydrologist NWS Birmingham Alabama
 NATIONAL HYDROPOWER ASSOCIATION MEETING December 3, 2008 Birmingham Alabama Roger McNeil Service Hydrologist NWS Birmingham Alabama There are three commonly described types of Drought: Meteorological drought
The Climate of Marshall County
 The Climate of Marshall County Marshall County is part of the Crosstimbers. This region is a transition region from the Central Great Plains to the more irregular terrain of southeastern Oklahoma. Average
Climate Change and Water Supply Research. Drought Response Workshop October 8, 2013
 Climate Change and Water Supply Research Drought Response Workshop October 8, 2013 DWR Photo Oroville Reservoir, 2009 Talk Overview Expectations History Atmospheric Rivers and Water Supply Current Research
Sanitary Sewer Flow Monitoring and Inflow/Infiltration Study
 Sanitary Sewer Flow Monitoring and Inflow/Infiltration Study 2016/2017 Results & 2017/2018 Plan May 2, 2018 Angel Mejia, P.E., Project Manager Oliver Pohl, P.E., Sr. Project Engineer Nicole Kwan, P.E.,
Jackson County 2014 Weather Data
 Jackson County 2014 Weather Data 62 Years of Weather Data Recorded at the UF/IFAS Marianna North Florida Research and Education Center Doug Mayo Jackson County Extension Director 1952-2008 Rainfall Data
January 22, Coronado National Forest 300 West Congress Street Tucson, AZ Jim Upchurch, Forest Supervisor. Dear Mr.
 January 22, 2015 Coronado National Forest 300 West Congress Street Tucson, AZ 85701 Attn: Jim Upchurch, Forest Supervisor Dear Mr. Upchurch: In your letter dated January 16, 2015, you requested that Hudbay
Changing Hydrology under a Changing Climate for a Coastal Plain Watershed
 Changing Hydrology under a Changing Climate for a Coastal Plain Watershed David Bosch USDA-ARS, Tifton, GA Jeff Arnold ARS Temple, TX and Peter Allen Baylor University, TX SEWRU Objectives 1. Project changes
The Climate of Pontotoc County
 The Climate of Pontotoc County Pontotoc County is part of the Crosstimbers. This region is a transition region from the Central Great Plains to the more irregular terrain of southeast Oklahoma. Average
Champaign-Urbana 1998 Annual Weather Summary
 Champaign-Urbana 1998 Annual Weather Summary ILLINOIS STATE WATER SURVEY Audrey Bryan, Weather Observer 2204 Griffith Dr. Champaign, IL 61820 wxobsrvr@sparc.sws.uiuc.edu The development of the El Nìno
Application of Real-Time Rainfall Information System to CSO control. 2 October 2011 Naruhito Funatsu METAWATER Co., Ltd.
 Application of Real-Time Rainfall Information System to CSO control 2 October 2011 Naruhito Funatsu METAWATER Co., Ltd. Presentation Points Objectives To verify the applicability of the real-time rainfall
2015 Fall Conditions Report
 2015 Fall Conditions Report Prepared by: Hydrologic Forecast Centre Date: December 21 st, 2015 Table of Contents Table of Figures... ii EXECUTIVE SUMMARY... 1 BACKGROUND... 2 SUMMER AND FALL PRECIPITATION...
Missouri River Basin Water Management
 Missouri River Basin Water Management US Army Corps of Engineers Missouri River Navigator s Meeting February 12, 2014 Bill Doan, P.E. Missouri River Basin Water Management US Army Corps of Engineers BUILDING
Suppression of colonies of Reticulitermes spp. using the Sentricon termite colony elimination system: : A case study in Chatsworth, CA
 Suppression of colonies of Reticulitermes spp. using the Sentricon termite colony elimination system: : A case study in Chatsworth, CA Gail M. Getty, MS, Chris Solek, MS, Ron 1 1 Sbragia, Ph.D., Michael
Determine the trend for time series data
 Extra Online Questions Determine the trend for time series data Covers AS 90641 (Statistics and Modelling 3.1) Scholarship Statistics and Modelling Chapter 1 Essent ial exam notes Time series 1. The value
The Climate of Kiowa County
 The Climate of Kiowa County Kiowa County is part of the Central Great Plains, encompassing some of the best agricultural land in Oklahoma. Average annual precipitation ranges from about 24 inches in northwestern
WASTEWATER FLOW COMPONENTS
 Chapter 3 WASTEWATER FLOW COMPONENTS 3.1 INTRODUCTION A sanitary sewer collection system receives two flow components: dry weather flow (DWF) and wet weather flow (WWF). The Base Wastewater Flow (BWF)
PRELIMINARY DRAFT FOR DISCUSSION PURPOSES
 Memorandum To: David Thompson From: John Haapala CC: Dan McDonald Bob Montgomery Date: February 24, 2003 File #: 1003551 Re: Lake Wenatchee Historic Water Levels, Operation Model, and Flood Operation This
Technical Note: Hydrology of the Lukanga Swamp, Zambia
 Technical Note: Hydrology of the Lukanga Swamp, Zambia Matthew McCartney July 7 Description The Lukanga swamp is located approximately 5km west of the city of Kabwe, in the Central province of Zambia,
A Report on a Statistical Model to Forecast Seasonal Inflows to Cowichan Lake
 A Report on a Statistical Model to Forecast Seasonal Inflows to Cowichan Lake Prepared by: Allan Chapman, MSc, PGeo Hydrologist, Chapman Geoscience Ltd., and Former Head, BC River Forecast Centre Victoria
The Climate of Haskell County
 The Climate of Haskell County Haskell County is part of the Hardwood Forest. The Hardwood Forest is characterized by its irregular landscape and the largest lake in Oklahoma, Lake Eufaula. Average annual
The Climate of Texas County
 The Climate of Texas County Texas County is part of the Western High Plains in the north and west and the Southwestern Tablelands in the east. The Western High Plains are characterized by abundant cropland
A Review of the 2007 Water Year in Colorado
 A Review of the 2007 Water Year in Colorado Nolan Doesken Colorado Climate Center, CSU Mike Gillespie Snow Survey Division, USDA, NRCS Presented at the 28 th Annual AGU Hydrology Days, March 26, 2008,
Technical Memorandum. City of Salem, Stormwater Management Design Standards. Project No:
 Technical Memorandum 6500 SW Macadam Avenue, Suite 200 Portland, Oregon, 97239 Tel: 503-244-7005 Fax: 503-244-9095 Prepared for: Project Title: City of Salem, Oregon City of Salem, Stormwater Management
Jackson County 2019 Weather Data 68 Years of Weather Data Recorded at the UF/IFAS Marianna North Florida Research and Education Center
 Jackson County 2019 Weather Data 68 Years of Weather Data Recorded at the UF/IFAS Marianna North Florida Research and Education Center Doug Mayo Jackson County Extension Director 1952-2008 Rainfall Data
Inflow and Infiltration. John Sorrell, P.E. City of Raleigh Public Utilities Department
 Inflow and Infiltration John Sorrell, P.E. City of Raleigh Public Utilities Department 1 Raleigh s History with I&I Our initial system was designed in 1888. Treatment began in the 1950 s What is I & I?
STATISTICAL FORECASTING and SEASONALITY (M. E. Ippolito; )
") STATISTICAL FORECASTING and SEASONALITY (M. E. Ippolito; 10-6-13) PART I OVERVIEW The following discussion expands upon exponential smoothing and seasonality as presented in Chapter 11, Forecasting, in
STATISTICAL FORECASTING and SEASONALITY (M. E. Ippolito; 10-6-13) PART I OVERVIEW The following discussion expands upon exponential smoothing and seasonality as presented in Chapter 11, Forecasting, in
2001 ANNUAL REPORT on INTERBASIN TRANSFERS for RTP South and the Towns of Cary, Apex, and Morrisville
 2001 ANNUAL REPORT on INTERBASIN TRANSFERS for RTP South and the Towns of Cary, Apex, and Morrisville Prepared for: Town of Cary Town of Apex Town of Morrisville RTP South/Wake County Submitted to: North
Lower Tuolumne River Accretion (La Grange to Modesto) Estimated daily flows ( ) for the Operations Model Don Pedro Project Relicensing
 Estimated daily flows ( ) for the Operations Model Don Pedro Project Relicensing") Lower Tuolumne River Accretion (La Grange to Modesto) Estimated daily flows (1970-2010) for the Operations Model Don Pedro Project Relicensing 1.0 Objective Using available data, develop a daily time series
Lower Tuolumne River Accretion (La Grange to Modesto) Estimated daily flows (1970-2010) for the Operations Model Don Pedro Project Relicensing 1.0 Objective Using available data, develop a daily time series
Champaign-Urbana 1999 Annual Weather Summary
 Champaign-Urbana 1999 Annual Weather Summary ILLINOIS STATE WATER SURVEY 2204 Griffith Dr. Champaign, IL 61820 wxobsrvr@sws.uiuc.edu Maria Peters, Weather Observer A major snowstorm kicked off the new
Significant Rainfall and Peak Sustained Wind Estimates For Downtown San Francisco
 Significant Rainfall and Peak Sustained Wind Estimates For Downtown San Francisco Report Prepared by John P. Monteverdi, PhD, CCM July 30, 1998 Mayacamas Weather Consultants 1. Impact of Location The location
Drought in Southeast Colorado
 Drought in Southeast Colorado Nolan Doesken and Roger Pielke, Sr. Colorado Climate Center Prepared by Tara Green and Odie Bliss http://climate.atmos.colostate.edu 1 Historical Perspective on Drought Tourism
Mountain View Community Shuttle Monthly Operations Report
 Mountain View Community Shuttle Monthly Operations Report December 6, 2018 Contents Passengers per Day, Table...- 3 - Passengers per Day, Chart...- 3 - Ridership Year-To-Date...- 4 - Average Daily Ridership
2. PHYSICAL SETTING FINAL GROUNDWATER MANAGEMENT PLAN. 2.1 Topography. 2.2 Climate
 FINAL GROUNDWATER MANAGEMENT PLAN 2. PHYSICAL SETTING Lassen County is a topographically diverse area at the confluence of the Cascade Range, Modoc Plateau, Sierra Nevada and Basin and Range geologic provinces.
San Francisco Public Utilities Commission Hydrological Conditions Report For March 2016
 San Francisco Public Utilities Commission Hydrological Conditions Report For March 2016 J. Chester, C. Graham, A. Mazurkiewicz, & M. Tsang, April 7, 2016 Snow Surveyor Chris Graham crossing Huckleberry
January 25, Summary
 January 25, 2013 Summary Precipitation since the December 17, 2012, Drought Update has been slightly below average in parts of central and northern Illinois and above average in southern Illinois. Soil
PREDICTING SOIL SUCTION PROFILES USING PREVAILING WEATHER
 PREDICTING SOIL SUCTION PROFILES USING PREVAILING WEATHER Ronald F. Reed, P.E. Member, ASCE rreed@reed-engineering.com Reed Engineering Group, Ltd. 2424 Stutz, Suite 4 Dallas, Texas 723 214-3-6 Abstract
Meteorological Data recorded at Armagh Observatory from 1795 to 2001: Volume I - Daily, Monthly and Annual Rainfall
 Meteorological Data recorded at Armagh Observatory from 1795 to 2001: Volume I - Daily, Monthly and Annual Rainfall 1838-2001 A. M. García-Suárez, C.J. Butler, D. Cardwell, A.D.S. Coughlin, A. Donnelly,
ZUMWALT WEATHER AND CLIMATE ANNUAL REPORT ( )
") ZUMWALT WEATHER AND CLIMATE ANNUAL REPORT (26-29) FINAL DRAFT (9 AUGUST 21) J.D. HANSEN 1, R.V. TAYLOR 2, AND V.S. JANSEN 3 INTRODUCTION The Zumwalt Prairie in northeastern Oregon is a unique grassland
ZUMWALT WEATHER AND CLIMATE ANNUAL REPORT (26-29) FINAL DRAFT (9 AUGUST 21) J.D. HANSEN 1, R.V. TAYLOR 2, AND V.S. JANSEN 3 INTRODUCTION The Zumwalt Prairie in northeastern Oregon is a unique grassland
CHAPTER-11 CLIMATE AND RAINFALL
 CHAPTER-11 CLIMATE AND RAINFALL 2.1 Climate Climate in a narrow sense is usually defined as the "average weather", or more rigorously, as the statistical description in terms of the mean and variability
2 Precipitation and Evaporation
 Zone 7 Water Agency 2.1 Program Description 2 Precipitation and Evaporation This section describes Zone 7's Climatological Monitoring Program which tracks rainfall and evaporation in the Valley. Zone 7
The Climate of Oregon Climate Zone 3 Southwest Interior
 .k) 105 Unbound issue " " 1 4oes not circulate C4P. Special Report 915 May 1993 The Climate of Oregon Climate Zone 3 Southwest Interior Property of OREGON STATE UNIVERSITY Library Serials Corvallis, OR
Lake Winnebago Regulation Meeting
 Lake Winnebago Regulation Meeting USACE Detroit District October 9, 2014 US Army Corps of Engineers Agenda Basin Overview Major Stakeholders Maintenance a and Repair Work Weather Conditions 2013-20142014
ANNUAL CLIMATE REPORT 2016 SRI LANKA
 ANNUAL CLIMATE REPORT 2016 SRI LANKA Foundation for Environment, Climate and Technology C/o Mahaweli Authority of Sri Lanka, Digana Village, Rajawella, Kandy, KY 20180, Sri Lanka Citation Lokuhetti, R.,
Evapo-transpiration Losses Produced by Irrigation in the Snake River Basin, Idaho
 Nov 7, 2007 DRAFT Evapo-transpiration Losses Produced by Irrigation in the Snake River Basin, Idaho Wendell Tangborn and Birbal Rana HyMet Inc. Vashon Island, WA Abstract An estimated 8 MAF (million acre-feet)
2 Groundwater Basin Monitoring
 Zone 7 Water Agency 2 Groundwater Basin Monitoring Programs 2.1 Climatological Monitoring 2 Groundwater Basin Monitoring Programs This section describes Zone 7's Climatological Monitoring Program which
Final Report. COMET Partner's Project. University of Texas at San Antonio
 Final Report COMET Partner's Project University: Name of University Researcher Preparing Report: University of Texas at San Antonio Dr. Hongjie Xie National Weather Service Office: Name of National Weather
Hydrologic Conditions in the Delaware River Basin
 2017 Hydrologic Conditions in the Delaware River Basin Prepared by Operations Staff June 2018 Hydrologic Highlights Hydrologic Conditions in the Delaware River Basin Annual Report 2017 At the start of
Table 1 - Infiltration Rates
 Stantec Consulting Ltd. 100-300 Hagey Boulevard, Waterloo ON N2L 0A4 November 14, 2017 File: 161413228/10 Attention: Mr. Michael Witmer, BES, MPA, MCIP, RPP City of Guelph 1 Carden Street Guelph ON N1H
P7.7 A CLIMATOLOGICAL STUDY OF CLOUD TO GROUND LIGHTNING STRIKES IN THE VICINITY OF KENNEDY SPACE CENTER, FLORIDA
 P7.7 A CLIMATOLOGICAL STUDY OF CLOUD TO GROUND LIGHTNING STRIKES IN THE VICINITY OF KENNEDY SPACE CENTER, FLORIDA K. Lee Burns* Raytheon, Huntsville, Alabama Ryan K. Decker NASA, Marshall Space Flight
2016 Meteorology Summary
 2016 Meteorology Summary New Jersey Department of Environmental Protection AIR POLLUTION AND METEOROLOGY Meteorology plays an important role in the distribution of pollution throughout the troposphere,
GAMINGRE 8/1/ of 7
 FYE 09/30/92 JULY 92 0.00 254,550.00 0.00 0 0 0 0 0 0 0 0 0 254,550.00 0.00 0.00 0.00 0.00 254,550.00 AUG 10,616,710.31 5,299.95 845,656.83 84,565.68 61,084.86 23,480.82 339,734.73 135,893.89 67,946.95
Sanitary Sewer Flow Monitoring Study City of Grandville
 Sanitary Sewer Flow Monitoring Study City of Grandville Prepared for: City of Grandville Kent County, Michigan Report by: Moore & Bruggink Consulting Engineers Grand Rapids, Michigan 13169.1 March 214
3.0 TECHNICAL FEASIBILITY
 3.0 TECHNICAL FEASIBILITY 3.1 INTRODUCTION To enable seasonal storage and release of water from Lake Wenatchee, an impoundment structure would need to be constructed on the lake outlet channel. The structure
Three main areas of work:
 Task 2: Climate Information 1 Task 2: Climate Information Three main areas of work: Collect historical and projected weather and climate data Conduct storm surge and wave modeling, sea-level rise (SLR)
Attachment B to Technical Memorandum No.2. Operations Plan of Ross Valley Detention Basins
 Attachment B to Technical Memorandum No.2 Operations Plan of Ross Valley Detention Basins Operations Plan of Ross Valley Detention Basins Stetson Engineers Inc. January 26, 2011 1.0 Introduction Achieving
Weather History on the Bishop Paiute Reservation
 Weather History on the Bishop Paiute Reservation -211 For additional information contact Toni Richards, Air Quality Specialist 76 873 784 toni.richards@bishoppaiute.org Updated 2//214 3:14 PM Weather History
SEPTEMBER 2013 REVIEW
 Monthly Long Range Weather Commentary Issued: October 21, 2013 Steven A. Root, CCM, President/CEO sroot@weatherbank.com SEPTEMBER 2013 REVIEW Climate Highlights The Month in Review The average temperature
Climatography of the United States No
 Climate Division: AK 5 NWS Call Sign: ANC Month (1) Min (2) Month(1) Extremes Lowest (2) Temperature ( F) Lowest Month(1) Degree s (1) Base Temp 65 Heating Cooling 90 Number of s (3) Jan 22.2 9.3 15.8
COUNTRY REPORT. Jakarta. July, th National Directorate of Meteorology and Geophysics of Timor-Leste (DNMG)
") The Southeastern Asia-Oceania Flash Flood COUNTRY REPORT Jakarta. July, 10-12 th 2017 National Directorate of Meteorology and Geophysics of Timor-Leste (DNMG) Carla Feritas and Crisostimo Lobato Democratic
The Southeastern Asia-Oceania Flash Flood COUNTRY REPORT Jakarta. July, 10-12 th 2017 National Directorate of Meteorology and Geophysics of Timor-Leste (DNMG) Carla Feritas and Crisostimo Lobato Democratic
Missouri River Basin Water Management Monthly Update
 Missouri River Basin Water Management Monthly Update Participating Agencies 255 255 255 237 237 237 0 0 0 217 217 217 163 163 163 200 200 200 131 132 122 239 65 53 80 119 27 National Oceanic and Atmospheric
Missouri River Basin Water Management Monthly Update
 Missouri River Basin Water Management Monthly Update Participating Agencies 255 255 255 237 237 237 0 0 0 217 217 217 163 163 163 200 200 200 131 132 122 239 65 53 80 119 27 National Oceanic and Atmospheric
Colorado s 2003 Moisture Outlook
 Colorado s 2003 Moisture Outlook Nolan Doesken and Roger Pielke, Sr. Colorado Climate Center Prepared by Tara Green and Odie Bliss http://climate.atmos.colostate.edu How we got into this drought! Fort
San Francisco Public Utilities Commission Hydrological Conditions Report For April 2014
 San Francisco Public Utilities Commission Hydrological Conditions Report For April 2014 J. Chester, C. Graham, A. Mazurkiewicz, & M. Tsang, May 13, 2014 Snow in the High Country The view from Bond Pass
Geostatistical Analysis of Rainfall Temperature and Evaporation Data of Owerri for Ten Years
 Atmospheric and Climate Sciences, 2012, 2, 196-205 http://dx.doi.org/10.4236/acs.2012.22020 Published Online April 2012 (http://www.scirp.org/journal/acs) Geostatistical Analysis of Rainfall Temperature
Communicating Climate Change Consequences for Land Use
 Communicating Climate Change Consequences for Land Use Site: Prabost, Skye. Event: Kyle of Lochalsh, 28 th February 28 Further information: http://www.macaulay.ac.uk/ladss/comm_cc_consequences.html Who
Multivariate Regression Model Results
 Updated: August, 0 Page of Multivariate Regression Model Results 4 5 6 7 8 This exhibit provides the results of the load model forecast discussed in Schedule. Included is the forecast of short term system
Climate Adaptation Challenges for Boston s Water and Sewer Systems
 National Association of Flood & Stormwater Management Agencies Climate Adaptation Challenges for Boston s Water and Sewer Systems John P Sullivan P.E. October 15,2014 Boston 1630 Boston 1630-2012 Boston
2019 Settlement Calendar for ASX Cash Market Products. ASX Settlement
 2019 Settlement Calendar for ASX Cash Market Products ASX Settlement Settlement Calendar for ASX Cash Market Products 1 ASX Settlement Pty Limited (ASX Settlement) operates a trade date plus two Business
Local Ctimatotogical Data Summary White Hall, Illinois
 SWS Miscellaneous Publication 98-5 STATE OF ILLINOIS DEPARTMENT OF ENERGY AND NATURAL RESOURCES Local Ctimatotogical Data Summary White Hall, Illinois 1901-1990 by Audrey A. Bryan and Wayne Armstrong Illinois
ENGINE SERIAL NUMBERS
 ENGINE SERIAL NUMBERS The engine number was also the serial number of the car. Engines were numbered when they were completed, and for the most part went into a chassis within a day or so. However, some
Sierra Weather and Climate Update
 Sierra Weather and Climate Update 2014-15 Kelly Redmond Western Regional Climate Center Desert Research Institute Reno Nevada Yosemite Hydroclimate Workshop Yosemite Valley, 2015 October 8-9 Percent of
PROJECT REPORT (ASL 720) CLOUD CLASSIFICATION
 CLOUD CLASSIFICATION") PROJECT REPORT (ASL 720) CLOUD CLASSIFICATION SUBMITTED BY- PRIYANKA GUPTA 2011CH70177 RINI KAPOOR 2011CH70179 INDIVIDUAL CONTRIBUTION- Priyanka Gupta- analysed data of region considered in India (West:80,
PROJECT REPORT (ASL 720) CLOUD CLASSIFICATION SUBMITTED BY- PRIYANKA GUPTA 2011CH70177 RINI KAPOOR 2011CH70179 INDIVIDUAL CONTRIBUTION- Priyanka Gupta- analysed data of region considered in India (West:80,
Webinar and Weekly Summary February 15th, 2011
 Webinar and Weekly Summary February 15th, 2011 -Assessment of current water conditions - Precipitation Forecast - Recommendations for Drought Monitor Upper Colorado Normal Precipitation Upper Colorado
Plant Water Stress Frequency and Periodicity in Western North Dakota
 Plant Water Stress Frequency and Periodicity in Western North Dakota Llewellyn L. Manske PhD, Sheri Schneider, John A. Urban, and Jeffery J. Kubik Report DREC 10-1077 Range Research Program Staff North
Hydrologic Conditions in the Delaware River Basin
 Hydrologic Conditions in the Delaware River Basin April : Flooding in Lambertville, New Jersey Aerial photo used with permission of www.elevated-images.com Annual Report Prepared by Operations Staff June
PRELIMINARY ASSESSMENT OF SURFACE WATER RESOURCES - A STUDY FROM DEDURU OYA BASIN OF SRI LANKA
 PRELIMINARY ASSESSMENT OF SURFACE WATER RESOURCES - A STUDY FROM DEDURU OYA BASIN OF SRI LANKA THUSHARA NAVODANI WICKRAMAARACHCHI Hydrologist, Water Resources Secretariat of Sri Lanka, Room 2-125, BMICH,
Country Presentation-Nepal
 Country Presentation-Nepal Mt.Everest, Shiva Pd. Nepal, DHM South Asia Drought Monitor Workshop Dhaka Bangladesh 2 th April 215 Overview Brief Climatology Climate activities- DHM PPCR (Pilot Program for
Climatography of the United States No
 Climate Division: CA 5 NWS Call Sign: Elevation: 6 Feet Lat: 37 Month (1) Min (2) Month(1) Extremes Lowest (2) Temperature ( F) Lowest Month(1) Degree s (1) Base Temp 65 Heating Cooling 1 Number of s (3)