WEF Collection Systems Conference Getting It Right: The Hampton Roads Approach to Hydraulic Model Data Collection and Management
|
|
|
- Calvin Taylor
- 5 years ago
- Views:
Transcription
1 Getting It Right: The Hampton Roads Approach to Hydraulic Model Data Collection and Management ABSTRACT Priyanka Mohandoss, PE, CDM Smith Dr.-Ing. Matthias Wittenberg, PE, D.WRE, REM, CDM Smith Robert J. Martz, PE, Hampton Roads Sanitary District CDM Smith 5041 Corporate Woods Drive, Suite 250 Virginia Beach, VA (757) HRSD is a regional wastewater authority serving 1.7 million people in southeastern Virginia. HRSD s customer localities own and operate most of the more than 9,650 km (6,000 miles) of sanitary sewer pipe and 1,600 pumping stations. HRSD provides the backbone of the sanitary sewer conveyance and treatment system with over 690 km (430 miles) of force mains, 70 pumping stations, 20 pressure control facilities, and nine major wastewater treatment plants. HRSD maintains two dynamic hydraulic models for their regional sanitary sewer collection systems and 14 additional hydraulic models for the upstream locality-owned collection systems. These models support the development of a Regional Wet Weather Management Plan (RWWMP) required under a Consent Decree with the Unites States Environmental Protection Agency (U.S. EPA). The Regional Hydraulic Models (RHMs) and Locality Hydraulic Models (LHMs) are relied upon for various planning and design analyses and will need to be updated periodically to reflect current asset inventory including ownership and asset conditions. This paper provides an overview of the collaborative standardized asset management approach developed by HRSD with its customer Localities. The approach allows for the development of a RWWMP that identifies the true needs of the regional system by accurately reflecting those facilities in the regional sanitary sewer system that are relevant for capacity and operations. KEYWORDS Hydraulic model, regional sanitary sewer system, asset management, template geodatabase, wastewater collection system, sewer, force main, SSO, capacity assessment, consent decree, wetweather management plan INTRODUCTION HRSD is a regional wastewater authority that serves a population of 1.7 million people living in 17 cities and counties in southeastern Virginia. HRSD owns and operates nine major and four smaller sewage treatment plants (STPs) with a combined treatment capacity of 940 million liters per day (249 million gallons per day). HRSD and 13 of the 17 localities that comprise the HRSD service area entered into a Special Order by Consent with the Virginia Department of 1 427
2 Environmental Quality (VDEQ) in September One other locality that is part of the regional system that HRSD serves was already under a separate Consent Order with VDEQ. HRSD was subsequently placed under a Consent Decree with the Unites States Environmental Protection Agency (U.S. EPA). As part of this ongoing program to control sanitary sewer overflows (SSOs), HRSD and the localities were required to assess the condition and capacity of the regional sanitary sewer system and to develop a Regional Wet Weather Management Plan (RWWMP) for future flow conditions. Under the third amendment to the Consent Decree, HRSD is solely responsible for designing, funding, and implementing the RWWMP. The primary tool for developing the RWWMP are complex hydrologic and hydraulic computer models of the regional sanitary sewer system. HRSD maintains two dynamic hydraulic models that represent the backbone of the regional sanitary sewer collection systems, the North Shore and South Shore Regional Hydraulic Models (RHMs), and 14 additional hydraulic models for the upstream locality-owned collection systems; one Locality Hydraulic Model (LHM) for each of the 14 localities involved. The regulatory orders required development of the models using a dynamic hydraulic modeling software that models both gravity and pressurized flows simultaneously. The RHMs include all conveyance facilities owned and operated by HRSD and the major locality facilities that are directly connected and manifolded with these facilities. Since HRSD became responsible for capacity in all facilities, it took over the development of the separate LHMs that include selected portions of the upstream locality sanitary sewer facilities. The model development and calibration of the RHMs was especially complex due to the influence of approximately 900 terminal pump stations that discharge to HRSD s 692 km (430 mile) manifolded interceptor force main system. HRSD and the localities chose MIKE URBAN CS by the Danish Hydraulic Institute for this application and have been innovatively utilizing geodatabase protocols and Web-based applications to facilitate the extensive process of collecting sewer system GIS data and operational information for integration in the hydraulic model development approach. Collaboration between HRSD and the localities extended through all technical elements of the development and calibration of the models. Each Locality collected flow and rainfall data to develop hydrologic and hydraulic model input parameters. Within the modeling approach, localities had the responsibility of developing dry weather and wet weather flow inputs. In addition to locality flow monitoring, HRSD implemented a substantial program to install flow and pressure meters at more than 250 locations throughout the HRSD interceptor system and to provide a regional rainfall gauge network. The HRSD and locality flow, pressure, and rainfall (FPR) monitoring programs provided the necessary data to reliably calibrate the RHMs and LHMs. MODEL EXTENT The hydraulic modeling focuses on the highly-developed areas of Hampton Roads, including service areas in 14 of the 19 customer localities and nine STPs. The locality service areas and the extent of the sewer collection system included in the RHMs is shown in Figure 1. The RHMs were developed as two hydraulically independent models identified as the North Shore and South Shore because of the natural split of the two systems by the James River where it enters the Chesapeake Bay

3 Figure 1. Regional Hydraulic Model Extent 3 429
, pressure reducing stations (PRSs), pump stations, and mainline valves.")
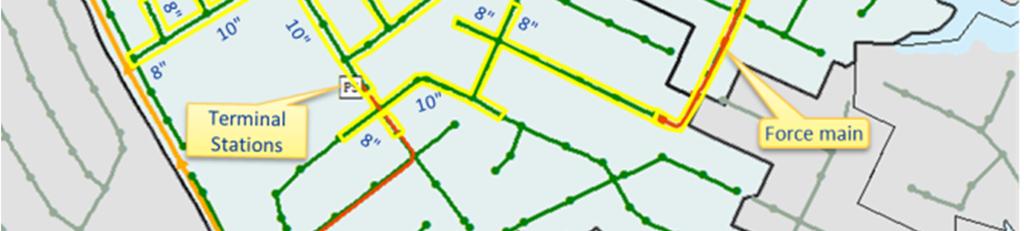
4 RHM Extent The extent of the RHM includes the following components of the Regional Sanitary Sewer (SS) System as shown on Figure 2: All operating HRSD force mains, gravity sewers, pressure control valves (PCVs), pressure reducing stations (PRSs), pump stations, and mainline valves. All operating Locality terminal pump stations and force mains that connect directly into HRSD force mains or gravity sewers. This includes Locality lift stations that connect to HRSD gravity sewers. Open and closed Locality valves operated by the Locality to divert flows during normal operations Locality gravity sewers, usually limited to the first sewer segment and manhole upstream from modeled terminal pump stations or the point of connection to an HRSD gravity sewer Locality facilities up to Locality Overflow Points (LOPs) identified in Appendix 1 of the Consent Decree Figure 2. RHM Extent The storage volume available in the Locality gravity sewer system upstream of these facilities is included in the RHM in most cases
5 LHM Extent The LHMs are intended to supplement the RHMs. The LHMs generally include Locality facilities upstream from the RHM with very limited overlap upstream of terminal pump stations and HRSD gravity sewers. Terminal pump stations and terminal lift stations where the force main discharges directly to an HRSD facility are modeled in the RHM. All remaining Locality lift stations are modeled within the LHMs. Where a hydraulic analysis of the Locality gravity sewer system is warranted, the LHMs start at the Locality or HRSD terminal pump station wet well. In some cases, the LHMs start where the Locality gravity sewer connects to an HRSD gravity sewer. A screening process determined the service areas where a detailed LHM hydraulic analysis is warranted. This screening process eliminated terminal pump station service areas, lift station service areas, and gravity-to-gravity connection service areas where all of the following are true: There are no capacity related overflows or Locality Overflow Points (LOPs) documented in the Consent Decree except during extreme events (e.g. greater than 10-year peak flow recurrence). The reported incidents were tied to a manhole or other sewer system facility in a geodatabase. HRSD flagged those incidents and associated locations that would warrant further evaluation with a LHM. The 10-year recurrence peak flow can be conveyed by an 200 mm (8-inch) diameter pipe at minimum slope (22 l/s (350 gpm)) There are no upstream lift stations. A service area was not included in separate LHM, where the RHM could be extended to include the service area of interest without further complicating the allocation of flows from catchments to loading manholes. For service areas that did not meet the above criteria, all gravity sewers and manholes were modeled where accurate and complete data are available or could be obtained with a reasonable effort. Where complete and accurate gravity system data (especially including pipe diameters and inverts) was not available for a service area of interest, an extensive effort was expended to include the following minimum locality facilities in the LHM: 250 mm (10-inch) and larger diameter gravity sewers and the first 200 mm (8-inch) sewer segments upstream from the 250 mm (10-inch) sewer. Gravity sewers downstream from a LOP or capacity related SSO and the first sewer segment and manhole upstream of this location. Force mains and gravity sewers downstream from lift stations All lift stations that do not discharge to an HRSD sewer and, at a minimum, one pipe segment and manhole upstream from the lift station. Closed valves and force mains operated to divert flows during normal operations and the gravity sewers required to convey the flows downstream from these valves For service areas where Locality gravity sewers connect to HRSD sewers, the sewer segment and manhole upstream from the point of connection. For service areas where a cross-connection exists, the gravity sewers required to convey the flows downstream from this connection


6 Figure 3 illustrates the minimum extent for service areas of interest. Figure 3. LHM Minimum Extent 6 432
7 Model Elements For a perspective on the quantity of data included in the models, Table 1 provides a summary of elements included in the RHMs and LHMs. Table 1 Facilities in the North Shore and South Shore RHMs and the 14 LHMs Facility North Shore RHM South Shore RHM LHMs Number of STPs Number of HRSD Pump Stations Number of HRSD Pressure Reducing Stations Number of HRSD Pumps Number of HRSD Gravity Sewer Pipes Length of HRSD Gravity Sewer, km (miles) 46.5 (28.9) 38.0 (23.6) - Number of HRSD Force Main Pipes 2,735 5,444 - Length of HRSD Force Mains, km (miles) 253 (157) 442 (275) - Number of HRSD Pressure Control Valves (PCVs) Number of HRSD Valves, Gates, Weirs and PCVs 522 1,022 - Number of HRSD Storage Tanks Number of Localities Number of Locality Pump Stations Number of Locality Pressure Reducing Stations Number of Locality Pumps 431 1, Length of Locality Gravity Sewer, km (miles) 12.7 (7.9) 27.3 (17.0) 3,130 (1,950) Length of Locality Force Main, km (miles) 145 (90) 555 (345) 360 (220) Number of Locality Valves and Gates Number of Catchments 661 1, Total Catchment Area, km 2 (square miles) 564 (218) 784 (303) 920 (360) Total Sewered Area, km 2 (Square Miles) 318 (123) 515 (199) 680 (260) FACILITY DATA COLLECTION AND COLLABORATION HRSD supported the development of the RHMs with an ArcSDE enterprise sanitary sewer facility GIS. The HRSD GIS contains record drawing data describing the physical characteristics and location of HRSD force mains, gravity sewers, manholes, force main junctions, valves, bends, and many other features. HRSD worked diligently to obtain accurate HRSD GIS and facility operation information for input to the RHMs. All HRSD facility data are derived from record drawings, field inspections, pump station testing and field survey of the HRSD gravity sewers and manholes. HRSD successfully organized the HRSD facilities data and developed custom procedures for representing and updating that data in the RHM
8 To collect the locality facility data listed in Table 1, HRSD developed a standard facility geodatabase template and associated metadata template file that must be used by the localities for all data submittals. This puts the vast amount of locality submitted data into one common format and facilitates the continuous efforts for validating, correcting, and updating of that data. The Locality Facility Geodatabase (FGDB) template was developed in ESRI s ArcGIS environment and includes MS Access queries and other automated check tools that allow the user to validate the data prior to submission to HRSD and further use. The Locality FGDB template includes the following five feature classes and five associated data tables as shown in Figure 4: Nodes Point feature class that includes gravity system manholes, junction chambers, and force main nodes (T-fittings, reducers, air release valves, bends, etc.). The primary data provided for these features include the invert elevation of gravity manholes, invert elevation of pressure system nodes, and the rim elevation of gravity manholes. Valves Point feature class that includes Locality valves that can be operated to divert flows to different modeled facilities and therefore must be included in the RHM. Many Localities included all pressure system valves in this data table, including those not operated to route flows. A procedure was developed for the model administrator to move non-critical valve point features to the nodes table. Pipes Line feature class that includes gravity sewer and force main pipes. Important data include the pipe size, upstream invert elevation, and downstream invert elevation. Pump Stations Point feature class that represents the approximate pump station location. The pump station data table includes the pump station identifier, name, capacity, etc. Associated tables contain data for the pump station wet well, pumps, and pump controls. Catchments or Service Areas Polygon feature class that outlines sewered parcels upstream from each model loading point. The catchments typically load to the most upstream Locality feature in the model. Wet Well Table Table that includes data describing the wet well(s) for each modeled terminal Locality pump station. The primary data are the wet well surface area (if not provided as a depth-surface area table), and top and bottom elevation. This table is linked to the pump station feature class through the pump station identifier. Wet Well Surface Area Table Table that can be used to define the depth versus surface area relationship for wet wells where the horizontal surface area changes significantly with depth. This table is linked to the wet well table through the wet well identifier. A procedure was developed for the model administrator to assign a sequence identifier to each surface area value based on increasing depth as required in the RHM. Pumps Table Table that provides information on the individual pumps within each modeled pump station linked to the pump station feature class through the pump station identifier. Important data includes the type of drive (constant, dual, or variable speed) and the pump start and pump stop elevations. Pump Curves Table Table that includes pumped flow versus total dynamic head points describing the pump operating characteristics. One curve is required for constant speed pumps and maximum and minimum curves are required for dual or variable speed pumps. The points that describe a curve for a particular pump are linked to the pump table through the pump identifier. Procedures were developed for the model administrator to create a 8 434

9 unique identifier for each pump curve based on the pump identifier and pump speed and to assign a sequence identifier to each flow value based on increasing head as required by the modeling software. Gravity Storage Table Table that provides information on the storage volume available in the Locality gravity collection system upstream of a modeled HRSD or Locality gravity manhole in the RHM. Important data include the manhole identifier to which the storage volume will be assigned to and the gravity pipe and manhole storage volume determined by the procedure. The procedure uses the LHM system information available in the FGDB and additional GIS information if needed. It excludes non-modeled locality pressure systems and gravity systems upstream therefrom. A procedure allows for the model administrator to convert the potential storage volume to a depth versus surface area relationship based on the depth between the invert at the connection to the model and the overflow elevation. The model administrator will also assign a sequence identifier to each surface area value based on increasing depth as required in the RHM. The overflow elevation is the lowest manhole rim of upstream system or at the point of model connection. The procedure determines the storage volume available for wet weather conditions and therefore excludes storage volume that is being utilized during dry weather conditions. Figure 4. Locality FGDB Template 9 435


10 A series of technical reports and memoranda document the RHM and LHM locality facility data needs and the procedures localities used to deliver these data to HRSD. Localities are asked to provide all facility data using the facility geodatabase template and in accordance to the standards and guidance provided in these documents. Attribute information for each feature class and data table type was classified as necessary, highly desirable, desirable or informational to assist HRSD and the localities in setting priorities for data collection. These are listed below in decreasing importance or priority and shown in Figure 5. Necessary Data are absolutely required for RHM and LHM development. These data should receive highest priority in data collection within the modeled portions of the regional and locality sanitary sewer systems. These fields have red text in Figure 5. Highly Desirable Data will assist in developing an accurate RHM/LHM, but are not absolutely necessary. These fields have blue text in Figure 5. Desirable Data will assist in model development, but only need to be delivered if readily available. These fields have black text in Figure 5. Informational Data documents features and attribute values developed by HRSD for the RHM/LHM that should not be modified by the Localities. Figure 5. Classification of Attribute Information within the Locality FGDB Template

11 The facility geodatabase template was developed in ESRI s ArcGIS environment and includes Microsoft Access queries and other automated check tools that allow the user to validate the data prior to the submittal to HRSD. The Microsoft Access queries perform detailed review of the data to find duplicates, check that nodes associated with pipes are in the database, check the number of pumps, wet wells, and pump curve points, check pump settings, and perform a variety of other data checks for the necessary attribute information. To further facilitate the data collection process, HRSD maintains a Locality Data Delivery Portal that the Localities must use at all times when providing the facility data updates for the RHM and LHMs. Figure 6 shows the Portal Web site. A login username and password is needed to upload data. Detailed upload instructions and instructions to obtain login information are available on the Portal. Figure 6. HRSD Locality Data Delivery Portal An important practice to promote consistency among HRSD and the localities during development and update of the models was to formulate and publish standards and guidance documents for data content and format. Listed below are some of the documents distributed over the course of project phases: Regional Wet Weather Management Plan Locality Sanitary Sewer System Facility Data Standards: Report that documented the data needed and the format to be used to deliver the facility data and metadata to document the data sources Answers to Frequently Asked Questions Regarding Locality GIS Data Delivery Requirements: Memorandum that provided answers to common questions from the localities regarding the delivery of locality GIS and operations data
12 Regional Hydraulic Model Catchment Data and Delineation Requirements: Report that clarified issues regarding the catchment delineations that had to be provided for all areas served by the localities. The report noted that catchments are required for terminal and lift station service areas, gravity sewer connections to an HRSD gravity sewer, and that small gravity sewer connections can be aggregated to a single catchment if desired. Locality Gravity Sewer Storage: Guidance document that described the procedures for calculating available storage in Locality gravity collection systems for inclusion in the RHM and documented the format to be used to deliver the computed data and metadata file. In addition, HRSD also scheduled meetings with the locality engineering and GIS staff in advance of data submittal due dates. During these meetings, individual cases that qualify as exceptions to the standard procedures were discussed and questions and concerns voiced by the locality representatives regarding the data request were addressed. Some examples of exceptions to the standard approach include: If all Locality owned assets under construction as of a set date are requested, how should facilities that are under design and ready for construction be treated? If a facility is under construction but not included in a Locality s GIS, how should the identifiers be assigned for such assets? These meetings served as a great platform for knowledge sharing between locality and HRSD staff and helped resolve complex data issues prior to the hydraulic model development. In addition to establishing a sustainable technical basis, the collaborative process promoted ownership and confidence in the completed models, which is critical for modeling products according to Fugal et al. (2009). With these best practices in mind, the RHMs and LHMs (including data and supporting tools) were developed to empower and benefit HRSD and the localities (Carolan and Robichaud, 2008). MODEL DEVELOPMENT The combination of using a defined data format, transfer scripts and automated model building tools effectively streamlines the addition of the quality assured locality data to the model. Figure 7 illustrates the robust work flow process that was developed to enter the locality facility data into the MIKE URBAN CS model geodatabase and manage facility data in the RHM (Wittenberg and Carolan, 2012). These data were updated several times during model development, calibration and application to maintain the correlation between the models and the localities GIS facilities. The RHM and LHMs were updated with GIS and data from both the localities and HRSD before each round of major simulations to maintain consistency between the models and the locality and HRSD facility data stored in their respective GIS databases. The processes developed to load the locality GIS and non-gis data into the models facilitated the RHM and LHM development and now supports ongoing updates

13 Figure 7. Model Development Work Flow Locality Facility Data Preparation The data in the Locality FGDBs require several transformations before they can be entered into the RHM. HRSD developed procedures to streamline these data conversions, but the transformation process is still primarily manual work. The designated model administrator must apply diligent quality control and have a complete understanding of the processing rules, transformation tools, and MIKE URBAN CS software. The data from each Locality RHM Facility Geodatabase are first transformed to a so-called GIS Prep geodatabase that contains additional feature classes (i.e., wet well point, pump line, valve line, and merged pipe), additional fields in the existing tables, a domain table that includes a model status code later used to transfer the data as needed, and Microsoft Access queries. The Microsoft Access queries review the data to find duplicates; check that pipe nodes are in the database; check the number of pumps, wet wells, and pump curve points; check pump settings; and perform other data checks. Tools developed to process the HRSD data are then used to transform and check the Locality data within the GIS Prep database. An example of a GIS transformation tool is the Locality Pump Station Conversion Tool. The Locality FGDB contains a single point for each pump station. The RHMs and LHMs require additional features to represent these pump stations. The


14 automated Locality Pump Station GIS tool performs the following major conversions on selected pump station features within the GIS Prep database: Include a wet well point feature that connects to the gravity sewers entering the pump station and populate the feature attribute information from the Locality facility data Wet Well table, including depth versus storage data. The wet well is placed at the pump station point provided by the Locality. Include a new node point feature at the upstream end of the force main pipe connected to the pump station feature. The attribute data for this feature are populated using MIKE URBAN CS default values and connected force main data. Include pump links that connect the wet well to the first force main segment. The attribute data for the pump links are populated using the pump and pump curve data in the Locality RHM Facility Geodatabase. Figure 8 illustrates the conversions to Locality pump stations performed on the Locality GIS Prep database. Figure 8. Locality Pump Station Conversions The following other data adjustments may be performed on the Locality GIS Prep database to provide a valid model dataset: Convert the valve point features provided by the localities to line features to be compatible with the MIKE URBAN CS software
15 Linearly interpolate force main elevations where manifold force mains connect from the nearest feature with invert elevations. When the locality obtains more detailed information, the force main data are updated in the models as part of a resubmittal. Assign Model Status codes to the features in the GIS Prep geodatabase to describe the data source and indicate which data are to be transferred to Staging tables for input to the RHMs or LHMs. These codes also control whether feature attribute data in the GIS Prep database are overwritten when updated from future Locality FGDB submittals. In addition, they identify new features selected by the model administrator for model input. Assign a diameter to selected pressure nodes based on the largest diameter of the connected force main. A GIS tool was developed to perform this operation. In some cases, the force main junction diameter may be increased to improve model stability. Add a point or line feature with an assumed identifier and attribute information to maintain connectivity where not provided by the Locality. Merge a line feature to avoid the addition of a new point feature where the Localities did not provide nodes at force main junctions. Assume unique identifiers for features with duplicate identifiers in the data provided by the Localities. The assumed value is updated if the Locality provides the information in a subsequent submittal. Update the ToNode field, DownstreamID field, or other feature attribute information based on HRSD data or the model administrator s understanding of the modeled facilities and RHM requirements. The Locality facility database was sometimes populated with duplicate HRSD features, duplicate neighboring locality features, or other features from the locality GIS that are not required for the RHM. The status code of these features was set to indicate and ensure that these are not imported into the RHM. The status code of all remaining, previously untouched features in the Locality GIS Prep geodatabase was set to indicate that they are to be included in the model database. Locality GIS Data Staging Once processing is completed, the facility data in the Locality GIS Prep geodatabases are loaded to ArcGIS Staging geodatabases prior to being input to the RHMs or LHMs. This step accomplishes the following tasks: Places the facility data in a format compatible with the MIKE URBAN CS database structure prior to loading into the RHMs or LHMs Excludes GIS features not required or necessary in the models based on the model status code Adds temporary node point features to maintain connectivity between modeled pipes to replace temporary HRSD or locality GIS Network Junction features Performs other data manipulations necessary to place the data in a format compatible with MIKE URBAN CS (e.g., check connectivity and populate To Node and From Node fields, sort pump curve and wet well values in sequence, check and create unique identifiers for GIS and other modeled features) Incorporates attribute data not in the GIS (e.g., pump and wet well data, pressure system node point diameter, roughness coefficients, etc.) from other databases
16 ArcObjects Feature Manipulation Engine (FME) scripts are used to transfer the data from GIS Prep to the staging tables perform many of these manipulations automatically. MIKE URBAN Extensible Markup Language (XML) is used to import the data from the staging tables into the modeling software geodatabase. An XML script is generated automatically by the software when the staging table data fields are manually mapped to those in MIKE URBAN CS during the import process. HRSD subsequently modified this script to perform additional functions that assign default values and filter the data when imported into the RHM or LHM databases. Locality Data Update and Correction HRSD performed reviews of the Locality data when delivered. Additional questions and errors were identified as the data were reviewed and processed for entry to the RHMs and LHMs. Also, once these data were in the models, engineering and other data checks identified additional concerns. These data concerns were transmitted to the Localities for review and correction in memoranda and updated geodatabases. This feedback and correction process keeps the models, locality data, and interim databases in sync and allows errors to be corrected by the localities. This work also allows the RHMs and LHMs to be updated using the GIS data. PROJECT HISTORY AND CURRENT STATUS The locality facility data collection approach and model update processes were successfully applied by HRSD in 2008 and 2009 to collect the data necessary to develop the initial RHMs, in 2010 and 2011 to support the calibration of the RHMs to the flow and pressure meter collected by HRSD and the localities (Morgan et al., 2012). The approach was expanded from the RHM extent to the entire regional system in 2015 to update the RHMs, develop the LHMs and perform a capacity assessment of the regional system with the RHMs and LHMs (Hubbard et al., 2015). The approach was applied again to quickly update the models prior to the next RWWMP milestone in the summer of 2016 that included the definition and testing of capacity improvements in support of an alternatives analysis and level of service selection. The tools and procedures were recently applied for the final RHM and LHM update prior to the development of the RWWMP due in October of HRSD plans to continue using the data collection procedures through the implementation of the RWWMP and beyond to keep the model updated for all other engineering applications. CONCLUSIONS HRSD established a standardized approach to collect regional collection system data from its 14 customer Localities and uses ArcGIS tools and FME and XML transfer scripts for development of two RHMs and fourteen LHMs. A pre-defined ArcGIS geodatabase template allows the application of custom GIS and Microsoft Access tools that perform data consistency and completeness checks, track data sources and history, and automate the data collection process, ensuring quality and resulting in time saving in excess of 400 hours each time the models need a major data update
17 The template geodatabase was accompanied by a detailed guidance report that defined the data quality standards the localities were required to adhere to. This comprehensive document summarized allowable assumptions, required data standards, and computational procedures including how to calculate gravity system storage volume for non-modeled upstream portions of the sanitary sewer system. Supplemental memoranda provide answers to frequently asked questions to minimize ambiguity and to produce consistent data submittals to HRSD regardless of individual locality standards, protocols of data collection and asset management databases. The data collected in the template geodatabase simplified the visual data review and coordination with each responsible party. Once all facility data and operation information are complete, ArcGIS tools are applied to transform the data into the format needed for model input and a code is assigned to each feature to inform the model development tools if a feature needs to be updated in the RHM, the LHMs, or both. These tools and transfer processes automate the model update process, ensuring data consistency and resulting in time saving in excess of 500 hours each time the models are updated. The RHMs and LHMs are relied upon for various planning and design analyses and need to be updated periodically to reflect current asset inventory including ownership and asset conditions. Establishing a standard approach and template facility geodatabase based process continues to save hundreds of hours in data review and processing time, while allowing a consistent data format for the models even though Localities maintain custom individual formats. The template geodatabase allows for effective communication and collaboration between HRSD and the localities, ultimately leading to hydrologic and hydraulic models that accurately represent field conditions. REFERENCES Carolan, J., Robichaud, J. (2008). Integrating Regional and Local Municipality Geographic Information Systems (GIS) Data in Support of Regional Wastewater Hydraulic Modeling. Proceedings of AWWA WaterJAM. Virginia Beach, Virginia, September 7-11, Fugal, A., Fyock, B., Shay, R. (2009). Model Coaching To Create a Collection System Model. Proceedings of WEF Collection Systems Specialty Conference. Louisville, Kentucky, April 19-22, Hubbard, P.L.; Martz, R.J.; Moore, C.I.; Morgan, M.C. and Wittenberg, M. Hitting the Peak Flow Recurrence Target; A Hydrologic Approach for the Hampton Roads Regional Hydraulic Model. Proceedings of WEF Specialty Conference. Cincinnati, Ohio, April 19-22, Morgan, M., Hubbard, P., Martz, R.; Moore, C., Wittenberg, M. A Collaborative Approach to Modeling the Hampton Roads Regional Wastewater Collection System. Proceedings of WEF Specialty Conference. St. Louis, Missouri, June 3-6, Wittenberg, M., Carolan, J. Leveraging Geographic Information and Work Order Systems Data for Hydraulic Model Development and Maintenance: An Effective, Sustainable Methodology. Proceedings of Chesapeake AWWA, CWEA and Maryland, Delaware and District of Columbia WWOA Tri-Association Conference (Tri-Con 2012). Ocean City, Maryland, August 28-31,
Leveraging GIS data and tools for maintaining hydraulic sewer models
 Leveraging GIS data and tools for maintaining hydraulic sewer models Ben Gamble & Joseph Koran Metropolitan Sewer District of Greater Cincinnati Carl C. Chan & Michael York CDM Smith Ben Gamble Senior
MODERNIZATION OF THE MUNICIPAL MAPPING USING HIGH END GNSS SYSTEM AND GIS SOFTWARE
 MODERNIZATION OF THE MUNICIPAL MAPPING USING HIGH END GNSS SYSTEM AND GIS SOFTWARE Mr. R. A. R. Khan Assistant Engineer, Sewerage Utility Management Centre (SUMC) Municipal Corporation Of Greater Mumbai
USING GIS IN WATER SUPPLY AND SEWER MODELLING AND MANAGEMENT
 USING GIS IN WATER SUPPLY AND SEWER MODELLING AND MANAGEMENT HENRIETTE TAMAŠAUSKAS*, L.C. LARSEN, O. MARK DHI Water and Environment, Agern Allé 5 2970 Hørsholm, Denmark *Corresponding author, e-mail: htt@dhigroup.com
You Call That Good Data? How to Survive a Consent Decree Flow Monitoring Program
 Hampton Roads Sanitation District You Call That Good Data? How to Survive a Consent Decree Flow Monitoring Program September 2011 You Call That Good Data? How to Survive a Consent Decree Flow Monitoring
Enabling Success in Enterprise Asset Management: Case Study for Developing and Integrating GIS with CMMS for a Large WWTP
 Enabling Success in Enterprise Asset Management: Case Study for Developing and Integrating GIS with CMMS for a Large WWTP Allison Blake, P.E. 1*, Matthew Jalbert, P.E. 2, Julia J. Hunt, P.E. 2, Mazen Kawasmi,
Building GIS for Fairfax County Wastewater Management. Gilbert Osei-Kwadwo
 Abstract: Building GIS for Fairfax County Wastewater Management Gilbert Osei-Kwadwo Wastewater Management Agency (WWM) of Fairfax County in Virginia has put a lot of efforts into building an effective
The University of Akron. William Troyer The Dr. Gary B. and Pamela S. Williams Honors College
 The University of Akron IdeaExchange@UAkron Honors Research Projects The Dr. Gary B. and Pamela S. Williams Honors College Spring 2018 Applying Control Logic to the End of the Ohio Canal Interceptor Tunnel
Construction in my Neighborhood - Communication with Stakeholder and Public -
 Construction in my Neighborhood - Communication with Stakeholder and Public - Presented by: Navneet Virk East Bay Municipal Utility District, Oakland, CA 0 Mission at EBMUD To manage the natural resources
Road Ahead: Linear Referencing and UPDM
 Road Ahead: Linear Referencing and UPDM Esri European Petroleum GIS Conference November 7, 2014 Congress Centre, London Your Work Making a Difference ArcGIS Is Evolving Your GIS Is Becoming Part of an
GeoSpatial Water Distribution, Sanitary Sewer and Stormwater Network Modeling
 2009 Bentley Systems, Incorporated GeoSpatial Water Distribution, Sanitary Sewer and Stormwater Network Modeling Angela Battisti, Gary Griffiths Bentley Systems Inc Presenter Profile Angela Battisti, CE,
Clean Water 2020 Program
 Clean Water 2020 Program SEWER MAPPING PROGRAM July 2014 Submitted to EPA SCDHEC July 17, 2014 Table of Contents Program Summary and Intent... 2 Section 1. Sewer Mapping Program Objectives... 5 Section
UNION SANITARY DISTRICT
 UNION SANITARY DISTRICT UNION CITY, CA GIS Application of Wastewater Treatment Plant Infrastructure Union Sanitary District Regional Wastewater District Serve the cities of Fremont, Newark and Union City
Use of ArcPy Library for Validating GIS Networks
 Use of ArcPy Library for Validating GIS Networks Derek Sutton, Derek Elliott Citizens Energy Group Mehmet Ercan, Joel Kaatz Arcadis ESRI User Conference June 27-July 1, 2016 San Diego, CA 25 July 2016
MAPPS 2012 Geospatial Products and Services Excellence Awards Awards Entry Form
 MAPPS 2012 Geospatial Products and Services Excellence Awards 2012 Awards Entry Form Please include a copy of this document with the project/product submission Entry Information Submission Number: 1741558
Internal Audit Report
 Internal Audit Report Right of Way Mapping TxDOT Internal Audit Division Objective To determine the efficiency and effectiveness of district mapping procedures. Opinion Based on the audit scope areas reviewed,
Chapter 6. Fundamentals of GIS-Based Data Analysis for Decision Support. Table 6.1. Spatial Data Transformations by Geospatial Data Types
 Chapter 6 Fundamentals of GIS-Based Data Analysis for Decision Support FROM: Points Lines Polygons Fields Table 6.1. Spatial Data Transformations by Geospatial Data Types TO: Points Lines Polygons Fields
CSO Post-Construction Monitoring and Performance Assessment
 Massachusetts Water Resources Authority CSO Post-Construction Monitoring and Performance Assessment Jeremy R. Hall, Project Manager Operations/Engineering & Construction Wastewater Advisory Committee December
StreamStats: Delivering Streamflow Information to the Public. By Kernell Ries
 StreamStats: Delivering Streamflow Information to the Public By Kernell Ries U.S. Department of the Interior U.S. Geological Survey MD-DE-DC District 410-238-4317 kries@usgs.gov StreamStats Web Application
Steve Pietersen Office Telephone No
 Steve Pietersen Steve.Pieterson@durban.gov.za Office Telephone No. 031 311 8655 Overview Why geography matters The power of GIS EWS GIS water stats EWS GIS sanitation stats How to build a GIS system EWS
GENERALIZATION IN THE NEW GENERATION OF GIS. Dan Lee ESRI, Inc. 380 New York Street Redlands, CA USA Fax:
 GENERALIZATION IN THE NEW GENERATION OF GIS Dan Lee ESRI, Inc. 380 New York Street Redlands, CA 92373 USA dlee@esri.com Fax: 909-793-5953 Abstract In the research and development of automated map generalization,
GIS-T 2010 Building a Successful Geospatial Data Sharing Framework: A Ohio DOT Success Story
 GIS-T 2010 Building a Successful Geospatial Data Sharing Framework: A Ohio DOT Success Story ODOT District 2 GIS John Puente District 1 GIS Coordinator\ Planning Administrator 2 Interoperability 3 District
Estimating Sewage System Flows
 9 Estimating Sewage System Flows DWSD Wholesale Sewer Rates 201 In this module, you will learn the sources of dry and wet weather flows and how these flows are estimated. Three different tools are used
7 GEOMATICS BUSINESS SOLUTIONS - ANNUAL REPORT 2006
 7 GEOMATICS BUSINESS SOLUTIONS - ANNUAL REPORT 2006 The Planning and Economic Development Committee recommends the adoption of the recommendation contained in the following report November 30, 2006, from
LRS Task Force June 13, REVISION HISTORY
 North Carolina Department of Transportation Geographic Information Systems (GIS) Unit LINEAR REFERENCING SYSTEM (LRS) PROJECT DEFINITION Version 1.0 REVISION HISTORY Date Document Manager Revision Purpose
The Use of Geographic Information Systems (GIS) by Local Governments. Giving municipal decision-makers the power to make better decisions
 by Local Governments. Giving municipal decision-makers the power to make better decisions") The Use of Geographic Information Systems (GIS) by Local Governments Giving municipal decision-makers the power to make better decisions Case Study: Examples of GIS Usage by Local Governments in North
The Use of Geographic Information Systems (GIS) by Local Governments Giving municipal decision-makers the power to make better decisions Case Study: Examples of GIS Usage by Local Governments in North
The City of Clearwater (City) collection
 collection") FWRJ A Matrix Approach to Prioritizing a Sewer Collection System Capital Improvement Plan Amanda Savage, Tara Kivett, Steven Cook, Eric Harold, and Ifetayo Venner The City of Clearwater (City) collection
FWRJ A Matrix Approach to Prioritizing a Sewer Collection System Capital Improvement Plan Amanda Savage, Tara Kivett, Steven Cook, Eric Harold, and Ifetayo Venner The City of Clearwater (City) collection
CHAPTER 22 GEOGRAPHIC INFORMATION SYSTEMS
 CHAPTER 22 GEOGRAPHIC INFORMATION SYSTEMS PURPOSE: This chapter establishes the administration and use of to improve the quality and accessibility of Department s spatial information and support graphical
Utah UIC Geospatial Integration EIEN Project
 Utah UIC Geospatial Integration EIEN Project ESRI UC, June 2007 Bert Granberg Utah Automated Geographic Reference Center Utah Automated Geographic Reference Center (AGRC) AGRC Responsibilities Facilitate
D. MATHEMATICAL MODEL AND SIMULATION
 D. MATHEMATICAL MODEL AND SIMULATION D - i TABLE OF CONTENTS D.1 Objective of Model Development... D - 1 D.2 Selection of Software... D - 1 D.3 General Steps of Simulation by MOUSE... D - 1 D.4 Cases of
Spatial Data Availability Energizes Florida s Citizens
 NASCIO 2016 Recognition Awards Nomination Spatial Data Availability Energizes Florida s Citizens State of Florida Agency for State Technology & Department of Environmental Protection Category: ICT Innovations
ArcGIS for Local Government
 Wednesday, June 29th ArcGIS for Local Government Dan Rose, GIS Analyst WaterOne IT/GIS Agenda / Talking Points What is the LGIM? WaterOne s GIS and LGIM background Our geodatabase redesign Our strategies
Linear Referencing in Boulder County, CO. Getting Started
 Linear Referencing in Boulder County, CO Getting Started 1 Authors Janie Pierre GIS Technician, Boulder County Road centerline and storm sewer geodatabases & maps John Mosher GIS Specialist, Boulder County
FIRE DEPARMENT SANTA CLARA COUNTY
 DEFINITION FIRE DEPARMENT SANTA CLARA COUNTY GEOGRAPHIC INFORMATION SYSTEM (GIS) ANALYST Under the direction of the Information Technology Officer, the GIS Analyst provides geo-spatial strategic planning,
INFLOW DESIGN FLOOD CONTROL SYSTEM PLAN 40 C.F.R. PART PLANT YATES ASH POND 2 (AP-2) GEORGIA POWER COMPANY
 GEORGIA POWER COMPANY") INFLOW DESIGN FLOOD CONTROL SYSTEM PLAN 40 C.F.R. PART 257.82 PLANT YATES ASH POND 2 (AP-2) GEORGIA POWER COMPANY EPA s Disposal of Coal Combustion Residuals from Electric Utilities Final Rule (40 C.F.R.
INFLOW DESIGN FLOOD CONTROL SYSTEM PLAN 40 C.F.R. PART 257.82 PLANT YATES ASH POND 2 (AP-2) GEORGIA POWER COMPANY EPA s Disposal of Coal Combustion Residuals from Electric Utilities Final Rule (40 C.F.R.
Indicator: Proportion of the rural population who live within 2 km of an all-season road
 Goal: 9 Build resilient infrastructure, promote inclusive and sustainable industrialization and foster innovation Target: 9.1 Develop quality, reliable, sustainable and resilient infrastructure, including
New Land Cover & Land Use Data for the Chesapeake Bay Watershed
 New Land Cover & Land Use Data for the Chesapeake Bay Watershed Why? The Chesapeake Bay Program (CBP) partnership is in the process of improving and refining the Phase 6 suite of models used to inform
NR402 GIS Applications in Natural Resources
 NR402 GIS Applications in Natural Resources Lesson 1 Introduction to GIS Eva Strand, University of Idaho Map of the Pacific Northwest from http://www.or.blm.gov/gis/ Welcome to NR402 GIS Applications in
Bridging the Gap between Engineering and GIS
 Bridging the Gap between Engineering and GIS Presented by: Karen Stewart, B.Tech, GISP Manager of Geomatics Township of Langley February 13, 2006 Agenda Introduction History Goals Implementation Benefits
4. GIS Implementation of the TxDOT Hydrology Extensions
 4. GIS Implementation of the TxDOT Hydrology Extensions A Geographic Information System (GIS) is a computer-assisted system for the capture, storage, retrieval, analysis and display of spatial data. It
Summary Description Municipality of Anchorage. Anchorage Coastal Resource Atlas Project
 Summary Description Municipality of Anchorage Anchorage Coastal Resource Atlas Project By: Thede Tobish, MOA Planner; and Charlie Barnwell, MOA GIS Manager Introduction Local governments often struggle
ArcGIS. for Server. Understanding our World
 ArcGIS for Server Understanding our World ArcGIS for Server Create, Distribute, and Manage GIS Services You can use ArcGIS for Server to create services from your mapping and geographic information system
John Laznik 273 Delaplane Ave Newark, DE (302)
") Office Address: John Laznik 273 Delaplane Ave Newark, DE 19711 (302) 831-0479 Center for Applied Demography and Survey Research College of Human Services, Education and Public Policy University of Delaware
Office Address: John Laznik 273 Delaplane Ave Newark, DE 19711 (302) 831-0479 Center for Applied Demography and Survey Research College of Human Services, Education and Public Policy University of Delaware
Document Title. Estimating the Value of Partner Contributions to Flood Mapping Projects. Blue Book
 Document Title Estimating the Value of Partner Contributions to Flood Mapping Projects Blue Book Version 1.1 November 2006 Table of Contents 1. Background...1 2. Purpose...1 3. Overview of Approach...2
Assessment of Unaccounted-for Water in Municipal Water Networks Using GIS and Modeling
 24 Assessment of Unaccounted-for Water in Municipal Water Networks Using GIS and Modeling Homayoun Motiee, Ali Motiei, Ahmad Hejranfar and M.Reza Delavar This chapter presents a study to calculate Unaccounted-for
EBA Engineering Consultants Ltd. Creating and Delivering Better Solutions
 EBA Engineering Consultants Ltd. Creating and Delivering Better Solutions ENHANCING THE CAPABILITY OF ECOSYSTEM MAPPING TO SUPPORT ADAPTIVE FOREST MANAGEMENT Prepared by: EBA ENGINEERING CONSULTANTS LTD.
Innovation. The Push and Pull at ESRI. September Kevin Daugherty Cadastral/Land Records Industry Solutions Manager
 Innovation The Push and Pull at ESRI September 2004 Kevin Daugherty Cadastral/Land Records Industry Solutions Manager The Push and The Pull The Push is the information technology that drives research and
Nine Minimum Controls No. 2
 Nine Minimum Controls No. 2 2.0 MAXIMIZATION OF STORAGE IN THE COLLECTION SYSTEM 2.1 OVERVIEW The 2 nd NMC is titled Maximization of Storage in the Collection system. EPA s NMC Guidance explains that this
ArcGIS for Desktop. ArcGIS for Desktop is the primary authoring tool for the ArcGIS platform.
 ArcGIS for Desktop ArcGIS for Desktop ArcGIS for Desktop is the primary authoring tool for the ArcGIS platform. Beyond showing your data as points on a map, ArcGIS for Desktop gives you the power to manage
3301 East 120 th Avenue Assited Living & Memory Care
 UTILITY REPORT FOR 3301 East 120 th Avenue Assited Living & Memory Care 1 st Submittal January 23, 2016 2 nd Submittal March 04, 2016 Prepared for: 3301 E. 120 th Ave, LLC. 8200 E. Maplewood Ave., Suite
Linear Referencing Systems (LRS) Support for Municipal Asset Management Systems
 Support for Municipal Asset Management Systems") Linear Referencing Systems (LRS) Support for Municipal Asset Management Systems Esri Canada Infrastructure Asset Management Leadership Forum November 1, 2017 Toronto, ON David Loukes, P. Eng., FEC Andy
Linear Referencing Systems (LRS) Support for Municipal Asset Management Systems Esri Canada Infrastructure Asset Management Leadership Forum November 1, 2017 Toronto, ON David Loukes, P. Eng., FEC Andy
IMPERIAL COUNTY PLANNING AND DEVELOPMENT
 IMPERIAL COUNTY PLANNING AND DEVELOPMENT GEODATABASE USER MANUAL FOR COUNTY BUSINESS DEVELOPMENT GIS June 2010 Prepared for: Prepared by: County of Imperial Planning and Development 801 Main Street El
Source Protection Zones. National Dataset User Guide
 Source Protection Zones National Dataset User Guide Version 1.1.4 20 th Jan 2006 1 Contents 1.0 Record of amendment...3 2.0 Introduction...4 2.1 Description of the SPZ dataset...4 2.1.1 Definition of the
GEOGRAPHIC INFORMATION SYSTEMS Session 8
 GEOGRAPHIC INFORMATION SYSTEMS Session 8 Introduction Geography underpins all activities associated with a census Census geography is essential to plan and manage fieldwork as well as to report results
Flood Map. National Dataset User Guide
 Flood Map National Dataset User Guide Version 1.1.5 20 th April 2006 Copyright Environment Agency 1 Contents 1.0 Record of amendment... 3 2.0 Introduction... 4 2.1 Description of the Flood Map datasets...4
GIS. in the City of Lewiston Maine
 GIS in the City of Lewiston Maine The purpose of this slideshow is to provide an overview of the city GIS and how it is used, maintained and accessed in-house as well as by the public. Please simply hit
Mapping Utilities with Mobile GIS Applications
 Mapping Utilities with Mobile GIS Applications Kristy M. Capobianco Reynolds, Smith and Hills, Inc. GIS Analyst Kristy.Capobianco@rsandh.com (904) 256-2251 2007 ESRI Southeast User Group Conference May
Enhancing Parcel Data In Colleton County. February 10, 2009
 Enhancing Parcel Data In Colleton County GIS & CAMA Conference February 10, 2009 Introductions Bruce T. Harper Technology Director Colleton County, SC Bill Wetzel National GIS Account Manager The Sidwell
Empowering water/wastewater network management with GIS
 Empowering water/wastewater network management with GIS Ioannis Kavouras_GIS Manager Surveying Engineer, MSc, MBA The Company responsible for fresh water distribution & sanitation serving 1.500.000 citizens
Construction Project Data Management
 Construction Project Data Management Establishing Foundations for an Asset Database Scot Twining Project Activities Supported by GIS Cadastral Mapping Proposed Pipeline Route Selection Right Of Way Acquisition
A New Automated Approach To Sewershed Delineation For Urban Drainage Modelling Studies: A City Of Toronto Case Study
 City University of New York (CUNY) CUNY Academic Works International Conference on Hydroinformatics 8-1-2014 A New Automated Approach To Sewershed Delineation For Urban Drainage Modelling Studies: A City
DATA SCIENCE SIMPLIFIED USING ARCGIS API FOR PYTHON
 DATA SCIENCE SIMPLIFIED USING ARCGIS API FOR PYTHON LEAD CONSULTANT, INFOSYS LIMITED SEZ Survey No. 41 (pt) 50 (pt), Singapore Township PO, Ghatkesar Mandal, Hyderabad, Telengana 500088 Word Limit of the
GIS is a tool for Pipeline Management
 ESRI User Conference 2011 GIS is a tool for Pipeline Management Pacheco (1) (1) Position: GIS Supervisor for Compañía Operadora de LNG del Perú. Address: Jiron Villa Real de los Infantes 255 D604, La Molina.
GIS Geographical Information Systems. GIS Management
 GIS Geographical Information Systems GIS Management Difficulties on establishing a GIS Funding GIS Determining Project Standards Data Gathering Map Development Recruiting GIS Professionals Educating Staff
A Comprehensive Inventory of the Number of Modified Stream Channels in the State of Minnesota. Data, Information and Knowledge Management.
 A Comprehensive Inventory of the Number of Modified Stream Channels in the State of Minnesota Data, Information and Knowledge Management Glenn Skuta Environmental Analysis and Outcomes Division Minnesota
Management and Sharing of Hydrologic Information of Cache County
 Geographic Information System in Water Resources CEE6440 Fall Semester 2012 Management and Sharing of Hydrologic Information of Cache County To: Dr. David Tarboton Instructor By: Tian Gan Dec.7, 2012 I.
Stormwater Capacity Analysis for Westover Branch Watershed
 Stormwater Capacity Analysis for Westover Branch Watershed Pimmit Run Little Pimmit Run, Mainstem Stohman's Run Gulf Branch Pimmit Run Tributary Little Pimmit Run, W. Branch Little Pimmit Run, E. Branch
presents challenges related to utility infrastructure planning. Many of these challenges
 1 Introduction: - a. Purpose According to U.S. Census Bureau the population of stark county was 367,585 in 1990, and in 2000 it was increase to 378,098. Thus County is experiencing a growth that presents
Typical Hydrologic Period Report (Final)
") (DELCORA) (Final) November 2015 (Updated April 2016) CSO Long-Term Control Plant Update REVISION CONTROL REV. NO. DATE ISSUED PREPARED BY DESCRIPTION OF CHANGES 1 4/26/16 Greeley and Hansen Pg. 1-3,
(DELCORA) (Final) November 2015 (Updated April 2016) CSO Long-Term Control Plant Update REVISION CONTROL REV. NO. DATE ISSUED PREPARED BY DESCRIPTION OF CHANGES 1 4/26/16 Greeley and Hansen Pg. 1-3,
WeatherHawk Weather Station Protocol
 WeatherHawk Weather Station Protocol Purpose To log atmosphere data using a WeatherHawk TM weather station Overview A weather station is setup to measure and record atmospheric measurements at 15 minute
Large Scale Mapping Policy for the Province of Nova Scotia
 Large Scale Mapping Policy for the Province of Nova Scotia December, 2005 Version 1.0 TABLE OF CONTENTS PAGE BACKGROUND...3 POLICY...5 Policy 1.0 Large Scale Mapping Program...5 Policy 2.0 Service Offering...5
Digital Wetlands. Bringing the Field into the Office Through GIS
 Digital Wetlands Bringing the Field into the Office Through GIS Maryland Department of the Environment Wetlands and Waterways Program MDE's Wetlands and Waterways Program seeks to conserve valuable aquatic
Technical Memorandum. City of Salem, Stormwater Management Design Standards. Project No:
 Technical Memorandum 6500 SW Macadam Avenue, Suite 200 Portland, Oregon, 97239 Tel: 503-244-7005 Fax: 503-244-9095 Prepared for: Project Title: City of Salem, Oregon City of Salem, Stormwater Management
EEOS 381 -Spatial Databases and GIS Applications
 EEOS 381 -Spatial Databases and GIS Applications Lecture 5 Geodatabases What is a Geodatabase? Geographic Database ESRI-coined term A standard RDBMS that stores and manages geographic data A modern object-relational
Houston Plat Tracker puts the GIS in Land Development
 Houston Plat Tracker puts the GIS in Land Development Abstract: The Plat Tracker supports Houston's land development approval process. This home grown web-based system includes GIS research tools and a
National Onshore Gas Pipelines Database Metadata Statement
 National Onshore Gas Pipelines Database Metadata Statement Last updated in 2014 Use Constraint: Geocat Number: 82579 Commonwealth of Australia (Geoscience Australia) 2014 This material is released under
Sewer, pressurization, differential pressure monitoring, fully dynamic hydraulic modeling, air displacement modeling.
 Using Dynamic Hydraulic Modeling to Understand Sewer Headspace Dynamics A Case Study of Metro Vancouver s Highbury Interceptor Yuko Suda, P.Eng. Kerr Wood Leidal Associates Ltd. 200-4185A Still Creek Drive
An Introduction to the Community Maps Information Model
 Esri International User Conference July 23 27 San Diego Convention Center An Introduction to the Community Maps Information Model Seth Sarakaitis Agenda Overview of Community Maps Program Information Models
Oakland County Parks and Recreation GIS Implementation Plan
 Oakland County Parks and Recreation GIS Implementation Plan TABLE OF CONTENTS 1.0 Introduction... 3 1.1 What is GIS? 1.2 Purpose 1.3 Background 2.0 Software... 4 2.1 ArcGIS Desktop 2.2 ArcGIS Explorer
Providing Electronic Information on Waste Water Discharge Locations
 Providing Electronic Information on Waste Water Discharge Locations Application Guidance Notes Environmental Protection Agency PO Box 3000, Johnstown Castle Estate, Co. Wexford Lo Call: 1890 335599 Telephone:
Orbital Insight Energy: Oil Storage v5.1 Methodologies & Data Documentation
 Orbital Insight Energy: Oil Storage v5.1 Methodologies & Data Documentation Overview and Summary Orbital Insight Global Oil Storage leverages commercial satellite imagery, proprietary computer vision algorithms,
GIS for Integrated Pest Management. Christina Hailey. Abstract:
 GIS for Integrated Pest Management Christina Hailey Abstract: At its formation in 1965, Harris County Mosquito Control (Houston, Texas) (HCMC) was primarily involved in the prevention and control of mosquito-borne
Getting Started with Community Maps
 Esri International User Conference San Diego, California Technical Workshops July 24, 2012 Getting Started with Community Maps Shane Matthews and Tamara Yoder Topics for this Session ArcGIS is a complete
APPLICATION OF GIS IN ELECTRICAL DISTRIBUTION NETWORK SYSTEM
 See discussions, stats, and author profiles for this publication at: https://www.researchgate.net/publication/305263658 APPLICATION OF GIS IN ELECTRICAL DISTRIBUTION NETWORK SYSTEM Article October 2015
Indiana GIS Resources
 Indiana GIS Resources National Association of Water Companies September 21, 2017 Jim Sparks Indiana Geographic Information Officer ABOUT THE INDIANA GEOGRAPHIC INFORMATION OFFICE I.C. 4-23-7.3 Indiana
Creation of an Internet Based Indiana Water Quality Atlas (IWQA)
") Department of Environmental Management Creation of an Internet Based Water Quality Atlas (IWQA) May 4, 2005 IUPUI 1200 Waterway Blvd., Suite 100 polis, 46202-5140 Water Quality Atlas John Buechler, Neil
Department of Environmental Management Creation of an Internet Based Water Quality Atlas (IWQA) May 4, 2005 IUPUI 1200 Waterway Blvd., Suite 100 polis, 46202-5140 Water Quality Atlas John Buechler, Neil
The Dance Hall Goes in What School District?
 The Dance Hall Goes in What School District? Vern C. Svatos Jarrod S. Doucette Abstract This paper presents the results of a GIS mapping effort created for the Delaware State Department of Education using
2015 NYS Geospatial Applications Awards Competition Entry Form
 2015 NYS Geospatial Applications Awards Competition Entry Form Please use the below template to submit your entry for the 2015 NYS Geospatial Applications Awards Competition. By entering the competition,
2018 FINAL TOWN OF WAXHAW WASTEWATER SYSTEM PLANNING. Master Plan Addendum. Union County B&V PROJECT NO PREPARED FOR
 Black & Veatch Holding Company 2017. All rights reserved. 2018 FINAL TOWN OF WAXHAW WASTEWATER SYSTEM PLANNING Master Plan Addendum B&V PROJECT NO. 195982 PREPARED FOR Union County 7 MARCH 2018 Table of
REPORT ON INVESTMENTS
 REPORT ON INVESTMENTS D.T2.3.3 Investments for technical equipment for the implementation of Web-GIS platform in Mantova 1 Local support group designing Mantova Web-GIS platform. Picture by Maria Giulia
Section 4: Model Development and Application
 Section 4: Model Development and Application The hydrologic model for the Wissahickon Act 167 study was built using GIS layers of land use, hydrologic soil groups, terrain and orthophotography. Within
LBRS Ohio s Location-Based Response System
 LBRS Ohio s Location-Based Response System Comprised of state-level statewide datasets for Ohio, including road centerlines with point-based address locations, parcels, and orthophotography Spatially accurate
What s New in Collector for ArcGIS (Aurora)
") What s New in Collector for ArcGIS (Aurora) Derek Law (dlaw@esri.com) Esri Apps Product Management @GIS_Bandit Oct 10 th, 2018 Agenda Product overview Use cases Preparing data for Collector for ArcGIS
What s New in Collector for ArcGIS (Aurora) Derek Law (dlaw@esri.com) Esri Apps Product Management @GIS_Bandit Oct 10 th, 2018 Agenda Product overview Use cases Preparing data for Collector for ArcGIS
OC Enterprise GIS. Kevin Hills, PLS Cameron Smith, GISP. OC Survey
 OC Enterprise GIS Kevin Hills, PLS Cameron Smith, GISP OC Survey Discussion Points Background & Organizational Structure of OCPW Past practices prior to Enterprise Wide GIS License (ELA) Participating
A GIS-based Approach to Watershed Analysis in Texas Author: Allison Guettner
 Texas A&M University Zachry Department of Civil Engineering CVEN 658 Civil Engineering Applications of GIS Instructor: Dr. Francisco Olivera A GIS-based Approach to Watershed Analysis in Texas Author:
CHAPTER 3 RESEARCH METHODOLOGY
 CHAPTER 3 RESEARCH METHODOLOGY 3.1 INTRODUCTION The research methodology plays an important role in implementing the research and validating the results. Therefore, this research methodology is derived
ISSUES AND APPROACHES TO COUPLING GIS TO AN IRRIGATION DISTRIBUTION NETWORK AND SEEPAGE LOSS MODELS ABSTRACT
 ISSUES AND APPROACHES TO COUPLING GIS TO AN IRRIGATION DISTRIBUTION NETWORK AND SEEPAGE LOSS MODELS Yanbo Huang 1, Milton Henry 2, David Flahive 3, Guy Fipps 4 ABSTRACT Geographic Information Systems (GIS)
GIS-Based Sediment Quality Database for the St. Louis River Area of Concern (AOC): Overview Presentations and Demonstration
: Overview Presentations and Demonstration") GIS-Based Sediment Quality Database for the St. Louis River Area of Concern (AOC): Overview Presentations and Demonstration Judy L. Crane 1 and Dawn E. Smorong 2 1 Minnesota Pollution Control Agency, St.
GIS-Based Sediment Quality Database for the St. Louis River Area of Concern (AOC): Overview Presentations and Demonstration Judy L. Crane 1 and Dawn E. Smorong 2 1 Minnesota Pollution Control Agency, St.
Safe to Save? Archive Options for Geodatabases. Jeff Essic North Carolina State University Libraries
 Safe to Save? Archive Options for Geodatabases Jeff Essic North Carolina State University Libraries 2011 ESRI International Users Conference July 13, 2011 GeoMAPP Geospatial Multistate Archive and Preservation
ArcGIS Web Tools, Templates, and Solutions for Defence & Intelligence. Renee Bernstein Esri Solutions Engineer
 ArcGIS Web Tools, Templates, and Solutions for Defence & Intelligence Renee Bernstein Esri Solutions Engineer ArcGIS Solutions Includes 450+ Industry Focused Apps and Capabilities Organized by 9 Primary
Web GIS Deployment for Administrators. Vanessa Ramirez Solution Engineer, Natural Resources, Esri
 Web GIS Deployment for Administrators Vanessa Ramirez Solution Engineer, Natural Resources, Esri Agenda Web GIS Concepts Web GIS Deployment Patterns Components of an On-Premises Web GIS Federation of Server