World Meterological Organization Polar Space Task Group
|
|
|
- Edwina Porter
- 5 years ago
- Views:
Transcription


1 World Meterological Organization Polar Space Task Group Jerry L. Mullins Coordinator, USGS Antarctic, Arctic and Canadian Programs Reston, VA, USA 30 September 2011

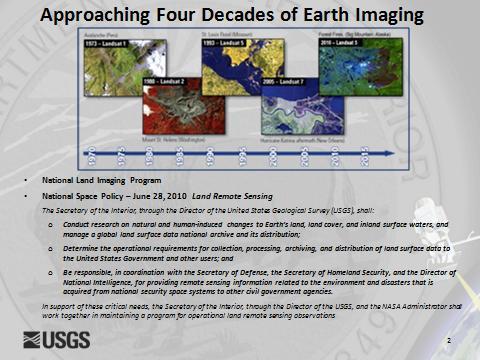
2 1. USGS Landsat Program
, 98.")
 9 spectral")
 all bands Scene-based orthorectified (L1T) all bands Surface")
3 11/06 7/07 4/08 7/09 12/09 5/10 10/10 SIR 1/12 ORR 10/12 11/12 3/13 8/11 9/11 9/12 12/12 Landsat Data Continuity Mission (Landsat 8) Mission Characteristics Orbit: Polar, 705km circular, sun-synchronous, Worldwide Reference System-2 (WRS-2), 98.2 inclination, mid-morning (10:00 am), 16-day repeat, +/- 82 degrees latitude Launch Date: December 2012; Launch Vehicle: Atlas V Mission Life: 5 Years (with consumables for 10 years) Data policy: no charge or restrictions Spacecraft Observatory mass of 3085kg Maximum power of 2130W 3TB Solid State Recorder 384 Mbps X-band downlink Off nadir +/- 15 degrees Operational Land Imager (OLI) 9 spectral bands (including new blue and cirrus bands) 30m resolution for VIS/NIR/SWIR, 15m for PAN 185km swath width Collect 400 WRS-2 scenes/day; 700 TB/5 years Thermal Infrared Sensor (TIRS) Developed by NASA Approximately 100m resolution in 2 bands 185km swath width Data Products Full resolution browse Scene-based reformatted raw (L0Rp) all bands Scene-based orthorectified (L1T) all bands Surface reflectance & ECV, defined by Landsat Science Team Project Milestones ^ ^ ^ ^ ^ ^ ^ ^ ^ ^ ^ ^ ^ LRR 11/12 ATP Authority to Proceed MPDR Mission Preliminary Design Review MCR Mission Concept Review MOR Mission Operations Review MCDR Mission Critical Design Review MRR Mission Readiness Review SIR System Integration Review ORR Operational Readiness Review LRR Launch Readiness Review 4 Use by Affiliation FY-2011 Slide courtesy of Rachel Hadley, EROS

4 Primary Data Users Slide courtesy of Rachel Hadley, EROS 2. Satellite Image Atlas of Glaciers of the World In 1978, the USGS began the preparation of the 11-chapter USGS Professional Paper 1386, Satellite Image Atlas of Glaciers of the World. Between 1979 and 1981, optimum satellite images were distributed to a team of 70 scientists, representing 25 nations and 45 institutions, who agreed to author sections of the Professional Paper concerning either a geographic area (chapters B K) or a glaciological topic (included in Chapter A). The scientists used Landsat 1, 2, and 3 multispectral scanner (MSS) images and Landsat 2 and 3 return beam vidicon (RBV) images to inventory the areal occurrence of glacier ice on our planet within the boundaries of the spacecrafts' coverage (between about 82º north and south latitudes). Some later contributors also used Landsat 4 and 5 MSS and Thematic Mapper, Landsat 7 Enhanced Thematic Mapper-Plus (ETM+), and other satellite images. In addition to analyzing images of a specific geographic area, each author was asked to summarize up-to-date information about the glaciers within each area and compare their present-day areal distribution with reliable historical information (from published maps, reports, and photographs) about their past extent. Because of the limitations of Landsat images for delineating or monitoring
5 small glaciers in some geographic areas (the result of inadequate spatial resolution, lack of suitable seasonal coverage, or absence of coverage), some information on the areal distribution of small glaciers was derived from ancillary sources, including other satellite images. Completion of the atlas will provide an accurate regional inventory of the areal extent of glaciers on our planet during a relatively narrow time interval ( ). Completed volumes Antarctica, Greenland, Europe, Turkey-Iran-Africa, New Zealand and Irian Jaya, South America, North America and Alaska. Volumes to be completed Iceland and Asia Coastal-Change and Glaciological Maps of Antarctica: Changes in the area and volume of the two polar ice sheets in Antarctica and Greenland are intricately linked to changes in global climate, and could result in sea-level changes that could severely affect the densely populated coastal regions on Earth. Melting of the West Antarctica part of the Antarctic ice sheet alone could cause a sea-level rise of approximately 6 m. The potential sealevel rise after melting of the entire Antarctic ice sheet is estimated to be 73 m. In spite of its importance, the mass balance (the net volumetric gain or loss) of the Antarctic ice sheet is poorly known; it is not known whether the ice sheet is growing or shrinking. As a result, measurement of changes in the Antarctic ice sheet has been given a very high priority in recommendations by the Polar Research Board of the National Research Council, by the Scientific Committee on Antarctic Research (SCAR), and by the National Science Foundation s Office of Polar Programs. USGS uses Landsat 1,2,3 and Landsat 4,5,7 to determine coastal change in the Antarctic coastline. The project consists of 23 maps at 1:1,000,000-scale. 3. United States Board on Geographic Names Advisory Committee on Antarctic Names 3.1 Antarctic Geogrpahic Coordinates from Satellite Imagery The US has 13,000+ approved Antarctic geographic names. Coordinates selected from 1:500,000-scale maps are proving to be inaccurate with today s high resolution satellite imagery. New high accuracy coordinates are being produced from satellite imagery. New coordinates will be coordinated internationally with national naming authorities.
6 3.2 Webpages 1. LIMA: 2. US Board on Geographic Names/Advisory Committee on Antarctic Names: 3. US Antarctic Resource Center: 4. Antarctic Aerial Photography USGS Earth Observation and Science Center (EROS) has digitized the Antarctica film stored at the USGS/EROS Center. It has been scanned at 25 micron (1,000 dpi) and is accessible as no cost downloads through EarthExplorer (EE) for either the earlier 400 dpi files and the new 1,000 dpi products digitized. On March 15, 2011, USGS/EROS shipped 4,776 Antarctica original aerial film negatives to the National Archives and Records Administration (NARA) in College Park, MD as a formal records transfer of vinegar syndrome film for cold storage and preservation. The final shipment of all USARC Antarctica film to NARA will occur in fiscal year 2012 British Antarctic Survey Antarctic Aerial Film - In November 2010 BAS shipped 127 rolls of Antarctica film to EROS for scanning at 1,000 dpi to create browse, medium, and high resolution files consistent with the USARC film collection. As of the end of August 2011, that activity is 70% complete. EROS will ship the original BAS film back to Cambridge on or before March 31, BAS and USARC data reside in the same EarthExplorer collection.
Brita Horlings
 Knut Christianson Brita Horlings brita2@uw.edu https://courses.washington.edu/ess431/ Natural Occurrences of Ice: Distribution and environmental factors of seasonal snow, sea ice, glaciers and permafrost
The Polar Ice Sheets Monitoring Project A Coordinated Response from Space Agencies
 The Polar Ice Sheets Monitoring Project A Coordinated Response from Space Agencies Yves Crevier / Members of the PSTG SAR Coordination WG Canadian Space Agency CEOS SIT-28 Meeting Hampton, Virginia, USA
Status report on current and future satellite systems by EUMETSAT Presented to CGMS-44, Plenary session, agenda item D.1
 Status report on current and future satellite systems by EUMETSAT Presented to CGMS-44, Plenary session, agenda item D.1 CGMS-44-EUMETSAT-WP-19.ppt, version 1 (# 859110), 8 June 2016 MISSION PLANNING YEAR...
Sentinel-1 Mission Status
 Sentinel-1 Mission Status Pierre Potin, Sentinel-1 Mission Manager 5TH GEOGLAM RAPP Workshop 16-17 May 2017, ESRIN Sentinel-1: Copernicus radar imaging mission for ocean, land, emergency Part of the Copernicus
Sentinel-1 Mission Status
 Sentinel-1 Mission Status Pierre Potin, Sentinel-1 Mission Manager, ESA Luca Martino, Technical Support Engineer, ESA... and the Sentinel-1 operations team PSTG SAR Coordination Working Group 14 December
Velocity nteasurentents and changes in position of
 Annals of Glaciology 17 1993 International Glaciological Society Velocity nteasurentents and changes in position of Thwaites Glacier/ iceberg tongue frold. aerial photography, Landsat intages and NOAA
The Retreat of the Grinnell Glacier: 1990-Present
 Falk, Hepler, Lopez 1 Megan Falk, Alex Hepler, Michelle Lopez GSP 270/ Graham Group Project/ Final Draft December 8, 2014 Word count: 1,148 Introduction The Retreat of the Grinnell Glacier: 1990-Present
The Soil Atlas of the Northern Circumpolar Region
 Conference Soil, Climate Change and Biodiversity Where do we stand? Brussels, Thursday 23rd and Friday 24th September 2010 1 The Soil Atlas of the Northern Circumpolar Region Luca Montanarella European
Welcome to PolarConnect. With Kelly McCarthy and NASA s Operation IceBridge
 Welcome to PolarConnect With Kelly McCarthy and NASA s Operation IceBridge 5 May 2016 If you are joining by phone, please mute your phone. Press *6 to mute and *6 to unmute. Participant Introductions In
Module 7, Lesson 1 Water world
 Module 7, Lesson 1 Water world Imagine that the year is 2100. Scientists have determined that the rapidly warming climate of the earth will cause the ice sheets of Antarctica to break apart and melt at
HY-2A Satellite User s Guide
 National Satellite Ocean Application Service 2013-5-16 Document Change Record Revision Date Changed Pages/Paragraphs Edit Description i Contents 1 Introduction to HY-2 Satellite... 1 2 HY-2 satellite data
Image 1: Earth from space
 Image 1: Earth from space Credit: NASA Spacecraft: Apollo 17 Sensor: camera using visible light Image date: December 7, 1972 This image is a photograph of Earth taken by Harrison "Jack" Schmitt, an astronaut
Pan-Arctic Digital Elevation Model - International Collaboration in Generation of ArcticDEM
 Pan-Arctic Digital Elevation Model - International Collaboration in Generation of ArcticDEM ESRI International Users Conference, June 30, 2016 Tracy Fuller, USGS Pan-Arctic DEM Technical Lead, Alaska Mapping
Module 7, Lesson 1 Water world
 Module 7, Lesson 1 Water world Imagine that the year is 2100. Scientists have determined that the rapidly warming climate of the earth will cause the ice sheets of Antarctica to break apart and melt at
APPENDIX 2 OVERVIEW OF THE GLOBAL PRECIPITATION MEASUREMENT (GPM) AND THE TROPICAL RAINFALL MEASURING MISSION (TRMM) 2-1
 AND THE TROPICAL RAINFALL MEASURING MISSION (TRMM) 2-1") APPENDIX 2 OVERVIEW OF THE GLOBAL PRECIPITATION MEASUREMENT (GPM) AND THE TROPICAL RAINFALL MEASURING MISSION (TRMM) 2-1 1. Introduction Precipitation is one of most important environmental parameters.
APPENDIX 2 OVERVIEW OF THE GLOBAL PRECIPITATION MEASUREMENT (GPM) AND THE TROPICAL RAINFALL MEASURING MISSION (TRMM) 2-1 1. Introduction Precipitation is one of most important environmental parameters.
Geography involves the study of places: their locations, their characteristics, and how humans use and move around them.
 Physical Geography Looking at the Earth Geography involves the study of places: their locations, their characteristics, and how humans use and move around them. NEXT Physical Geography Looking at the Earth
The Distribution of Cold Environments
 The Distribution of Cold Environments Over 25% of the surface of our planet can be said to have a cold environment, but defining what we actually mean by that can be very challenging. This is because cold
Current Status of the Stratospheric Ozone Layer From: UNEP Environmental Effects of Ozone Depletion and Its Interaction with Climate Change
 Goals Produce a data product that allows users to acquire time series of the distribution of UV-B radiation across the continental USA, based upon measurements from the UVMRP. Provide data in a format
Remote Sensing. Ice and Snow
 Remote Sensing of Ice and Snow Remote Sensing of Ice and Snow DOROTHY K. HALL JAROSLAV MARTINEC London N ew York CHAPMAN AND HALL First published in 1985 by Chapman and Hall Ltd 11 New Fetter Lane, London
WISE Science Data System Single Frame Position Reconstruction Peer Review: Introduction and Overview
 WISE Science Data System Single Frame Position Reconstruction Peer Review: Introduction and Overview R. Cutri and the WSDC Team @ IPAC 1 Review Panel Rachel Akeson (IPAC/MSC) Gene Kopan (IPAC retired)
Mapping Coastal Change Using LiDAR and Multispectral Imagery
 Mapping Coastal Change Using LiDAR and Multispectral Imagery Contributor: Patrick Collins, Technical Solutions Engineer Presented by TABLE OF CONTENTS Introduction... 1 Coastal Change... 1 Mapping Coastal
SENTINEL 1 Mission status and contribution to PSTG
 PSTG SAR WG meeting, 12 September 2016, ESTEC SENTINEL 1 Mission status and contribution to PSTG First Sentinel1B Images 28 April 2016 Sentinel-1B Launch from Kourou, 25 April 2016 Sentinel 1 Mission Operations
UrtheCast s High Resolution Imagery, HD Video and Synthetic Aperture Radar from Space for Smart Earth Observations Dr. Rao S.
 UrtheCast s High Resolution Imagery, HD Video and Synthetic Aperture Radar from Space for Smart Earth Observations Dr. Rao S. Ramayanam Vice President Middle East, Africa and South Asia Geo Smart Asia
Remote Sensing I: Basics
 Remote Sensing I: Basics Kelly M. Brunt Earth System Science Interdisciplinary Center, University of Maryland Cryospheric Science Laboratory, Goddard Space Flight Center kelly.m.brunt@nasa.gov (Based on
ERBE Geographic Scene and Monthly Snow Data
 NASA Contractor Report 4773 ERBE Geographic Scene and Monthly Snow Data Lisa H. Coleman, Beth T. Flug, Shalini Gupta, Edward A. Kizer, and John L. Robbins Science Applications International Corporation
The continent of Antarctica Resource N1
 The continent of Antarctica Resource N1 Prepared by Gillian Bunting Mapping and Geographic Information Centre, British Antarctic Survey February 1999 Equal area projection map of the world Resource N2
Towards eenvironment Prague, March GMES Space Component. Josef Aschbacher Head, ESA GMES Space Office
 Towards eenvironment Prague, 25-27 March 2009 GMES Space Component Josef Aschbacher Head, ESA GMES Space Office Prague from Space Segment 2 05 Nov 2003 CNES 2003 GISAT 2007 ESA GSELAND GMES is an EU led
Yanbo Huang and Guy Fipps, P.E. 2. August 25, 2006
 Landsat Satellite Multi-Spectral Image Classification of Land Cover Change for GIS-Based Urbanization Analysis in Irrigation Districts: Evaluation in Low Rio Grande Valley 1 by Yanbo Huang and Guy Fipps,
Group on Earth Observations (GEO) Cold Regions Work Plan Item WA-01-C3
 Cold Regions Work Plan Item WA-01-C3") EC Panel of Experts on Polar Observations, Research and Services Group on Earth Observations (GEO) Cold Regions Work Plan Item WA-01-C3 Barbara J. Ryan Secretariat Director Lanzhou, China 13 March 2013
EC Panel of Experts on Polar Observations, Research and Services Group on Earth Observations (GEO) Cold Regions Work Plan Item WA-01-C3 Barbara J. Ryan Secretariat Director Lanzhou, China 13 March 2013
Joint Polar Satellite System. 3 rd Post-EPS User Consultation Workshop Mike Haas
 3 rd Post-EPS User Consultation Workshop Mike Haas Overview Introduction - Policy Drivers - Management System Description - Space Segment - Ground Segment Partnerships Status Benefits 2 Introduction (Policy
Group of Experts on Geographical Names Sixteenth Session New York, June 1994
 Group of Experts on Geographical Names Sixteenth Session New York, 13-24 June 1994 Provisional Agenda Item 6 NAMES IN ANTARCTICA, UNITED STATES OF AMERICA Submitted by Roger L. Payne, Executive Secretary
In the spring of 2016, the American Philosophical Society s
 Introduction to the Symposium on Observed Climate Change 1 WARREN M. WASHINGTON Senior Scientist, Climate Change Research Section National Center for Atmospheric Research In the spring of 2016, the American
An Internet-based Agricultural Land Use Trends Visualization System (AgLuT)
") An Internet-based Agricultural Land Use Trends Visualization System (AgLuT) Prepared for Missouri Department of Natural Resources Missouri Department of Conservation 07-01-2000-12-31-2001 Submitted by
An Internet-based Agricultural Land Use Trends Visualization System (AgLuT) Prepared for Missouri Department of Natural Resources Missouri Department of Conservation 07-01-2000-12-31-2001 Submitted by
An Update on EUMETSAT Programmes and Plans. Dieter Klaes on behalf of EUMETSAT teams
 An Update on EUMETSAT Programmes and Plans Dieter Klaes on behalf of EUMETSAT teams 1 21 st International TOVS Study Conference (ITSC), Darmstadt, Germany, 29 November 2017 5 December 2017 Current EUMETSAT
GSC 107 Lab # 3 Calculating sea level changes
 GSC 107 Lab # 3 Calculating sea level changes Student name Student ID Background Glacial-Interglacial Cycles Climate-related sea-level changes of the last century are very minor compared with the large
6. What has been the most effective erosive agent in the climate system? a. Water b. Ice c. Wind
 Multiple Choice. 1. Heinrich Events a. Show increased abundance of warm-water species of planktic foraminifera b. Show greater intensity since the last deglaciation c. Show increased accumulation of ice-rafted
Some NOAA Products that Address PSTG Satellite Observing Requirements. Jeff Key NOAA/NESDIS Madison, Wisconsin USA
 Some NOAA Products that Address PSTG Satellite Observing Requirements Jeff Key NOAA/NESDIS Madison, Wisconsin USA WMO Polar Space Task Group, 4 th meeting, Greenbelt, 30 September 2014 Relevant Missions
NASA Images of Antarctica and the Arctic covered in both land and sea ice
 ICE SHELVES ACTIVITY 1: DECODING THE ROLE OF ANTARCTIC ICE IN GLOBAL CLIMATE Ice Shelves play a critical role in Antarctica, serving as a buffer between the ocean and the continental ice sheet covering
Pan-Arctic Digital Elevation Map (Pan-Arctic DEM)
") Memorandum to CAFF Board 07/28/2017 BACKGROUND: Pan-Arctic Digital Elevation Map (Pan-Arctic DEM) ArcticDEM is a National Geospatial-Intelligence Agency (NGA)-National Science Foundation (NSF) publicprivate
Memorandum to CAFF Board 07/28/2017 BACKGROUND: Pan-Arctic Digital Elevation Map (Pan-Arctic DEM) ArcticDEM is a National Geospatial-Intelligence Agency (NGA)-National Science Foundation (NSF) publicprivate
New NASA Ocean Observations and Coastal Applications
 New NASA Ocean Observations and Coastal Applications Duane Armstrong Chief, Applied Science & Technology Project Office August 20, 2014 1 Outline NASA s new Earth Science Ocean Science Missions for 2014
SPECIAL PROJECT PROGRESS REPORT
 SPECIAL PROJECT PROGRESS REPORT Progress Reports should be 2 to 10 pages in length, depending on importance of the project. All the following mandatory information needs to be provided. Reporting year
History & Scope of Remote Sensing FOUNDATIONS
 History & Scope of Remote Sensing FOUNDATIONS Lecture Overview Introduction Overview of visual information Power of imagery Definition What is remote sensing? Definition standard for class History of Remote
DLR s TerraSAR-X contributes to international fleet of radar satellites to map the Arctic and Antarctica
 DLR s TerraSAR-X contributes to international fleet of radar satellites to map the Arctic and Antarctica The polar regions play an important role in the Earth system. The snow and ice covered ocean and
How Will Melting Ice Sheets Affect Us?
 PASSAGE 4 How Will Melting Ice Sheets Affect Us? Variation is normal. During the last ice age, for example, ice sheets also covered much of North America and Scandinavia. Why is what s happening now different
CryoSat: ESA s Ice Mission:
 CryoSat: ESA s Ice Mission: 6 years in operations: status and achievements T. Parrinello CryoSat Mission Manager M. Drinkwater Mission Scientist CryoSat March 2016 sea-ice thickness CryoSat: A bit of history
Imaging the whole Earth every day. Josh Alban VP, Business Development
 Imaging the whole Earth every day Josh Alban VP, Business Development josh@planet.com Planet Labs helps you detect and act on change by imaging the whole Earth everyday. Challenges Limited Coverage Low
SMAP and SMOS Integrated Soil Moisture Validation. T. J. Jackson USDA ARS
 SMAP and SMOS Integrated Soil Moisture Validation T. J. Jackson USDA ARS Perspective Linkage of SMOS and SMAP soil moisture calibration and validation will have short and long term benefits for both missions.
Sentinel-1 Long Duration Mutual Interference
 MPC-S1 Sentinel-1 Long Duration Mutual Interference Reference: Nomenclature: MPC-0432 DI-MPC-ARC Issue: 1. 0 Date: 2018,Dec.04 MPC-0432 DI-MPC-ARC V1.0 2018,Dec.04 i.1 Chronology Issues: Issue: Date: Reason
Opportunities for advanced Remote Sensing; an outsider s perspective
 Opportunities for advanced Remote Sensing; an outsider s perspective Ramon Hanssen Delft University of Technology 1 Starting questions Can we do more with the data we are already acquire? What s in stock
Outline 23: The Ice Ages-Cenozoic Climatic History
 Outline 23: The Ice Ages-Cenozoic Climatic History Continental Glacier in Antarctica Valley Glaciers in Alaska, note the moraines Valley Glaciers in Alaska, note the moraines Mendenhall Glacier, Juneau,
T h e C o p e r n i c u s m a r i n e s e r v i c e. DG-GROW, Copernicus. Copernicus EU
 T h e C o p e r n i c u s m a r i n e s e r v i c e DG-GROW, Copernicus Copernicus EU Copernicus EU Copernicus EU www.copernicus.eu 2 W h y is t h e m a r i n e s e c t o r so i m p o r t a n t? Blue Economy,
Monitoring Vegetation Growth of Spectrally Landsat Satellite Imagery ETM+ 7 & TM 5 for Western Region of Iraq by Using Remote Sensing Techniques.
 Monitoring Vegetation Growth of Spectrally Landsat Satellite Imagery ETM+ 7 & TM 5 for Western Region of Iraq by Using Remote Sensing Techniques. Fouad K. Mashee, Ahmed A. Zaeen & Gheidaa S. Hadi Remote
Civil Engineering Journal
 Available online at www.civilejournal.org Civil Engineering Journal Vol. 1, No. 2, December, 2015 Comparative Study of Landsat and Aster Data by Morphometric Analysis Sujit Kumar a*, Tapasi Bhandary b
GIS compilation of coastline variability spanning 60 years in the Mackenzie Delta and Tuktoyaktuk in the Beaufort Sea
 GEOLOGICAL SURVEY OF CANADA OPEN FILE 7685 GIS compilation of coastline variability spanning 60 years in the Mackenzie Delta and Tuktoyaktuk in the Beaufort Sea S. Hynes, S.M. Solomon, and D. Whalen 2014
ISRO Science Data Archive: Chandrayaan-1
 Chandrayaan-1 1 Payloads ISRO Science Data Archive: Chandrayaan-1 (and sample imagery) B Gopala Krishna Group Head, SPDCG/SIPA Space Applications Centre (ISRO) Ahmedabad,, INDIA bgk@sac.isro.gov.in Indian
Arctic Science & Engineering. Martin Jeffries. Ron Liston Seminar, 17 October PhD. MSc. Calgary ( ) UK ( )
 UK ( )") Arctic Science & Calgary (1981-1985) Engineering PhD Martin Jeffries MSc Ron Liston Seminar, 17 October 2018. UK (1979-1981) Outline Career Background Research Background The State of the Arctic Arctic
Arctic Science & Calgary (1981-1985) Engineering PhD Martin Jeffries MSc Ron Liston Seminar, 17 October 2018. UK (1979-1981) Outline Career Background Research Background The State of the Arctic Arctic
NASA/UCAR: Effects of Climate Change: Oceans and Ice
 LIVE INTERACTIVE LEARNING @ YOUR DESKTOP NASA/UCAR: Effects of Climate Change: Oceans and Ice Presented by: Becca Hatheway Thursday, October 14, 2010 6:30 p.m. - 8:00 p.m. Eastern time Effects of Climate
The Great Ice Ages. Copyright abcteach.com 2001 Graphics from Art Today
 The Great Ice Ages The Great Ice Ages occurred during the Pleistocene epoch. The word epoch means time period. This period began about 2.5 million years ago and ended roughly 10,000 years ago. During the
A Basic Introduction to Geographic Information Systems (GIS) ~~~~~~~~~~
 ~~~~~~~~~~") A Basic Introduction to Geographic Information Systems (GIS) ~~~~~~~~~~ Rev. Ronald J. Wasowski, C.S.C. Associate Professor of Environmental Science University of Portland Portland, Oregon 3 September
A Basic Introduction to Geographic Information Systems (GIS) ~~~~~~~~~~ Rev. Ronald J. Wasowski, C.S.C. Associate Professor of Environmental Science University of Portland Portland, Oregon 3 September
How do glaciers form?
 Glaciers What is a Glacier? A large mass of moving ice that exists year round is called a glacier. Glaciers are formed when snowfall exceeds snow melt year after year Snow and ice remain on the ground
EUMETSAT Activities Related to Climate
 EUMETSAT Activities Related to Climate Jörg Schulz joerg.schulz@eumetsat.int Slide: 1 What we do USER REQUIREMENTS European National Meteorological Services Operating Agency! European Space Industry Private
1 st Newsletter. IPA Task Force on Remote Sensing of Permafrost
 1 st Newsletter IPA Task Force on Remote Sensing of Permafrost Co Chairs: Guido Grosse (UAF; ffgg1@uaf.edu) & Claude Duguay (University of Waterloo; crduguay@uwaterloo.ca) http://www.permafrostwatch.org/news/ipa_taskforce_remotesensing.html
Product Validation Report Polar Ocean
 Product Validation Report Polar Ocean Lars Stenseng PVR, Version 1.0 July 24, 2014 Product Validation Report - Polar Ocean Lars Stenseng National Space Institute PVR, Version 1.0, Kgs. Lyngby, July 24,
Validation of the Antarctic Snow Accumulation and Ice Discharge Basal Stress Boundary of the Southeastern Region of the Ross Ice Shelf, Antarctica
 Validation of the Antarctic Snow Accumulation and Ice Discharge Basal Stress Boundary of the Southeastern Region of the Ross Ice Shelf, Antarctica TEAM MEMBERS Ayanna Overton, junior Charlie Nelson, senior
1 What Is Climate? TAKE A LOOK 2. Explain Why do areas near the equator tend to have high temperatures?
 CHAPTER 17 1 What Is Climate? SECTION Climate BEFORE YOU READ After you read this section, you should be able to answer these questions: What is climate? What factors affect climate? How do climates differ
APPLICATION OF LAND CHANGE MODELER FOR PREDICTION OF FUTURE LAND USE LAND COVER A CASE STUDY OF VIJAYAWADA CITY
 APPLICATION OF LAND CHANGE MODELER FOR PREDICTION OF FUTURE LAND USE LAND COVER A CASE STUDY OF VIJAYAWADA CITY K. Sundara Kumar 1, Dr. P. Udaya Bhaskar 2, Dr. K. Padmakumari 3 1 Research Scholar, 2,3
Investigation of Arctic ice cover variance using XX century historical ice charts information and last decades microwave data
 Investigation of Arctic ice cover variance using XX century historical ice charts information and last decades microwave data Vasily Smolyanitsky, Arctic and Antarctic Research Institute & JCOMM Expert
Is Greenland Really That Big?
 Details Learning Resources Completion Time: About one period Permission: Download, Share, and Remix Is Greenland Really That Big? Overview NASA s Operation IceBridge images Earth s polar ice in unprecedented
CGMS Baseline. Sustained contributions to the Global Observing System. Endorsed by CGMS-46 in Bengaluru, June 2018
 CGMS Baseline Sustained contributions to the Global Observing System Best Practices for Achieving User Readiness for New Meteorological Satellites Endorsed by CGMS-46 in Bengaluru, June 2018 CGMS/DOC/18/1028862,
3 SHORELINE CLASSIFICATION METHODOLOGY
 3 SHORELINE CLASSIFICATION METHODOLOGY Introduction The ESI scale, as described in Section 2, categorizes coastal habitats in terms of their susceptibility to spilled oil, taking into consideration a number
Chapter 1 Section 2. Land, Water, and Climate
 Chapter 1 Section 2 Land, Water, and Climate Vocabulary 1. Landforms- natural features of the Earth s land surface 2. Elevation- height above sea level 3. Relief- changes in height 4. Core- most inner
Ocean Observation from Haiyang Satellites:
 SPACE SCIENCE ACTIVITIES IN CHINA Ocean Observation from Haiyang Satellites: 2012 2014 AUTHORS JIANG Xingwei LIN Mingsen National Satellite Ocean Application Service, Beijing 100081 ABSTRACT During 2012
ANALYSIS OF GLACIER CHANGE IN THE SIERRA NEVADA PORTLAND STATE UNIVERSITY DEPARTMENT OF GEOLOGY BRADLEY BUSELLI
 ANALYSIS OF GLACIER CHANGE IN THE SIERRA NEVADA PORTLAND STATE UNIVERSITY DEPARTMENT OF GEOLOGY BRADLEY BUSELLI Study area: Sierra Nevada (Glaciers, 2015) Closer look (Glaciers, 2015) Primary goal: Research
Jupiter Icy Moons Orbiter
 Jupiter Icy Moons Orbiter Forum on Concepts and Approaches for Jupiter Icy Moons Orbiter Science Capabilities & Workshop Goals Dr. Colleen Hartman Director of Solar System Exploration June 12, 2003 the
Extending the Deep Blue aerosol record from SeaWiFS and MODIS to NPP-VIIRS
 Extending the Deep Blue aerosol record from SeaWiFS and MODIS to NPP-VIIRS Andrew M. Sayer, N. Christina Hsu (PI), Corey Bettenhausen, Jaehwa Lee Climate & Radiation Laboratory, NASA Goddard Space Flight
Terrain and Satellite Imagery in Madre de Dios, Peru
 Rhett Butler/mongabay.com Terrain and Satellite Imagery in Madre de Dios, Peru Katherine Lininger CE 394 GIS for Water Resources Term Paper December 1, 2011 Introduction Informal and small-scale gold mining
May 2012 Betsy Edwards Program Executive, Earth Science Division Science Mission Directorate, NASA HQ
 May 2012 Betsy Edwards Program Executive, Earth Science Division Science Mission Directorate, NASA HQ Purpose of Briefing To describe some of the current and near-term spectrum requirements from the NASA
Global Warming and Changing Sea Level. Name: Part 1: Am I part of the problem?!
 Part 1: Am I part of the problem?! Name: The consumption of energy in the form of fossil fuel combustion is the largest single contributor to anthropogenic greenhouse gas emissions in the U.S. and the
CNES activities post SPIRIT. Steven Hosford Strategy and Programs Directorate CNES
 CNES activities post SPIRIT Steven Hosford Strategy and Programs Directorate CNES Summary Reminder SPIRIT project Context Data acquired Activities since 2009 Data access Further acquistions New activities
Hyper-Spectral and Copernicus Evolution
 Hyper-Spectral and Copernicus Evolution Antonio Ciccolella - ESA Roma, 1 March 2017 Issue/Revision: 0.0 Reference: ESA UNCLASSIFIED Status: - For Official Use ESA UNCLASSIFIED - For Official Use Hyperspectral
Earth Science and Climate Change
 Earth Science and Climate Change Dr. Mary L. Cleave February 7, 2007 YOU ARE HERE 3 Land Use Changes Over Time Lingering Doubts on Temperature Trends Have Been Resolved 1st CCSP Synthesis & Assessment
1 IntroductIon to the cryosphere
 1 IntroductIon to the cryosphere in this place, nostalgia roams, patient as slow hands on skin, transparent as melt-water. nights are light and long. Shadows settle on the shoulders of air. time steps
Europe to the Moon. BHF 10 Feb 2005 SPC
 Europe to the Moon V162 lift-off on 27 September 2003 at 23:14:39 UTC The launch was perfect SMART-1 separated at 23:56:03 into a GTO (656 x 35,881 km): perfect injection 100 s later telemetry was received
Earth Science Flight Mission Overview
 Earth Science Flight Mission Overview Nand Topiwala Science Mission Directorate NASA Headquarters April 25, 2007 Earth Science Missions Afternoon Constellation, or A-Train, Multi-Satellite Observatory
Korean Arctic Research 2015 update
 FARO Annual Meeting, ASSW 2016 Fairbanks, Alaska, 12 March 2016 Korean Arctic Research 2015 update International Cooperation Department Korea Polar Research Institute Outline KOPRI and Korean Arctic research;
- satellite orbits. Further Reading: Chapter 04 of the text book. Outline. - satellite sensor measurements
 (1 of 12) Further Reading: Chapter 04 of the text book Outline - satellite orbits - satellite sensor measurements - remote sensing of land, atmosphere and oceans (2 of 12) Introduction Remote Sensing:
Global Climate Change
 Global Climate Change Overview: Students will learn about global climate change, what causes global warming, and scientific projections about climate change in the near future. Levels V-VI Grades 9-12
The importance of long-term Arctic weather station data for setting the research stage for climate change studies
 The importance of long-term Arctic weather station data for setting the research stage for climate change studies Taneil Uttal NOAA/Earth Systems Research Laboratory Boulder, Colorado Things to get out
POLAR EXPLORER EXPLORING SEA LEVEL RISE
 POLAR EXPLORER EXPLORING SEA i LEVEL RISE Developed by: Margie Turrin, mkt@ldeo.columbia.edu As a polar explorer you and your team will be collec@ng evidence of changes occurring throughout the world that
Global Temperature Report: December 2018
 Jan 2, 2019 Vol. 28, No. 9 For Additional Information: Dr. John Christy, (256) 961-7763 christy@nsstc.uah.edu Dr. Roy Spencer, (256) 961-7960 spencer@nsstc.uah.edu Global Temperature Report: December 2018
VISUALIZATION URBAN SPATIAL GROWTH OF DESERT CITIES FROM SATELLITE IMAGERY: A PRELIMINARY STUDY
 CO-439 VISUALIZATION URBAN SPATIAL GROWTH OF DESERT CITIES FROM SATELLITE IMAGERY: A PRELIMINARY STUDY YANG X. Florida State University, TALLAHASSEE, FLORIDA, UNITED STATES ABSTRACT Desert cities, particularly
The In-Orbit Commissioning of MSG-1
 Earth Observation The In-Orbit Commissioning of MSG-1 MSG Project Team, Earth Observation Projects Department, ESA Directorate of Earth Observation, ESTEC, Noordwijk, The Netherlands 80 esa bulletin 114
Chapter 2. Changes in Sea Level Melting Cryosphere Atmospheric Changes Summary IPCC (2013)
") IPCC (2013) Ice is melting faster (sea ice, glaciers, ice sheets, snow) Sea level is rising More ocean heat content More intense rainfall More severe drought Fewer frosts More heat waves Spring is arriving
IPCC (2013) Ice is melting faster (sea ice, glaciers, ice sheets, snow) Sea level is rising More ocean heat content More intense rainfall More severe drought Fewer frosts More heat waves Spring is arriving
Skeletal remains of what was a debris-covered glacier near Mt. Everest
 Annual satellite imaging of the world s glaciers Assessment of glacier extent and change GLIMS Development and population of a digital glacier data inventory HIGH ICE Skeletal remains of what was a debris-covered
Services Requirements Paper Executive Council Panel of Experts on Polar & High Mountain Observations, Research, and Services
 Services Requirements Paper Executive Council Panel of Experts on Polar & High Mountain Observations, Research, and Services Aimee M. Devaris Regional Director U.S. National Oceanic and Atmospheric Administration
Princeton Astrophysics Community Meeting
 Princeton Astrophysics Community Meeting Michael Moore Program Executive Astrophysics Division Science Mission Directorate September 4, 2012 Timeline 2011 2012 10 January: Identification of hardware availability
What is Climate? Climate Change Evidence & Causes. Is the Climate Changing? Is the Climate Changing? Is the Climate Changing? Is the Climate Changing?
 What is Climate? 1 Climate Change Evidence & Causes Refers to the average environmental conditions (i.e. temperature, precipitation, extreme events) in a given location over many years Climate is what
Operational systems for SST products. Prof. Chris Merchant University of Reading UK
 Operational systems for SST products Prof. Chris Merchant University of Reading UK Classic Images from ATSR The Gulf Stream ATSR-2 Image, ƛ = 3.7µm Review the steps to get SST using a physical retrieval
Copernicus Space Component Status & Evolution
 Copernicus Space Component Status & Evolution ESCAP, Bangkok 09 October 2017 Simon Jutz Head of the ESA Copernicus Space Office Directorate of Earth Observation Programmes 28 satellites in development
ESA Climate Change Initiative
 ESA Climate Change Initiative Olivier Arino Frascati, 23 June 2009 Climate Change Initiative Rationale Two climate action paths GCOS-82 in 2003 GCOS-92 in 2004 GCOS-107 in 2006 CEOS response 2006 GEOSS