Validation of the Antarctic Snow Accumulation and Ice Discharge Basal Stress Boundary of the Southeastern Region of the Ross Ice Shelf, Antarctica
|
|
|
- Valerie Harrington
- 6 years ago
- Views:
Transcription
1 Validation of the Antarctic Snow Accumulation and Ice Discharge Basal Stress Boundary of the Southeastern Region of the Ross Ice Shelf, Antarctica


2 TEAM MEMBERS Ayanna Overton, junior Charlie Nelson, senior Kamberlin King, sophomore North Carolina A&T State Kentucky State Mississippi Valley State University University University

3 MENTOR Michael Jefferson Jr. Elizabeth City State University
4 OVERVIEW Abstract Introduction Methodology Conclusion Future Work Acknowledgements Questions
5 ABSTRACT The largest ice shelf in Antarctic, Ross Ice Shelf, was investigated over the years of ( ). Near the basal stress boundary between the ice shelf and the West Antarctic ice sheet, ice velocity ranges from a few meters per year to several hundred meters per year in ice streams. Ice velocity increases as the ice moves seaward, reaching more than 1 km yr-1 in the central portions of the ice front. Most of the drainage from West Antarctica into the Ross Ice Shelf flows down two major ice streams, each of which discharges more than 20 km3 of ice each year. Along with velocity changes, the warmest water below parts of the Ross Ice Shelf resides in the lowest portion of the water column because of its high salinity. Vertical mixing caused by tidal stirring can thus induce ablation by lifting the warm water into contact with the ice shelf. This process can cause melting over a period of time and eventually cause breakup of ice shelf. With changes occurring over many years a validation is needed for the Antarctic Snow Accumulation and Ice Discharge (ASAID) basal stress boundary created in After the 2002 Larsen B Ice Shelf disintegration, nearby glaciers in the Antarctic Peninsula accelerated up to eight times their original speed over the next 18 months.
6 ABSTRACT Similar losses of ice tongues in Greenland have caused speed-ups of two to three times the flow rates in just one year. Rapid changes occurring in regions surrounding Antarctica are causing concern in the polar science community to research changes occurring in coastal zones over time. During the research, the team completed study on the Ross Ice Shelf located on the south western coast of the Antarctic. The study included a validation of the ABSB vs. the natural basal stress boundary (NBSB) along the Ross Ice Shelf. The ASAID BSB was created in 2003 by a team of researchers headed by National Aeronautics and Space Administration Goddard Space Flight Center (NASA GSFC), with an aim of studying coastal deviations as it pertains to the mass balance of the entire continent. The point data file was aimed at creating a replica of the natural BSB. Select cloud free Landsat satellite imagery from satellites 1 through 7 was used to detect changes occurring over the span of 19 years. The last major interest in the study included documenting the deviations or incorrect placements of the ABSB vs. NBSB. ENVI 4.7 as well as ENVI 5.0 image manipulation software was used in the geo-rectifying and the geo-referencing process. Changes that occurred were documented in the form of a data table with the change that occurred along with the latitude and longitude geographic coordinates.
7 METHODOLOGY Identifying the Ross Ice Shelf Locating Landsat images Shrinking the text file Converting text file to a vector file Validation of the Basal Stress Boundary Geo-referencing the Image Image Warping Linking Images Tracking Deviations


8 ROSS ICE SHELF Located in the Southeastern region of Antarctica Path/Row: 32/115, 32/116, 30/116


9 LOCATING LANDSAT IMAGES
10 BASAL STRESS BOUNDARY TEXT FILE Water Land

11 ERROR IN FILE SHRINKING
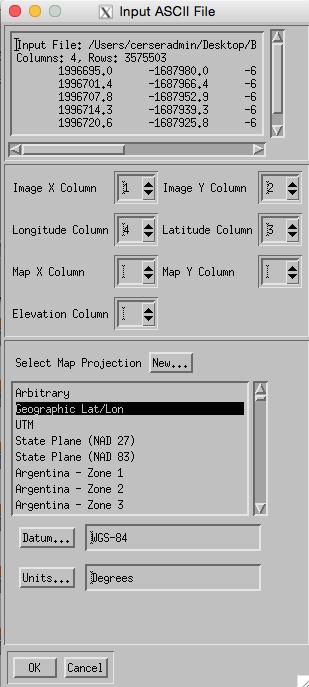

12 CONVERTING TO A VECTOR FILE
13 VALIDATION OF THE BASAL STRESS BOUNDARY Image accuracy and resolution has improved over time Older images needed additional processing Image warping
14 GEO-REFERENCING THE IMAGE ENVI Classic and ENVI 5.0 Base image: recent image Warp image: older image

15 IMAGE WARPING Minimum of 5 points Images are linked Similarities are highlighted
16 LINKING IMAGES

17 TRACKING DEVIATIONS Land Water Land Water

18

19

20 CONCLUSION Observation spanned a total of 25 years Features images before and after the NBSB was discovered Utilized the standard zoom of ~x4 of the ENVI Classic zoom window feature There had been a misplacement of the NBSB along the ice shelf
21 FUTURE WORK Add the text file and vector file into one folder Finish validation of the Ross Ice Shelf in the Southwestern region
22 ACKNOWLEDGEMENTS Michael Jefferson Jr., Mentor Dr. Linda B. Hayden, Principle Investigator CReSIS
23
, ε TAWS TAWS, TS TAWS TAWS TB/TAWS AWS TAWS TAWS TAWS
 West Antarctic Ice Sheet Firn Temperature Record Continuity and Seasonal Trends: Implications for Determining Emissivity Trends from SSM/I Brightness Temperatures Jamika Baltrop, Brian Campbell, TreAsia
Module 7, Lesson 1 Water world
 Module 7, Lesson 1 Water world Imagine that the year is 2100. Scientists have determined that the rapidly warming climate of the earth will cause the ice sheets of Antarctica to break apart and melt at
Module 7, Lesson 1 Water world
 Module 7, Lesson 1 Water world Imagine that the year is 2100. Scientists have determined that the rapidly warming climate of the earth will cause the ice sheets of Antarctica to break apart and melt at
The State of the cryosphere
 The State of the cryosphere Course outline Introduction The cryosphere; what is it? The Earth; a unique planet Cryospheric components Classifications Lecture outlines The State of the cryosphere The State
Sea level contribution of Antarctica & Greenland Andrew Shepherd
 Andrew Shepherd School of Geosciences, Edinburgh Sea Subglacial level contribution lakes of Antarctica & Greenland Climate change Satellite observations Ice Sheets and Sea level Climate change Climate
Earth Science and Climate Change
 Earth Science and Climate Change Dr. Mary L. Cleave February 7, 2007 YOU ARE HERE 3 Land Use Changes Over Time Lingering Doubts on Temperature Trends Have Been Resolved 1st CCSP Synthesis & Assessment
ATOC OUR CHANGING ENVIRONMENT Class 19 (Chp 6) Objectives of Today s Class: The Cryosphere [1] Components, time scales; [2] Seasonal snow
![ATOC OUR CHANGING ENVIRONMENT Class 19 (Chp 6) Objectives of Today s Class: The Cryosphere [1] Components, time scales; [2] Seasonal snow](/thumbs/95/126309683.jpg "ATOC OUR CHANGING ENVIRONMENT Class 19 (Chp 6) Objectives of Today s Class: The Cryosphere [1] Components, time scales; [2] Seasonal snow") ATOC 1060-002 OUR CHANGING ENVIRONMENT Class 19 (Chp 6) Objectives of Today s Class: The Cryosphere [1] Components, time scales; [2] Seasonal snow cover, permafrost, river and lake ice, ; [3]Glaciers and
ATOC 1060-002 OUR CHANGING ENVIRONMENT Class 19 (Chp 6) Objectives of Today s Class: The Cryosphere [1] Components, time scales; [2] Seasonal snow cover, permafrost, river and lake ice, ; [3]Glaciers and
Effect of Ocean Warming on West Antarctic Ice Streams and Ice Shelves. Bryan Riel December 4, 2008
 Effect of Ocean Warming on West Antarctic Ice Streams and Ice Shelves Bryan Riel December 4, 2008 Ice Sheet Mass Balance/WAIS Dynamics -Mass Balance = (Ice/Snow Accumulation) (Surface melting, ice outflux,
UNSTOPPABLE COLLAPSE OF THE WEST ANTARCTIC ICE SHEET IS NOT HAPPENING
 UNSTOPPABLE COLLAPSE OF THE WEST ANTARCTIC ICE SHEET IS NOT HAPPENING Dr. Don J. Easterbrook, Western Washington University, Bellingham, WA May 19, 2014 A New York Times headline reads Scientists Warn
SEA ICE AND GLOBAL WARMING
 jkjk SEA ICE AND GLOBAL WARMING Lesson plan for grades K- 3 By: Laura Sanders, Environmental Science Institute, March 2011 Length of lesson: two 30- minute class periods SOURCES AND RESOURCES: Atmospheric
How Will Melting Ice Sheets Affect Us?
 PASSAGE 4 How Will Melting Ice Sheets Affect Us? Variation is normal. During the last ice age, for example, ice sheets also covered much of North America and Scandinavia. Why is what s happening now different
Meltdown Evidence of Climate Change from Polar Science. Eric Wolff
 Meltdown Evidence of Climate Change from Polar Science Eric Wolff (ewwo@bas.ac.uk) Why are the polar regions important for climate? Heat engine Why are the polar regions important for climate? Heat engine
Claim: Arctic, antarctic and Greenland ice loss is accelerating due to global warming REBUTTAL
 Claim: Arctic, antarctic and Greenland ice loss is accelerating due to global warming REBUTTAL Satellite and surface temperature records and sea surface temperatures show that both the East Antarctic Ice
Basal topography and thinning rates of Petermann Gletscher, northern Greenland, measured by ground-based phase-sensitive radar
 Basal topography and thinning rates of Petermann Gletscher, northern Greenland, measured by ground-based phase-sensitive radar Craig Stewart British Antarctic Survey, Natural Environment Research Council,
Brita Horlings
 Knut Christianson Brita Horlings brita2@uw.edu https://courses.washington.edu/ess431/ Natural Occurrences of Ice: Distribution and environmental factors of seasonal snow, sea ice, glaciers and permafrost
SPQ Module 20 Ice Flows
 SPQ Module 20 Ice Flows When Ray, Richard & Kevin received their sleds in Southern Chili they opened them with excitement, and Kevin remarked they look like little canoes. It is perhaps appropriate that
"Ice Sheets and Sea Level Rise: How Should IPCC Handle Deep Uncertainty?" Michael Oppenheimer For Inside the IPCC Princeton University 1 April 2008
 "Ice Sheets and Sea Level Rise: How Should IPCC Handle Deep Uncertainty?" Michael Oppenheimer For Inside the IPCC Princeton University 1 April 2008 This Talk is about: IPCCs (controversial) assessment
Today s Lecture: Land, biosphere, cryosphere (All that stuff we don t have equations for... )
") Today s Lecture: Land, biosphere, cryosphere (All that stuff we don t have equations for... ) 4 Land, biosphere, cryosphere 1. Introduction 2. Atmosphere 3. Ocean 4. Land, biosphere, cryosphere 4.1 Land
Today s Lecture: Land, biosphere, cryosphere (All that stuff we don t have equations for... ) 4 Land, biosphere, cryosphere 1. Introduction 2. Atmosphere 3. Ocean 4. Land, biosphere, cryosphere 4.1 Land
ACTIVITY II: THE FATE OF THE LARSEN S, A FAMILY OF ANTARCTIC ICE SHELVES
 ACTIVITY II: THE FATE OF THE LARSEN S, A FAMILY OF ANTARCTIC ICE SHELVES Ice Shelves play a critical role in Antarctica, serving as a buffer between the ocean and the continental ice sheet covering the
The recent retreat of glaciers in the world
 The recent retreat of glaciers in the world Consequences for the global environment Dr Bernard Francou Director of Research Emeritus Grenoble-Alpes University - France Glaciers are part of the cryosphere
Use of Geophysical Software for Interpretation of Ice-Penetrating Radar Data and Mapping of Polar Ice Sheets
 Use of Geophysical Software for Interpretation of Ice-Penetrating Radar Data and Mapping of Polar Ice Sheets Alex O. Martinez University of Kansas 2335 Irving Hill Road Lawrence, KS 66045-7612 http://cresis.ku.edu
Using Ice Thickness and Bed Topography to Pick Field Sites Near Swiss Camp, Greenland
 Lauren Andrews 6 May 2010 GEO 386G: GIS final project Using Ice Thickness and Bed Topography to Pick Field Sites Near Swiss Camp, Greenland Problem Formulation My primary goal for this project is to map
Ice Sheets and Glaciers
 Ice Sheets and Glaciers Technical University of Denmark Kees van der Veen Department of Geography University of Kansas Why are glaciers and ice sheets important? Large volume of fresh water stored in ice
The Retreating Glaciers of Mt. Jefferson, Oregon. Using EET Methods in Student Research Projects
 The Retreating Glaciers of Mt. Jefferson, Oregon Using EET Methods in Student Research Projects Image Hemphill, 2006 Earth Exploration Toolbook: Chapters Used Measuring Distance and Area in Satellite Images
Glacial Modification of Terrain
 Glacial Modification Part I Stupendous glaciers and crystal snowflakes -- every form of animate or inanimate existence leaves its impress upon the soul of man. 1 -Orison Swett Marden Glacial Modification
Module 2, Investigation 4: Log 1 Our coasts
 Module 2, Investigation 4: Log 1 Our coasts The coast is where the ocean meets land. Coastlines are always changing their shape. They are being worn away in some places and built up in others. Coasts can
Glaciology (as opposed to Glacial Geology) Why important? What are glaciers? How do they work?
 Why important? What are glaciers? How do they work?") Glaciology (as opposed to Glacial Geology) Why important? What are glaciers? How do they work? Glaciers are important because of their role in creating glacial landscapes (erosional and depositional features).
Glaciology (as opposed to Glacial Geology) Why important? What are glaciers? How do they work? Glaciers are important because of their role in creating glacial landscapes (erosional and depositional features).
Where is Earth s Water?
 PASSAGE 1 Where is Earth s Water? Our planet contains a limited amount of water that is always in motion. The water that comes out of your faucet moved through the atmosphere, flowed across Earth s surface,
GSC 107 Lab # 3 Calculating sea level changes
 GSC 107 Lab # 3 Calculating sea level changes Student name Student ID Background Glacial-Interglacial Cycles Climate-related sea-level changes of the last century are very minor compared with the large
Analyzing Long-Term Drought Effects on Land Surface Temperature and Vegetation Using National Oceanic Atmospheric Administration Satellite s Data
 Analyzing Long-Term Drought Effects on Land Surface Temperature and Vegetation Using National Oceanic Atmospheric Administration Satellite s Data Cornelius Holmes, Derek Morris Jr. S Abstract Analyzing
Chapter 2. Changes in Sea Level Melting Cryosphere Atmospheric Changes Summary IPCC (2013)
") IPCC (2013) Ice is melting faster (sea ice, glaciers, ice sheets, snow) Sea level is rising More ocean heat content More intense rainfall More severe drought Fewer frosts More heat waves Spring is arriving
IPCC (2013) Ice is melting faster (sea ice, glaciers, ice sheets, snow) Sea level is rising More ocean heat content More intense rainfall More severe drought Fewer frosts More heat waves Spring is arriving
ERBE Geographic Scene and Monthly Snow Data
 NASA Contractor Report 4773 ERBE Geographic Scene and Monthly Snow Data Lisa H. Coleman, Beth T. Flug, Shalini Gupta, Edward A. Kizer, and John L. Robbins Science Applications International Corporation
Ice in a changing climate
 Ice in a changing climate ESA$Ice$sheets$CCI$$ Phase$1$Results$&$Contribu8on$to$Climate$ Research$ $ $ R"Forsberg,"L"Sørensen,"R"Meister,"J"Levinsen,"" J"Dall,"A"Kusk"(DTU>Space,"Denmark)" T"Nagler"(ENVEO,"Austria)"
Name Per Date Earth Science Climate & Insolation Test
 Name Per Date Earth Science Climate & Insolation Test 1) Which graph best represents the general relationship between latitude and average surface temperature? 2) The diagram below shows the apparent path
Thwaites and Pine Island Glaciers of Antarctica and the Prospect of Rapid Sea Level Rise
 Thwaites and Pine Island Glaciers of Antarctica and the Prospect of Rapid Sea Level Rise Thomas Mortlock and Paul Somerville, Risk Frontiers The Thwaites and Pine Island glaciers in Antarctica are flowing
POLAR WEEKEND SUBGLACIAL LAKES
 POLAR WEEKEND SUBGLACIAL LAKES TOPIC: AN Unknown Subglacial World CHRISTOPHER SHUMAN, UNIVERSITY OF ADRIENNE BLOCK, LDEO MARYLAND BALTIMORE COUNTY'S GODDARD EARTH SCIENCE AND TECHNOLOGY CENTER PROJECT
Exploring The Polar Connection to Sea Level Rise NGSS Disciplinary Core Ideas Science & Engineering Crosscutting Concepts
 Exploring The Polar Connection to Sea Level Rise NGSS Disciplinary Core Ideas Science & Engineering Crosscutting Concepts Practices MS - ESS: Earth & Space Science 1. Ask questions 2. Developing and using
Meltwater produced by wind-albedo interaction stored in an East Antarctic ice shelf Supplementary Information
 Meltwater produced by wind-albedo interaction stored in an East Antarctic ice shelf Supplementary Information 1 Supplementary Figure 1: (a) Upper and (b) lower surface of an englacial lake surveyed by
The Wilkins Ice Shelf Con Job
 The Wilkins Ice Shelf Con Job John McLean 2 April 2008 On 25 March the US National Snow and Ice Data Center (NSIDC) and the British Antarctic Survey (BAS) jointly published a press statement declaring
TEACHER PAGE Trial Version
 TEACHER PAGE Trial Version * After completion of the lesson, please take a moment to fill out the feedback form on our web site (https://www.cresis.ku.edu/education/k-12/online-data-portal)* Lesson Title:
Reduction and Loss of an Ice Shelf in Elizabeth City State University Bay, Antarctica:
 Reduction and Loss of an Ice Shelf in Elizabeth City State University Bay, Antarctica: 1972-2003 Malcolm LeCompte 1, Robert Bindschadler 2, Linda B. Hayden 1, Michael Jefferson 1, Ya Shonti Bridgers 1,
SCIENTIFIC REPORT NERC GEF
 SCIENTIFIC REPORT NERC GEF Loan 927 Measuring changes in the dynamics of Pine Island Glacier, Antarctica A.M. Smith & E.C. King, British Antarctic Survey (BAS) pp J.B.T. Scott ABSTRACT A brief period of
The continent of Antarctica Resource N1
 The continent of Antarctica Resource N1 Prepared by Gillian Bunting Mapping and Geographic Information Centre, British Antarctic Survey February 1999 Equal area projection map of the world Resource N2
7.1 INTRODUCTION 7.2 OBJECTIVE
 7 LAND USE AND LAND COVER 7.1 INTRODUCTION The knowledge of land use and land cover is important for many planning and management activities as it is considered as an essential element for modeling and
How much are glaciers and ice sheets contributing to global sea-level rise?
 How much are glaciers and ice sheets contributing to global sea-level rise? From measurements made by the IPCC it is clear that Global sea level is rising, however the direct cause of this rise is not
Glaciers Earth 9th Edition Chapter 18 Glaciers: summary in haiku form Key Concepts Glaciers Glaciers Glaciers Glaciers
 1 2 3 4 5 6 7 8 9 10 11 12 13 14 Earth 9 th Edition Chapter 18 : summary in haiku form Ten thousand years thence big glaciers began to melt - called "global warming." Key Concepts and types of glaciers.
Lecture 21: Glaciers and Paleoclimate Read: Chapter 15 Homework due Thursday Nov. 12. What we ll learn today:! Learning Objectives (LO)
") Learning Objectives (LO) Lecture 21: Glaciers and Paleoclimate Read: Chapter 15 Homework due Thursday Nov. 12 What we ll learn today:! 1. 1. Glaciers and where they occur! 2. 2. Compare depositional and
Learning Objectives (LO) Lecture 21: Glaciers and Paleoclimate Read: Chapter 15 Homework due Thursday Nov. 12 What we ll learn today:! 1. 1. Glaciers and where they occur! 2. 2. Compare depositional and
SEVERE WEATHER AND FRONTS TAKE HOME QUIZ
 1. Most of the hurricanes that affect the east coast of the United States originally form over the A) warm waters of the Atlantic Ocean in summer B) warm land of the southeastern United States in summer
Dropping Ice Shelves onto an Ocean Model and Moving Grounding Lines. Robert Hallberg NOAA / GFDL
 Dropping Ice Shelves onto an Ocean Model and Moving Grounding Lines Robert Hallberg NOAA / GFDL Projected Global Mean Sea Level Rise Sources of uncertainty in 2100 global mean sea level projections: Forcing
Glacial Geomorphology Lecture 1: Glaciers & Glacial Environments. GGY 166: Geomorphology of Southern Africa
 Glacial Geomorphology Lecture 1: Glaciers & Glacial Environments GGY 166: Geomorphology of Southern Africa Relevance in Southern African Context South African landscape has been influenced by glacial action
POLAR WEEKEND SHRINKING ICE SHEETS AND RISING SEA LEVEL
 POLAR WEEKEND SHRINKING ICE SHEETS AND RISING SEA LEVEL TOPIC: Shrinking Ice Sheets and Rising Sea Levels PROJECT PERSONNEL: Dr. Robert Bindschadler, Glaciologist, NASA Scientists provide information on
Rio Santa Geodatabase Project
 Rio Santa Geodatabase Project Amanda Cuellar December 7, 2012 Introduction The McKinney research group (of which I am a part) collaborates with international and onsite researchers to evaluate the risks
Ice Sheets and Climate Change. William H. Lipscomb Los Alamos National Laboratory
 Ice Sheets and Climate Change William H. Lipscomb Los Alamos National Laboratory What is an expert? An expert is somebody who is more than 50 miles from home, has no responsibility for implementing the
LVIS OIB 2012 Antarctica Grid Mapping and Flights
 LVIS OIB 2012 Antarctica Grid Mapping and Flights The following document presents LVIS flight lines and sample plans to be considered for the Fall 2012 Antarctica G- V OIB deployment. LVIS Planning Team:
Module 7, Lesson 2 In the eye of the storm
 Module 7, Lesson 2 In the eye of the storm October 21, 1998 A tropical storm is brewing in the Atlantic Ocean. It began as a tropical wave a few weeks earlier, off the coast of western Africa. Today it
Module 12: Oceanography Topic 6 Content: Oceans and Climate Change Notes
 Introduction Module 12: Oceanography With water covering a large portion of the planet, it is very important to monitor the consequences of global warming in the oceans. Click NEXT to learn about the potential
Sep May Ppt Anomaly (N = 60)
") balance (annual net balance and its summer/winter components) measures how climate affects the health of Arctic glaciers. As most 2007 08 measurements are not yet available, we report results for the 2006
balance (annual net balance and its summer/winter components) measures how climate affects the health of Arctic glaciers. As most 2007 08 measurements are not yet available, we report results for the 2006
GEPL 4500/5500 Lab 1 Geo-rectifying Imagery Due Wednesday March 2, Geo-rectifying an image:
 GEPL 4500/5500 Lab 1 Geo-rectifying Imagery Due Wednesday March 2, 2005 Geo-rectifying an image: You will be creating a geo-referenced images in this lab. The goal of this lab is to introduce you to the
POLAR I.C.E. (Interactive Climate Education) REMOTE SENSING: USING RADAR TO LOOK THROUGH ICE
 REMOTE SENSING: USING RADAR TO LOOK THROUGH ICE") POLAR I.C.E. (Interactive Climate Education) REMOTE SENSING: USING RADAR TO LOOK THROUGH ICE BUILD A 3D MODEL OF THE LANDSCAPE THAT LIES UNDER THE ICE! INTRODUCTION: It is hard to believe that melting
POLAR I.C.E. (Interactive Climate Education) REMOTE SENSING: USING RADAR TO LOOK THROUGH ICE BUILD A 3D MODEL OF THE LANDSCAPE THAT LIES UNDER THE ICE! INTRODUCTION: It is hard to believe that melting
The Wedge, Grease and Heat: Why Ice Sheets Hate Water
 The Wedge, Grease and Heat: Why Ice Sheets Hate Water Dr. Robert Bindschadler Chief Scientist Laboratory for Hydrospheric and Biospheric Sciences NASA Goddard Space Flight Center Robert.A.Bindschadler@nasa.gov
POLAR EXPLORER EXPLORING SEA LEVEL RISE
 POLAR EXPLORER EXPLORING SEA i LEVEL RISE Developed by: Margie Turrin, mkt@ldeo.columbia.edu As a polar explorer you and your team will be collec@ng evidence of changes occurring throughout the world that
Sea level projections with semiempirical and earth system models
 Sea level projections with semiempirical and earth system models John C. Moore College of Global Change and Earth System Science, Beijing Normal University, Beijing, China and Arctic Centre, University
Introduction to Global Warming
 Introduction to Global Warming Cryosphere (including sea level) and its modelling Ralf GREVE Institute of Low Temperature Science Hokkaido University Sapporo, 2010.09.14 http://wwwice.lowtem.hokudai.ac.jp/~greve/
Welcome to PolarConnect. With Kelly McCarthy and NASA s Operation IceBridge
 Welcome to PolarConnect With Kelly McCarthy and NASA s Operation IceBridge 5 May 2016 If you are joining by phone, please mute your phone. Press *6 to mute and *6 to unmute. Participant Introductions In
Appendix A. Supplementary Material
 73 74 75 76 77 78 79 71 711 712 713 714 715 716 717 718 719 72 721 722 723 724 725 726 727 728 Appendix A. Supplementary Material Antarctic regions We initially localize over all of Antarctica, and analyze
Glaciers. (Shaping Earth s Surface, Part 6) Science 330 Summer 2005
 Science 330 Summer 2005") Glaciers (Shaping Earth s Surface, Part 6) Science 330 Summer 2005 1 Glaciers Glaciers are parts of two basic cycles Hydrologic cycle Rock cycle Glacier a thick mass of ice that originates on land from
Glaciers (Shaping Earth s Surface, Part 6) Science 330 Summer 2005 1 Glaciers Glaciers are parts of two basic cycles Hydrologic cycle Rock cycle Glacier a thick mass of ice that originates on land from
Climate change: How do we know?
 Climate change: How do we know? This graph, based on the comparison of atmospheric samples contained in ice cores and more recent direct measurements, provides evidence that atmospheric CO2 has increased
Waking Giants: Ice Sheets in a Warming World
 Waking Giants: Ice Sheets in a Warming World Dr. Robert Bindschadler Chief Scien6st Hydrospheric and Biospheric Sciences Laboratory NASA Goddard Space Flight Center Robert.A.Bindschadler@nasa.gov Ice Sheets
Effect of Ocean Warming on West Antarctic Ice Streams and Ice Shelves
 Effect of Ocean Warming on West Antarctic Ice Streams and Ice Shelves By Bryan Riel GEO 387H Physical Climatology Dr. Zong-Liang Yang November 18, 2008 Abstract The Intergovernmental Panel on Climate Change
Overview: Key Concepts: Time: 2, minute class periods. Materials:
 Text and Activities Adapted from: Teachers Domain, Texas A&M University: Ocean Drilling Distance Learning Program, The New York Times, Center for Remote Sensing of Ice Sheets (CReSIS), the Natural Resources
Projection of global and regional sea level change for the 21st century
 Projection of global and regional sea level change for the 21st century Jonathan Gregory 1,2 1 NCAS-Climate, University of Reading 2 Met Office Hadley Centre, Exeter Global mean sea level rise observed
Unit 1: Geography. For additional information, refer to this website: 1 G e o g r a p h y
 Unit 1: Geography For additional information, refer to this website: http://mryoungtms.weebly.com/ 1 G e o g r a p h y Continents and Oceans SOL USI. 2a Essential Understanding: Continents are large land
Thwaites and Pine Island Glaciers of Antarctica and the Prospect of Rapid Sea Level Rise
 Thwaites and Pine Island Glaciers of Antarctica and the Prospect of Rapid Sea Level Rise Thomas Mortlock and Paul Somerville, Risk Frontiers; Tony Wong, University of Colorado at Boulder, USA, and; Alexander
CLIMATE READY BOSTON. Climate Projections Consensus ADAPTED FROM THE BOSTON RESEARCH ADVISORY GROUP REPORT MAY 2016
 CLIMATE READY BOSTON Sasaki Steering Committee Meeting, March 28 nd, 2016 Climate Projections Consensus ADAPTED FROM THE BOSTON RESEARCH ADVISORY GROUP REPORT MAY 2016 WHAT S IN STORE FOR BOSTON S CLIMATE?
Grade 8 Science. Unit 1: Water Systems on Earth Chapter 1
 Grade 8 Science Unit 1: Water Systems on Earth Chapter 1 Effects of Water? Churchill River Large Ocean Wave How do you use water? House Hold Use Personal Use Recreational Activities Water Distribution
NASA Images of Antarctica and the Arctic covered in both land and sea ice
 ICE SHELVES ACTIVITY 1: DECODING THE ROLE OF ANTARCTIC ICE IN GLOBAL CLIMATE Ice Shelves play a critical role in Antarctica, serving as a buffer between the ocean and the continental ice sheet covering
Physical Oceanography
 Physical Oceanography SECTION 15.1 The Oceans In your textbook, read about modern oceanography. For each item in Column A, write the letter of the matching item in Column B. Column A 1. German research
Harnessing the Power of Earth System Science for Developing Science Practices and Crosscutting Concepts
 Harnessing the Power of Earth System Science for Developing Science Practices and Crosscutting Concepts Roberta Johnson, Richard Jones, Joe Monaco, Wendy Van Norden, Michael Passow, National Earth Science
GLOBAL WARMING: GLOBAL WARMING. landscape implications. Andrew Goudie St Cross College Oxford
 GLOBAL WARMING: GLOBAL WARMING landscape implications Andrew Goudie St Cross College Oxford THE PROCESS OF CHANGE HAS STARTED IPCC 2007 Increased Glacier retreat since the early 1990s Area of seasonally
Antarctic Automatic Weather Station Data for the calendar year 2000
 Antarctic Automatic Weather Station Data for the calendar year 2000 by Linda M. Keller George A. Weidner Charles R. Stearns Matthew T. Whittaker Robert E. Holmes Matthew A. Lazzara Space Science and Engineering
Investigating snow accumulation variability on the Antarctic Peninsula using Ground Penetrating Radar. - A tool for interpreting ice core records
 Investigating snow accumulation variability on the Antarctic Peninsula using Ground - A tool for interpreting ice core records Elizabeth R. Thomas June 2008 Scientific Report in support of Loan 824 Identifying
Grounding line mapping in Antarctica using 15 years of DInSAR data
 Grounding line mapping in Antarctica using 15 years of DInSAR data Jérémie Mouginot 1 Eric Rignot 1,2, Bernd Scheuchl 1 1 University of California, Irvine 2 Jet Propulsion Laboratory Introduction Outline
Antarctica s Climate Secrets Poster 5. Decoding Antarctica s Climate History
 Decoding Antarctica s Climate History Decoding Antarctica s Climate History Scientists are working to uncover and decode Antarctica s climate secrets. In order to piece together a complete story, they
World Meterological Organization Polar Space Task Group
 World Meterological Organization Polar Space Task Group Jerry L. Mullins Coordinator, USGS Antarctic, Arctic and Canadian Programs Reston, VA, USA 30 September 2011 1. USGS Landsat Program 11/06 7/07 4/08
+SOI Neutral SOI -SOI. Melt+ Melt- Melt+ Melt- Melt+ Melt- +SAM 1 (0.76) 6 (3.02) 1 (1.13) 5 (4.92) 1 (2.27) 0 (1.89) 14
 6 (3.02) 1 (1.13) 5 (4.92) 1 (2.27) 0 (1.89) 14") Supplementary Table 1. Contingency table tallying the respective counts of positive and negative surface melt index anomalies in the Ross sector as a function of the signs of the Southern Annular Mode
Supplementary Table 1. Contingency table tallying the respective counts of positive and negative surface melt index anomalies in the Ross sector as a function of the signs of the Southern Annular Mode
Determining the spatio-temporal distribution of 20th Century Antarctic Peninsula glacier mass change
 Determining the spatio-temporal distribution of 20th Century Antarctic Peninsula glacier mass change Jon Mills, Pauline Miller, Matthias Kunz School of Civil Engineering & Geosciences / Centre for Earth
Ice sheets of West Antarctica are warming fast. West Antarctic Ice Sheet warming twice earlier estimate
 Ice sheets of West Antarctica are warming fast 02 January 2013 Magazine issue 2898. Subscribe and save For similar stories, visit the Climate Change Topic Guide THE ice sheets of West Antarctica are warming
Deke Arndt, Chief, Climate Monitoring Branch, NOAA s National Climatic Data Center
 Thomas R. Karl, L.H.D., Director, NOAA s National Climatic Data Center, and Chair of the Subcommittee on Global Change Research Peter Thorne, PhD, Senior Scientist, Cooperative Institute for Climate and
The Environmental Literacy Framework (ELF) was made possible through financial support provided by
 was made possible through financial support provided by") The Environmental Literacy Framework (ELF) was made possible through financial support provided by Energy Geosphere As part of NOAA Environmental Literacy Grant #NA09SEC490009 to the University of Nebraska
The Environmental Literacy Framework (ELF) was made possible through financial support provided by Energy Geosphere As part of NOAA Environmental Literacy Grant #NA09SEC490009 to the University of Nebraska
Sea ice concentration off Dronning Maud Land, Antarctica
 Rapportserie nr. 117 Olga Pavlova and Jan-Gunnar Winther Sea ice concentration off Dronning Maud Land, Antarctica The Norwegian Polar Institute is Norway s main institution for research, monitoring and
CHAPTER 1. Geo Challenges 1A to 1D. & World Map Activity
 CHAPTER 1 Geo Challenges 1A to 1D & World Map Activity SELECT YOUR CHALLENGE World Map Activity Challenge 1A Challenge 1B Challenge 1C Challenge 1D Challenge 1A WS PG. 2 STEP #1 Label the largest continent
2 Georgia: Its Heritage and Its Promise
 TERMS region, erosion, fault, elevation, Fall Line, aquifer, marsh, climate, weather, precipitation, drought, tornado, hurricane, wetland, estuary, barrier island, swamp PLACES Appalachian Mountains, Appalachian
Spring break reading. Glacial formation. Surface processes: Glaciers and deserts. The Control of Nature
 suggested Spring break reading The Control of Nature by John McPhee Surface processes: Glaciers and deserts describes our efforts to control three natural hazards: 1. The Mississippi Floods 2. The Heimaey
Future Sea Level Rise and its Implications for SIDS and LDCs
 Future Sea Level Rise and its Implications for SIDS and LDCs Bill Hare, Michiel Schaeffer, Mahé Perrette, Matthias Mengel COP17, Durban, 2 nd December Overview Part 1: Global sea level: past and future
2/23/2009. Visualizing Earth Science. Chapter Overview. Deserts and Drylands. Glaciers and Ice Sheets
 Visualizing Earth Science By Z. Merali and B. F. Skinner Chapter 6 Deserts, Glaciers and Ice Sheets Chapter Overview Deserts and Drylands Glaciers and Ice Sheets Deserts Geography Categorization of deserts
 Contributors: Arlene Fiore 1, Lee Murray 1, Luke Valin 1, Olivia Clifton 1, Jean Guo 1 Author: Melissa Seto 1 Analysis of Wisconsin 2007 High-Ozone event Section 1A: Can satellite NO 2 columns inform us
Ice in the climate system. Summary so far. Today. The Cryosphere. 1. Climate history of the Earth. 2. Paleo observations (1)
") Ice in the climate system 1. Climate history of the Earth 2. Paleo observations (1) 3. Paleo observations (2) 4. Ice ages 5. Climate sensitivity 6. Ice in the climate system Summary so far Radiation (Milankovitch
Ice in the climate system 1. Climate history of the Earth 2. Paleo observations (1) 3. Paleo observations (2) 4. Ice ages 5. Climate sensitivity 6. Ice in the climate system Summary so far Radiation (Milankovitch
Modeling Sea Level Rise in Caribbean SIDS: The Need for Tide Gauge Data
 Modeling Sea Level Rise in Caribbean SIDS: The Need for Tide Gauge Data Michael Sutherland and Demi Singh Department of Geomatics Engineering and Land Management Faculty of Engineering University of the
GEOL/ENVS 3520 Spring 2009 Hour Exam #2
 GEOL/ENVS 3520 Spring 2009 Hour Exam #2 Enter your name, the date, your ID number, and a made-up 4-digit code (for later recall and identification of your test results) on the separate test sheet. Carefully
Climate Roles of Land Surface
 Lecture 5: Land Surface and Cryosphere (Outline) Climate Roles Surface Energy Balance Surface Water Balance Sea Ice Land Ice (from Our Changing Planet) Surface Albedo Climate Roles of Land Surface greenhouse