Using Ice Thickness and Bed Topography to Pick Field Sites Near Swiss Camp, Greenland
|
|
|
- Myron Sutton
- 6 years ago
- Views:
Transcription

1 Lauren Andrews 6 May 2010 GEO 386G: GIS final project Using Ice Thickness and Bed Topography to Pick Field Sites Near Swiss Camp, Greenland Problem Formulation My primary goal for this project is to map ice thicknesses and hydraulic potential in the vicinity of Swiss Camp, Greenland. This information will be used in conjunction with historic supraglacial lake bodies (included in a final map) to determine the most suitable locations for three boreholes in These boreholes will intersect the bed and will be instrumented with pressure transducers, tilt meters, and a several other instruments. The main focus of this research is understanding the characteristics of subglacial hydrology in the area. By having basal hydraulic potentials and ice thicknesses readily available, we will be able to better understand the conditions under which we will be drilling. Data Collection and Preprocessing In order to create the layers required for the maps, I used a combination of data that I gathered from various sources. The base map is a MODIS (Moderate Resolution Imaging Spectroradiometer) image of Greenland from These images are TIFF documents so I was able to import the image directly into ArcGIS. The most useful projection for Greenland is the Polar Stereographic projection, which uses the WGS 1984 datum. I determined that the use of the Polar Stereographic projection would be most effective for this project; Figure 1. Ice thickness as text files available on the CReSIS website ( These data are eventually converted into raster data for analysis. L. Andrews 1
 data. These data are extensive and difficult to process effectively.")
 and then import the data into ArcMap using the import X-Y data.")
2 therefore, all layers, including the MODIS base map use this projection. The next, and most difficult, step involved sorting, gathering, and importing CReSIS (Center for Remote Sensing of Ice Sheets) data. These data are extensive and difficult to process effectively. CreSIS determines the ice sheet thickness using radar to determine ice thicknesses. These data are available on the CReSIS webpage in text format (Figure 1). My first step was to import all the data into a text document (luckily, the data were already in decimal degrees) and then import the data into ArcMap using the import X-Y data. This process permitted me to establish the projection as Polar Stereographic. Upon importing these data, I realized that the amount of information was overwhelming and would significantly slow any data processing work (Figure 2). Therefore, I decided limit the amount of data I was importing by sorting and selecting the X-Y data by the appropriate longitude and latitude in Excel before importing into ArcMap. Once I limited the spatial extent of the data by manually selecting the data I needed, I was able to quickly import the data into ArcMap (Figure 3). However, the CReSIS point data did not contain the formatting needed for Figure 3. Limited CReSIS data imported into ArcMap and displayed using a Polar Stereographic projection. Figure 2. Projection of CReSIS data in ArcMap. The extensive amount of point data caused significant processing problems. Data was selected spatially in Excel to speed future data analysis. manipulation in ArcMap. To remedy this, the data L. Andrews 2
3 were exported and saved both in my GIS_Lab file and as a layer in the current project. After completing the preprocessing for the CReSIS data, it was necessary to complete the preprocessing for the bedrock topography. The bedrock elevation point data was also available via the CReSIS website. The CReSIS project completed the bedrock elevation data using ICEsat data. It was still necessary to complete the same steps that I completed with the ice thickness data. The amount of data was limited by sorting by longitude and latitude in the text document then the remaining data were imported into ArcMap, much like the ice thickness data. GPS locations from the field season, weather stations and the Swiss Camp base were imported into the project as well. A text file identifying the locations of each point was created and imported into the project. The layer was then exported and an editable point file was created at the same time. At this time, I also imported points marking historic supraglacial lakes previously identified (not by me) using ArcMap (Figure 4). All the layers that I needed Figure 4. Supraglacial lake filling and drainage events through to complete my analysis are now in a project and can be easily manipulated, more or less. ArcMap Processing The primary components of ArcMap processing for this project include defining an area of interest for the data and MODIS image, creating raster data from the CReSIS and BEDMAP point data, and using map algebra to determine the ice sheet surface and the basal hydraulic potential. L. Andrews 3

. Figure 5. AOI created by editing a shapefile created in ArcCatalog.")
4 Area of Interest I decided to define an area of interest (AOI) for this project because relative to the initial data set, the area needed to complete the appropriate calculations is relatively small. In order to define an AOI to which I could clip the MODIS image and CReSIS data, I created a polygon shapefile in ArcCatalog and defined the projection as Polar Stereographic. Next, I added the shapefile to the ArcMap project and created a polygon defining my AOI using the editor toolbar. This AOI is a simple red box in which all the lake drainage events, GPS locations, and weather stations are contained (Figure 5). Figure 5. AOI created by editing a shapefile created in ArcCatalog. The area was limited to the area near Jakoshavn Isbre. Clipping the Data I decided to clip the MODIS image using the Clip tool in the Raster toolset of the Data Management Toolbox. I define the input raster as the MODIS image and used the newly created AOI as the boundaries of the clip. In order to clip the ice thickness and bed topography point data, I used the Clip tool of the Analysis toolset in the Coverage toolbox. The input files were the point data and the clip was defined by the AOI (Figure 6). This could also be completed using the Selection tool. First select the points by location (within the AOI polygon). Next, the points would need to be extracted and added as a new layer in the project. I found that using the clip tool was more efficient and decided to use it throughout the process. Figure 6. Clipped bed elevation data. All files were clipped to the AOI in order to more easily manipulated in ArcMap and to represent the field area. L. Andrews 4

5 Raster Creation Once I limited the size of the data sets by clipping them to my AOI, I created rasters from the bed topography and ice thickness point data. Spatial interpolation is needed to create appropriate rasters. Because the data are elevation data, I believe using the spline method is most appropriate. In order to convert the point data to a raster file I used the Spatial Analyst toolbar. In the drop down menu, I chose Convert to Raster. Each time I completed this process (once each for the CReSIS data sets) I selected the input layer and the spatial interpolation method (Figure 7; Figure 8). I saved these new layers in my GIS_Lab folder. Figure 7. Raster of ice surface elevations derived from the clipped point data. L. Andrews 5

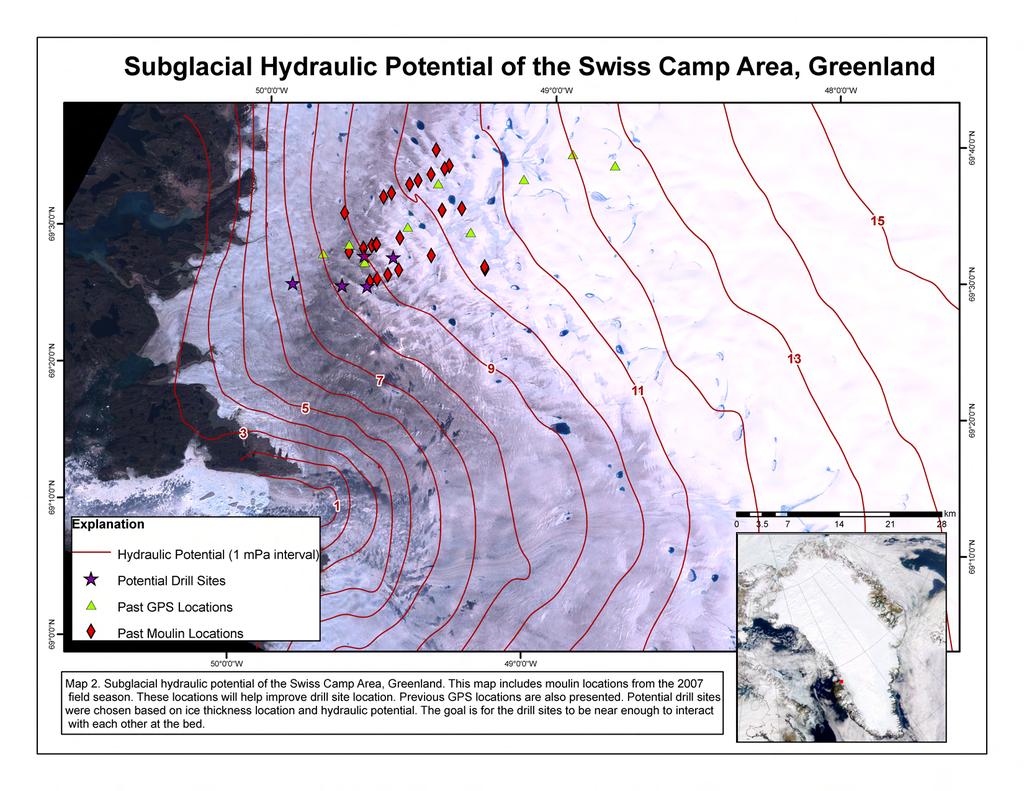
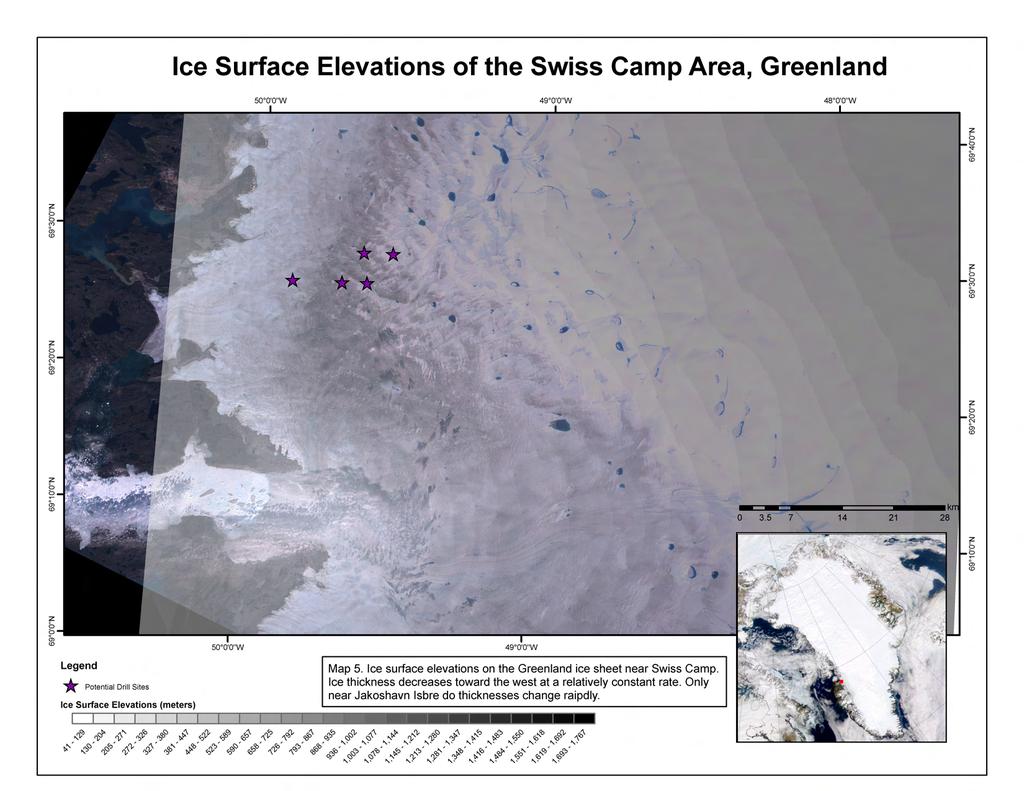
6 Figure 8. An opaque view of the bedrock raster data. It is overlain by the point bedrock data. Map Algebra In order to complete my final maps, I constructed two new rasters using the raster calculator. First, I created an ice surface elevation raster by adding the ice thickness raster and the bedrock elevation raster. Next, I created a raster that displays the hydraulic potential using the following equation: φ = ρ w gb + ρ i g(h B) In this equation, the acceleration due to gravity, g, is a constant at 9.81m/s 2, the density of water, ρ w, is approximately 100 kg/m 2, the density of ice, ρ i, is approximately 900 kg/m 2. For the purposes of this equation, B represents the bedrock elevation raster and H represents the ice surface elevation raster. The resulting raster was then converted into contour lines using the Raster to Polyline tool in the Conversion toolbox (Figure 9). L. Andrews 6
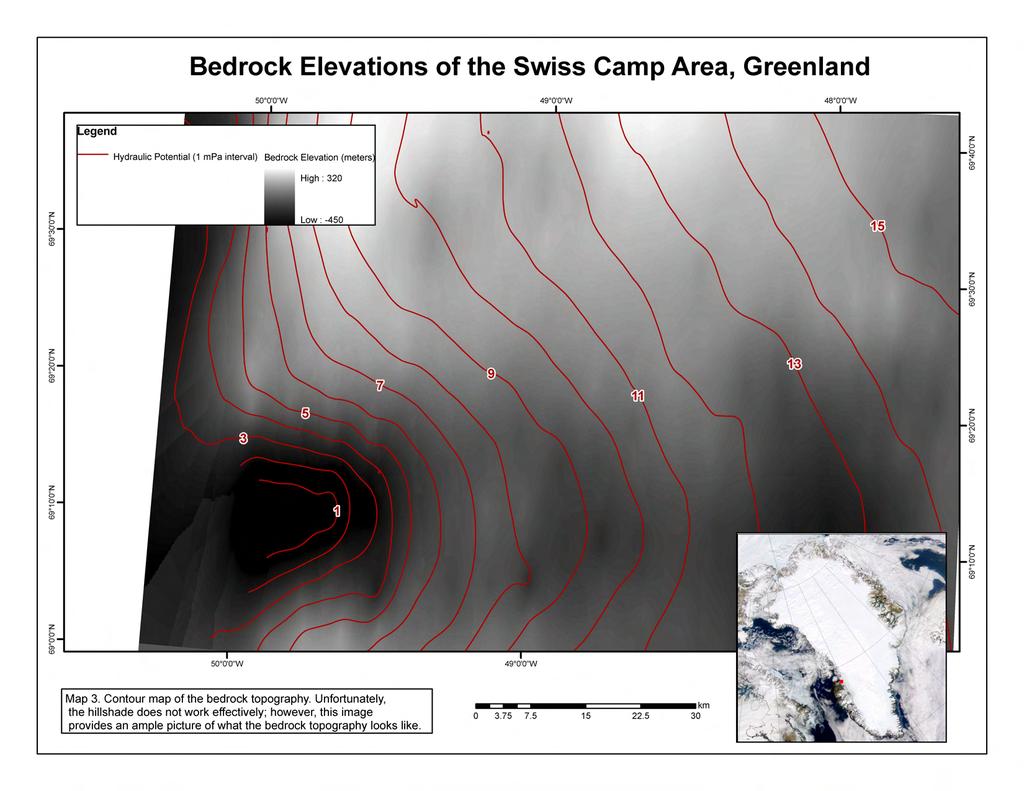
7 Figure 9. A screen capture of the basal hydraulic pressure contour lines. The lines are only an approximate of hydraulic potential; however, they do provide an idea of the water flow direction under the ice sheet. Conclusions and Final Maps Using the final maps I completed, I determined several locations that may be suitable as drill sites. These locations are chosen on the original CReSIS lines because here the data is not interpolated; therefore, there is less uncertainty in what ice thickness to expect. However, having the ice thickness and hydraulic potential throughout the region will be useful in the event a new drill site needs to be found. There are some other interesting characteristics present in the map. Of note is the significant over-steepening of the bed under Jakoshavn Isbre. The significant elevation change is likely one of the causes of the significant ice velocities in the region. In addition, much of Jakoshavn s bed is below sea level, which could make it more susceptible to rapid retreat. The final maps resulting from this project are included as attachments to this document. I consider this project the first iteration of these maps. After completion of my project, I realized that there are several things that I could have done differently to improve the results. The first would be to digitize the coast line of Greenland. This would allow me to clip the raster files that I created by the coast line. The raster files currently do not line up nicely with the coast line due to the timing difference between the MODIS and CReSIS data and the resolution of the CReSIS data. In addition, I believe displaying bed and ice surface elevation as a raster is relatively ineffective, I should have displayed them as contour lines. However, I attempted create contours from the raster data and I was consistently given an error stating that the raster data was not in the correct format (it was L. Andrews 7
8 floating point). I could not figure out how to change the format of the raster data or to recreate the raster in a different format. I plan on adding to this project this summer by using higher resolution data and picking the lake drainage events from 2003 to present. In addition, we just received very high resolution satellite Quick Bird imagery of our field site and plan to use this data to improve the location of drill sites and identify surface features that persist through the years. L. Andrews 8
9
10
11
12
13
Determining the Location of the Simav Fault
 Lindsey German May 3, 2012 Determining the Location of the Simav Fault 1. Introduction and Problem Formulation: The issue I will be focusing on involves interpreting the location of the Simav fault in
Lauren Jacob May 6, Tectonics of the Northern Menderes Massif: The Simav Detachment and its relationship to three granite plutons
 Lauren Jacob May 6, 2010 Tectonics of the Northern Menderes Massif: The Simav Detachment and its relationship to three granite plutons I. Introduction: Purpose: While reading through the literature regarding
Software requirements * :
 Title: Product Type: Developer: Target audience: Format: Software requirements * : Using GRACE to evaluate change in Greenland s ice sheet Part I: Download, import and map GRACE data Part II: View and
caused displacement of ocean water resulting in a massive tsunami. II. Purpose
 I. Introduction The Great Sumatra Earthquake event took place on December 26, 2004, and was one of the most notable and devastating natural disasters of the decade. The event consisted of a major initial
Effects of sea level rise on shallow atolls in the South Pacific
 Tuvalu 2100 Effects of sea level rise on shallow atolls in the South Pacific Kristin Vollmann GEO 327GG December 3, 20100 INTRODUCTION Residents of the tiny island nation of Tuvalu, withh a maximumm elevation
Using the Stock Hydrology Tools in ArcGIS
 Using the Stock Hydrology Tools in ArcGIS This lab exercise contains a homework assignment, detailed at the bottom, which is due Wednesday, October 6th. Several hydrology tools are part of the basic ArcGIS
In this exercise we will learn how to use the analysis tools in ArcGIS with vector and raster data to further examine potential building sites.
 GIS Level 2 In the Introduction to GIS workshop we filtered data and visually examined it to determine where to potentially build a new mixed use facility. In order to get a low interest loan, the building
These modules are covered with a brief information and practical in ArcGIS Software and open source software also like QGIS, ILWIS.
 Online GIS Training and training modules covered are: 1. ArcGIS, Analysis, Fundamentals and Implementation 2. ArcGIS Web Data Sharing 3. ArcGIS for Desktop 4. ArcGIS for Server These modules are covered
Data Creation and Editing
 11.520:A Workshop on Geographical Information Systems 1.188: Urban Planning and Social Science Laboratory Data Creation and Editing Based in part on notes by Prof. Joseph Ferreira and Michael Flaxman Lulu
Creating Watersheds from a DEM
 Creating Watersheds from a DEM These instructions enable you to create watersheds of specified area using a good quality Digital Elevation Model (DEM) in ArcGIS 8.1. The modeling is performed in ArcMap
WORKING WITH DMTI DIGITAL ELEVATION MODELS (DEM)
") WORKING WITH DMTI DIGITAL ELEVATION MODELS (DEM) Contents (Ctrl-Click to jump to a specific page) Manipulating the DEM Step 1: Finding the DEM Tiles You Need... 2 Step 2: Importing the DEM Tiles into ArcMap...
WORKING WITH DMTI DIGITAL ELEVATION MODELS (DEM) Contents (Ctrl-Click to jump to a specific page) Manipulating the DEM Step 1: Finding the DEM Tiles You Need... 2 Step 2: Importing the DEM Tiles into ArcMap...
The Geodatabase Working with Spatial Analyst. Calculating Elevation and Slope Values for Forested Roads, Streams, and Stands.
 GIS LAB 7 The Geodatabase Working with Spatial Analyst. Calculating Elevation and Slope Values for Forested Roads, Streams, and Stands. This lab will ask you to work with the Spatial Analyst extension.
Exercise 12 Spatial Analysis on Antarctica
 Exercise 12 Spatial Analysis on Antarctica Due: Tuesday, March 6 Goal: Using ArcMap s Spatial Analyst tools for digital elevation models and rasters. Datasets: Bed elevation Ice thickness Surface elevation
Within this document, the term NHDPlus is used when referring to NHDPlus Version 2.1 (unless otherwise noted).
.") Exercise 7 Watershed Delineation Using ArcGIS Spatial Analyst Last Updated 4/6/2017 Within this document, the term NHDPlus is used when referring to NHDPlus Version 2.1 (unless otherwise noted). There
Exercise 7 Watershed Delineation Using ArcGIS Spatial Analyst Last Updated 4/6/2017 Within this document, the term NHDPlus is used when referring to NHDPlus Version 2.1 (unless otherwise noted). There
Overview key concepts and terms (based on the textbook Chang 2006 and the practical manual)
") Introduction Geo-information Science (GRS-10306) Overview key concepts and terms (based on the textbook 2006 and the practical manual) Introduction Chapter 1 Geographic information system (GIS) Geographically
Introduction Geo-information Science (GRS-10306) Overview key concepts and terms (based on the textbook 2006 and the practical manual) Introduction Chapter 1 Geographic information system (GIS) Geographically
Using ArcGIS for Hydrology and Watershed Analysis:
 Using ArcGIS 10.2.2 for Hydrology and Watershed Analysis: A guide for running hydrologic analysis using elevation and a suite of ArcGIS tools Anna Nakae Feb. 10, 2015 Introduction Hydrology and watershed
Outline. Chapter 1. A history of products. What is ArcGIS? What is GIS? Some GIS applications Introducing the ArcGIS products How does GIS work?
 Outline Chapter 1 Introducing ArcGIS What is GIS? Some GIS applications Introducing the ArcGIS products How does GIS work? Basic data formats The ArcCatalog interface 1-1 1-2 A history of products Arc/Info
Display data in a map-like format so that geographic patterns and interrelationships are visible
 Vilmaliz Rodríguez Guzmán M.S. Student, Department of Geology University of Puerto Rico at Mayagüez Remote Sensing and Geographic Information Systems (GIS) Reference: James B. Campbell. Introduction to
Data Structures & Database Queries in GIS
 Data Structures & Database Queries in GIS Objective In this lab we will show you how to use ArcGIS for analysis of digital elevation models (DEM s), in relationship to Rocky Mountain bighorn sheep (Ovis
Use of Geophysical Software for Interpretation of Ice-Penetrating Radar Data and Mapping of Polar Ice Sheets
 Use of Geophysical Software for Interpretation of Ice-Penetrating Radar Data and Mapping of Polar Ice Sheets Alex O. Martinez University of Kansas 2335 Irving Hill Road Lawrence, KS 66045-7612 http://cresis.ku.edu
Delineation of Watersheds
 Delineation of Watersheds Adirondack Park, New York by Introduction Problem Watershed boundaries are increasingly being used in land and water management, separating the direction of water flow such that
Outcrop suitability analysis of blueschists within the Dry Lakes region of the Condrey Mountain Window, North-central Klamaths, Northern California
 Outcrop suitability analysis of blueschists within the Dry Lakes region of the Condrey Mountain Window, North-central Klamaths, Northern California (1) Introduction: This project proposes to assess the
GIS 2010: Coastal Erosion in Mississippi Delta
 1) Introduction Problem overview To what extent do large storm events play in coastal erosion rates, and what is the rate at which coastal erosion is occurring in sediment starved portions of the Mississippi
Lab 1: Importing Data, Rectification, Datums, Projections, and Coordinate Systems
 Lab 1: Importing Data, Rectification, Datums, Projections, and Coordinate Systems Topics covered in this lab: i. Importing spatial data to TAS ii. Rectification iii. Conversion from latitude/longitude
Handling Raster Data for Hydrologic Applications
 Handling Raster Data for Hydrologic Applications Prepared by Venkatesh Merwade Lyles School of Civil Engineering, Purdue University vmerwade@purdue.edu January 2018 Objective The objective of this exercise
The Looming Threat of Rising Sea Levels to the Florida Keys
 The Looming Threat of Rising Sea Levels to the Florida Keys 1. Introduction Sea levels are rising, and possibly faster than we thought before. In a recent report in 2017 by the National Oceanic and Atmospheric
Lab 1: Importing Data, Rectification, Datums, Projections, and Output (Mapping)
") Lab 1: Importing Data, Rectification, Datums, Projections, and Output (Mapping) Topics covered in this lab: i. Importing spatial data to TAS ii. Rectification iii. Conversion from latitude/longitude to
Lab 1: Importing Data, Rectification, Datums, Projections, and Output (Mapping) Topics covered in this lab: i. Importing spatial data to TAS ii. Rectification iii. Conversion from latitude/longitude to
2. GETTING STARTED WITH GIS
 2. GETTING STARTED WITH GIS What are geographic information systems and what are they used for? ArcGIS: ArcMap, ArcCatalog and ArcToolbox Vector data vs. raster data vs. attribute tables Polygons, polylines,
How to Create Stream Networks using DEM and TauDEM
 How to Create Stream Networks using DEM and TauDEM Take note: These procedures do not describe all steps. Knowledge of ArcGIS, DEMs, and TauDEM is required. TauDEM software ( http://hydrology.neng.usu.edu/taudem/
GIS Semester Project Working With Water Well Data in Irion County, Texas
 GIS Semester Project Working With Water Well Data in Irion County, Texas Grant Hawkins Question for the Project Upon picking a random point in Irion county, Texas, to what depth would I have to drill a
CE 365K Exercise 1: GIS Basemap for Design Project Spring 2014 Hydraulic Engineering Design
 CE 365K Exercise 1: GIS Basemap for Design Project Spring 2014 Hydraulic Engineering Design The purpose of this exercise is for you to construct a basemap in ArcGIS for your design project. You may execute
Introduction. Purpose
 Introduction The Edwards Aquifer is a karst aquifer in Central Texas whose hydrogeological properties are not fully understood. This is due to exaggerated heterogeneity of properties, high anisotropy due
Trail Flow: Analysis of Drainage Patterns Affecting a Mountain Bike Trail
 Andy Belcher BAE 590 Professor Huffman 12.9.11 Location Trail Flow: Analysis of Drainage Patterns Affecting a Mountain Bike Trail The location of the project area rests in the Cary area of Wake County,
Predicting Future CO2 Amounts and Monitoring Seasonal CO2 Fluctuations QUANTIFYING CO2 ANNUAL INCREASE
 http://visibleearth.nasa.gov/view.php?id=5772 3 Predicting Future CO2 Amounts and Monitoring Seasonal CO2 Fluctuations QUANTIFYING CO2 ANNUAL INCREASE Aguilera, Kimberly GEO 3276: GIS & GPS Applications
Analysis of Sulfate and Chloride Concentrations
 Brazoria County, Texas Analysis of Sulfate and Chloride Concentrations By Agueda Matano GIS & GPS Applications in Earth Sciences December 1, 2012 I. Goal Analysis of sulfate and Chloride concentrations
Spatial Effects on Current and Future Climate of Ipomopsis aggregata Populations in Colorado Patterns of Precipitation and Maximum Temperature
 A. Kenney GIS Project Spring 2010 Amanda Kenney GEO 386 Spring 2010 Spatial Effects on Current and Future Climate of Ipomopsis aggregata Populations in Colorado Patterns of Precipitation and Maximum Temperature
Watershed Analysis of the Blue Ridge Mountains in Northwestern Virginia
 Watershed Analysis of the Blue Ridge Mountains in Northwestern Virginia Mason Fredericks December 6, 2018 Purpose The Blue Ridge Mountain range is one of the most popular mountain ranges in the United
A GIS-based Approach to Watershed Analysis in Texas Author: Allison Guettner
 Texas A&M University Zachry Department of Civil Engineering CVEN 658 Civil Engineering Applications of GIS Instructor: Dr. Francisco Olivera A GIS-based Approach to Watershed Analysis in Texas Author:
BSEN 6220 GIS LAB #5
 BSEN 6220 GIS LAB #5 Dustin Till 10/29/2014 INTRODUCTION: ArcGIS is a geographic information system for working with maps and geographic information. It is used for creating and using maps, compiling geographic
Lecture 2. A Review: Geographic Information Systems & ArcGIS Basics
 Lecture 2 A Review: Geographic Information Systems & ArcGIS Basics GIS Overview Types of Maps Symbolization & Classification Map Elements GIS Data Models Coordinate Systems and Projections Scale Geodatabases
Exercise 6: Working with Raster Data in ArcGIS 9.3
 Exercise 6: Working with Raster Data in ArcGIS 9.3 Why Spatial Analyst? Grid query Grid algebra Grid statistics Summary by zone Proximity mapping Reclassification Histograms Surface analysis Slope, aspect,
GIS CONCEPTS ARCGIS METHODS AND. 2 nd Edition, July David M. Theobald, Ph.D. Natural Resource Ecology Laboratory Colorado State University
 GIS CONCEPTS AND ARCGIS METHODS 2 nd Edition, July 2005 David M. Theobald, Ph.D. Natural Resource Ecology Laboratory Colorado State University Copyright Copyright 2005 by David M. Theobald. All rights
Introduction to Geographic Information Systems
 Introduction to Geographic Information Systems Lynn_Carlson@brown.edu 401-863-9917 The Environmental And Remote TecHnologies Lab MacMillan Hall, Room 105 http://www.brown.edu/research/earthlab/ Outline
Watershed Delineation
 Watershed Delineation Jessica L. Watkins, University of Georgia 2 April 2009 Updated by KC Love February 25, 2011 PURPOSE For this project, I delineated watersheds for the Coweeta synoptic sampling area
Exercise 4 Estimating the effects of sea level rise on coastlines by reclassification
 Exercise 4 Estimating the effects of sea level rise on coastlines by reclassification Due: Thursday February 1; at the start of class Goal: Get familiar with symbolizing and making time-series maps of
Lab 4 -Vector data and Attributes
 Lab 4 -Vector data and Attributes ERSC/BIOL 4421/5421 Name In this lab you will learn how to create your own vector data by collecting point data from GPS coordinates and by digitizing lines using an Aerial
Fire Susceptibility Analysis Carson National Forest New Mexico. Can a geographic information system (GIS) be used to analyze the susceptibility of
 be used to analyze the susceptibility of") 1 David Werth Fire Susceptibility Analysis Carson National Forest New Mexico Can a geographic information system (GIS) be used to analyze the susceptibility of Carson National Forest, New Mexico to forest
1 David Werth Fire Susceptibility Analysis Carson National Forest New Mexico Can a geographic information system (GIS) be used to analyze the susceptibility of Carson National Forest, New Mexico to forest
SIE 509 Principles of GIS Exercise 5 An Introduction to Spatial Analysis
 SIE 509 Principles of GIS Exercise 5 An Introduction to Spatial Analysis Due: Oct. 31, 2017 Total Points: 50 Introduction: The Governor of Maine is asking communities to look at regionalization for major
Calhoun County, Texas Under 5 Meter Sea Level Rise
 Kyle Kacal GEO 327G Calhoun County, Texas Under 5 Meter Sea Level Rise PROBLEM AND PURPOSE: Sea level rise is threat to all coastal areas. Although natural sea level rise happens at a very slow rate, hurricanes
Studying Topography, Orographic Rainfall, and Ecosystems (STORE)
") Studying Topography, Orographic Rainfall, and Ecosystems (STORE) Introduction Basic Lesson 3: Using Microsoft Excel to Analyze Weather Data: Topography and Temperature This lesson uses NCDC data to compare
Studying Topography, Orographic Rainfall, and Ecosystems (STORE) Introduction Basic Lesson 3: Using Microsoft Excel to Analyze Weather Data: Topography and Temperature This lesson uses NCDC data to compare
GIS Project: Groundwater analysis for the Rhodes property (Socorro, NM).
.") GIS Project: Groundwater analysis for the Rhodes property (Socorro, NM). Vanessa Garayburu-Caruso CE 547 May 2016 Contents Motivation and background... 3 Objectives... 3 Methods... 5 Data sources... 5
GIS Project: Groundwater analysis for the Rhodes property (Socorro, NM). Vanessa Garayburu-Caruso CE 547 May 2016 Contents Motivation and background... 3 Objectives... 3 Methods... 5 Data sources... 5
Exercise 4. Watershed and Stream Network Delineation
 Exercise 4. Watershed and Stream Network Delineation GIS in Water Resources, Fall 2014 Prepared by David G Tarboton and David R. Maidment Purpose The purpose of this exercise is to illustrate watershed
Volcanic Hazard Assessment of Southern Iceland Helper, GIS 327G
 Raeann Garcia 05/03/2018 Volcanic Hazard Assessment of Southern Iceland Helper, GIS 327G Introduction: Iceland is an island nation far in the northern hemisphere, with a portion of the country included
Acknowledgments xiii Preface xv. GIS Tutorial 1 Introducing GIS and health applications 1. What is GIS? 2
 Acknowledgments xiii Preface xv GIS Tutorial 1 Introducing GIS and health applications 1 What is GIS? 2 Spatial data 2 Digital map infrastructure 4 Unique capabilities of GIS 5 Installing ArcView and the
Hazard Assessment of Lava Flows, Wildfires, and Tsunamis on the Big Island of Hawaii s population. By: Thomas Ditges
 Hazard Assessment of Lava Flows, Wildfires, and Tsunamis on the Big Island of Hawaii s population By: Thomas Ditges The Problem: The Big Island of Hawaii is the largest and most dangerous of the Hawaiian
Global Atmospheric Circulation Patterns Analyzing TRMM data Background Objectives: Overview of Tasks must read Turn in Step 1.
 Global Atmospheric Circulation Patterns Analyzing TRMM data Eugenio Arima arima@hws.edu Hobart and William Smith Colleges Department of Environmental Studies Background: Have you ever wondered why rainforests
Gravity and Magnetic Anomalies Compared to Moho Depth throughout the State of Texas
 Gravity and Magnetic Anomalies Compared to Moho Depth throughout the State of Texas Taylor Borgfeldt Introduction My Master s thesis is to improve and create additional crustal seismic velocity models
Spatial Data Analysis with ArcGIS Desktop: From Basic to Advance
 Spatial Data Analysis with ArcGIS Desktop: From Basic to Advance 1. Course overview Modern environmental, energy as well as resource modeling and planning require huge amount of geographically located
Learning ArcGIS: Introduction to ArcCatalog 10.1
 Learning ArcGIS: Introduction to ArcCatalog 10.1 Estimated Time: 1 Hour Information systems help us to manage what we know by making it easier to organize, access, manipulate, and apply knowledge to the
INTRODUCTION TO GIS. Practicals Guide. Chinhoyi University of Technology
 INTRODUCTION TO GIS Practicals Guide Chinhoyi University of Technology Lab 1: Basic Visualisation You have been requested to make a map of Zimbabwe showing the international boundary and provinces. The
ARCGIS TRAINING AT KU GIS LABS: INTRODUCTION TO GIS: EXPLORING ARCCATALOG AND ARCGIS TOOLS
 PHASE 1_3 rd SESSION ARCGIS TRAINING AT KU GIS LABS: INTRODUCTION TO GIS: EXPLORING ARCCATALOG AND ARCGIS TOOLS 3 rd SESSION REPORT: 25 TH -27 TH JUNE 2014 SCHOOL OF ENVIRONMENTAL STUDIES COMPUTER LAB
Introduction to GIS - 2
 Introduction to GIS - 2 Outline Using GIS Representation of spatial objects in GIS Prof. D. Nagesh Kumar Department of Civil Engineering Indian Institute of Science Bangalore 560 012, India http://www.civil.iisc.ernet.in/~nagesh
Methods for Marsh Futures Area of Interest (AOI) Elevation Zone Delineation
 Elevation Zone Delineation") PARTNERSHIP FOR THE DELAWARE ESTUARY Science Group Methods for Marsh Futures Area of Interest (AOI) Elevation Zone Delineation Date Prepared: 07/30/2015 Prepared By: Joshua Moody Suggested Citation: Moody,
PARTNERSHIP FOR THE DELAWARE ESTUARY Science Group Methods for Marsh Futures Area of Interest (AOI) Elevation Zone Delineation Date Prepared: 07/30/2015 Prepared By: Joshua Moody Suggested Citation: Moody,
Automatic Watershed Delineation using ArcSWAT/Arc GIS
 Automatic Watershed Delineation using ArcSWAT/Arc GIS By: - Endager G. and Yalelet.F 1. Watershed Delineation This tool allows the user to delineate sub watersheds based on an automatic procedure using
Predictive Modelling of Ag, Au, U, and Hg Ore Deposits in West Texas Carl R. Stockmeyer. December 5, GEO 327G
 Predictive Modelling of Ag, Au, U, and Hg Ore Deposits in West Texas Carl R. Stockmeyer December 5, 2013 - GEO 327G Objectives and Motivations The goal of this project is to use ArcGIS to create models
Outline Anatomy of ArcGIS Metadata Data Types Vector Raster Conversion Adding Data Navigation Symbolization Methods Layer Files Editing Help Files
 UPlan Training Lab Exercise: Introduction to ArcGIS Outline Anatomy of ArcGIS Metadata Data Types Vector Raster Conversion Adding Data Navigation Symbolization Methods Layer Files Editing Help Files Anatomy
Learning Unit Student Guide. Title: Estimating Areas of Suitable Grazing Land Using GPS, GIS, and Remote Sensing
 Learning Unit Student Guide Name of Creator: Jeff Sun Institution: Casper College Email: jsun@caspercollege.edu Phone: Office (307) 268-3560 Cell (307) 277-9766 Title: Estimating Areas of Suitable Grazing
GIS Boot Camp for Education June th, 2011 Day 1. Instructor: Sabah Jabbouri Phone: (253) x 4854 Office: TC 136
 x 4854 Office: TC 136") GIS Boot Camp for Education June 27-30 th, 2011 Day 1 Instructor: Sabah Jabbouri Phone: (253) 833-9111 x 4854 Office: TC 136 Email: sjabbouri@greenriver.edu http://www.instruction.greenriver.edu/gis/ Summer
GIS Boot Camp for Education June 27-30 th, 2011 Day 1 Instructor: Sabah Jabbouri Phone: (253) 833-9111 x 4854 Office: TC 136 Email: sjabbouri@greenriver.edu http://www.instruction.greenriver.edu/gis/ Summer
Exercise 4. Watershed and Stream Network Delineation
 Exercise 4. Watershed and Stream Network Delineation GIS in Water Resources, Fall 2015 Prepared by David G Tarboton and David R. Maidment Purpose The purpose of this exercise is to illustrate watershed
Title of Paper: Computational grid generation modeling transport of pathogens in Lake Michigan
 Title of Paper: Computational grid generation modeling transport of pathogens in Lake Michigan Authors Names: Peter N. Shedivy, Hector Bravo PhD Abstract: An estimated 1.2 million people, mostly young
Assessing Point Groundwater Contamination Potential
 Assessing Point Groundwater Contamination Potential Florida caves by Introduction Problem Where might caves in Florida be susceptible to potential point contamination sources such as hazardous material
The University of Texas at Austin. Icebox Model Projections for Sea Level Fall in the Gulf Coast and Caribbean Sea Region
 The University of Texas at Austin Icebox Model Projections for Sea Level Fall in the Gulf Coast and Caribbean Sea Region Lizzadro-McPherson, Daniel J. December 3rd, 2015 Introduction Many climate scientists
GIS IN ECOLOGY: ANALYZING RASTER DATA
 GIS IN ECOLOGY: ANALYZING RASTER DATA Contents Introduction... 2 Tools and Functionality for Raster Data... 2 Data Sources... 3 Tasks... 4 Getting Started... 4 Creating Raster Data... 5 Summary Statistics...
Popular Mechanics, 1954
 Introduction to GIS Popular Mechanics, 1954 1986 $2,599 1 MB of RAM 2017, $750, 128 GB memory, 2 GB of RAM Computing power has increased exponentially over the past 30 years, Allowing the existence of
The usage of GIS to track the movement of black bears in Minnesota due to climate change
 The usage of GIS to track the movement of black bears in Minnesota due to climate change Introduction In northeastern Minnesota, black bears migrate from 1971-1991. I chose to focus on the black bears
MAPPING POTENTIAL LAND DEGRADATION IN BHUTAN
 MAPPING POTENTIAL LAND DEGRADATION IN BHUTAN Moe Myint, Geoinformatics Consultant Rue du Midi-8, CH-1196, Gland, Switzerland moemyint@bluewin.ch Pema Thinley, GIS Analyst Renewable Natural Resources Research
GIS IN ECOLOGY: ANALYZING RASTER DATA
 GIS IN ECOLOGY: ANALYZING RASTER DATA Contents Introduction... 2 Raster Tools and Functionality... 2 Data Sources... 3 Tasks... 4 Getting Started... 4 Creating Raster Data... 5 Statistics... 8 Surface
GIS in Management Planning. Lab 2 Coordinate Systems and Map Projections
 GIS in Management Planning Lab 2 Coordinate Systems and Map Projections Tomislav Sapic GIS Technologist Faculty of Natural Resources Management Lakehead University ArcGIS ArcToolbox Projections Functions
13 Watershed Delineation & Modeling
 Module 4 (L12 - L18): Watershed Modeling Standard modeling approaches and classifications, system concept for watershed modeling, overall description of different hydrologic processes, modeling of rainfall,
Displaying Latitude & Longitude Data (XY Data) in ArcGIS
 in ArcGIS") Displaying Latitude & Longitude Data (XY Data) in ArcGIS Created by Barbara Parmenter and updated on 2/15/2018 If you have a table of data that has longitude and latitude, or XY coordinates, you can view
Displaying Latitude & Longitude Data (XY Data) in ArcGIS Created by Barbara Parmenter and updated on 2/15/2018 If you have a table of data that has longitude and latitude, or XY coordinates, you can view
Sea Level Scare in South Carolina. by William Witmer GEO 327G 5 December 2016
 Sea Level Scare in South Carolina by William Witmer GEO 327G 5 December 2016 Problem Hilton Head Island in South Carolina attracts 2.5 million tourists every year. This popular locale features endangered
An ArcIMS based interactive map for SeaWorld San Antonio
 An ArcIMS based interactive map for SeaWorld San Antonio Morgan K. Dean Advanced GIS, Earth and Environmental Science Department University of Texas at San Antonio One UTSA Circle, San Antonio, TX. 78249,
Geospatial Intelligence
 Geospatial Intelligence Geospatial analysis has existed as long as humans have made and studied maps but its importance to the intelligence community has skyrocketed in the past several years, with Unmanned
SLR Calculator: Sea Level Rise (SLR) Inundation Surface Calculator Add-in for ArcGIS Desktop & 10.4
 Inundation Surface Calculator Add-in for ArcGIS Desktop & 10.4") 1 SLR Calculator: Sea Level Rise (SLR) Inundation Surface Calculator Add-in for ArcGIS Desktop 10.3.1 & 10.4 Florida Sea Level Scenario Sketch Planning Tool Version 1.6, July 2016 University of Florida
1 SLR Calculator: Sea Level Rise (SLR) Inundation Surface Calculator Add-in for ArcGIS Desktop 10.3.1 & 10.4 Florida Sea Level Scenario Sketch Planning Tool Version 1.6, July 2016 University of Florida
Semester Project Final Report. Logan River Flood Plain Analysis Using ArcGIS, HEC-GeoRAS, and HEC-RAS
 Semester Project Final Report Logan River Flood Plain Analysis Using ArcGIS, HEC-GeoRAS, and HEC-RAS Kedric Curtis, Josh Hogge, Jordan Jarrett, Jared Justensen May 6, 2016 CEE 6190 GIS for Civil Engineers
Task 1: Open ArcMap and activate the Spatial Analyst extension.
 Exercise 10 Spatial Analyst The following steps describe the general process that you will follow to complete the exercise. Specific steps will be provided later in the step-by-step instructions component
Presenting Tree Inventory. Tomislav Sapic GIS Technologist Faculty of Natural Resources Management Lakehead University
 Presenting Tree Inventory Tomislav Sapic GIS Technologist Faculty of Natural Resources Management Lakehead University Suggested Options 1. Print out a Google Maps satellite image of the inventoried block
DATA SOURCES AND INPUT IN GIS. By Prof. A. Balasubramanian Centre for Advanced Studies in Earth Science, University of Mysore, Mysore
 DATA SOURCES AND INPUT IN GIS By Prof. A. Balasubramanian Centre for Advanced Studies in Earth Science, University of Mysore, Mysore 1 1. GIS stands for 'Geographic Information System'. It is a computer-based
Lab 1: Landuse and Hydrology, learning ArcGIS II. MANIPULATING DATA
 Lab 1: Landuse and Hydrology, learning ArcGIS II. MANIPULATING DATA As you experienced in the first lab session when you created a hillshade, high resolution data can be unwieldy if you are trying to perform
Supraglacial Lake Formation and What it Means for Greenland s Future
 Supraglacial Lake Formation and What it Means for Greenland s Future GreenPeace Ulyana Nadia Horodyskyj GEOG 5271 questions of interest How, when and where do these lakes form in Greenland? How do these
Using a GIS to Calculate Area of Occupancy. Part 1: Creating a Shapefile Grid
 Using a GIS to Calculate Area of Occupancy Part 1: Creating a Shapefile Grid By Ryan Elliott California Natural Diversity Database, A NatureServe network program December 2008 This document describes the
Effects of Rising Sea Levels on Coral Reef and Mangrove Distributions along the Great Barrier Reef in Australia
 Effects of Rising Sea Levels on Coral Reef and Mangrove Distributions along the Great Barrier Reef in Australia Sarah Barfield Graduate Student Department of Integrative Biology University of Texas, Austin
Sea Level Rise and Manhattan
 University of Texas at Austin Sea Level Rise and Manhattan How Climate Change Will Impact a Climate Denier, Bigly Nicholaides, Kindra 12-5-2016 Introduction: Manhattan is home to 1.6 million people and
TEACHER PAGE Trial Version
 TEACHER PAGE Trial Version * After completion of the lesson, please take a moment to fill out the feedback form on our web site (https://www.cresis.ku.edu/education/k-12/online-data-portal)* Lesson Title:
DEMs Downloading and projecting and using Digital Elevation Models (DEM)
") DEMs Downloading and projecting and using Digital Elevation Models (DEM) Introduction In this exercise, you will work with Digital Elevation Models (DEM). You will download a DEM in geographic coordinates
DEMs Downloading and projecting and using Digital Elevation Models (DEM) Introduction In this exercise, you will work with Digital Elevation Models (DEM). You will download a DEM in geographic coordinates
The Retreat of the Grinnell Glacier: 1990-Present
 Falk, Hepler, Lopez 1 Megan Falk, Alex Hepler, Michelle Lopez GSP 270/ Graham Group Project/ Final Draft December 8, 2014 Word count: 1,148 Introduction The Retreat of the Grinnell Glacier: 1990-Present
Introduction to Geographic Information Systems (GIS): Environmental Science Focus
: Environmental Science Focus") Introduction to Geographic Information Systems (GIS): Environmental Science Focus September 9, 2013 We will begin at 9:10 AM. Login info: Username:!cnrguest Password: gocal_bears Instructor: Domain: CAMPUS
Introduction to Geographic Information Systems (GIS): Environmental Science Focus September 9, 2013 We will begin at 9:10 AM. Login info: Username:!cnrguest Password: gocal_bears Instructor: Domain: CAMPUS
![)UDQFR54XHQWLQ(DQG'tD]'HOJDGR&](/thumbs/95/125846872.jpg ")UDQFR54XHQWLQ(DQG'tD]'HOJDGR&") &21&(37,21$1',03/(0(17$7,212)$1+
&21&(37,21$1',03/(0(17$7,212)$1+ Lecture 5. GIS Data Capture & Editing. Tomislav Sapic GIS Technologist Faculty of Natural Resources Management Lakehead University
 Lecture 5 GIS Data Capture & Editing Tomislav Sapic GIS Technologist Faculty of Natural Resources Management Lakehead University GIS Data Input Surveying/GPS Data capture Facilitate data capture Final
GIS CONCEPTS ARCGIS METHODS AND. 3 rd Edition, July David M. Theobald, Ph.D. Warner College of Natural Resources Colorado State University
 GIS CONCEPTS AND ARCGIS METHODS 3 rd Edition, July 2007 David M. Theobald, Ph.D. Warner College of Natural Resources Colorado State University Copyright Copyright 2007 by David M. Theobald. All rights