DRAFT BRUKER XRF SPECTROSCOPY USER GUIDE: SPECTRAL INTERPRETATION AND SOURCES OF INTERFERENCE
|
|
|
- Suzanna Cain
- 5 years ago
- Views:
Transcription
1 DRAFT BRUKER XRF SPECTROSCOPY USER GUIDE: SPECTRAL INTERPRETATION AND SOURCES OF INTERFERENCE TABLE OF CONTENTS TABLE OF CONTENTS 1 ABSTRACT 3 XRF THEORY 4 INSTRUMENTATION 6 ED XRF EQUIPMENT 6 TRACER 8 SI PIN DIODE DETECTOR PARAMETERS 8 ARTAX 9 SI(LI) SDD DETECTOR PARAMETERS 9 SPECTRAL INTERPRETATION 9 INTERACTIONS IN THE DETECTOR 11 SUM PEAKS 11 ESCAPE PEAKS 12 ESCAPE PEAKS (CONTINUED) ERROR! BOOKMARK NOT DEFINED. HETEROGENEITY 15 HETEROGENEITY (CONTINUED) 16 INTERFERENCE WITH INSTRUMENTATION 17 EQUIPMENT AND INSTRUMENT CONTRIBUTION 17 EQUIPMENT AND INSTRUMENT CONTRIBUTION (CONTINUED) 18 THIN FILM ANALYSIS (BACKGROUND CONTRIBUTION) 19 1
2 THIN FILM ANALYSIS (BACKGROUND CONTRIBUTION) ERROR! BOOKMARK NOT DEFINED. PHENOMENA IN THE SAMPLE 20 RAYLEIGH (ELASTIC) SCATTERING 20 RAYLEIGH (ELASTIC) SCATTERING (CONTINUED) 21 COMPTON (INELASTIC) SCATTERING 22 MATRIX EFFECTS 23 BRAGG SCATTERING 24 BRAGG SCATTERING (CONTINUED) ERROR! BOOKMARK NOT DEFINED. BRAGG SCATTERING (NIST C 1122 EXAMPLES) 26 BRAGG SCATTERING (GEMSTONE EXAMPLES) BRAGG SCATTERING (GEMSTONE EXAMPLES) ERROR! BOOKMARK NOT DEFINED. ERROR! BOOKMARK NOT DEFINED. SIX FIELD APPLICATIONS 28 IDENTIFYING GENUINE ARTIFACTS (CHELSEA BULLFINCH EXAMPLE) 28 IDENTIFYING TRUE ORIGINS (STONEWARE EXAMPLE) 29 MEASURING CHLORINE WITH THE TRACER AND OTHER FIELD APPLICATIONS 30 APPENDICES 41 APPENDIX A 43 APPENDIX B 48 APPENDIX C 49 APPENDIX D 50 APPENDIX E 51 By Dr Bruce Kaiser and Alex Wright November 11,
3 ABSTRACT While performing XRF spectroscopy, three main factors contribute to the analytical spectrum: interactions in the detector, interference with the instrumentation, and phenomena in the sample. This user guide to ED XRF provides a basic outlining of the physics involved in XRF spectroscopy, an overview of the main components of the Bruker TRACeR and ARTAX units, as well as a delineation, explanation, and resolution of the several phenomena included in performing XRF spectroscopy. Each section includes a textual explanation of why it occurs and how it affects a spectrum, as well as example spectra that clearly identify the phenomena. Several field applications and examples are provided, as well as an appendix with additional information 3

4 XRF THEORY General Concept Behind X Ray Fluorescence Spectroscopy Every element has a characteristic electron structure. When inner shell electrons are ejected from an atom, electrons from shells with less binding energy fill the holes and may release x ray radiation equivalent to the difference in energy between the level the electrons came from to that which they went. The x ray radiation released during these transitions is characteristic to the element and has a specific energy (± 2 ev) depending on the transition made within the atom. By bombarding a sample with radiation that exceeds the binding energy of the electrons in the atoms of which the material is composed of and detecting the energy and number of resultant characteristic x rays emitted from each element, it is possible to determine the composition and proportional concentrations of those elements. Two common methods of X ray spectroscopy exist: Wavelength Dispersive XRF (WD XRF) and Energy Dispersive XRF (ED XRF). The main difference between the two methods is how the emitted x rays are measured; WD XRF uses an analyzing crystal to diffract the different x ray wavelengths and detectors are placed at the various angles to measure the number x rays diffracted at each angle. A single detector maybe used to measure all the various energies if one moves the detector to cover all the angles, because each energy comes out of the crystal at a different angle. Energy dispersive x ray fluorescence (ED XRF) uses a detector that collects x rays of all energies and sorts out each x ray energy by the amount of electrons each x ray knocks free in the detector lattice, typically silicon. The number of electrons knocked free depends on the in coming x ray energy and the particular interaction that that x ray has with the material lattice. To accurately determine the x ray energy all the electrons from each event that occurs in the detector must all be collected and converted ultimately to a digital signal. Thus the detector measures one x ray at a time. Bremsstrahlung Radiation In most xrf systems the beam of x rays incident on the sample are produced with a vacuum tube and created by bombarding a target (such as Rh, W, Cu, or Mo) with highly accelerated electrons. Shown in Figure 1, as the electrons penetrate the target atoms, they may have their direction changed as they pass near the nucleus of the target atoms causing a sudden deceleration and loss of kinetic energy. In this loss of kinetic energy the electron may emit an x ray with energy Atom of the target material Outbound electron (decelerated and diverted) related to the amount of energy lost. As a result a broad spectrum of x ray energies, known as a Bremsstrahlung continuum, is Fast inbound electron Figure 1: Diagram of the Bremsstrahlung effect 4 Figure 2: Diagram of possible excitation routes


5 emitted from the x ray tube target. This continuum can be adjusted by tube high voltage settings, beam filtering and secondary targets to allow one to focus on detection of specific elements with in the sample. This capitalizes on the different absorption edges of each element. The accelerated electrons also cause the target to fluoresce. These target characteristic x rays are also incident on the sample, and must be considered during data analysis The Photoelectric Effect and Inner Shell Ionization When an x ray interacts with an atom several different reactions can occur depending on the x ray s energy. Low energy photons, such as a light waves, can excite and eject outer shell electrons from the atom and excite inner shell electrons to higher energy levels. X rays can eject inner shell electrons from the atom, creating a vacancy in the inner shell and put the atom in an unstable condition, providing the that incoming x ray has an energy which exceeds the binding energy of the electron it interacts with. When a vacancy is created, the atom quickly relaxes (less than 10 7 s) by transitioning an electron from a higher shell to the vacancy. During this transition an x ray with the energy equal to the energy difference of the transition maybe released. This x ray is known as a characteristic x ray and is specific to the transition and element in which it occurs. Figure 2 illustrates the different interactions that can occur when x rays interact with the bound electrons of an atom. Once the characteristic x rays are created, they may escape the atom and the matrix material at random angles and a very small fraction enter the detector. If geometry, density and other factors are known, the number of x rays entering the detector can be related to the type and number of atoms present in the sample. Table 1: Possible electron locations in an atom Characteristic Lines The energy of the x ray released by the relaxation of an ionized atom is dependent on the element from which it came, the location of the vacancy, and the electron that fills the vacancy. Electrons exist in quantized energy levels; they are not free to roam anywhere around the nucleus of the atom. A given electron is located in a given electron shell using the quantum numbers n, l, m, s, where n indicates the shell, l indicates the subshell, m l indicates the energy shift within the sub Table 2: Example of possible transition notations for a Barium atom. 5

6 shell, and m s indicates the spin of the electron. Table 1 lists some of the possibilities for electron locations in an atom. There are a couple ways of describing an x ray of a certain transition. It can be written in Line notation, Siegbahn notation, or described by the characteristic energy or wavelength connected that x ray. These notations are shown below in Table 2 with an example of Barium electron transitions. In the Siegbahn notation, the Greek subscript denotes the probability of the transition (intensity), proceeding from the most to least (α, β, γ, etc.). INSTRUMENTATION The TRACeR and ARTAX are both ED XRF units with Silicon based detectors. The TRACeR is a handheld unit commercially offered by Bruker AXS and provides for quick and easy qualitative analysis and chemistries for elements as low as Mg. The Tracer handheld XRF analyzer provides spectral analysis through PXRF analytical software. The instrument s high sensitivity allows the user to identify the elements in a sample matrix, with concentrations as low as ppm. The PXRF software program provides qualitative and quantitative analysis, in addition to the voltage and current control of the X ray tube, which makes possible a wider range of elemental analysis. The ARTAX is the first commercially available, portable micro XRF spectrometer designed to meet the requirements for a spectroscopic analysis of unique and valuable objects on site, i.e. in archeometry and art history. The system performs a simultaneous multi element analysis in the element range from Na(11) to U(92) and reaches a spatial resolution of down to 30 µm. Both instruments allow one to utilize filters and secondary target to adjust the incident x ray beam in both energy distribution and intensity. ED XRF EQUIPMENT The ARTAX and TRACeR systems have several separate components that all serve their own function in the process of recording X ray fluorescence. The main components in terms of functionality are the X ray tube system, collimators, filters, detector and signal processing hardware and software. The ARTAX and the TRACeR Turbo are very similar in functionality. Both units employ energy dispersive technology and a Silicon based detector. Being a handheld unit, the TRACeR is battery operated, more convenient, but has a beam spot size of 3 by 4 mm (much larger than the Artax). The ARTAX is portable; however, it is not generally used in the field like the battery operated handheld TRACeR unit. Both units can use a variety of changeable filters, tube voltage and current settings making them uniquely capable of being configured to maximize their sensitivity to specific elements of interest. Figure 4: Diagram of an end window x ray tube X ray Tube: Electrons are generated and accelerated to high speeds and then bombarded a target usually composed of a pure metal (e.g. W, Mo, Cr, or Rh). Upon reaching the target the electrons either interact and ionize the target, creating characteristic x rays, or are decelerated upon nearing the nuclei, creating a Bremsstrahlung continuum. Figure 4 illustrates the production of the X Ray beam. Figure 5: Overlapping emission spectra of W and Mo target X ray tubes run at different voltages Figure 6: Emission spectra of an Rh target X ray tube run at three different voltages 6

7 Filter: A filter can be placed between the tube and the sample to remove undesirable background radiation below a certain voltage. The level of radiation filtered out is dependent on the filter element composition and its thickness. Table 3 suggests some filter types for certain applicatons and Appendix A provides a list of others for the TRACeR and ARTAX units, as well as other filter information. Note both units allow the user to fabricate any filter or secondary target they think is best for their application. Filter Thickness kv range Elements No filter N/A 4 50 All, Na Ca Cellulose Single sheet 5 10 Si Ti Thin aluminum μm 8 12 S V Thick aluminum μm Ca Cu Thin anode element μm Ca Mo Thick anode element μm Cu Mo Copper μm 50 >Fe Table 3: Available filters that can be used with the ARTAX and TRACeR units Collimator: Collimators are usually circular or a slit and restrict the size or shape of the source beam for exciting small areas. Collimator sizes range from 12 microns to several mm. Figure 7 illustrates the general function of a collimator. Figure 8: Graph comparing the resolution of several different types of detectors Figure 7: X ray passing through a collimator Detector: The detector is used to convert incoming x rays into proportionally sized analog pulses that are then converted by a digital pulse processing system to information that can be read by a computer and displayed on a spectrum. The resolution of the detector depends on the type and quality of the detector (see Figure 8). 7


 Figure 10: Sketch of TRACeR module Vacuum Port ipaq PDA user")
 Voltage Selection Variable, 0 45 kv Current Selection Variable, 0 60 μa Scan Length")
8 TRACER The TRACeR is a handheld ED XRF unit used for instant nondestructive elemental analysis anywhere, anytime. It can be used in a wide range of applications including elemental analysis in material research, archeological digs, museum artifact analysis, conservation and restoration, electric utility industry, engine assembly, airframe assembly, scrap industry, metal producers, foundries, and maintenance assessment, and many other applications. Figure 9: Front view of the TRACeR unit X ray tube (typically Ag, Rh or Re Target) Up to 45kV X rays 170eV Si PIN or 145eV SDD 13μ Be Detector Window IR Safety Sensor Vacuum window User selectable filter/target Up to 200 kcps (SDD) Figure 10: Sketch of TRACeR module Vacuum Port ipaq PDA user interface PDA Pin with Lock SI PIN DIODE/SDD X ray switch DETECTOR PARAMETERS Table 4: Si PIN/SDD characteristics (see Appendix B for explanations) X ray Tube Ag, Rh, or Re Filter Selectable (See Appendix A) Voltage Selection Variable, 0 45 kv Current Selection Variable, 0 60 μa Scan Length Selectable Optimal Pulse Density 15,000 max cps (PIN), 150,000 (max cps (SDD) Environment Air or Vacuum Detector Channels 1023 PIN/2048 SDD Table 5: TRACeR operating parameters 8

 SDD Detector Collimator Changeable Filter More than 100 kcps Figure 11: ARTAX model with labeled parts SI(LI) SDD")
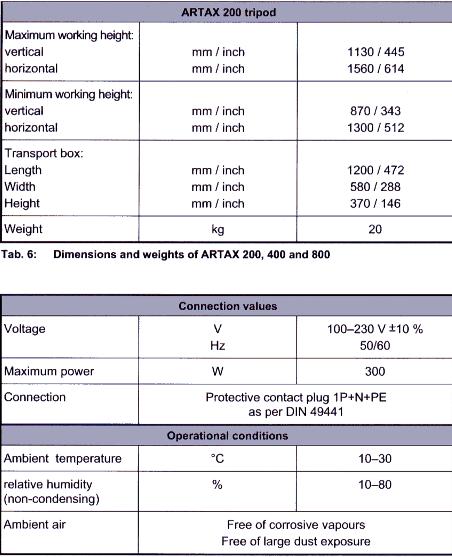
9 ARTAX The ARTAX unit is a semi portable open beam ED XRF machine used for non destructive elemental analysis of surfaces and the spectral mapping of surface areas within minutes. It may be used in many applications such as in archeometry, art history, restoration, forensic sciences, process related quality control, and material sciences. Appendix C includes a complete table of technical parameters for the ARTAX unit. Mo, W, Rh, or Cr, Cu, Ti X ray tube Up to 50 kv Less than 155 ev resolution Si(Li) SDD Detector Collimator Changeable Filter More than 100 kcps Figure 11: ARTAX model with labeled parts SI(LI) SDD DETECTOR PARAMETERS X ray Tube Mo, W, Rh, Cr, or Cu Filter Selectable (See Appendix A) Voltage Selection 0 50 kv Current Selection μa Scan Time Variable Optimal Pulse Density <50,000 cps Environment Air or Helium Flush Detector Channels 4096 Table 7: ARTAX operating parameters Table 6: Table of Si(Li) detector parameters SPECTRAL INTERPRETATION Although the goal of XRF spectroscopy is generally to elementally analyze the sample, several phenomena inherent from x ray physics involved contribute to the spectra. These influences require interpretation in order to correctly understand the data (see Figure 12). Three main influences contribute to the output spectra of a sample: interactions in the detector, x rays contributed by the analysis system, and x ray interactions in the sample. These interactions are delineated below and discussed in detail later in the document. Interactions in the Detector o Sum peaks Interpretation of two or more pulses as one 9
10 o o o Escape peaks Partial Loss of energy due to fluorescence in matrix (Si) detector Compton scattering Partial loss of x ray energy entering detector Heterogeneity Overlapping peaks due to detector resolution x rays contributed by interactions in the analysis system o X ray tube target characteristic lines Rayleigh scattered into the detector o Detector can lines Iron and Nickel trace peaks o Window lines Calcium trace peaks o Collimator and instrument structure lines Aluminum trace peaks o Thin Film Analysis Detection of surface below sample Phenomena in the Sample o Rayleigh scattering (elastic collisions) No loss of x ray energy o Compton scattering (inelastic collisions) Partial loss of x ray energy in the sample o Matrix effects Misrepresentation due to secondary absorption/excitation, density effects o Bragg scattering Constructive interference of X rays in lattice structures The ATRAX and TRACeR units have the option to change the voltage, current, and filter selection, and the use of a secondary target to specify the most efficient parameters for a given sample. By selecting the correct combination of these parameters, the above phenomena can be isolated, identified, and/or corrected yielding valuable information about the sample s character. Figure 12: Abstract view of Physics involved in X ray Spectroscopy 10
11 INTERACTIONS IN THE DETECTOR SUM PEAKS When two or more x rays enter the detector at the exact same time they are read and converted into one pulse with energy (e.g. amplitude) equal to the two pulses combined. Sum peaks appear on a spectrum when this occurs enough times to create a visible peak, as seen in Figure 13 and Figure 14. In theory, sum peaks can appear in any combination of characteristic energies, but they are most commonly found as double K α K α, K α K β and K β K β because the higher rate of ocurrance of these x rays leads to a higher probability of a sum event being recorded. Although sum peaks are small, they may be mistaken as trace elements and cause spectral interference with other characteristic peaks. Cu K α1 peak (8.047 kev) Cu K β1 peak (8.904 kev) Cu K α K β sum peak ( = kev) ARTAX unit 25 kv 500 μa Mo Tube No filter 600 seconds cps Cu K α K α sum peak ( = kev) Mo K α peak (17.48 Figure 13: NIST standard C 1122 (see Appendix D for composition) spectrum on a logarithmic scale showing copper K α and K b peaks and their sum peaks Cu K α1 peak (8.047 kev) Cu K β1 peak (8.904 kev) Cu K α K α sum peak ( = kev) Cu K α K β sum peak ( = kev) ARTAX unit 25 kv 500 μa Mo Tube No filter 600 seconds cps 11 Figure 14: Linear scale of above spectrum
12 ESCAPE PEAKS While most characteristic x rays entering the detector are converted into pulses which are processed by the digital pulse processor, an incoming x ray can excite and cause fluorescence in an atom in the detector. If the x ray entering the detector has an energy greater than the absorption edge of an element in the detector (for the ARTAX and the TRACeR: Silicon), then fluorescence in the detector may occur. Figure 15 shows the typical relationship between incoming x ray energy and resulting Si escape peak counts. The inbound x ray will lose the amount of energy required to fluoresce the detector atom, leaving the x ray with an energy E =E inbound E Characteristic energy of detector, thus causing the detector to read the x ray as having an energy of E. Figure 15: Typical relationship between escape peak count and parent energy peak. Parent peak energies closer to the absorption edge of silicon will create more escape counts Escape peaks are much less intense than the characteristic peaks from which they are derived. Several escape peaks can occur in one spectrum, given that all characteristic energies above the absorption edge of the detector are capable of causing fluorescence. In the case of a Si based detector, escape peaks will appear approximately 1.74 kev lower than a characteristic peak because silicon has a K α absorbtion edge. Error! Reference source not found. shows the escape peak from the Cu K α peak. This figure also shows detector edge effect, which occurs at approximately 60% of the total K α parent peak energy. Escape peaks can be automatically corrected by computer algorithms and software that calculates and outputs a corrected data curve (see Figure 17 and Figure 18). 12
 Cu sum peaks Figure 16: Spectra from a TRACeR model showing both the Si escape peak off of a Cu parent peak and the detector edge")
13 Cu K α parent peak (8.04 kev) Cu K β parent peak (8.90 kev) Si Escape peak ( = 6.26 kev) Detector edge effects (8.04 x.6 =4.82 kev) Cu sum peaks Figure 16: Spectra from a TRACeR model showing both the Si escape peak off of a Cu parent peak and the detector edge effects. 13
14 Figure 18: Linear scale spectrum of a NIST standard C 1122 (see Appendix D) without the corrected data curve shows the appearance of the Cu escape peak. Figure 17: By applying the corrected data curve, the escape peak is removed and the true character of the sample is shown. 14
15 HETEROGENEITY After radiation enters the detector and converts to pulses, discrepancies between peaks due to similar energy levels may occur. Heterogeneity can occur with any combination of lines, including different elements characteristic peaks, sum peaks, satellite peaks, escape peaks, etc. The resolution of the detector determines the amount of overlap between similar peaks. 150 x 1E3 Pulses 100 Zn Fe Cu Pb Fe Cu Zn Pb ARTAX unit 40 kv 998 μa W Tube 315 μm Al filter 600 seconds cps kev - Figure 19: Linear scale spectrum of a bronze ingot showing the overlap of copper and zinc characteristic peaks Zn K α peaks overlap with the Cu K β peak to form a shoulder on the Cu peak instead of two separate peaks 15
16 HETEROGENEITY (CONTINUED) x 1E3 Pulses ARTAX unit 40 kv 998 μa W tube 315 μm Al filter 600 seconds cps Zn Fe Cu Pb Fe Cu Zn Pb kev - Figure 20: Linear scale spectrum of a bronze sample showing the effect of overlapping lines x 1E3 Pulses The Si K α escape peak off of the Cu K α peak (6.31 kev) can be easily confused with the Iron K α peak (6.40 kev). Figures show the affect overlapping peaks can have on apparent sample character Pb Sn Fe Ni Cu Zn Pb 4.0 x 1E3 Pulses kev - Figure 21: Close up linear scale spectrum without the corrected data curve. The Cu escape peak appears to be a Fe peak Pb Sn Fe Ni Cu Zn Pb The downside of using a corrected data curve is the possibility of removing or diminishing true sample lines Figure 22: Close up linear scale spectrum with the - kev -ARTAX software corrected data curve. The Fe peak is drastically lower than with the escape peak on top 16
17 INTERFERENCE WITH INSTRUMENTATION EQUIPMENT AND INSTRUMENT CONTRIBUTION As the incident radiation travels from the source to the sample, it may cause fluorescence in materials in the machine which may be detected and shown on the spectrum. The target element may be detected (see Figure 23) in addition to iron, zinc, copper, and nickel in the tube, collimators, lens, etc (see Figure 24). By adding a filter in between the tube and the sample, much of this unwanted radiation can be removed from the spectrum (see Figure 26). Pulses W L β1 ARTAX unit 40 kv 998 μa W Tube 315 μm Al filter 120 seconds 1489 cps 60 W L α1 W W L β2 W L γ1 40 W L γ kev - Figure 23: Linear scale spectrum of an Al refractory with tungsten peaks from x ray tube Sources of Contribution X ray tube target K and L lines (e.g. Cu, Rh, Mo, W, etc.) Stainless Steel Detector Can Lines (e.g. Fe, Co, Ni, only appear when testing low Z elements) Window lines (e.g. Ca) Collimator and instrument structure (e.g. Al) If using a thin film sample, elements in surface below the sample 17
18 EQUIPMENT AND INSTRUMENT CONTRIBUTION (CONTINUED) Pulses Ca Zr Fe Zr W Pb Ca Fe W Pb Zr ARTAX unit 40 kv 998 μa W tube 315 μm Al filter 600 seconds 620 cps W L α1 W L γ1 200 FE K α and K β Peaks W L γ kev - Figure 24: Linear scale spectrum of a Fe free microscope slide. Both W and Fe peaks appear on the spectrum because of ionization of the instrumentation WD XRF W L β1 W L β2 Figure 25: Linear scale spectrum showing the appearance of peaks of elements found in the can and other instrumentation (Ni, Fe, Cu, Cr). By adding a filter much of the unwanted radiation is removed from the spectrum. (Taken from Bruker AXS presentation Introduction to X ray Spectrometry ) 18

 shows the effect of layering thin film samples and the detection of lower layers.")
19 THIN FILM ANALYSIS (BACKGROUND CONTRIBUTION) X rays with high energy have the ability to partially penetrate through the surface of a sample. This phenomenon is also found in the use of filters, where a thin layer of metal or substance is used to attenuate certain energies from the exciting x ray beam that is incident on the sample of radiation. If the sample being tested is thin enough for the radiation to entirely penetrate through, elements in the surface below the sample may be fluoresced and detected. The figures below (see Figure 26, Figure 27, and Error! Reference source not found.) shows the effect of layering thin film samples and the detection of lower layers. Figure 26: Measured separately, samples 1, 2, and 3 shows 11565, 21077, and counts of Pb, respectively. When the samples are layered in the order the total counts increases to (around 5000 above that of just sample 3), indicating the partial detection of the lower layers of Pb. When the samples are layered the total counts increases to (nearly 2x that of just sample 1), indicating the detection of lower layers is diminished but still affects the spectra Figure 27: Spectra used in figure 26. Note the variation of the intensity shift of the Pb L alpha and Pb L beta depending where the highest concentration of Pb is in the sample. Highest close to the surface shows Pb L alpha about 15% more intense that Pb L beta. Lowest concentration close to the surface shows Pb L beta to be about 3% higher than Pb alpha. 19
20 PHENOMENA IN THE SAMPLE RAYLEIGH (ELASTIC) SCATTERING Incident radiation from the tube that reaches the sample is either absorbed in the photoelectric effect or reflected and scattered. When an x ray reflects off the atoms of the sample without losing any energy it is called Rayleigh (or elastic) scattering. The energy of the outbound x ray will be equal to the energy of the inbound x ray, thus being detected as a source peak with the energy of the inbound x ray. The Rayleigh scatter peaks visible correspond with the characteristic energies of the x ray tube target element. Figure 29 and Figure 30 show the appearance of Rayleigh peaks in a spectrum. Rayleigh scatter peaks are characterized by sharp shapes that are the same as the x ray flourescence peaks because they are produced in the detector by single energy x rays x 1E3 Pulses The W L α peak (8.398 kev), W L β peaks ( kev), and W L γ peaks ( kev) all appear on the spectrum due to Rayleigh scatter Si K α escape peak Fe Co Ni Cu W Cu K α and K β peaks ARTAX unit 40 kv 998 μa W Tube 315 μm Al Filter 600 seconds cps kev - Figure 28: Close up linear scale spectrum of a NIST standard C 1251a (see Appendix D for composition) showing the appearance of the tungsten target Rayleigh scatter in spectra Rh L lines from rhodium target in TRACeR tube appear in spectra due to Rayleigh scattering. TRACeR unit Figure 29: Close up linear scale spectrum showing the appearance of Rh characteristic lines in a spectrum due to Rayleigh scatter 20
.")
21 RAYLEIGH (ELASTIC) SCATTERING (CONTINUED) In addition to Rayleigh scatter peaks at the characteristic lines of the target in the tube, a Bremsstrahlung radiation curve may appear in the background of a spectrum due to Rayleigh and Compton scatter of all incident X rays (Figure 31). ARTAX unit 40 kv 998 μa W Tube 315 μm Al filter 600 seconds 1486 cps Figure 30: Linear scale spectrum of a high purity Al 2 O 3 refractory with a well defined Bremsstrahlung continuum 21
. In these interactions, called Compton scattering, a x ray strikes an atom and loses energy, causing the excitement of an inner shell electron.")


22 COMPTON (INELASTIC) SCATTERING Incident radiation with sufficient energy to ionize an innershell electron in an atom does not always cause fluorescence, but instead causes an excitation without losing all of its energy (see Figure 32). In these interactions, called Compton scattering, a x ray strikes an atom and loses energy, causing the excitement of an inner shell electron. Because no vacancy is created in the atom, no characteristic energy is released; however, the x ray will lose energy and be scattered in all directions (noted by the formula in Figure 32). Compton scatter x rays appear as a broad peak defined by the angle between the incident beam and the detector for the target characteristic x ray lower in energy than Rayleigh scatter peaks because they only lose a small amount of energy in the excitation of an electron. They are generally broad due to the area of the detector and the area of Figure 31: Compton scattering causes a shift in wavelength of the incident x ray the exciting beam, and they occur more often in low Z elements. Compton scattering can be seen in Figure 33. Compton Scatter Rh K α Rayleigh Scatter (20.21 kev) Rh Kβ Rayleigh Scatter (22.72 kev) Figure 32: Linear scale spectrum showing Compton scattering of rhodium parent peaks on a TRACeR model. 22


.")
23 MATRIX EFFECTS Absorption: Any element that can absorb or scatter the incident x rays is capable of reabsorbing characteristic x rays of other elements (see Figure 34). After an atom undergoes the photoelectric effect and emits a characteristic x ray, the x ray may be reabsorbed by another atom in the sample. When this happens, it causes a misrepresentation of the counts of elements detected from the sample by failing to count a x ray for the initial element. The expected number of x ray counts recorded by the detector will be lower than expected because some are absorbed within the sample. Figure 33: Example of secondary absorption. Secondary Excitation: When the characteristic radiation from one atom is reabsorbed by another atom and has sufficient energy to ionize the atom, it will cause fluorescence in the second atom, producing only the characteristic radiation of the second atom (see Figure 35). This can lead to a misrepresentation of elements by enhancing the appearance of elements through secondary excitation. Figure 34: Example of secondary excitation 23
24 BRAGG SCATTERING Many samples are composed of a periodic arrangement of atoms or molecules that create a crystal lattice. When a material exhibits a lattice structure, several different lattice planes can exist oriented in different directions. All planes that are parallel to a given lattice plane are a set distance away from one another, as established by the crystal structure. When two parallel incident x rays strike a pair of parallel lattice planes, the rays are reflected and can interfere with each other. This phenomenon is known as Bragg scattering, or the scattering of incident x rays due to the crystal lattice of a sample. Bragg s law states that two waves interfere constructively when nλ=2dsinø where: n is the reflection order, λ is the wavelength of the incident x ray, d is the distance between the lattice planes, and Ø is the angle of reflection upon the crystal lattice. According to Bragg s law, a given angle has a specific set of wavelengths (or energies) that can cause constructive interference. Samples with uniform crystal structure will exhibit narrow peaks, while a sample with a non uniform crystal lattice will be broader. All the data used in the examples below are taken with the Artax system. The sharper lines in Figure 37 suggest that the sample is of higher quality (more uniform crystal) than that in Figure Degrees 10 Degrees 25 Degrees As the angle is changed, certain peaks due to Bragg scattering appear and disappear. ARTAX unit 40 kv 998 μa W Tube No Filter 60 seconds 3,343 cps Figure 35: Linear scale spectrum of a blue gemstone showing the effect of incident angle on Bragg peaks If the sample has a preferred crystal orientation, only a small angle is required for Bragg scattering (<1 ), so Bragg scattering can be identified and prevented by changing the angle of incidence of the x ray to the sample. In doing so, a peak in one graph will not appear on another because the angle that satisfies Bragg s law has been changed. To ensure that Bragg peaks are not confused with characteristic lines of elements, the angle of incidence between the incident x ray beam and the sample can be altered, thus disconnecting the constructive interference which creates Bragg peaks. 24
25 When the sample does not have a strongly preferred crystalline orientation as in the case of a gemstone, by adding a filter it is possible to eliminate Bragg peaks by removing the specific wavelengths that create constructive interference. However, sometimes Bragg peaks are impossible to remove without interfering with the region of interest. 0 Degrees 10 Degrees 25 Degrees Multiple Bragg peaks ARTAX unit 40 kv 998 μa W tube 315 μm Al filter 60 seconds 1242 cps Figure 36: Linear scale spectrum of a green gemstone at angles 0, 10, and 25, showing the changes in Bragg peaks and their effect on other characteristic peaks. Bragg Scattering can interfere with peaks and cause a misrepresentation of elements in the sample. In this example, the peak is greatly enhanced by Bragg scattering in the green spectrum, whereas the pink spectrum peak is not exaggerated because the angle was changed. 25
26 BRAGG SCATTERING (NIST C 1122 EXAMPLES) Angle 1 Angle 2 Angle 3 ARTAX unit 25 kv 498 μa Mo tube No Filter 600 s cps Figure 37: Linear scale spectrum of a NIST standard C 1122 (see Appendix D) sample with no filter exhibiting the Bragg peaks 26


27 BRAGG PEAKS BRAGG PEAKS ANGLE 1 Angle 2 Angle 3 Figure 38: Bragg peaks appear in different intensities and positions based on the crystal orientation of the sample. Bragg Scattering (Gemstone examples) Angle 1 Angle 2 Angle 3 Angle 4 Bragg Peaks Figure 39: Certain Bragg peaks are amplified at specific angles, while diminished at others. 27
28 Angle 1 Angle 2 Angle 3 Angle 4 Bragg Peaks Figure 40: Bragg peaks may appear on top of other peaks, as seen in the red. Bragg Peaks Angle 1 Angle 2 Angle 3 Angle 4 Bragg Peaks Figure 41: The red spectrum displays no Bragg peaks, while the green and pink have several different peaks 28

29 FIELD APPLICATIONS IDENTIFYING GENUINE ARTIFACTS (CHELSEA BULLFINCH EXAMPLE) With the increased portability and ease of use in the TRACeR and ARTAX units, several applications can be made in several different areas of study. The following are a few examples taken from a presentation by Dr. Bruce Kaiser on ED XRF applications. Figure 42: Overlapping spectra of the two different paints prove that the ceramic Bullfinch was restored from its natural condition. 29
 CONTAINS SIGNIFICANTLY MORE IRON THAN GERMAN STONEWARE (RED SPECTRUM). BY USING THIS KNOWLEDGE, HISTORIANS CAN IDENTIFY TWO VISUALLY IDENTICAL POTS.")
30 IDENTIFYING TRUE ORIGINS (STONEWARE EXAMPLE) BY USING THE TRACER AND XRF SPECTROSCOPY TECHNOLOGY, HISTORIANS CAN EASILY IDENTIFY THE ORIGINS OF OTHERWISE UNKNOWN ARTIFACTS. HERE, ENGLISH STONEWARE (BLUE SPECTRUM) CONTAINS SIGNIFICANTLY MORE IRON THAN GERMAN STONEWARE (RED SPECTRUM). BY USING THIS KNOWLEDGE, HISTORIANS CAN IDENTIFY TWO VISUALLY IDENTICAL POTS. 30 Figure 43: True origins of artifacts can be found using elemental analysis through XRF technology
31 Measuring Chlorine with the Tracer Measurement of Cl is very important as it is often involved in corrosion and degradation of artifacts in marine environments. Or in some cases is a key constituent of pigments or other coatings, or an issue in paper conservation. The following slides first depict how to make up thin film standards to determine the Cl surface content in micro grams per square centimeter. And then how to set the Bruker handheld xrf instrument up to measure levels as low as 10 micro grams per square and shows 2 applications. It should be noted the Cl analysis is very much a SURFACE ANALYSIS when using xrf, as the Cl atom emits only a 2.7 kev x ray. This low an energy x ray is not able to escape the sample unless the atom is very near the surface. 31
32 Creation of very very thin film Chlorine Standards 1.83 gms of Zirconium dichloride oxide (ZrOCL2.8H2O) was added to 100 ml of distilled water. Then various amounts were pipetted on to light weight paper circles 8.2 cm in diameter The paper was saturated with the solution in each case to assure that the solution distributed uniformly over the entire surface Each paper was then let dry on a plastic sheet for 1 hour The resulting microgram/cm values for Zr and Cl Zr-ug/sq-cm Cl-ug/sq-cm
33 Cl senstivity (ugm/square cm) # of x-rays C l A r Pure iron 0.0 Cl 0.99 Cl 4.93 Cl 9.87 Cl kev Each standard was analyzed for 3 minutes at 2 different voltage and current settings. A Titanium foil was used in both cases to eliminate the Rh L lines and generate Ti x rays to excite Cl efficiently. The thin paper standards were backed by pure Fe to mimic Cl corrosion on Fe. The above is a plot of the measurements that were taken at 8 kv and 35 micro amps. The peak at 2.6 kev is the Cl K x ray. The peak at 2.95 kev is a constant amplitude and is a result of Ar K x ray which is in the air in the paper. It is clear the system is sensitive to Cl down to levels as low as 1 microgram/square cm 33
 Sampling grid 0.")

34 The operating parameters are: Bruker Artax Xrf Scan of Hunley Rivet Spot size mm2 (micro focus tube) Sampling grid mm2 15 kv tube x ray tube voltage Mo tube target 300 micro amps x ray tube filament current 60 second analysis time per point with Helium flush Beam arm was pointed down but can be oriented in any direction for any sized object. System tripod is on wheels and can be moved quickly. Analytical software runs easily on any Windows XP system 34

35 Micrograms/cm2 of Chlorine Cl Distribution on Rivet Side at Machined Boundary mm 0-2 un Machined mm Start scan Machined area area 35

36 Fe Si escape peak Scan 56 showing typical instrument response 36


37 Sourcing Obsidian Bruker TRACeR Operating Parameters ppm sensitivity to key elements Key technique to determine human movement and activity 40 kv and 10 micro amps.006 Cu,.001 Ti,.012 Al filters 180 sec data acquisition Bruker TRACeR xrf systems found to be very accurate for this application The following data is an example of Tracer analysis done by Jeff Speakman of the Smithsonian 37

38 38
39 Fe alca Chivay CRG 0002 Ixtepeque MLZ 1019 Mono Glass MTN Otumba Pico de Orizaba Quispisisa Sierra de Pachuca Ucareo UNL-050_1 XMC 020 Yellowstone Zr F e C u Z n Rb Sr Y Nb Zr 39
40 alca Chivay CRG 0002 Zr 1000 Ixtepeque MLZ 1019 Zr 900 Mono Glass MTN Otumba Rb Pico de Orizaba Quispisisa Sierra de Pachuca Ucareo Nb 600 UNL-050_1 500 XMC 020 Yellowstone Y 400 Sr C u
41 Measurement of Toning Agents on Photographs Use.006 Cu,.001 Ti,.012 Al filter Analyze at photograph 40kV 6 micro amps( what is available) No vacuum 5 to 10 min in White area where there in no toner Areas tone varies grey to black Take the difference (toned white) see below The difference will give you a very good clean spectrum of the toning agent. And the grey to black variation will give you an estimate of the amount of agent. The reason this works so well are Michele The toning materials are very thin and have very little effect on the spectrum from the paper The white area is just the paper and mounting materials The filter used removes most of the backscattered x rays
42 Ba L michele dark 1970 michele white1970 Difference Sr K Note the red difference spectrum clearly shows that the image forming agent is only Ag Ag K Pd K 500 Ag L Fe K Cu K Sr K X ray Energy (kev) Rh K Elastic backscatte r Rh K inelastic backscatter Pd K Ag K Ba k 42
43 APPENDICES APPENDIX A FILTERS AVAILABLE FOR THE ARTAX AND TRACER UNITS (NOTE USER CAN MAKE UP ANY FILTER OR SECONDARY TARGET HE CHOSES DEPENDING ON HIS PARTICULAR NEED AND APPLICATION) Some of the Filters available for the ARTAX unit from Bruker o 315 μm Al o 25 μm Ni o 12.5 μm Ni o 12.5 μm Mo o 100 μm Al o 200 μm Al Some of the Filters available for the TRACeR unit from Bruker o Blue filter (1 mil Cu) o Yellow filter (12 mil Al + 1 mil Ti) o Red filter (12 mil Al + 1 mil Ti + 1 mil Cu) EFFECT OF A FILTER ON AN X RAY TUBE SPECTRUM Figure 44: Scattered excitation spectrum provided by a silver target x ray tube operated at 15 kv. The plots show the effect of two thicknesses of an al primary beam filter: (1) unfiltered; (2) thin al filter; (3) thick al filter. 43

44 EXAMPLE OF AN ATTENUATION GRAPH FOR A FILTER COMPOSED OF VARIOUS THICKNESSES OF FE Figure 45: To attenuate a higher percentage of radiation, as well as a higher energy radiation, the filter thickness must increase. 44
45 Figure 46: This graph is made to determine the filter thickness required for optimal results in testing a copper sample. TYPICAL FILTER, VOLTAGE AND CURRENT SELECTION FOR OPTIMUM XRF ELEMENTAL GROUP ANALYSIS USING THE TRACER Screening for all Elements (Lab Rat mode): 1. No filter kv 3. 3 to 5 micro amps (for non metallic samples) to 1.4 micro amps (for metallic samples) 5. Utilize the vacuum. These settings allow all the x rays from 1 kev to 40 kev to reach the sample thus exciting all the elements for Mg to Pu. To optimize for particular elemental groups one wants to use filters and settings that position the X ray energy impacting the sample just above the absorption edges of the element(s) of interest. Examples of how to go about this is given below. Note as well that the depth of analysis is also very much a function of both the x ray energy used to probe the material and the element that is being excited, both are exponential functions dependent on the matrix of elements that the material is composed. 45

46 Measurement of Obsidian for higher Z elements (Rb, Sr, Y, Zr, and Nb): Cu,.001 Ti,.012 Al Filter kv 3. 4 to 8 micro amps 4. No vacuum These settings allow all the x rays from 17 kev to 40 kev to reach the sample thus efficiently exciting the elements from Fe to Mo. These are some of the key elements to identifying the origin of the obsidian and many other natural occurring materials used by early man. There is little or no sensitivity to elements below Fe with these settings. Measurement of Mg, Al, Si and P to Cu(and any L and M lines for the elements that fall between 1.2 and 8 kev) 1. No filter kv micro amps 4. Vacuum These settings allow all the x rays from the tube up to 15 kev. In particular this allows the Rh L(2.5 to 3 kev) lines from the tube to reach the sample. These are particularly effective at exciting the elements with their absorption edge below 2.3 kev. Note this set up is not good for Cl and S detection, as the scattered Rh L lines interfere with the x rays coming from these elements. 46

47 Measurement of Mg, Al, Si, P, Cl, S, K, Ca, V, Cr, and Fe (and any L and M lines for the elements that fall between 1.2 and 6.5keV) 1. Ti filter to 20 kv to 20 micro amps 4. Vacuum These settings allow x rays from 3 to 12 kev to reach the sample. In particular this does not allow the Rh L lines from the tube to reach the sample. These Rh L x rays would interfere with Cl and S analysis. For example, this is a very good set up for measuring Cl on the surface of Fe. Measurement of metals (Ti to Ag K lines and the W to Bi Lines): Ti,.012 Al Filter (yellow) kv to 2.6 micro amps 4. No vacuum These settings allow all the x rays from 12 kev to 40 kev to reach the sample thus efficiently exciting the elements noted above. These are the settings used to calibrate the system for all modern alloys of those elements of those listed in the title of this section. There is little or no sensitivity to elements below Ca with these settings. 47


48 Measurement of Poisons (higher Z elements Hg, Pb, Br, As): Cu,.001 Ti,.012 Al Filter kv 3. 4 to 8 micro amps 4. No vacuum These settings allow all the x rays from 14 kev to 40 kev to reach the sample thus efficiently exciting the elements Hg, Pb, Br, As. These are some of the key elements that were used to preserve organic based artifacts. There is little or no sensitivity to elements below Ca with these settings. 48
49 A PPENDIX B Figure 47: Explanation of Si PIN characteristics 49


50 APPENDIX C 50
51 APPENDIX D Beryllium Copper C1122 Phosphorized Cu C1251a Elem % Elem % Sb Sb.0014 Sn.01 Sn.0016 Ag.005 Ag.0080 Bi Bi Pb.003 Pb Se Se.0011 Zn.01 Zn.0024 Cu Cu Ni.01 Ni Co.22 Co Fe.16 Fe.0285 Mn.004 Mn Cr.002 Cr.0003 Al.17 Al <.002 P.004 P.0420 Si.17 Si <.005 Mg Mg <.002 S S.0035 Be 1.75 Cd <.0003 As As.0016 Te Te.0016 Au Au Table 8: Elemental composition of NIST standards C 1122 and C 1251a 51


52 APPENDIX E Figure 48: Periodic table including the K and L series characteristic energies of all of the elements 52
53 53
Overview of X-Ray Fluorescence Analysis
 Overview of X-Ray Fluorescence Analysis AMPTEK, INC., Bedford, MA 01730 Ph: +1 781 275 2242 Fax: +1 781 275 3470 sales@amptek.com 1 What is X-Ray Fluorescence (XRF)? A physical process: Emission of characteristic
MT Electron microscopy Scanning electron microscopy and electron probe microanalysis
 MT-0.6026 Electron microscopy Scanning electron microscopy and electron probe microanalysis Eero Haimi Research Manager Outline 1. Introduction Basics of scanning electron microscopy (SEM) and electron
LAB REPORT ON XRF OF POTTERY SAMPLES By BIJOY KRISHNA HALDER Mohammad Arif Ishtiaque Shuvo Jie Hong
 LAB REPORT ON XRF OF POTTERY SAMPLES By BIJOY KRISHNA HALDER Mohammad Arif Ishtiaque Shuvo Jie Hong Introduction: X-ray fluorescence (XRF) spectrometer is an x-ray instrument used for routine, relatively
X-Ray Emission and Absorption
 X-Ray Emission and Absorption Author: Mike Nill Alex Bryant February 6, 20 Abstract X-rays were produced by two bench-top diffractometers using a copper target. Various nickel filters were placed in front
EDS User School. Principles of Electron Beam Microanalysis
 EDS User School Principles of Electron Beam Microanalysis Outline 1.) Beam-specimen interactions 2.) EDS spectra: Origin of Bremsstrahlung and characteristic peaks 3.) Moseley s law 4.) Characteristic
X-RAY SPECTRA. Theory:
 12 Oct 18 X-ray.1 X-RAY SPECTRA In this experiment, a number of measurements involving x-rays will be made. The spectrum of x-rays emitted from a molybdenum target will be measured, and the experimental
X-Ray Fluorescence and Natural History
 X-Ray Fluorescence and Natural History How XRF Helps XRF can be used both quantitatively (homogenous samples) and quantitatively (heterogenous samples).! Trace elements in a fossil can help identify source,
Atomic Physics. Chapter 6 X ray. Jinniu Hu 24/12/ /20/13
 Atomic Physics Chapter 6 X ray 11/20/13 24/12/2018 Jinniu Hu 1!1 6.1 The discovery of X ray X-rays were discovered in 1895 by the German physicist Wilhelm Roentgen. He found that a beam of high-speed electrons
X-ray Absorption Spectroscopy
 X-ray Absorption Spectroscopy Nikki Truss November 26, 2012 Abstract In these experiments, some aspects of x-ray absorption spectroscopy were investigated. The x-ray spectrum of molybdenum was recorded
X-RAY SCATTERING AND MOSELEY S LAW. OBJECTIVE: To investigate Moseley s law using X-ray absorption and to observe X- ray scattering.
 X-RAY SCATTERING AND MOSELEY S LAW OBJECTIVE: To investigate Moseley s law using X-ray absorption and to observe X- ray scattering. READING: Krane, Section 8.5. BACKGROUND: In 1913, Henry Moseley measured
X-RAY PRODUCTION. Prepared by:- EN KAMARUL AMIN BIN ABDULLAH
 X-RAY PRODUCTION Prepared by:- EN KAMARUL AMIN BIN ABDULLAH OBJECTIVES Discuss the process of x-ray being produced (conditions) Explain the principles of energy conversion in x-ray production (how energy
Chemistry 311: Instrumentation Analysis Topic 2: Atomic Spectroscopy. Chemistry 311: Instrumentation Analysis Topic 2: Atomic Spectroscopy
 Topic 2b: X-ray Fluorescence Spectrometry Text: Chapter 12 Rouessac (1 week) 4.0 X-ray Fluorescence Download, read and understand EPA method 6010C ICP-OES Winter 2009 Page 1 Atomic X-ray Spectrometry Fundamental
XRF books: Analytical Chemistry, Kellner/Mermet/Otto/etc. 3 rd year XRF Spectroscopy Dr. Alan Ryder (R222, Physical Chemistry) 2 lectures:
 2 lectures:") 1 3 rd year XRF Spectroscopy Dr. Alan Ryder (R222, Physical Chemistry) 2 lectures: XRF spectroscopy 1 exam question. Notes on: www.nuigalway.ie/nanoscale/3rdspectroscopy.html XRF books: Analytical Chemistry,
1 3 rd year XRF Spectroscopy Dr. Alan Ryder (R222, Physical Chemistry) 2 lectures: XRF spectroscopy 1 exam question. Notes on: www.nuigalway.ie/nanoscale/3rdspectroscopy.html XRF books: Analytical Chemistry,
Basic physics Questions
 Chapter1 Basic physics Questions S. Ilyas 1. Which of the following statements regarding protons are correct? a. They have a negative charge b. They are equal to the number of electrons in a non-ionized
X Rays & Crystals. Characterizing Mineral Chemistry & Structure. J.D. Price
 X Rays & Crystals Characterizing Mineral Chemistry & Structure J.D. Price Light - electromagnetic spectrum Wave behavior vs. particle behavior If atoms are on the 10-10 m scale, we need to use sufficiently
Introduction to X-ray Photoelectron Spectroscopy (XPS) XPS which makes use of the photoelectric effect, was developed in the mid-1960
 XPS which makes use of the photoelectric effect, was developed in the mid-1960") Introduction to X-ray Photoelectron Spectroscopy (XPS) X-ray Photoelectron Spectroscopy (XPS), also known as Electron Spectroscopy for Chemical Analysis (ESCA) is a widely used technique to investigate
Introduction to X-ray Photoelectron Spectroscopy (XPS) X-ray Photoelectron Spectroscopy (XPS), also known as Electron Spectroscopy for Chemical Analysis (ESCA) is a widely used technique to investigate
MS482 Materials Characterization ( 재료분석 ) Lecture Note 4: XRF
 Lecture Note 4: XRF") 2016 Fall Semester MS482 Materials Characterization ( 재료분석 ) Lecture Note 4: XRF Byungha Shin Dept. of MSE, KAIST 1 Course Information Syllabus 1. Overview of various characterization techniques (1 lecture)
2016 Fall Semester MS482 Materials Characterization ( 재료분석 ) Lecture Note 4: XRF Byungha Shin Dept. of MSE, KAIST 1 Course Information Syllabus 1. Overview of various characterization techniques (1 lecture)
Generation of X-Rays in the SEM specimen
 Generation of X-Rays in the SEM specimen The electron beam generates X-ray photons in the beam-specimen interaction volume beneath the specimen surface. Some X-ray photons emerging from the specimen have
An Introduction to Diffraction and Scattering. School of Chemistry The University of Sydney
 An Introduction to Diffraction and Scattering Brendan J. Kennedy School of Chemistry The University of Sydney 1) Strong forces 2) Weak forces Types of Forces 3) Electromagnetic forces 4) Gravity Types
X-ray Spectroscopy. Danny Bennett and Maeve Madigan. October 12, 2015
 X-ray Spectroscopy Danny Bennett and Maeve Madigan October 12, 2015 Abstract Various X-ray spectra were obtained, and their properties were investigated. The characteristic peaks were identified for a
FXA UNIT G485 Module X-Rays. Candidates should be able to : I = I 0 e -μx
 1 Candidates should be able to : HISTORY Describe the nature of X-rays. Describe in simple terms how X-rays are produced. X-rays were discovered by Wilhelm Röntgen in 1865, when he found that a fluorescent
MT Electron microscopy Scanning electron microscopy and electron probe microanalysis
 MT-0.6026 Electron microscopy Scanning electron microscopy and electron probe microanalysis Eero Haimi Research Manager Outline 1. Introduction Basics of scanning electron microscopy (SEM) and electron
Electron probe microanalysis - Electron microprobe analysis EPMA (EMPA) What s EPMA all about? What can you learn?
 What s EPMA all about? What can you learn?") Electron probe microanalysis - Electron microprobe analysis EPMA (EMPA) What s EPMA all about? What can you learn? EPMA - what is it? Precise and accurate quantitative chemical analyses of micron-size
Electron probe microanalysis - Electron microprobe analysis EPMA (EMPA) What s EPMA all about? What can you learn? EPMA - what is it? Precise and accurate quantitative chemical analyses of micron-size
X-ray spectroscopy: Experimental studies of Moseley s law (K-line x-ray fluorescence) and x-ray material s composition determination
 and x-ray material s composition determination") Uppsala University Department of Physics and Astronomy Laboratory exercise X-ray spectroscopy: Experimental studies of Moseley s law (K-line x-ray fluorescence) and x-ray material s composition determination
Uppsala University Department of Physics and Astronomy Laboratory exercise X-ray spectroscopy: Experimental studies of Moseley s law (K-line x-ray fluorescence) and x-ray material s composition determination
LAB 01 X-RAY EMISSION & ABSORPTION
 LAB 0 X-RAY EMISSION & ABSORPTION REPORT BY: TEAM MEMBER NAME: Ashley Tsai LAB SECTION No. 05 GROUP 2 EXPERIMENT DATE: Feb., 204 SUBMISSION DATE: Feb. 8, 204 Page of 3 ABSTRACT The goal of this experiment
Chapter Six: X-Rays. 6.1 Discovery of X-rays
 Chapter Six: X-Rays 6.1 Discovery of X-rays In late 1895, a German physicist, W. C. Roentgen was working with a cathode ray tube in his laboratory. He was working with tubes similar to our fluorescent
Shell Atomic Model and Energy Levels
 Shell Atomic Model and Energy Levels (higher energy, deeper excitation) - Radio waves: Not absorbed and pass through tissue un-attenuated - Microwaves : Energies of Photos enough to cause molecular rotation
CHEM*3440. X-Ray Energies. Bremsstrahlung Radiation. X-ray Line Spectra. Chemical Instrumentation. X-Ray Spectroscopy. Topic 13
 X-Ray Energies very short wavelength radiation 0.1Å to 10 nm (100 Å) CHEM*3440 Chemical Instrumentation Topic 13 X-Ray Spectroscopy Visible - Ultraviolet (UV) - Vacuum UV (VUV) - Extreme UV (XUV) - Soft
hν' Φ e - Gamma spectroscopy - Prelab questions 1. What characteristics distinguish x-rays from gamma rays? Is either more intrinsically dangerous?
 Gamma spectroscopy - Prelab questions 1. What characteristics distinguish x-rays from gamma rays? Is either more intrinsically dangerous? 2. Briefly discuss dead time in a detector. What factors are important
CASSY Lab. Manual ( )
") CASSY Lab Manual (524 202) Moseley's law (K-line x-ray fluorescence) CASSY Lab 271 can also be carried out with Pocket-CASSY Load example Safety notes The X-ray apparatus fulfils all regulations on the
CASSY Lab Manual (524 202) Moseley's law (K-line x-ray fluorescence) CASSY Lab 271 can also be carried out with Pocket-CASSY Load example Safety notes The X-ray apparatus fulfils all regulations on the
Chemical Analysis in TEM: XEDS, EELS and EFTEM. HRTEM PhD course Lecture 5
 Chemical Analysis in TEM: XEDS, EELS and EFTEM HRTEM PhD course Lecture 5 1 Part IV Subject Chapter Prio x-ray spectrometry 32 1 Spectra and mapping 33 2 Qualitative XEDS 34 1 Quantitative XEDS 35.1-35.4
Photoemission Spectroscopy
 FY13 Experimental Physics - Auger Electron Spectroscopy Photoemission Spectroscopy Supervisor: Per Morgen SDU, Institute of Physics Campusvej 55 DK - 5250 Odense S Ulrik Robenhagen,
SECTION A Quantum Physics and Atom Models
 AP Physics Multiple Choice Practice Modern Physics SECTION A Quantum Physics and Atom Models 1. Light of a single frequency falls on a photoelectric material but no electrons are emitted. Electrons may
Advanced Lab Course. X-Ray Photoelectron Spectroscopy 1 INTRODUCTION 1 2 BASICS 1 3 EXPERIMENT Qualitative analysis Chemical Shifts 7
 Advanced Lab Course X-Ray Photoelectron Spectroscopy M210 As of: 2015-04-01 Aim: Chemical analysis of surfaces. Content 1 INTRODUCTION 1 2 BASICS 1 3 EXPERIMENT 3 3.1 Qualitative analysis 6 3.2 Chemical
THE NATURE OF THE ATOM. alpha particle source
 chapter THE NATURE OF THE ATOM www.tutor-homework.com (for tutoring, homework help, or help with online classes) Section 30.1 Rutherford Scattering and the Nuclear Atom 1. Which model of atomic structure
Appearance Potential Spectroscopy
 Appearance Potential Spectroscopy Submitted by Sajanlal P. R CY06D009 Sreeprasad T. S CY06D008 Dept. of Chemistry IIT MADRAS February 2006 1 Contents Page number 1. Introduction 3 2. Theory of APS 3 3.
Absorption of X-rays
 Absorption of X-rays TEP Related topics Bremsstrahlung, characteristic X-radiation, Bragg scattering, law of absorption, mass absorption coefficient, absorption edges, half-value thickness, photoelectric
Atomic Emission Spectra. and. Flame Tests. Burlingame High School Chemistry
 Atomic Structure Atomic Emission Spectra and Flame Tests Flame Tests Sodium potassium lithium When electrons are excited they bump up to a higher energy level. As they bounce back down they release energy
Chapter 10: Modern Atomic Theory and the Periodic Table. How does atomic structure relate to the periodic table? 10.1 Electromagnetic Radiation
 Chapter 10: Modern Atomic Theory and the Periodic Table How does atomic structure relate to the periodic table? 10.1 Electromagnetic Radiation Electromagnetic (EM) radiation is a form of energy that exhibits
X-ray Spectroscopy. c David-Alexander Robinson & Pádraig Ó Conbhuí. 14th March 2011
 X-ray Spectroscopy David-Alexander Robinson; Pádraig Ó Conbhuí; 08332461 14th March 2011 Contents 1 Abstract 2 2 Introduction & Theory 2 2.1 The X-ray Spectrum............................ 2 2.2 X-Ray Absorption
X-ray Interaction with Matter
 X-ray Interaction with Matter 10-526-197 Rhodes Module 2 Interaction with Matter kv & mas Peak kilovoltage (kvp) controls Quality, or penetrating power, Limited effects on quantity or number of photons
Analysis of γ spectrum
 IFM The Department of Physics, Chemistry and Biology LAB 26 Analysis of γ spectrum NAME PERSONAL NUMBER DATE APPROVED I. OBJECTIVES - To understand features of gamma spectrum and recall basic knowledge
Understanding X-rays: The electromagnetic spectrum
 Understanding X-rays: The electromagnetic spectrum 1 ULa 13.61 kev 0.09 nm BeKa 0.11 kev 11.27 nm E = hn = h c l where, E : energy, h : Planck's constant, n : frequency c : speed of light in vacuum, l
RADIOACTIVE SAMPLE EFFECTS ON EDXRF SPECTRA
 90 RADIOACTIVE SAMPLE EFFECTS ON EDXRF SPECTRA Christopher G. Worley Los Alamos National Laboratory, MS G740, Los Alamos, NM 87545 ABSTRACT Energy dispersive X-ray fluorescence (EDXRF) is a rapid, straightforward
S8 TIGER Series 2 for ASTM D 6443
 Lab Report XRF 139 S8 TIGER Series 2 for ASTM D 6443 Standard Test Method for Determination of Ca, Cl, Cu, Mg, P, S and Zn in Unused Lubricating Oils and Additives Introduction Lubricating oils are generally
1 of 5 14/10/ :21
 X-ray absorption s, characteristic X-ray lines... 4.2.1 Home About Table of Contents Advanced Search Copyright Feedback Privacy You are here: Chapter: 4 Atomic and nuclear physics Section: 4.2 Absorption
B. X : in phase; Y: out of phase C. X : out of phase; Y: in phase D. X : out of phase; Y: out of phase
 2015 April 24 Exam 3 Physics 106 Circle the letter of the single best answer. Each question is worth 1 point Physical Constants: proton charge = e = 1.60 10 19 C proton mass = m p = 1.67 10 27 kg electron
X-Ray Photoelectron Spectroscopy (XPS) Auger Electron Spectroscopy (AES)
 Auger Electron Spectroscopy (AES)") X-Ray Photoelectron Spectroscopy (XPS) Auger Electron Spectroscopy (AES) XPS X-ray photoelectron spectroscopy (XPS) is one of the most used techniques to chemically characterize the surface. Also known
X-Ray Photoelectron Spectroscopy (XPS) Auger Electron Spectroscopy (AES) XPS X-ray photoelectron spectroscopy (XPS) is one of the most used techniques to chemically characterize the surface. Also known
Electron Microprobe Analysis 1 Nilanjan Chatterjee, Ph.D. Principal Research Scientist
 12.141 Electron Microprobe Analysis 1 Nilanjan Chatterjee, Ph.D. Principal Research Scientist Massachusetts Institute of Technology Electron Microprobe Facility Department of Earth, Atmospheric and Planetary
Electron Microprobe Analysis 1 Nilanjan Chatterjee, Ph.D. Principal Research Scientist
 12.141 Electron Microprobe Analysis 1 Nilanjan Chatterjee, Ph.D. Principal Research Scientist Massachusetts Institute of Technology Electron Microprobe Facility Department of Earth, Atmospheric and Planetary
X-Ray Photoelectron Spectroscopy (XPS)-2
-2") X-Ray Photoelectron Spectroscopy (XPS)-2 Louis Scudiero http://www.wsu.edu/~scudiero; 5-2669 Fulmer 261A Electron Spectroscopy for Chemical Analysis (ESCA) The 3 step model: 1.Optical excitation 2.Transport
X-Ray Photoelectron Spectroscopy (XPS)-2 Louis Scudiero http://www.wsu.edu/~scudiero; 5-2669 Fulmer 261A Electron Spectroscopy for Chemical Analysis (ESCA) The 3 step model: 1.Optical excitation 2.Transport
print first name print last name print student id grade
 print first name print last name print student id grade Experiment 2 X-ray fluorescence X-ray fluorescence (XRF) and X-ray diffraction (XRD) may be used to determine the constituent elements and the crystalline
CALCULATION OF THE DETECTOR-CONTRIBUTION TO ZIRCONIUM PEAKS IN EDXRF SPECTRA OBTAINED WITH A SI-DRIFT DETECTOR
 CALCULATION OF THE DETECTOR-CONTRIBUTION TO ZIRCONIUM PEAKS IN EDXRF SPECTRA OBTAINED WITH A SI-DRIFT DETECTOR A. C. Neiva 1, J. N. Dron 1, L. B. Lopes 1 1 Escola Politécnica da Universidade de São Paulo
Understanding X-rays: The electromagnetic spectrum
 Understanding X-rays: The electromagnetic spectrum 1 ULa 13.61 kev 0.09 nm BeKa 0.11 kev 11.27 nm E = hn = h c l where, E : energy, h : Planck's constant, n : frequency c : speed of light in vacuum, l
BENEFITS OF IMPROVED RESOLUTION FOR EDXRF
 135 Abstract BENEFITS OF IMPROVED RESOLUTION FOR EDXRF R. Redus 1, T. Pantazis 1, J. Pantazis 1, A. Huber 1, B. Cross 2 1 Amptek, Inc., 14 DeAngelo Dr, Bedford MA 01730, 781-275-2242, www.amptek.com 2
8. Which of the following could be an isotope of chlorine? (A) 37 Cl 17 (B) 17 Cl 17 (C) 37 Cl 17 (D) 17 Cl 37.5 (E) 17 Cl 37
 37 Cl 17 (B) 17 Cl 17 (C) 37 Cl 17 (D) 17 Cl 37.5 (E) 17 Cl 37") Electronic Structure Worksheet 1 Given the following list of atomic and ionic species, find the appropriate match for questions 1-4. (A) Fe 2+ (B) Cl (C) K + (D) Cs (E) Hg + 1. Has the electron configuration:
Electronic Structure Worksheet 1 Given the following list of atomic and ionic species, find the appropriate match for questions 1-4. (A) Fe 2+ (B) Cl (C) K + (D) Cs (E) Hg + 1. Has the electron configuration:
Chemistry Instrumental Analysis Lecture 19 Chapter 12. Chem 4631
 Chemistry 4631 Instrumental Analysis Lecture 19 Chapter 12 There are three major techniques used for elemental analysis: Optical spectrometry Mass spectrometry X-ray spectrometry X-ray Techniques include:
Analytical Methods for Materials
 Analytical Methods for Materials Lesson 6 Production & Properties of X-rays Suggested Reading Chapter 1 in Waseda et al. Section 2.1 in Leng Other Reference B.D. Cullity and S.R. Stock, Elements of X-ray
- Light has properties of WAVES such as DIFFRACTION (it bends around small obstructions).
.") 170 LIGHT wavelength Diffraction frequency = wavelengths / time = - Light has properties of WAVES such as DIFFRACTION (it bends around small obstructions). - Einstein noted that viewing light as a particle
170 LIGHT wavelength Diffraction frequency = wavelengths / time = - Light has properties of WAVES such as DIFFRACTION (it bends around small obstructions). - Einstein noted that viewing light as a particle
Multi Channel Analyzer (MCA) Analyzing a Gamma spectrum
 Analyzing a Gamma spectrum") Multi Channel Analyzer (MCA) Analyzing a Gamma spectrum Objective: Using the MCA to acquire spectrums for different gamma sources and to identify an unknown source from its spectrum, furthermore to investigate
Multi Channel Analyzer (MCA) Analyzing a Gamma spectrum Objective: Using the MCA to acquire spectrums for different gamma sources and to identify an unknown source from its spectrum, furthermore to investigate
How many grams of sodium metal is required to completely react with 2545 grams of chlorine gas?
 EXAMPLE PROBLEM: How many grams of sodium metal is required to completely react with 2545 grams of chlorine gas? 1 - Convert 2545 grams of chlorine to moles chlorine using formula weight 2 - Convert moles
SCINTILLATION DETECTORS & GAMMA SPECTROSCOPY: AN INTRODUCTION
 SCINTILLATION DETECTORS & GAMMA SPECTROSCOPY: AN INTRODUCTION OBJECTIVE The primary objective of this experiment is to use an NaI(Tl) detector, photomultiplier tube and multichannel analyzer software system
This experiment is included in the XRP 4.0 X-ray solid state, XRS 4.0 X-ray structural analysis, and XRC 4.0 X-ray characteristics upgrade sets.
 The intensity of characteristic X-rays as a TEP Related topics Characteristic X-radiation, energy levels, Bragg s law, and intensity of characteristic X-rays Principle The X-ray spectrum of an X-ray tube
X-Ray Photoelectron Spectroscopy (XPS) Prof. Paul K. Chu
 Prof. Paul K. Chu") X-Ray Photoelectron Spectroscopy (XPS) Prof. Paul K. Chu X-ray Photoelectron Spectroscopy Introduction Qualitative analysis Quantitative analysis Charging compensation Small area analysis and XPS imaging
X-Ray Photoelectron Spectroscopy (XPS) Prof. Paul K. Chu X-ray Photoelectron Spectroscopy Introduction Qualitative analysis Quantitative analysis Charging compensation Small area analysis and XPS imaging
Advances in Field-Portable XRF
 Advances in Field-Portable XRF Volker Thomsen and Debbie Schatzlein Field-portable x-ray fluorescence (XRF) allows us to take the laboratory to the sample. The latest generation of such handheld x-ray
X-rays. X-ray Radiography - absorption is a function of Z and density. X-ray crystallography. X-ray spectrometry
 X-rays Wilhelm K. Roentgen (1845-1923) NP in Physics 1901 X-ray Radiography - absorption is a function of Z and density X-ray crystallography X-ray spectrometry X-rays Cu K α E = 8.05 kev λ = 1.541 Å Interaction
- Why are phase labels required? Because phase changes either absorb or release energy. ... what does this mean?
 157 SINCE the enthalpy change does NOT depend on path, this means that we can use standard values for enthalpy to predict the heat change in reactions that we have not tested in a calorimeter. THERMOCHEMICAL
How many grams of sodium metal is required to completely react with 2545 grams of chlorine gas?
 146 EXAMPLE PROBLEM: How many grams of sodium metal is required to completely react with 2545 grams of chlorine gas? 1 - Convert 2545 grams of chlorine gas to moles. Use formula weight. 2 - Convert moles
Analysis of Cadmium (Cd) in Plastic Using X-ray Fluorescence Spectroscopy
 in Plastic Using X-ray Fluorescence Spectroscopy") Analysis of Cadmium (Cd) in Plastic Using X-ray Fluorescence Spectroscopy Hiroshi Onodera Application & Research Center, JEOL Ltd. Introduction um, PBB and PBDE) are subject to usage restrictions in Europe.
Analysis of Cadmium (Cd) in Plastic Using X-ray Fluorescence Spectroscopy Hiroshi Onodera Application & Research Center, JEOL Ltd. Introduction um, PBB and PBDE) are subject to usage restrictions in Europe.
XUV 773: X-Ray Fluorescence Analysis of Gemstones
 Fischer Application report vr118 HELM UT FISCHER GMBH + CO. KG Institut für Elektronik und Messtechnik Industriestrasse 21-7169 Sindelfingen, Germany Tel.: (+49) 731 33- - Fax: (+49) 731 33-79 E-Mail:
- Atomic line spectra are UNIQUE to each element. They're like atomic "fingerprints".
 - Atomic line spectra are UNIQUE to each element. They're like atomic "fingerprints". - Problem was that the current model of the atom completely failed to explain why atoms emitted these lines. An orbit
ATOMIC WORLD P.1. ejected photoelectrons. current amplifier. photomultiplier tube (PMT)
") ATOMIC WORLD P. HKAL PAPER I 0 8 The metal Caesium has a work function of.08 ev. Given: Planck constant h = 6.63 0 34 J s, charge of an electron e =.60 0 9 C (a) (i) Calculate the longest wavelength of
ATOMIC WORLD P. HKAL PAPER I 0 8 The metal Caesium has a work function of.08 ev. Given: Planck constant h = 6.63 0 34 J s, charge of an electron e =.60 0 9 C (a) (i) Calculate the longest wavelength of
Rb, which had been compressed to a density of 1013
 Modern Physics Study Questions for the Spring 2018 Departmental Exam December 3, 2017 1. An electron is initially at rest in a uniform electric field E in the negative y direction and a uniform magnetic
Scintillation Detector
 Scintillation Detector Introduction The detection of ionizing radiation by the scintillation light produced in certain materials is one of the oldest techniques on record. In Geiger and Marsden s famous
Portable type TXRF analyzer: Ourstex 200TX
 Excerpted from Adv. X-Ray. Chem. Anal., Japan: 42, pp. 115-123 (2011) H. Nagai, Y. Nakajima, S. Kunimura, J. Kawai Improvement in Sensitivity and Quantification by Using a Portable Total Reflection X-Ray
4. Inelastic Scattering
 1 4. Inelastic Scattering Some inelastic scattering processes A vast range of inelastic scattering processes can occur during illumination of a specimen with a highenergy electron beam. In principle, many
Quantitative XRF Analysis. algorithms and their practical use
 Joint ICTP-IAEA School on Novel Experimental Methodologies for Synchrotron Radiation Applications in Nano-science and Environmental Monitoring Quantitative XRF Analysis algorithms and their practical use
= 6 (1/ nm) So what is probability of finding electron tunneled into a barrier 3 ev high?
 So what is probability of finding electron tunneled into a barrier 3 ev high?") STM STM With a scanning tunneling microscope, images of surfaces with atomic resolution can be readily obtained. An STM uses quantum tunneling of electrons to map the density of electrons on the surface
STM STM With a scanning tunneling microscope, images of surfaces with atomic resolution can be readily obtained. An STM uses quantum tunneling of electrons to map the density of electrons on the surface
6. Analytical Electron Microscopy
 Physical Principles of Electron Microscopy 6. Analytical Electron Microscopy Ray Egerton University of Alberta and National Institute of Nanotechnology Edmonton, Canada www.tem-eels.ca regerton@ualberta.ca
PHI 5000 Versaprobe-II Focus X-ray Photo-electron Spectroscopy
 PHI 5000 Versaprobe-II Focus X-ray Photo-electron Spectroscopy The very basic theory of XPS XPS theroy Surface Analysis Ultra High Vacuum (UHV) XPS Theory XPS = X-ray Photo-electron Spectroscopy X-ray
Auger Electron Spectroscopy *
 OpenStax-CNX module: m43546 1 Auger Electron Spectroscopy * Amanda M. Goodman Andrew R. Barron This work is produced by OpenStax-CNX and licensed under the Creative Commons Attribution License 3.0 1 Basic
X-ray absorption. 4. Prove that / = f(z 3.12 ) applies.
 applies.") Related topics Bremsstrahlung, characteristic radiation, Bragg scattering, law of absorption, mass absorption coefficient, absorption edge, half-value thickness, photoelectric effect, Compton scattering,
Related topics Bremsstrahlung, characteristic radiation, Bragg scattering, law of absorption, mass absorption coefficient, absorption edge, half-value thickness, photoelectric effect, Compton scattering,
FUNDAMENTAL PARAMETER METHOD FOR THE LOW ENERGY REGION INCLUDING CASCADE EFFECT AND PHOTOELECTRON EXCITATION
 Copyright (c)jcpds-international Centre for Diffraction Data 2002, Advances in X-ray Analysis, Volume 45. 511 FUNDAMENTAL PARAMETER METHOD FOR THE LOW ENERGY REGION INCLUDING CASCADE EFFECT AND PHOTOELECTRON
Nuclear Decays. Alpha Decay
 Nuclear Decays The first evidence of radioactivity was a photographic plate, wrapped in black paper and placed under a piece of uranium salt by Henri Becquerel on February 26, 1896. Like many events in
X-ray fluorescence analysis - calibration of the X-ray energy detector
 X-ray fluorescence analysis - TEP Related topics Bremsstrahlung, characteristic X-radiation, energy levels, fluorescence radiation, conduction processes in semiconductors, doping of semiconductors, pin-diodes,
Atomic and nuclear physics
 Atomic and nuclear physics X-ray physics Attenuation of x-rays LEYBOLD Physics Leaflets P6.3.2.2 Investigating the wavelength dependency of the coefficient of attenuation Objects of the experiment To measure
Spectroscopy on Mars!
 Spectroscopy on Mars! Pathfinder Spirit and Opportunity Real World Friday H2A The Mars Pathfinder: Geological Elemental Analysis On December 4th, 1996, the Mars Pathfinder was launched from earth to begin
Auger Electron Spectroscopy (AES)
") 1. Introduction Auger Electron Spectroscopy (AES) Silvia Natividad, Gabriel Gonzalez and Arena Holguin Auger Electron Spectroscopy (Auger spectroscopy or AES) was developed in the late 1960's, deriving
1. Introduction Auger Electron Spectroscopy (AES) Silvia Natividad, Gabriel Gonzalez and Arena Holguin Auger Electron Spectroscopy (Auger spectroscopy or AES) was developed in the late 1960's, deriving
Peter L Warren, Pamela Y Shadforth ICI Technology, Wilton, Middlesbrough, U.K.
 783 SCOPE AND LIMITATIONS XRF ANALYSIS FOR SEMI-QUANTITATIVE Introduction Peter L Warren, Pamela Y Shadforth ICI Technology, Wilton, Middlesbrough, U.K. Historically x-ray fluorescence spectrometry has
Altitude influence of elemental distribution in grass from Rila mountain. Dr. E. Nikolova, Dr. A. Artinyan, S. Nikolova INRNE - BAS XRF Laboratory
 Altitude influence of elemental distribution in grass from Rila mountain Dr. E. Nikolova, Dr. A. Artinyan, S. Nikolova INRNE - BAS XRF Laboratory I. Introduction The application of modern instrumental
X-ray Absorption and Emission Prepared By Jose Hodak for BSAC program 2008
 X-ray Absorption and Emission Prepared By Jose Hodak for BSAC program 2008 1- A bit of History: Wilhelm Conrad Röntgen discovered 1895 the X-rays. 1901 he was honored by the Noble prize for physics. In
Chapter 4 Scintillation Detectors
 Med Phys 4RA3, 4RB3/6R03 Radioisotopes and Radiation Methodology 4-1 4.1. Basic principle of the scintillator Chapter 4 Scintillation Detectors Scintillator Light sensor Ionizing radiation Light (visible,
Atomic Spectra HISTORY AND THEORY
 Atomic Spectra HISTORY AND THEORY When atoms of a gas are excited (by high voltage, for instance) they will give off light. Each element (in fact, each isotope) gives off a characteristic atomic spectrum,
X-ray Energy Spectroscopy (XES).
.") X-ray Energy Spectroscopy (XES). X-ray fluorescence as an analytical tool for element analysis is based on 3 fundamental parameters: A. Specificity: In determining an x-ray emission energy E certainty
X-ray Energy Spectroscopy (XES). X-ray fluorescence as an analytical tool for element analysis is based on 3 fundamental parameters: A. Specificity: In determining an x-ray emission energy E certainty
Rad T 290 Worksheet 2
 Class: Date: Rad T 290 Worksheet 2 1. Projectile electrons travel from a. anode to cathode. c. target to patient. b. cathode to anode. d. inner shell to outer shell. 2. At the target, the projectile electrons
Note that the protons and neutrons are each almost 2,000 times more massive than an electron; What is the approximate diameter of an atom?
 Atomic Structure and the Periodic Table Evolution of Atomic Theory The ancient Greek scientist Democritus is often credited with developing the idea of the atom Democritus proposed that matter was, on
Standardless Analysis by XRF but I don t know what s in my sample!! Dr Colin Slater Applications Scientist, XRF Bruker UK Limited
 by XRF but I don t know what s in my sample!! Dr Colin Slater Applications Scientist, XRF Bruker UK Limited XRF Standardless Analysis In this talk What is meant by standardless analysis? Fundamental Parameters
Creating Empirical Calibrations
 030.0023.01.0 Spreadsheet Manual Save Date: December 1, 2010 Table of Contents 1. Overview... 3 2. Enable S1 Calibration Macro... 4 3. Getting Ready... 4 4. Measuring the New Sample... 5 5. Adding New
EXAMINATION QUESTIONS (6)
") 1. What is a beta-particle? A a helium nucleus B a high-energy electron C four protons D two neutrons EXAMINATION QUESTIONS (6) 2. The diagram shows part of a circuit used to switch street lamps on and
1. What is a beta-particle? A a helium nucleus B a high-energy electron C four protons D two neutrons EXAMINATION QUESTIONS (6) 2. The diagram shows part of a circuit used to switch street lamps on and
Ba (Z = 56) W (Z = 74) preferred target Mo (Z = 42) Pb (Z = 82) Pd (Z = 64)
 W (Z = 74) preferred target Mo (Z = 42) Pb (Z = 82) Pd (Z = 64)") Produced by accelerating electrons with high voltage and allowing them to collide with metal target (anode), e.g, Tungsten. Three Events (Two types of x-ray) a) Heat X-Ray Tube b) bremsstrahlung (braking
Produced by accelerating electrons with high voltage and allowing them to collide with metal target (anode), e.g, Tungsten. Three Events (Two types of x-ray) a) Heat X-Ray Tube b) bremsstrahlung (braking