MT Electron microscopy Scanning electron microscopy and electron probe microanalysis
|
|
|
- Linette Payne
- 5 years ago
- Views:
Transcription
 and electron probe microanalysis (EPMA) Introduction to sample preparation 2.")
 and backscattering (BSE) electron imaging with SEM X-ray spectrometry using EDS and WDS Electron")
1 MT Electron microscopy Scanning electron microscopy and electron probe microanalysis Eero Haimi Research Manager Outline 1. Introduction Basics of scanning electron microscopy (SEM) and electron probe microanalysis (EPMA) Introduction to sample preparation 2. Background of measurement principles and methods Electron beam specimen interaction Equipment technology 3. Measurement techniques Secondary (SE) and backscattering (BSE) electron imaging with SEM X-ray spectrometry using EDS and WDS Electron backscattering diffraction (EBSD) 4. Applications examples 1
2 3. Measurement techniques Electron probe microanalysis (EPMA) = x-ray spectrometry using energy dispersive spectrometer (EDS) and wavelength dispersive spectrometer (WDS) Chemical composition of a samples in micrometer length scale Non-destructive Emission of characteristic x-rays Characteristic x-ray are emitted by the following process: a) The interaction of a high energy electrons with an atom result in ejection of an electron from inner atomic shell b) De-excitation (relaxation) takes place, when an electron from an outer shell fills the empty state (T-excitation < 10-8 s). The difference between the two shell energies equals the energy of the characteristic x-ray: hn = E f -E i 2

3 Shells and subshells of atoms Shell Subshell number Quantum numbers n l j mj Spectroscopic designation Maximum electron population K /2 ±1/2 1s 2 L /2 ±1/2 2s /2 ±1/2 2p /2 ±3/2,±1/2 2p 4 M /2 ±1/2 3s /2 ±1/2 3p /2 ±3/2,±1/2 3p /2 ±3/2,±1/2 3d /2 ±5/2,±3/2,±1/2 3d 6 N ½ ±1/2 4s ½ ±1/2 4p /2 ±3/2,±1/2 4p /2 ±3/2,±1/2 4d /2 ±5/2,±3/2,±1/2 4d /2 ±5/2,±3/2,±1/2 4f /2 ±7/2,±5/2,±3/2,±1/2 4f 8 Characteristic x-rays 3
4 Characteristic X-Ray Energies [kev] Z Element Ka1 Ka2 Kb1 La1 La2 Lb1 Lb2 Lg1 4 Be S B C N O F Ne Na Mg Al Si P S Cl Ar K Ca Sc Ti V Cr Mn Fe Co Ni Cu Zn Ga Ge As Se Br Kr Rb Sr Moseley s law Characteritic wavelengths are element specific constants; they depend only on atomic energy levels. Therefore, characteristic x- rays can be used for element identification Characteristic x-ray wavelengths obey Moseley s law: l -1/2 = C(Z-s) or equivalently E = D(Z-F) 2 where C,s,D ja F are electron shell specific constants 4
5 Intensity relations of x-ray lines The following common families of lines can be used by the microscopist in peak identification: Kα : Kβ = 10 : 1 Lα : Lβ1 : Lβ2 : Lγ = 10 : 7 : 2 : 1 Mα : Mβ = 10 : 6 Measurement of x-ray spectrum Starting point of electron probe microanalysis is measurement of x-ray spectrum emitted by the sample. In other words, measurement of x-ray intensity as a fuction of either wavelength or energy Historically measurement of wavelength is older and still more precise method Measurement of energy is faster, because the whole spectrum is measured simultaneously 5
6 Measurement principle of WDS Same principle (Bragg's law) than in x-ray diffractometer, but nl=2dsinq Unknownn Known To be measured EDS measurement system Four primary components of the EDS setup are the excitation source (electron beam) the x-ray detector the pulse processor the analyzer 6

7 Operation principle of SDD The detector is a semiconductor device that through the process of ionisation converts an x-ray of a particular energy into an electric charge of proportional size. SDD devices use a field gradient applied by ring electrodes on its back surface to collect the charge liberated by each x-ray detected, at the anode. Anode << cathode ->small capacitance -> high speed High speed -> smaal leakige current-> less need for cooling Peltier-cooling (-25 C) is sufficient Pulse processing Electronics after the detector takes care of pulse collection and transfer to displayed spectrums (intensity histograms) FET Pre-amplifier Pulse processor Multi channel analyzer EDS measures simultaneously the whole spectrum Although electronics of EDS systems is very fast, processing of a pulse takes certain time (4-100 ms). In case of exact energy x-ray photon, measurement process cause ev statistical variation in measurement result. 7
8 Spectral artifacts Sum peaks Sum peaks occur when x-ray photons are detected at nearly same time, and the pulse processing electronics erroneously record the sum of their energies Is accosiated with high counting rates Escape peaks Escape peaks occur when fluorescence radiation is generated at Si atoms of the detector and Si-Ka photons escapes the crystal The result is a peak at 1,74 kev (Si-Ka energy) below the parent peak for a detector made out of silicon Spectral Resolution Requirements Good spectral resolution permits easy isolation, identification, and measurement of peaks If peak separation is bigger than ~2x resolution: Peaks are isolated Peak identification is trivial unless the second element is a trace element Software is needed for quantification If peak separation is less than ~2x resolution: Peaks overlap in display Peak deconvolution is needed Software is needed for quantification In practice, most spectra require software to analyze peaks, even at highest resolution 8
9 Beam-sample-detector geometry Changes in the beamsample-detector geometry effect measurement results If this is not taken into account, systematic errors in intensity measurement arise Therefore, specific analytical working distance is defined for each measurement instrument Geometrical effects 9

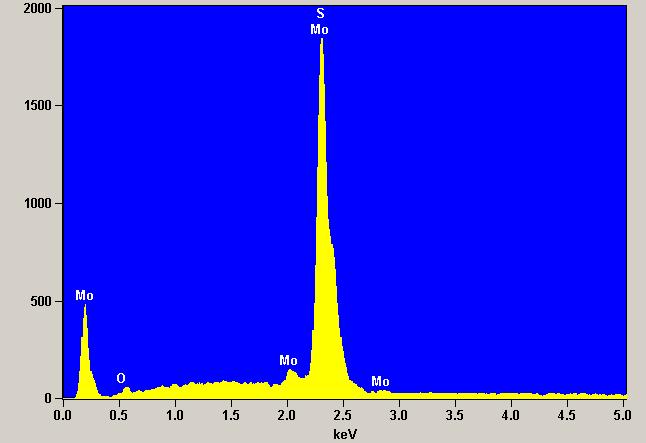
10 Modes of data acquisition in microanalysis Point analysis Line analysis Area analysis Elemental maps EDS point analysis 10


11 Collection EDS spectrum Elemental analysis using electron microprobe Qualitative analysis Quantitative analysis Semi-Quantitative analysis 11

12 Qualitative elemental analysis Qualitative elemental Observe analysis involves Spectrometer calibration identification of elements Adequate acceleration voltage present at studied (over voltage) > 1,5 * critical energy E location of the sample c utilizing positions of Spectral artefacts characteristic x-ray lines Peak overlaps Peak shape and height emitted from the sample K, L, M peak families and intensity relations Detection limits > 3 * square rooth of background intensity Identification of x-ray lines 12
13 Characteristic X-Ray Energies [kev] Z Element Ka1 Ka2 Kb1 La1 La2 Lb1 Lb2 Lg1 82 Pb Bi Identification of x-ray lines 13

14 Identification of x-ray lines Automatic identification of x-ray lines 14

15 Quantitative elemental analysis Quantitative analysis is based on assumption that intensities of characteristic x-ray lines are proportional to consentrations of elements in the sample However, proportionality is not linear Quantification is performed by comparing intensities measured from sample to intensities from known standards. In this way the ratio of the unknown-to-known intensities, after continuum background is subtracted and peak overlaps are counted for, is established : k i = (P-B) i /(P-B) i0 = I i / I io, wherei i ja I i0 are measured net intensities of peaks measured from the sample and the standard, respectively Relative intensities are proportional to mass fractions in following manner: C i /C io = [ZAF] i *k i Z = atomic number correction A = absorption correction F = fluorescencecorrection C i= mass fraction of a element Z, A, F terms are non-linear correctionfactors that depend matrix composition and interactions between element. Several procedures exists for correctioncalculations. Filtering and deconvolution of raw data Quantitative x-ray analysis require peak intensity determination from measured spectrum There are two basic questions that are accosiated with this To obtain true peak intensities, background continuum must be subtracted from the raw data. In filtering, effect of noise has to be considered especially in the case of trace elements Because of limited energy resolution peak overlaps occur. This require peak deconvolution. 15

16 Matrix effects Atomic number effect Atomic number effects backscattering coefficient and the rate of energy loss due to inelastic scattering (stopping power). X-ray absorption effect As an x-ray photon travels through the sample, it may be absorbed. Absorption probability depends on mass absorption coefficient radiation, specimen density and x-ray path length. Mass absorption coefficients dependt on radiation wavelengths and therefore varies from one x-ray line to another X-ray fluorescence effect In heterogenic samples, x-ray photons from atoms with bigger atomic number may generate secondary fluorescense x-ray radiation in atoms with lower atomic number Matrix effects in Cu-Au alloy 16
")
17 Quantitative results Classification of concentration into categories Major elements: more than 10 wt% Minor elements: 1-10 wt% Trace elements: les than 1 wt% Light elements Z<11 (Na) 17


18 Semi-quantitative elemental analysis Applies theoretically calculated or factory measured standards stored in computer memory. Good for examination of ratios element is sample. Fast to apply Doesn t warn about missing elements Line analysis 18

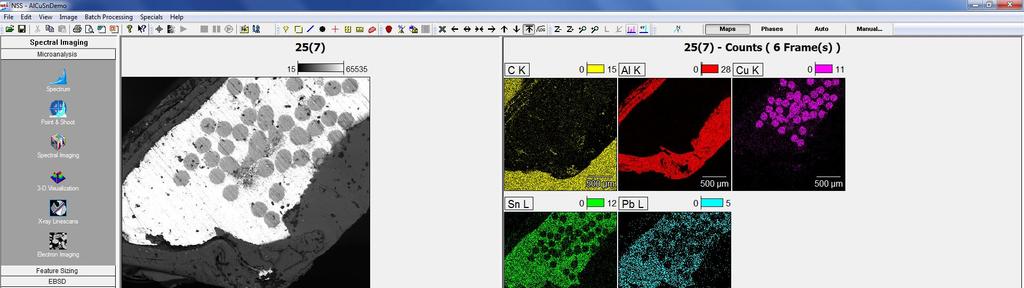
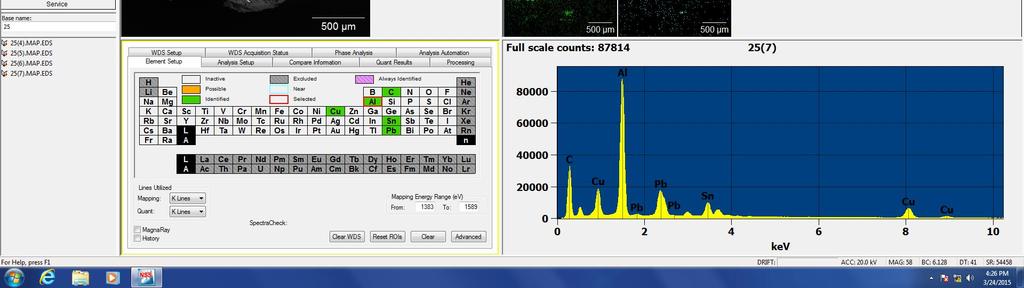
19 Area analysis Homogeneous area! Elemental maps 19


20 Spectral imaging In spectral imaging, spectral information is collected at every pixel of an image. Results 3-D data cube: X, Y, Spectrum Data can be processed later with off-line computer: Spectrums Linescans Maps Creates new possibilities! Analysis of local composition with x-ray spectrometers 20
21 Overview of instrument capabilities High magnification Large depth of field Chemical information in micrometer scale (BSE, EDS, WDS) Crystallographic information (EBSD) Special techniques (EBIC, CL, voltage contrast) In-situ experiments (temperature, strain, etc.) More that just a microscope More that just composition and structure 21
MT Electron microscopy Scanning electron microscopy and electron probe microanalysis
 MT-0.6026 Electron microscopy Scanning electron microscopy and electron probe microanalysis Eero Haimi Research Manager Outline 1. Introduction Basics of scanning electron microscopy (SEM) and electron
Electron probe microanalysis - Electron microprobe analysis EPMA (EMPA) What s EPMA all about? What can you learn?
 What s EPMA all about? What can you learn?") Electron probe microanalysis - Electron microprobe analysis EPMA (EMPA) What s EPMA all about? What can you learn? EPMA - what is it? Precise and accurate quantitative chemical analyses of micron-size
Electron probe microanalysis - Electron microprobe analysis EPMA (EMPA) What s EPMA all about? What can you learn? EPMA - what is it? Precise and accurate quantitative chemical analyses of micron-size
EDS User School. Principles of Electron Beam Microanalysis
 EDS User School Principles of Electron Beam Microanalysis Outline 1.) Beam-specimen interactions 2.) EDS spectra: Origin of Bremsstrahlung and characteristic peaks 3.) Moseley s law 4.) Characteristic
SEM. Chemical Analysis in the. Elastic and Inelastic scattering. Chemical analysis in the SEM. Chemical analysis in the SEM
 THE UNIVERSITY Chemical Analysis in the SEM Ian Jones Centre for Electron Microscopy OF BIRMINGHAM Elastic and Inelastic scattering Electron interacts with one of the orbital electrons Secondary electrons,
Generation of X-Rays in the SEM specimen
 Generation of X-Rays in the SEM specimen The electron beam generates X-ray photons in the beam-specimen interaction volume beneath the specimen surface. Some X-ray photons emerging from the specimen have
MS482 Materials Characterization ( 재료분석 ) Lecture Note 4: XRF
 Lecture Note 4: XRF") 2016 Fall Semester MS482 Materials Characterization ( 재료분석 ) Lecture Note 4: XRF Byungha Shin Dept. of MSE, KAIST 1 Course Information Syllabus 1. Overview of various characterization techniques (1 lecture)
2016 Fall Semester MS482 Materials Characterization ( 재료분석 ) Lecture Note 4: XRF Byungha Shin Dept. of MSE, KAIST 1 Course Information Syllabus 1. Overview of various characterization techniques (1 lecture)
Chemistry Instrumental Analysis Lecture 19 Chapter 12. Chem 4631
 Chemistry 4631 Instrumental Analysis Lecture 19 Chapter 12 There are three major techniques used for elemental analysis: Optical spectrometry Mass spectrometry X-ray spectrometry X-ray Techniques include:
Electron Microprobe Analysis 1 Nilanjan Chatterjee, Ph.D. Principal Research Scientist
 12.141 Electron Microprobe Analysis 1 Nilanjan Chatterjee, Ph.D. Principal Research Scientist Massachusetts Institute of Technology Electron Microprobe Facility Department of Earth, Atmospheric and Planetary
Electron Microprobe Analysis 1 Nilanjan Chatterjee, Ph.D. Principal Research Scientist
 12.141 Electron Microprobe Analysis 1 Nilanjan Chatterjee, Ph.D. Principal Research Scientist Massachusetts Institute of Technology Electron Microprobe Facility Department of Earth, Atmospheric and Planetary
Overview of X-Ray Fluorescence Analysis
 Overview of X-Ray Fluorescence Analysis AMPTEK, INC., Bedford, MA 01730 Ph: +1 781 275 2242 Fax: +1 781 275 3470 sales@amptek.com 1 What is X-Ray Fluorescence (XRF)? A physical process: Emission of characteristic
X-Ray Fluorescence and Natural History
 X-Ray Fluorescence and Natural History How XRF Helps XRF can be used both quantitatively (homogenous samples) and quantitatively (heterogenous samples).! Trace elements in a fossil can help identify source,
Chemical Analysis in TEM: XEDS, EELS and EFTEM. HRTEM PhD course Lecture 5
 Chemical Analysis in TEM: XEDS, EELS and EFTEM HRTEM PhD course Lecture 5 1 Part IV Subject Chapter Prio x-ray spectrometry 32 1 Spectra and mapping 33 2 Qualitative XEDS 34 1 Quantitative XEDS 35.1-35.4
X Rays & Crystals. Characterizing Mineral Chemistry & Structure. J.D. Price
 X Rays & Crystals Characterizing Mineral Chemistry & Structure J.D. Price Light - electromagnetic spectrum Wave behavior vs. particle behavior If atoms are on the 10-10 m scale, we need to use sufficiently
Chemistry 311: Instrumentation Analysis Topic 2: Atomic Spectroscopy. Chemistry 311: Instrumentation Analysis Topic 2: Atomic Spectroscopy
 Topic 2b: X-ray Fluorescence Spectrometry Text: Chapter 12 Rouessac (1 week) 4.0 X-ray Fluorescence Download, read and understand EPA method 6010C ICP-OES Winter 2009 Page 1 Atomic X-ray Spectrometry Fundamental
1 of 5 14/10/ :21
 X-ray absorption s, characteristic X-ray lines... 4.2.1 Home About Table of Contents Advanced Search Copyright Feedback Privacy You are here: Chapter: 4 Atomic and nuclear physics Section: 4.2 Absorption
Introduction to EDX. Energy Dispersive X-ray Microanalysis (EDS, Energy dispersive Spectroscopy) Basics of EDX
 Basics of EDX") Introduction to EDX Energy Dispersive X-ray Microanalysis (EDS, Energy dispersive Spectroscopy) EDX Marco Cantoni 1 Basics of EDX a) Generation of X-rays b) Detection Si(Li) Detector, SDD Detector, EDS
Introduction to EDX Energy Dispersive X-ray Microanalysis (EDS, Energy dispersive Spectroscopy) EDX Marco Cantoni 1 Basics of EDX a) Generation of X-rays b) Detection Si(Li) Detector, SDD Detector, EDS
LAB REPORT ON XRF OF POTTERY SAMPLES By BIJOY KRISHNA HALDER Mohammad Arif Ishtiaque Shuvo Jie Hong
 LAB REPORT ON XRF OF POTTERY SAMPLES By BIJOY KRISHNA HALDER Mohammad Arif Ishtiaque Shuvo Jie Hong Introduction: X-ray fluorescence (XRF) spectrometer is an x-ray instrument used for routine, relatively
Understanding X-rays: The electromagnetic spectrum
 Understanding X-rays: The electromagnetic spectrum 1 ULa 13.61 kev 0.09 nm BeKa 0.11 kev 11.27 nm E = hn = h c l where, E : energy, h : Planck's constant, n : frequency c : speed of light in vacuum, l
Understanding X-rays: The electromagnetic spectrum
 Understanding X-rays: The electromagnetic spectrum 1 ULa 13.61 kev 0.09 nm BeKa 0.11 kev 11.27 nm E = hn = h c l where, E : energy, h : Planck's constant, n : frequency c : speed of light in vacuum, l
CHEM-E5225 :Electron Microscopy X-Ray Spectrometry
 CHEM-E5225 :Electron Microscopy X-Ray Spectrometry 2016.11 Yanling Ge Outline X-ray Spectrometry X-ray Spectra and Images Qualitative and Quantitative X-ray Analysis and Imaging Discussion of homework
Silicon Drift Detectors: Understanding the Advantages for EDS Microanalysis. Patrick Camus, PhD Applications Scientist March 18, 2010
 Silicon Drift Detectors: Understanding the Advantages for EDS Microanalysis Patrick Camus, PhD Applications Scientist March 18, 2010 EDS Detector Requirements Detect whole energy range of x-rays 50 ev
CHEM*3440. X-Ray Energies. Bremsstrahlung Radiation. X-ray Line Spectra. Chemical Instrumentation. X-Ray Spectroscopy. Topic 13
 X-Ray Energies very short wavelength radiation 0.1Å to 10 nm (100 Å) CHEM*3440 Chemical Instrumentation Topic 13 X-Ray Spectroscopy Visible - Ultraviolet (UV) - Vacuum UV (VUV) - Extreme UV (XUV) - Soft
Chemical Analysis. Energy Dispersive X-Ray Spectroscopy (EDS)
") Chemical Analysis We have so far discussed several of the signals detected on interaction of a high-energy electron beam with a solid sample (secondary, backscattered, transmitted, and diffracted electrons);
Chemical Analysis We have so far discussed several of the signals detected on interaction of a high-energy electron beam with a solid sample (secondary, backscattered, transmitted, and diffracted electrons);
Praktikum zur. Materialanalytik
 Praktikum zur Materialanalytik Energy Dispersive X-ray Spectroscopy B513 Stand: 19.10.2016 Contents 1 Introduction... 2 2. Fundamental Physics and Notation... 3 2.1. Alignments of the microscope... 3 2.2.
Massachusetts Institute of Technology. Dr. Nilanjan Chatterjee
 Massachusetts Institute of Technology Dr. Nilanjan Chatterjee Electron Probe Micro-Analysis (EPMA) Imaging and micrometer-scale chemical compositional analysis of solids Signals produced in The Electron
ECE Semiconductor Device and Material Characterization
 ECE 4813 Semiconductor Device and Material Characterization Dr. Alan Doolittle School of Electrical and Computer Engineering Georgia Institute of Technology As with all of these lecture slides, I am indebted
Contrasted strengths and weakness of EDS, WDS and AES for determining the composition of samples
 Contrasted strengths and weakness of EDS, WDS and AES for determining the composition of samples Ana-Marija Nedić Course 590B 12/07/2018 Iowa State University Contrasted strengths and weakness of EDS,
6. Analytical Electron Microscopy
 Physical Principles of Electron Microscopy 6. Analytical Electron Microscopy Ray Egerton University of Alberta and National Institute of Nanotechnology Edmonton, Canada www.tem-eels.ca regerton@ualberta.ca
EDS Mapping. Ian Harvey Fall Practical Electron Microscopy
 EDS Mapping Ian Harvey Fall 2008 1 From: Energy Dispersive X-ray Microanalysis, An Introduction Kevex Corp. 1988 Characteristic X-ray generation p.2 1 http://www.small-world.net/efs.htm X-ray generation
HOW TO APPROACH SCANNING ELECTRON MICROSCOPY AND ENERGY DISPERSIVE SPECTROSCOPY ANALYSIS. SCSAM Short Course Amir Avishai
 HOW TO APPROACH SCANNING ELECTRON MICROSCOPY AND ENERGY DISPERSIVE SPECTROSCOPY ANALYSIS SCSAM Short Course Amir Avishai RESEARCH QUESTIONS Sea Shell Cast Iron EDS+SE Fe Cr C Objective Ability to ask the
MSE 321 Structural Characterization
 Auger Spectroscopy Auger Electron Spectroscopy (AES) Scanning Auger Microscopy (SAM) Incident Electron Ejected Electron Auger Electron Initial State Intermediate State Final State Physical Electronics
Introduction to X-ray Photoelectron Spectroscopy (XPS) XPS which makes use of the photoelectric effect, was developed in the mid-1960
 XPS which makes use of the photoelectric effect, was developed in the mid-1960") Introduction to X-ray Photoelectron Spectroscopy (XPS) X-ray Photoelectron Spectroscopy (XPS), also known as Electron Spectroscopy for Chemical Analysis (ESCA) is a widely used technique to investigate
Introduction to X-ray Photoelectron Spectroscopy (XPS) X-ray Photoelectron Spectroscopy (XPS), also known as Electron Spectroscopy for Chemical Analysis (ESCA) is a widely used technique to investigate
XUV 773: X-Ray Fluorescence Analysis of Gemstones
 Fischer Application report vr118 HELM UT FISCHER GMBH + CO. KG Institut für Elektronik und Messtechnik Industriestrasse 21-7169 Sindelfingen, Germany Tel.: (+49) 731 33- - Fax: (+49) 731 33-79 E-Mail:
MICRO-TOMOGRAPHY AND X-RAY ANALYSIS OF GEOLOGICAL SAMPLES
 THE PUBLISHING HOUSE PROCEEDINGS OF THE ROMANIAN ACADEMY, Series A, OF THE ROMANIAN ACADEMY Volume 18, Number 1/2017, pp. 42 49 MICRO-TOMOGRAPHY AND X-RAY ANALYSIS OF GEOLOGICAL SAMPLES Ion GRUIA University
X-ray Absorption Spectroscopy
 X-ray Absorption Spectroscopy Nikki Truss November 26, 2012 Abstract In these experiments, some aspects of x-ray absorption spectroscopy were investigated. The x-ray spectrum of molybdenum was recorded
X-rays. X-ray Radiography - absorption is a function of Z and density. X-ray crystallography. X-ray spectrometry
 X-rays Wilhelm K. Roentgen (1845-1923) NP in Physics 1901 X-ray Radiography - absorption is a function of Z and density X-ray crystallography X-ray spectrometry X-rays Cu K α E = 8.05 kev λ = 1.541 Å Interaction
Latest advances in identifying mineral composition variation by the M4 TORNADO AMICS
 Latest advances in identifying mineral composition variation by the M4 TORNADO AMICS Bruker Nano Analytics, Berlin, Germany Webinar, June 15, 2017 Innovation with Integrity Presenters Samuel Scheller Sr.
Auger Electron Spectroscopy
 Auger Electron Spectroscopy Auger Electron Spectroscopy is an analytical technique that provides compositional information on the top few monolayers of material. Detect all elements above He Detection
Auger Electron Spectroscopy Overview
 Auger Electron Spectroscopy Overview Also known as: AES, Auger, SAM 1 Auger Electron Spectroscopy E KLL = E K - E L - E L AES Spectra of Cu EdN(E)/dE Auger Electron E N(E) x 5 E KLL Cu MNN Cu LMM E f E
CALCULATION OF THE DETECTOR-CONTRIBUTION TO ZIRCONIUM PEAKS IN EDXRF SPECTRA OBTAINED WITH A SI-DRIFT DETECTOR
 CALCULATION OF THE DETECTOR-CONTRIBUTION TO ZIRCONIUM PEAKS IN EDXRF SPECTRA OBTAINED WITH A SI-DRIFT DETECTOR A. C. Neiva 1, J. N. Dron 1, L. B. Lopes 1 1 Escola Politécnica da Universidade de São Paulo
Electron Probe Microanalysis (EPMA)
") Electron Probe Microanalysis (EPMA) By John J. Donovan (portions from J. I. Goldstein, D. E. Newbury, P. Echlin, D. C. Joy, C. Fiori, E. Lifshin, "Scanning Electron Microscopy and X-Ray Microanalysis",
Electron Probe Microanalysis (EPMA) By John J. Donovan (portions from J. I. Goldstein, D. E. Newbury, P. Echlin, D. C. Joy, C. Fiori, E. Lifshin, "Scanning Electron Microscopy and X-Ray Microanalysis",
Radiation interaction with matter and energy dispersive x-ray fluorescence analysis (EDXRF)
") Radiation interaction with matter and energy dispersive x-ray fluorescence analysis (EDXRF) Giancarlo Pepponi Fondazione Bruno Kessler MNF Micro Nano Facility pepponi@fbk.eu MAUD school 2017 Caen, France
Radiation interaction with matter and energy dispersive x-ray fluorescence analysis (EDXRF) Giancarlo Pepponi Fondazione Bruno Kessler MNF Micro Nano Facility pepponi@fbk.eu MAUD school 2017 Caen, France
Auger Electron Spectroscopy (AES) Prof. Paul K. Chu
 Prof. Paul K. Chu") Auger Electron Spectroscopy (AES) Prof. Paul K. Chu Auger Electron Spectroscopy Introduction Principles Instrumentation Qualitative analysis Quantitative analysis Depth profiling Mapping Examples The Auger
Auger Electron Spectroscopy (AES) Prof. Paul K. Chu Auger Electron Spectroscopy Introduction Principles Instrumentation Qualitative analysis Quantitative analysis Depth profiling Mapping Examples The Auger
Electron Microprobe Analysis and Scanning Electron Microscopy
 Electron Microprobe Analysis and Scanning Electron Microscopy Electron microprobe analysis (EMPA) Analytical technique in which a beam of electrons is focused on a sample surface, producing X-rays from
Diffraction: spreading of waves around obstacles (EM waves, matter, or sound) Interference: the interaction of waves
 Interference: the interaction of waves") Diffraction & Interference Diffraction: spreading of waves around obstacles (EM waves, matter, or sound) Interference: the interaction of waves Diffraction in Nature What is Interference? The resultant
Diffraction & Interference Diffraction: spreading of waves around obstacles (EM waves, matter, or sound) Interference: the interaction of waves Diffraction in Nature What is Interference? The resultant
LAB 01 X-RAY EMISSION & ABSORPTION
 LAB 0 X-RAY EMISSION & ABSORPTION REPORT BY: TEAM MEMBER NAME: Ashley Tsai LAB SECTION No. 05 GROUP 2 EXPERIMENT DATE: Feb., 204 SUBMISSION DATE: Feb. 8, 204 Page of 3 ABSTRACT The goal of this experiment
BENEFITS OF IMPROVED RESOLUTION FOR EDXRF
 135 Abstract BENEFITS OF IMPROVED RESOLUTION FOR EDXRF R. Redus 1, T. Pantazis 1, J. Pantazis 1, A. Huber 1, B. Cross 2 1 Amptek, Inc., 14 DeAngelo Dr, Bedford MA 01730, 781-275-2242, www.amptek.com 2
Transmission Electron Microscopy
 L. Reimer H. Kohl Transmission Electron Microscopy Physics of Image Formation Fifth Edition el Springer Contents 1 Introduction... 1 1.1 Transmission Electron Microscopy... 1 1.1.1 Conventional Transmission
X-Ray Photoelectron Spectroscopy (XPS) Auger Electron Spectroscopy (AES)
 Auger Electron Spectroscopy (AES)") X-Ray Photoelectron Spectroscopy (XPS) Auger Electron Spectroscopy (AES) XPS X-ray photoelectron spectroscopy (XPS) is one of the most used techniques to chemically characterize the surface. Also known
X-Ray Photoelectron Spectroscopy (XPS) Auger Electron Spectroscopy (AES) XPS X-ray photoelectron spectroscopy (XPS) is one of the most used techniques to chemically characterize the surface. Also known
XRF books: Analytical Chemistry, Kellner/Mermet/Otto/etc. 3 rd year XRF Spectroscopy Dr. Alan Ryder (R222, Physical Chemistry) 2 lectures:
 2 lectures:") 1 3 rd year XRF Spectroscopy Dr. Alan Ryder (R222, Physical Chemistry) 2 lectures: XRF spectroscopy 1 exam question. Notes on: www.nuigalway.ie/nanoscale/3rdspectroscopy.html XRF books: Analytical Chemistry,
1 3 rd year XRF Spectroscopy Dr. Alan Ryder (R222, Physical Chemistry) 2 lectures: XRF spectroscopy 1 exam question. Notes on: www.nuigalway.ie/nanoscale/3rdspectroscopy.html XRF books: Analytical Chemistry,
FUNDAMENTAL PARAMETER METHOD FOR THE LOW ENERGY REGION INCLUDING CASCADE EFFECT AND PHOTOELECTRON EXCITATION
 Copyright (c)jcpds-international Centre for Diffraction Data 2002, Advances in X-ray Analysis, Volume 45. 511 FUNDAMENTAL PARAMETER METHOD FOR THE LOW ENERGY REGION INCLUDING CASCADE EFFECT AND PHOTOELECTRON
Electron and electromagnetic radiation
 Electron and electromagnetic radiation Generation and interactions with matter Stimuli Interaction with sample Response Stimuli Waves and energy The energy is propotional to 1/λ and 1/λ 2 λ λ 1 Electromagnetic
X-Ray Emission and Absorption
 X-Ray Emission and Absorption Author: Mike Nill Alex Bryant February 6, 20 Abstract X-rays were produced by two bench-top diffractometers using a copper target. Various nickel filters were placed in front
X-ray Microanalysis in Nanomaterials
 3 X-ray Microanalysis in Nanomaterials Robert Anderhalt 1. Introduction Traditionally, energy dispersive x-ray spectroscopy (EDS) in the scanning electron microscope (SEM) has been called microanalysis,
- Light has properties of WAVES such as DIFFRACTION (it bends around small obstructions).
.") 170 LIGHT wavelength Diffraction frequency = wavelengths / time = - Light has properties of WAVES such as DIFFRACTION (it bends around small obstructions). - Einstein noted that viewing light as a particle
170 LIGHT wavelength Diffraction frequency = wavelengths / time = - Light has properties of WAVES such as DIFFRACTION (it bends around small obstructions). - Einstein noted that viewing light as a particle
Developments & Limitations in GSR Analysis
 Developments & Limitations in GSR Analysis ENFSI Working Group Meeting June 2006 Jenny Goulden Oxford Instruments NanoAnalysis Overview Introduction Developments in GSR Software Importance of EDS Hardware
Quantitative XRF Analysis. algorithms and their practical use
 Joint ICTP-IAEA School on Novel Experimental Methodologies for Synchrotron Radiation Applications in Nano-science and Environmental Monitoring Quantitative XRF Analysis algorithms and their practical use
Summer Students lectures
 Summer Students lectures XRF: X-ray fluorescence spectrometry Matthias Alfeld XRF: X-ray fluorescence spectrometry Hamburg, 13.08.13 > What is XRF? X-Ray Fluorescence spectrometry > What can it do? Detect
Particle Behavior of Light 1. Calculate the energy of a photon, mole of photons 2. Find binding energy of an electron (know KE) 3. What is a quanta?
 3. What is a quanta?") Properties of Electromagnetic Radiation 1. What is spectroscopy, a continuous spectrum, a line spectrum, differences and similarities 2. Relationship of wavelength to frequency, relationship of E to λ
Properties of Electromagnetic Radiation 1. What is spectroscopy, a continuous spectrum, a line spectrum, differences and similarities 2. Relationship of wavelength to frequency, relationship of E to λ
Peter L Warren, Pamela Y Shadforth ICI Technology, Wilton, Middlesbrough, U.K.
 783 SCOPE AND LIMITATIONS XRF ANALYSIS FOR SEMI-QUANTITATIVE Introduction Peter L Warren, Pamela Y Shadforth ICI Technology, Wilton, Middlesbrough, U.K. Historically x-ray fluorescence spectrometry has
X-RAY SPECTRA. Theory:
 12 Oct 18 X-ray.1 X-RAY SPECTRA In this experiment, a number of measurements involving x-rays will be made. The spectrum of x-rays emitted from a molybdenum target will be measured, and the experimental
Lecture 5. X-ray Photoemission Spectroscopy (XPS)
") Lecture 5 X-ray Photoemission Spectroscopy (XPS) 5. Photoemission Spectroscopy (XPS) 5. Principles 5.2 Interpretation 5.3 Instrumentation 5.4 XPS vs UV Photoelectron Spectroscopy (UPS) 5.5 Auger Electron
Lecture 5 X-ray Photoemission Spectroscopy (XPS) 5. Photoemission Spectroscopy (XPS) 5. Principles 5.2 Interpretation 5.3 Instrumentation 5.4 XPS vs UV Photoelectron Spectroscopy (UPS) 5.5 Auger Electron
Altitude influence of elemental distribution in grass from Rila mountain. Dr. E. Nikolova, Dr. A. Artinyan, S. Nikolova INRNE - BAS XRF Laboratory
 Altitude influence of elemental distribution in grass from Rila mountain Dr. E. Nikolova, Dr. A. Artinyan, S. Nikolova INRNE - BAS XRF Laboratory I. Introduction The application of modern instrumental
RADIOACTIVE SAMPLE EFFECTS ON EDXRF SPECTRA
 90 RADIOACTIVE SAMPLE EFFECTS ON EDXRF SPECTRA Christopher G. Worley Los Alamos National Laboratory, MS G740, Los Alamos, NM 87545 ABSTRACT Energy dispersive X-ray fluorescence (EDXRF) is a rapid, straightforward
X-ray Absorption and Emission Prepared By Jose Hodak for BSAC program 2008
 X-ray Absorption and Emission Prepared By Jose Hodak for BSAC program 2008 1- A bit of History: Wilhelm Conrad Röntgen discovered 1895 the X-rays. 1901 he was honored by the Noble prize for physics. In
CHARACTERIZATION of NANOMATERIALS KHP
 CHARACTERIZATION of NANOMATERIALS Overview of the most common nanocharacterization techniques MAIN CHARACTERIZATION TECHNIQUES: 1.Transmission Electron Microscope (TEM) 2. Scanning Electron Microscope
B. X : in phase; Y: out of phase C. X : out of phase; Y: in phase D. X : out of phase; Y: out of phase
 2015 April 24 Exam 3 Physics 106 Circle the letter of the single best answer. Each question is worth 1 point Physical Constants: proton charge = e = 1.60 10 19 C proton mass = m p = 1.67 10 27 kg electron
X-ray spectroscopy: Experimental studies of Moseley s law (K-line x-ray fluorescence) and x-ray material s composition determination
 and x-ray material s composition determination") Uppsala University Department of Physics and Astronomy Laboratory exercise X-ray spectroscopy: Experimental studies of Moseley s law (K-line x-ray fluorescence) and x-ray material s composition determination
Uppsala University Department of Physics and Astronomy Laboratory exercise X-ray spectroscopy: Experimental studies of Moseley s law (K-line x-ray fluorescence) and x-ray material s composition determination
Section 11: Electron Configuration and Periodic Trends
 Section 11: Electron Configuration and Periodic Trends The following maps the videos in this section to the Texas Essential Knowledge and Skills for Science TAC 112.35(c). 11.01 The Bohr Model of the Atom
Determination of the activity of radionuclides
 BUREAU NATIONAL DE MÉTROLOGIE COMMISSARIAT À L'ÉNERGIE ATOMIQUE LABORATOIRE NATIONAL HENRI BECQUEREL Note technique LNHB/04-33 Determination of the activity of radionuclides contained in volume samples
Exploiting the Speed of the Silicon Drift Detector to Open New Measurement Opportunities in Particle Analysis. Dale E. Newbury
 Exploiting the Speed of the Silicon Drift Detector to Open New Measurement Opportunities in Particle Analysis Dale E. Newbury National Institute of Standards and Technology Gaithersburg, MD 20899-8370
Detecting high energy photons. Interactions of photons with matter Properties of detectors (with examples)
") Detecting high energy photons Interactions of photons with matter Properties of detectors (with examples) Interactions of high energy photons with matter Cross section/attenution length/optical depth Photoelectric
Detecting high energy photons Interactions of photons with matter Properties of detectors (with examples) Interactions of high energy photons with matter Cross section/attenution length/optical depth Photoelectric
Electron Microscopy I
 Characterization of Catalysts and Surfaces Characterization Techniques in Heterogeneous Catalysis Electron Microscopy I Introduction Properties of electrons Electron-matter interactions and their applications
X-RAY SCATTERING AND MOSELEY S LAW. OBJECTIVE: To investigate Moseley s law using X-ray absorption and to observe X- ray scattering.
 X-RAY SCATTERING AND MOSELEY S LAW OBJECTIVE: To investigate Moseley s law using X-ray absorption and to observe X- ray scattering. READING: Krane, Section 8.5. BACKGROUND: In 1913, Henry Moseley measured
Reference literature. (See: CHEM 2470 notes, Module 8 Textbook 6th ed., Chapters )
") September 17, 2018 Reference literature (See: CHEM 2470 notes, Module 8 Textbook 6th ed., Chapters 13-14 ) Reference.: https://slideplayer.com/slide/8354408/ Spectroscopy Usual Wavelength Type of Quantum
September 17, 2018 Reference literature (See: CHEM 2470 notes, Module 8 Textbook 6th ed., Chapters 13-14 ) Reference.: https://slideplayer.com/slide/8354408/ Spectroscopy Usual Wavelength Type of Quantum
Modern Optical Spectroscopy
 Modern Optical Spectroscopy X-Ray Microanalysis Shu-Ping Lin, Ph.D. Institute of Biomedical Engineering E-mail: splin@dragon.nchu.edu.tw Website: http://web.nchu.edu.tw/pweb/users/splin/ Backscattered
Chapter 9. Electron mean free path Microscopy principles of SEM, TEM, LEEM
 Chapter 9 Electron mean free path Microscopy principles of SEM, TEM, LEEM 9.1 Electron Mean Free Path 9. Scanning Electron Microscopy (SEM) -SEM design; Secondary electron imaging; Backscattered electron
X-ray Energy Spectroscopy (XES).
.") X-ray Energy Spectroscopy (XES). X-ray fluorescence as an analytical tool for element analysis is based on 3 fundamental parameters: A. Specificity: In determining an x-ray emission energy E certainty
X-ray Energy Spectroscopy (XES). X-ray fluorescence as an analytical tool for element analysis is based on 3 fundamental parameters: A. Specificity: In determining an x-ray emission energy E certainty
Scanning electron microscopy
 Scanning electron microscopy Fei Quanta Tabletop Hitachi Example: Tin soldier Pb M Sn L Secondary electrons Backscatter electrons EDS analysis Average composition Learning goals: Understanding the principle
Gaetano L Episcopo. Scanning Electron Microscopy Focus Ion Beam and. Pulsed Plasma Deposition
 Gaetano L Episcopo Scanning Electron Microscopy Focus Ion Beam and Pulsed Plasma Deposition Hystorical background Scientific discoveries 1897: J. Thomson discovers the electron. 1924: L. de Broglie propose
Quality Assurance. Purity control. Polycrystalline Ingots
 Quality Assurance Purity control Polycrystalline Ingots 1 Gamma Spectrometry Nuclide Identification Detection of Impurity Traces 1.1 Nuclides Notation: Atomic Mass Atomic Number Element Neutron Atomic
ABC s of Electrochemistry series Materials Characterization techniques: SEM and EDS Ana María Valenzuela-Muñiz November 3, 2011
 ABC s of Electrochemistry series Materials Characterization techniques: SEM and EDS Ana María Valenzuela-Muñiz November 3, 2011 CEER, Department of Chemical and Biomolecular Engineering Outline Introduction
Advanced Lab Course. X-Ray Photoelectron Spectroscopy 1 INTRODUCTION 1 2 BASICS 1 3 EXPERIMENT Qualitative analysis Chemical Shifts 7
 Advanced Lab Course X-Ray Photoelectron Spectroscopy M210 As of: 2015-04-01 Aim: Chemical analysis of surfaces. Content 1 INTRODUCTION 1 2 BASICS 1 3 EXPERIMENT 3 3.1 Qualitative analysis 6 3.2 Chemical
Portable type TXRF analyzer: Ourstex 200TX
 Excerpted from Adv. X-Ray. Chem. Anal., Japan: 42, pp. 115-123 (2011) H. Nagai, Y. Nakajima, S. Kunimura, J. Kawai Improvement in Sensitivity and Quantification by Using a Portable Total Reflection X-Ray
- Why are phase labels required? Because phase changes either absorb or release energy. ... what does this mean?
 157 SINCE the enthalpy change does NOT depend on path, this means that we can use standard values for enthalpy to predict the heat change in reactions that we have not tested in a calorimeter. THERMOCHEMICAL
How many grams of sodium metal is required to completely react with 2545 grams of chlorine gas?
 146 EXAMPLE PROBLEM: How many grams of sodium metal is required to completely react with 2545 grams of chlorine gas? 1 - Convert 2545 grams of chlorine gas to moles. Use formula weight. 2 - Convert moles
Photoemission Spectroscopy
 FY13 Experimental Physics - Auger Electron Spectroscopy Photoemission Spectroscopy Supervisor: Per Morgen SDU, Institute of Physics Campusvej 55 DK - 5250 Odense S Ulrik Robenhagen,
hν' Φ e - Gamma spectroscopy - Prelab questions 1. What characteristics distinguish x-rays from gamma rays? Is either more intrinsically dangerous?
 Gamma spectroscopy - Prelab questions 1. What characteristics distinguish x-rays from gamma rays? Is either more intrinsically dangerous? 2. Briefly discuss dead time in a detector. What factors are important
Detection and measurement of gamma-radiation by gammaspectroscopy
 Detection and measurement of gamma-radiation by gammaspectroscopy Gamma-radiation is electromagnetic radiation having speed equal to the light in vacuum. As reaching a matter it interact with the different
How many grams of sodium metal is required to completely react with 2545 grams of chlorine gas?
 EXAMPLE PROBLEM: How many grams of sodium metal is required to completely react with 2545 grams of chlorine gas? 1 - Convert 2545 grams of chlorine to moles chlorine using formula weight 2 - Convert moles
Second Edition. John J. Friel
 Second Edition John J. Friel Library of Congress Cataloging-in-Publication Data X-ray and image analysis in electron microscopy/ John J. Friel. 98 p. 22 cm. Includes bibliographical references and index.
Information on the test material EDS-TM002 and the BAM software package EDX Spectrometer Test for determination of the spectrometer performance
 BAM 6.8 8.5.213 Information on the test material EDS-TM2 and the BAM software package EDX Spectrometer Test for determination of the spectrometer performance 1. Introduction Energy dispersive spectrometers
Spectroscopy on Mars!
 Spectroscopy on Mars! Pathfinder Spirit and Opportunity Real World Friday H2A The Mars Pathfinder: Geological Elemental Analysis On December 4th, 1996, the Mars Pathfinder was launched from earth to begin
Geology 777 Monte Carlo Exercise I
 Geology 777 Monte Carlo Exercise I Purpose The goal of this exercise is to get you to think like an electron... to start to think about where electrons from the stream of high energy electrons go when
Unit 7. Atomic Structure
 Unit 7. Atomic Structure Upon successful completion of this unit, the students should be able to: 7.1 List the eight regions of the electromagnetic spectrum in the designated order and perform calculations
Speciation of Individual Mineral Particles of Micrometer Size by the Combined Use of ATR-FT-IR Imaging and Quantitative ED-EPMA Techniques
 Speciation of Individual Mineral Particles of Micrometer Size by the ombined Use of ATR-FT-IR Imaging and Quantitative ED-EPMA Techniques Md Abdul Malek, Hae-Jin Jung, JiYeon Ryu, BoHwa Kim, Young-hul
8. Which of the following could be an isotope of chlorine? (A) 37 Cl 17 (B) 17 Cl 17 (C) 37 Cl 17 (D) 17 Cl 37.5 (E) 17 Cl 37
 37 Cl 17 (B) 17 Cl 17 (C) 37 Cl 17 (D) 17 Cl 37.5 (E) 17 Cl 37") Electronic Structure Worksheet 1 Given the following list of atomic and ionic species, find the appropriate match for questions 1-4. (A) Fe 2+ (B) Cl (C) K + (D) Cs (E) Hg + 1. Has the electron configuration:
Electronic Structure Worksheet 1 Given the following list of atomic and ionic species, find the appropriate match for questions 1-4. (A) Fe 2+ (B) Cl (C) K + (D) Cs (E) Hg + 1. Has the electron configuration:
Atomic Physics. Chapter 6 X ray. Jinniu Hu 24/12/ /20/13
 Atomic Physics Chapter 6 X ray 11/20/13 24/12/2018 Jinniu Hu 1!1 6.1 The discovery of X ray X-rays were discovered in 1895 by the German physicist Wilhelm Roentgen. He found that a beam of high-speed electrons
Advanced Spectroscopy Laboratory
 Advanced Spectroscopy Laboratory - Raman Spectroscopy - Emission Spectroscopy - Absorption Spectroscopy - Raman Microscopy - Hyperspectral Imaging Spectroscopy FERGIELAB TM Raman Spectroscopy Absorption
OES - Optical Emission Spectrometer 2000
 OES - Optical Emission Spectrometer 2000 OES-2000 is used to detect the presence of trace metals in an analyte. The analyte sample is introduced into the OES-2000 as an aerosol that is carried into the