Analyzing Long-Term Drought Effects on Land Surface Temperature and Vegetation Using National Oceanic Atmospheric Administration Satellite s Data
|
|
|
- Pierce Maxwell
- 5 years ago
- Views:
Transcription

1 Analyzing Long-Term Drought Effects on Land Surface Temperature and Vegetation Using National Oceanic Atmospheric Administration Satellite s Data Cornelius Holmes, Derek Morris Jr. S
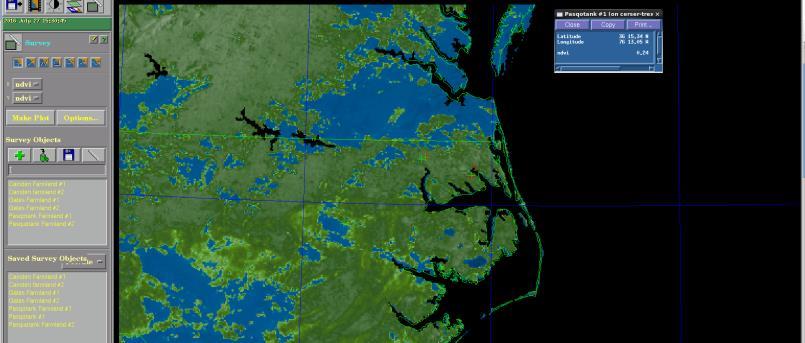
2 Abstract Analyzing the effects of Drought in the Northeastern North Carolina area with NOAA satellite products to determine a correlation between Land Surface Temperature and Vegetation. The Palmer Drought Severity Index (PDSI) data sets for summer , provided by the State Climate Office of North Carolina NC CRONOS database, provided evidence that since 2007 the northern coastal plain of North Carolina has been experiencing a long-term summer drought. Summer is defined as the months between late June to late September. Utilizing Elizabeth City State University s (ECSU) 1.5m L-band SeaSpace ground station the team received live Advanced Very High Resolution Radiometer (AVHRR) imagery from NOAA polar orbiting satellites each day for the month of June. The primary goal of this research was to observe the correlation between land surface temperature (LST) and Normalized Difference Vegetation Index (NDVI) due to long-term drought using NOAA satellite data. In the month of June 2016, the team collected imagery data through the SeaSpace TeraScan system and produced LST and NDVI. Various GPS locations were selected in Northeastern North Carolina of different biomes such as swamp lands, grasslands, and farmlands. The team collected and utilized data in the areas of Camden County, Gates County, Pasquotank County, and Perquimans County. Using the SeaSpace Graphical User Interface (GUI) Teravision, The data points of each product at the various biome locations were analyzed for daily and weekly averages. Using the GPS locations found in United States Geological Survey (USGS) of the swamps lands, grasslands, and farmlands were entered and saved as survey points in TeraVision s GUI. All of the passes in the month of June that were received and processed into LST and NDVI products at the direct broadcast ground station at ECSU were loaded into TeraVision. The values were then extracted from each of the points and evaluated by their biome specific location for LST and NDVI. With Excel the team conducted analysis for daily trends, regional trends, biome trends, and weekly trends.


3 Team Members S Cornelius Holness Derek Morris Jr.

4 Overview S S S S S S S S Objective Purpose NOAA Satellites TeraScan at ECSU/TeraVision Methodology Analysis Results Future Work
5 Objective S The primary goal of this research was to observe the correlation between land surface temperature (LST) and Normalized Difference Vegetation Index (NDVI) due to long-term drought using NOAA satellite data.
6 Purpose


7 Biomes S Grassland S Farmland S Swamps

8 NOAA Satellites S NOAA S NOAA-15, 18, 19 S Polar Orbiting

9 TeraScan at ECSU S Combination of hardware and software designed for automated reception of data from meteorological and environmental satellites S 1.5 meter L-Band receiving station was install in 2002 S Major update in 2014 S TREX-processor S Teravault-storage

10 TeraVision S GUI used to manipulate any information

11 Methodology S GPS Coordinates:.Lat: 36 19' 34" N, Lon: ' 47" W Farmland decimal: Lat
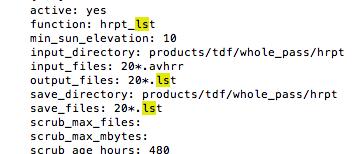
12 Scripts/Products

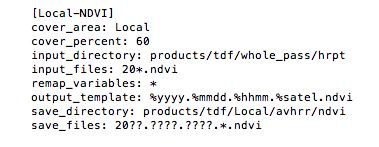
13 Scripts/Cover Area

14 Archives

15

16 TeraScan

17
18

19
20 Results
21 Analysis S Pasquotank County grassland NDVI and LST graphs S Farmland biomes vegetation an LST S County averages of LST
22 Future Work S Find an alternative way to automate the data points using Python programming software.
23 Acknowledgements S Dr. Linda Hayden for the research opportunity that was made possible through the CERSER program. S Mr. Andrew Brumfield for his guidance, contributions, and help with completing this research.
24 Questions?
Ganbat.B, Agro meteorology Section
 NATIONAL AGENCY FOR METEOROLOGY, HYDROLOGY AND ENVIRONMENT MONITORING OF MONGOLIA Ganbat.B, Agro meteorology Section OF INSTITUTE OF METEOROLOGY AND HYDROLOGY 2009 YEAR Location Climate Northern Asia,
Direct Readout at the Meteorological Service of Canada
 Direct Readout at the Meteorological Service of Canada CSPP Users Meeting 2015 Darmstadt, Germany April 14-16, 2015 David Bradley Manager, Earth Observation and Geomatics Meteorological Service of Canada
Drought and Climate Extremes Indices for the North American Drought Monitor and North America Climate Extremes Monitoring System. Richard R. Heim Jr.
 Drought and Climate Extremes Indices for the North American Drought Monitor and North America Climate Extremes Monitoring System Richard R. Heim Jr. NOAA/NESDIS/National Climatic Data Center Asheville,
DRARS Coordination Meeting Contribution from IMD
 DRARS Coordination Meeting Contribution from IMD Dr. Ashim Kumar Mitra Ministry of Earth Sciences India Meteorological Department New Delhi-INDIA 11-13 March 2015 The Processing System of NOAA/METOP/MODIS
NADM, NACEM, and Opportunities for Future Collaboration
 NADM, NACEM, and Opportunities for Future Collaboration Richard R. Heim Jr. NOAA/NESDIS/National Climatic Data Center Asheville, North Carolina, U.S.A. 4th Annual DRI Workshop 26-28 January 2009, Regina,
Climate Change and Vegetation Phenology
 Climate Change and Vegetation Phenology Climate Change In the Northeastern US mean annual temperature increased 0.7 C over 30 years (0.26 C per decade) Expected another 2-6 C over next century (Ollinger,
The MRCC and Monitoring Drought in the Midwest
 The and Monitoring Drought in the Midwest Steve Hilberg Director, Illinois State Water Survey Prairie Research Institute, University of Illinois The A partner of a national climate service program that
The use of satellite images to forecast agricultural production
 The use of satellite images to forecast agricultural production Artur Łączyński Central Statistical Office, Agriculture Department Niepodległości 208 Warsaw, Poland E-mail a.laczynski@stat.gov.pl DOI:
Regional Drought Decision Support System (RDDSS) Project Update and Product Concepts
 Project Update and Product Concepts") Regional Drought Decision Support System (RDDSS) Project Update and Product Concepts Part of the Red River Basin Decision Information Network (RRBDIN) NEXT-GEN RRBDIN Decision Support for the Red River
Regional Drought Decision Support System (RDDSS) Project Update and Product Concepts Part of the Red River Basin Decision Information Network (RRBDIN) NEXT-GEN RRBDIN Decision Support for the Red River
SWAMP GIS: A spatial decision support system for predicting and treating stormwater runoff. Michael G. Wing 1 * and Derek Godwin
 Journal of Spatial Hydrology Vol. 11, No. 2 Fall 2011 SWAMP GIS: A spatial decision support system for predicting and treating stormwater runoff Michael G. Wing 1 * and Derek Godwin Abstract SWAMP GIS
Monthly Overview. Rainfall
 Monthly Overview Rainfall during August occurred mainly over the Western and Eastern Cape provinces, and KwaZulu- Natal. Rain in these provinces were regularly accompanied by cold fronts as they made landfall
Jay Lawrimore NOAA National Climatic Data Center 9 October 2013
 Jay Lawrimore NOAA National Climatic Data Center 9 October 2013 Daily data GHCN-Daily as the GSN Archive Monthly data GHCN-Monthly and CLIMAT messages International Surface Temperature Initiative Global
Validation of the Antarctic Snow Accumulation and Ice Discharge Basal Stress Boundary of the Southeastern Region of the Ross Ice Shelf, Antarctica
 Validation of the Antarctic Snow Accumulation and Ice Discharge Basal Stress Boundary of the Southeastern Region of the Ross Ice Shelf, Antarctica TEAM MEMBERS Ayanna Overton, junior Charlie Nelson, senior
Multi-scale Remote Assessment of Land-surface Hydrologic Response to Stress
 Multi-scale Remote Assessment of Land-surface Hydrologic Response to Stress M.C. Anderson J.M. Norman U Wisconsin-Madison W.P. Kustas USDA-ARS, HRSL T.P. Meyers NOAA-ATDD J.M. Jacobs U New Hampshire NASA
National Report on Weather Forecasting Service
 MINISTRY OF WATER RESOURCES AND METEOROLOGY DEPARTMENT OF METEOROLOGY, CAMBODIA National Report on Weather Forecasting Service Tokyo, 11-15 March 2014 Department of Meteorology, Cambodia Presentation Outline
USGS/EROS Accomplishments and Year 3 Plans. Enhancement of the U.S. Drought Monit Through the Integration of NASA Vegetation Index Imagery
 USGS/EROS Accomplishments and Year 3 Plans Enhancement of the U.S. Drought Monit Through the Integration of NASA Vegetation Index Imagery Jesslyn Brown Team Meeting, Austin, TX, 10/6/09 U.S. Department
Climate Prediction Center National Centers for Environmental Prediction
 NOAA s Climate Prediction Center Climate Monitoring Tool Wassila M. Thiaw and CPC International Team Climate Prediction Center National Centers for Environmental Prediction CPC International Team Vadlamani
B.2 Sources for Hazard Identification, Profiling, and Ranking (Section 3) Overview of Sussex County s History of Hazards
 Overview of Sussex County s History of Hazards") Appendix B Sources B.1 Sources for Planning Process (Section 2) FEMA. Mitigation Planning Guidance (386 Series). Available on the web at: http://www.fema.gov/plan/mitplanning/planning_resources.shtm FEMA
Appendix B Sources B.1 Sources for Planning Process (Section 2) FEMA. Mitigation Planning Guidance (386 Series). Available on the web at: http://www.fema.gov/plan/mitplanning/planning_resources.shtm FEMA
NIDIS Intermountain West Drought Early Warning System August 8, 2017
 NIDIS Drought and Water Assessment 8/8/17, 4:43 PM NIDIS Intermountain West Drought Early Warning System August 8, 2017 Precipitation The images above use daily precipitation statistics from NWS COOP,
Flux Tower Data Quality Analysis. Dea Doklestic
 Flux Tower Data Quality Analysis Dea Doklestic Motivation North American Monsoon (NAM) Seasonal large scale reversal of atmospheric circulation Occurs during the summer months due to a large temperature
Deke Arndt, Chief, Climate Monitoring Branch, NOAA s National Climatic Data Center
 Thomas R. Karl, L.H.D., Director, NOAA s National Climatic Data Center, and Chair of the Subcommittee on Global Change Research Peter Thorne, PhD, Senior Scientist, Cooperative Institute for Climate and
Drought Estimation Maps by Means of Multidate Landsat Fused Images
 Remote Sensing for Science, Education, Rainer Reuter (Editor) and Natural and Cultural Heritage EARSeL, 2010 Drought Estimation Maps by Means of Multidate Landsat Fused Images Diego RENZA, Estíbaliz MARTINEZ,
NIDIS Intermountain West Drought Early Warning System November 21, 2017
 NIDIS Drought and Water Assessment NIDIS Intermountain West Drought Early Warning System November 21, 2017 Precipitation The images above use daily precipitation statistics from NWS COOP, CoCoRaHS, and
Mapping rainfall and flooding
 Mapping rainfall and flooding BY DAVID WALBERT Although Hurricane Floyd was the biggest storm of 1999 and the one most remembered, eastern North Carolina was hit by three hurricanes in a six-week period
C1: From Weather to Climate Looking at Air Temperature Data
 C1: From Weather to Climate Looking at Air Temperature Data Purpose Students will work with short- and longterm air temperature data in order to better understand the differences between weather and climate.
NIDIS Intermountain West Drought Early Warning System November 13, 2018
 NIDIS Intermountain West Drought Early Warning System November 13, 2018 Precipitation The images above use daily precipitation statistics from NWS COOP, CoCoRaHS, and CoAgMet stations. From top to bottom,
5.2. IDENTIFICATION OF NATURAL HAZARDS OF CONCERN
 5.2. IDENTIFICATION OF NATURAL HAZARDS OF CONCERN To provide a strong foundation for mitigation strategies considered in Sections 6 and 9, County considered a full range of natural hazards that could impact
Climpact2 and PRECIS
 Climpact2 and PRECIS WMO Workshop on Enhancing Climate Indices for Sector-specific Applications in the South Asia region Indian Institute of Tropical Meteorology Pune, India, 3-7 October 2016 David Hein-Griggs
Precipitation. Standardized Precipitation Index. NIDIS Intermountain West Drought Early Warning System September 5, 2017
 9/6/2017 NIDIS Drought and Water Assessment NIDIS Intermountain West Drought Early Warning System September 5, 2017 Precipitation The images above use daily precipitation statistics from NWS COOP, CoCoRaHS,
P1.34 MULTISEASONALVALIDATION OF GOES-BASED INSOLATION ESTIMATES. Jason A. Otkin*, Martha C. Anderson*, and John R. Mecikalski #
 P1.34 MULTISEASONALVALIDATION OF GOES-BASED INSOLATION ESTIMATES Jason A. Otkin*, Martha C. Anderson*, and John R. Mecikalski # *Cooperative Institute for Meteorological Satellite Studies, University of
Display and analysis of weather data from NCDC using ArcGIS
 Display and analysis of weather data from NCDC using ArcGIS Helen M. Cox Associate Professor Geography Department California State University, Northridge and Stephen Krug Graduate Student Geography Department
Examples of How Aerial Imagery Is Used in North Carolina. October 2007
 Examples of How Aerial Imagery Is Used in North Carolina October 2007 Table of Contributors Asheville Stormwater Utility Billing Camden County Tracking Permit Violations on Land Clearings CGIA Delineating
Assessing Drought in Agricultural Area of central U.S. with the MODIS sensor
 Assessing Drought in Agricultural Area of central U.S. with the MODIS sensor Di Wu George Mason University Oct 17 th, 2012 Introduction: Drought is one of the major natural hazards which has devastating
Harrison 1. Identifying Wetlands by GIS Software Submitted July 30, ,470 words By Catherine Harrison University of Virginia
 Harrison 1 Identifying Wetlands by GIS Software Submitted July 30, 2015 4,470 words By Catherine Harrison University of Virginia cch2fy@virginia.edu Harrison 2 ABSTRACT The Virginia Department of Transportation
High Resolution Indicators for Local Drought Monitoring
 High Resolution Indicators for Local Drought Monitoring REBECCA CUMBIE, STATE CLIMATE OFFICE OF NC, NCSU Monitoring Drought Multiple indicators, multiple sources Local detail important 1 Point-Based Climate-Division
The Delaware Environmental Monitoring & Analysis Center
 The Delaware Environmental Monitoring & Analysis Center Tina Callahan Delaware Estuary Science & Environmental Summit 2013 January 27-30, 2013 What is DEMAC? Delaware Environmental Monitoring & Analysis
Weather and climate outlooks for crop estimates
 Weather and climate outlooks for crop estimates CELC meeting 2016-04-21 ARC ISCW Observed weather data Modeled weather data Short-range forecasts Seasonal forecasts Climate change scenario data Introduction
NIDIS Intermountain West Drought Early Warning System November 14, 2017
 NIDIS Intermountain West Drought Early Warning System November 14, 2017 Precipitation The images above use daily precipitation statistics from NWS COOP, CoCoRaHS, and CoAgMet stations. From top to bottom,
A Cotton Irrigator s Decision Support System Using National, Regional and Local Data
 A Cotton Irrigator s Decision Support System Using National, Regional and Local Data ISESS 2015, Melbourne Jamie Vleeshouwer, Nicholas J. Car, John Hornbuckle 26 March 2015 LAND & WATER FLAGSHIP / AGRICULTURE
Remote Sensing Geographic Information Systems Global Positioning Systems
 Remote Sensing Geographic Information Systems Global Positioning Systems Assessing Seasonal Vegetation Response to Drought Lei Ji Department of Geography University of Nebraska-Lincoln AVHRR-NDVI: July
Effect of land use/land cover changes on runoff in a river basin: a case study
 Water Resources Management VI 139 Effect of land use/land cover changes on runoff in a river basin: a case study J. Letha, B. Thulasidharan Nair & B. Amruth Chand College of Engineering, Trivandrum, Kerala,
NIDIS Intermountain West Drought Early Warning System January 22, 2019
 NIDIS Drought and Water Assessment NIDIS Intermountain West Drought Early Warning System January 22, 2019 Precipitation The images above use daily precipitation statistics from NWS COOP, CoCoRaHS, and
NIDIS Intermountain West Drought Early Warning System February 12, 2019
 NIDIS Intermountain West Drought Early Warning System February 12, 2019 Precipitation The images above use daily precipitation statistics from NWS COOP, CoCoRaHS, and CoAgMet stations. From top to bottom,
Meteorological Service of Canada Perspectives. WMO Coordination Group on Satellite Data Requirements for RAIII/IV
 Meteorological Service of Canada Perspectives presented to the WMO Coordination Group on Satellite Data Requirements for RAIII/IV David Bradley Meteorological Service of Canada Environment Canada April
Precipitation. Standardized Precipitation Index. NIDIS Intermountain West Regional Drought Early Warning System December 6, 2016
 12/9/2016 NIDIS Drought and Water Assessment NIDIS Intermountain West Regional Drought Early Warning System December 6, 2016 Precipitation The images above use daily precipitation statistics from NWS COOP,
Enhancement of the U.S. Drought Monitor Through the Integration of NASA Vegetation Index Imagery
 Enhancement of the U.S. Drought Monitor Through the Integration of NASA Vegetation Index Imagery Project and Related Activities at USGS/EROS Jim Verdin, Jesslyn Brown, Yingxin Gu, Gail Schmidt, Troy McVay
, ε TAWS TAWS, TS TAWS TAWS TB/TAWS AWS TAWS TAWS TAWS
 West Antarctic Ice Sheet Firn Temperature Record Continuity and Seasonal Trends: Implications for Determining Emissivity Trends from SSM/I Brightness Temperatures Jamika Baltrop, Brian Campbell, TreAsia
Sea Level Rise and Hurricane Florence storm surge research methodology
 Sea Level Rise and Hurricane Florence storm surge research methodology Hurricane Florence storm surge analysis was conducted using a variety of input sources. In order to determine the maximum storm surge
NIDIS Intermountain West Drought Early Warning System April 18, 2017
 1 of 11 4/18/2017 3:42 PM Precipitation NIDIS Intermountain West Drought Early Warning System April 18, 2017 The images above use daily precipitation statistics from NWS COOP, CoCoRaHS, and CoAgMet stations.
Introduction to Weather Data Cleaning
 Introduction to Weather Data Cleaning Speedwell Weather Limited An Introduction Providing weather services since 1999 Largest private-sector database of world-wide historic weather data Major provider
NIDIS Intermountain West Drought Early Warning System December 18, 2018
 NIDIS Intermountain West Drought Early Warning System December 18, 2018 Precipitation The images above use daily precipitation statistics from NWS COOP, CoCoRaHS, and CoAgMet stations. From top to bottom,
PICTURE OF THE MONTH. Satellite Imagery of Sea Surface Temperature Cooling in the Wake of Hurricane Edouard (1996)
") 2716 MONTHLY WEATHER REVIEW VOLUME 125 PICTURE OF THE MONTH Satellite Imagery of Sea Surface Temperature Cooling in the Wake of Hurricane Edouard (1996) FRANK M. MONALDO Applied Physics Laboratory, The
2716 MONTHLY WEATHER REVIEW VOLUME 125 PICTURE OF THE MONTH Satellite Imagery of Sea Surface Temperature Cooling in the Wake of Hurricane Edouard (1996) FRANK M. MONALDO Applied Physics Laboratory, The
Condensing Massive Satellite Datasets For Rapid Interactive Analysis
 Condensing Massive Satellite Datasets For Rapid Interactive Analysis Glenn Grant University of Colorado, Boulder With: David Gallaher 1,2, Qin Lv 1, G. Campbell 2, Cathy Fowler 2, Qi Liu 1, Chao Chen 1,
Passive Microwave Sea Ice Concentration Climate Data Record
 Passive Microwave Sea Ice Concentration Climate Data Record 1. Intent of This Document and POC 1a) This document is intended for users who wish to compare satellite derived observations with climate model
MADIS Airlines for America Briefing
 MADIS Airlines for America Briefing Meteorological Assimilated Data Ingest System (MADIS) FPAW Briefing Steve Pritchett NWS Aircraft Based Observations Program Manager MADIS Defined MADIS is a meteorological
Local Precipitation Variability
 Local Precipitation Variability Precipitation from one storm can vary from neighborhood to neighborhood. What falls in your yard may not fall in the next. The next time it rains see how the precipitation
The National Meteorological Services Agency Satellite Data reception and processing unit First phase by Yitaktu Tesfatsion
 The National Meteorological Services Agency Satellite Data reception and processing unit First phase by Yitaktu Tesfatsion In Ethiopia the rain guage network is not evenly distributed over the country.
NIDIS Intermountain West Drought Early Warning System September 4, 2018
 NIDIS Drought and Water Assessment NIDIS Intermountain West Drought Early Warning System September 4, 2018 Precipitation The images above use daily precipitation statistics from NWS COOP, CoCoRaHS, and
Leon Creek Watershed October 17-18, 1998 Rainfall Analysis Examination of USGS Gauge Helotes Creek at Helotes, Texas
 Leon Creek Watershed October 17-18, 1998 Rainfall Analysis Examination of USGS Gauge 8181400 Helotes Creek at Helotes, Texas Terrance Jackson MSCE Candidate University of Texas San Antonio Abstract The
Richard W. Reynolds * NOAA National Climatic Data Center, Asheville, North Carolina
 8.1 A DAILY BLENDED ANALYSIS FOR SEA SURFACE TEMPERATURE Richard W. Reynolds * NOAA National Climatic Data Center, Asheville, North Carolina Kenneth S. Casey NOAA National Oceanographic Data Center, Silver
TO PRODUCE VEGETATION OUTLOOK MAPS AND MONITOR DROUGHT
 6.2 IDENTIFYING TIME-LAG RELATIONSHIPS BETWEEN VEGETATION CONDITION AND CLIMATE TO PRODUCE VEGETATION OUTLOOK MAPS AND MONITOR DROUGHT Tsegaye Tadesse*, Brian D. Wardlow, and Jae H. Ryu National Drought
NIDIS Intermountain West Drought Early Warning System July 18, 2017
 NIDIS Drought and Water Assessment NIDIS Intermountain West Drought Early Warning System July 18, 2017 Precipitation The images above use daily precipitation statistics from NWS COOP, CoCoRaHS, and CoAgMet
NIDIS Intermountain West Drought Early Warning System March 26, 2019
 NIDIS Intermountain West Drought Early Warning System March 26, 2019 The images above use daily precipitation statistics from NWS COOP, CoCoRaHS, and CoAgMet stations. From top to bottom, and left to right:
A Facility for Producing Consistent Remotely Sensed Biophysical Data Products of Australia
 TERRESTRIAL ECOSYSTEM RESEARCH NETWORK - AusCover - A Facility for Producing Consistent Remotely Sensed Biophysical Data Products of Australia June, 2011 Mervyn Lynch Professor of Remote Sensing Curtin
AND THE COOPERATION WITH SENTINEL ASIA FOR DISASTER MANAGEMENT
 Ministry of Natural resources and Environment National Remote Sensing DEpartment NATIONAL REMOTE SENSING DEPARTMENT (NRSD) AND THE COOPERATION WITH SENTINEL ASIA FOR DISASTER MANAGEMENT By: Dr. Chu Hai
VISUALIZATION URBAN SPATIAL GROWTH OF DESERT CITIES FROM SATELLITE IMAGERY: A PRELIMINARY STUDY
 CO-439 VISUALIZATION URBAN SPATIAL GROWTH OF DESERT CITIES FROM SATELLITE IMAGERY: A PRELIMINARY STUDY YANG X. Florida State University, TALLAHASSEE, FLORIDA, UNITED STATES ABSTRACT Desert cities, particularly
Brian McGurk, P.G. DEQ Office of Water Supply. Contents. Overview of Virginia s Drought Assessment & Response Plan
 Drought Preparedness in Virginia Or, Whatcha Gonna Do When the Well, Creek, River, or Reservoir (Might) Run Dry? Rappahannock-Rapidan Regional Commission Living Lands Workshop November 18, 2014 Brian McGurk,
Monitoring Sea Surface temperature change at the Caribbean Sea, using AVHRR images. Y. Santiago Pérez, and R. Mendez Yulfo
 Monitoring Sea Surface temperature change at the Caribbean Sea, using AVHRR images. Y. Santiago Pérez, and R. Mendez Yulfo Department of Geology, University of Puerto Rico Mayagüez Campus, P.O. Box 9017,
Seasonal Climate Watch July to November 2018
 Seasonal Climate Watch July to November 2018 Date issued: Jun 25, 2018 1. Overview The El Niño-Southern Oscillation (ENSO) is now in a neutral phase and is expected to rise towards an El Niño phase through
WEATHER AND CLIMATE EXTREMES MONITORING BASED ON SATELLITE OBSERVATION : INDONESIA PERSPECTIVE RIRIS ADRIYANTO
 WEATHER AND CLIMATE EXTREMES MONITORING BASED ON SATELLITE OBSERVATION : INDONESIA PERSPECTIVE RIRIS ADRIYANTO INDONESIA AGENCY FOR METEOROLOGY, CLIMATOLOGY AND GEOPHYSICS (BM KG) 1. INTRODUCTION - BMKG
Federal Maintenance Decision Support System (MDSS) Prototype Update
 Prototype Update") Federal Maintenance Decision Support System (MDSS) Prototype Update Kevin R. Petty, Ph.D. National Center for Atmospheric Research Boulder, Colorado, USA MDSS Meeting 6 August 2008 Reno, Nevada Historical
Federal Maintenance Decision Support System (MDSS) Prototype Update Kevin R. Petty, Ph.D. National Center for Atmospheric Research Boulder, Colorado, USA MDSS Meeting 6 August 2008 Reno, Nevada Historical
DROUGHT ASSESSMENT USING SATELLITE DERIVED METEOROLOGICAL PARAMETERS AND NDVI IN POTOHAR REGION
 DROUGHT ASSESSMENT USING SATELLITE DERIVED METEOROLOGICAL PARAMETERS AND NDVI IN POTOHAR REGION Researcher: Saad-ul-Haque Supervisor: Dr. Badar Ghauri Department of RS & GISc Institute of Space Technology
Rainfall Estimation Models Induced from Ground Station and Satellite Data
 Rainfall Estimation Models Induced from Ground Station and Satellite Data Kittisak Kerdprasop and Nittaya Kerdprasop Abstract Rainfall is an important source of water in agricultural sector of Thailand
Supplementary Figures
 Supplementary Figures Supplementary Figure 1: The partial correlation coefficient of NDVI GS and GT for the first 15 years (1982-1996) and the last 15 years (1997-211) with five different definition of
NIDIS Intermountain West Drought Early Warning System April 16, 2019
 NIDIS Intermountain West Drought Early Warning System April 16, 2019 Precipitation The images above use daily precipitation statistics from NWS COOP, CoCoRaHS, and CoAgMet stations. From top to bottom,
GEOGRAPHICAL INFORMATION SYSTEMS. GIS Foundation Capacity Building Course. Introduction
 GEOGRAPHICAL INFORMATION SYSTEMS. GIS Foundation Capacity Building Course. Introduction In recent times digital mapping has become part and parcel of our daily lives with experience from Google Maps on
RESEARCH METHODOLOGY
 III. RESEARCH METHODOLOGY 3.1 Time and Location This research has been conducted in period March until October 2010. Location of research is over Sumatra terrain. Figure 3.1 show the area of interest of
By: J Malherbe, R Kuschke
 2015-10-27 By: J Malherbe, R Kuschke Contents Summary...2 Overview of expected conditions over South Africa during the next few days...3 Significant weather events (27 October 2 November)...3 Conditions
Seasonal Variations of the Urban Heat Island Effect:
 Seasonal Variations of the Urban Heat Island Effect: Examining the Differences in Temperature Between the City of Philadelphia and its Outlying Suburbs By: Frank Vecchio 1 P a g e We re calling for a high
Monitoring vegetation activity in Hungary using Direct Broadcast MODIS data
 Monitoring vegetation activity in Hungary using Direct Broadcast MODIS data Anikó Kern1 Contributors: Szilárd Pásztor1, Péter Bognár1, Zoltán Barcza2, Gábor Timár1, János Lichtenberger1, Péter Steinbach3,
KEY WORDS: Palmer Meteorological Drought Index, SWAP, Kriging spatial analysis and Digital Map.
 PALMER METEOROLOGICAL DROUGHT CLASSIFICATION USING TECHNIQUES OF GEOGRAPHIC INFORMATION SYSTEM IN THAILAND S. Baimoung, W. Waranuchit, S. Prakanrat, P. Amatayakul, N. Sukhanthamat, A. Yuthaphan, A. Pyomjamsri,
INSAR ATMOSPHERIC DELAY MIGITIGATION BY GPS; CASE STUDY IZMIT EARTQUAKE INTERFEROGRAMS
 INSAR ATMOSPHERIC DELAY MIGITIGATION BY GPS; CASE STUDY IZMIT EARTQUAKE INTERFEROGRAMS M.U. Altın a, *, E. Tari a, L. Ge b a ITU, Civil Engineering Faculty, 80626 Maslak Istanbul, Turkey (altinm, tari)@itu.edu.tr
North Carolina Climate December 2011
 North Carolina Climate December 2011 Online: http://www.nc-climate.ncsu.edu/office/newsletters North Carolina Climate, the monthly newsletter of the State Climate Office of NC, covers information on a
THERMAL REMOTE SENSING TECHNIQUES FOR STUDYING EARTHQUAKE ANOMALIES IN 2013 BALOCHISTAN EARTHQUAKES. G. Kaplan 1 and U. Avdan 2
 THERMAL REMOTE SENSING TECHNIQUES FOR STUDYING EARTHQUAKE ANOMALIES IN 2013 BALOCHISTAN EARTHQUAKES ABSTRACT: G. Kaplan 1 and U. Avdan 2 1 PhD Candidate, GIS and Remote Sensing program, Anadolu University,
NIDIS Intermountain West Regional Drought Early Warning System February 7, 2017
 NIDIS Drought and Water Assessment NIDIS Intermountain West Regional Drought Early Warning System February 7, 2017 Precipitation The images above use daily precipitation statistics from NWS COOP, CoCoRaHS,
2016 NC Coastal Local Governments Annual Meeting
 6 NC Coastal Local Governments Annual Meeting NCFMP Coastal Map Maintenance Flood Study Updates and Changes April, 6 Tom Langan, PE, CFM Engineering Supervisor NCEM-Risk Management - Floodplain Mapping
The Vegetation Outlook (VegOut): A New Tool for Providing Outlooks of General Vegetation Conditions Using Data Mining Techniques
: A New Tool for Providing Outlooks of General Vegetation Conditions Using Data Mining Techniques") University of Nebraska - Lincoln DigitalCommons@University of Nebraska - Lincoln Drought Mitigation Center Faculty Publications Drought -- National Drought Mitigation Center 2007 The Vegetation Outlook
University of Nebraska - Lincoln DigitalCommons@University of Nebraska - Lincoln Drought Mitigation Center Faculty Publications Drought -- National Drought Mitigation Center 2007 The Vegetation Outlook
Targeted LiDAR use in Support of In-Office Address Canvassing (IOAC) March 13, 2017 MAPPS, Silver Spring MD
 March 13, 2017 MAPPS, Silver Spring MD") Targeted LiDAR use in Support of In-Office Address Canvassing (IOAC) March 13, 2017 MAPPS, Silver Spring MD Imagery, LiDAR, and Blocks In 2011, the GEO commissioned independent subject matter experts (Jensen,
Targeted LiDAR use in Support of In-Office Address Canvassing (IOAC) March 13, 2017 MAPPS, Silver Spring MD Imagery, LiDAR, and Blocks In 2011, the GEO commissioned independent subject matter experts (Jensen,
Problems and Challenges
 2018 Esri Petroleum GIS Conference Problems and Challenges May 9 10, 2018 Houston, Texas George R. Brown Convention Center Disunity of drawing standards and format Large amount of work in Cartography,
ASCAT NRT Data Processing and Distribution at NOAA/NESDIS
 ASCAT NRT Data Processing and Distribution at NOAA/NESDIS Paul S. Chang, Zorana Jelenak, Seubson Soisuvarn, Qi Zhu Gene Legg and Jeff Augenbaum National Oceanic and Atmospheric Administration (NOAA) National
Fire Weather Monitoring and Predictability in the Southeast
 Fire Weather Monitoring and Predictability in the Southeast Corey Davis October 9, 2014 Photo: Pains Bay fire in 2011 (courtesy Donnie Harris, NCFWS) Outline Fire risk monitoring Fire risk climatology
The North American Drought Monitor - The Canadian Perspective -
 The North American Drought Monitor - The Canadian Perspective - Trevor Hadwen National Agroclimate Information Service AAFC-PFRA, Regina Canmore, Alberta March 16-18, 2008 Background The NADM is a cooperative
National Climatic Data Center Data Management Issues Tom Karl Director, NOAA s National Climatic Data Center
 National Climatic Data Center Data Management Issues Tom Karl Director, NOAA s National Climatic Data Center Opening Meeting NOAA Science Advisory Board s Data Archiving and Access Requirements Working
NIDIS Intermountain West Drought Early Warning System January 16, 2018
 NIDIS Drought and Water Assessment NIDIS Intermountain West Drought Early Warning System January 16, 2018 Precipitation The images above use daily precipitation statistics from NWS COOP, CoCoRaHS, and
Regional Haze Metrics Trends and HYSPLIT Trajectory Analyses. May 2017
 Regional Haze Metrics Trends and HYSPLIT Trajectory Analyses May 2017 Principal Contributors: Tom Downs, CCM, ME DEP Project manager Martha Webster, ME DEP Trajectory analyses and GIS mapping Rich Greves,
IDENTIFICATION OF HAZARDS OF CONCERN
 IDENTIFICATION OF HAZARDS OF CONCERN To provide a strong foundation for mitigation strategies considered in Section 6, the Village considered a full range of hazards that could impact the area and then
The Future of the USAP Antarctic Internet Data Distribution System
 The Future of the USAP Antarctic Internet Data Distribution System A discussion on LDM Efforts at ASC with Satellite Ground Stations update Andrew B. Archer Antarctic Support Contract Matthew A. Lazzara
GIS Tools, Data, & Methods in the Weekly US Drought Monitor
 GIS Tools, Data, & Methods in the Weekly US Drought Monitor International Workshop on Agromet and GIS Applications for Agricultural Decision Making Jeju, South Korea December 5, 2016 Eric Luebehusen USDA/OCE/WAOB
Development of the Canadian Precipitation Analysis (CaPA) and the Canadian Land Data Assimilation System (CaLDAS)
 and the Canadian Land Data Assimilation System (CaLDAS)") Development of the Canadian Precipitation Analysis (CaPA) and the Canadian Land Data Assimilation System (CaLDAS) Marco L. Carrera, Vincent Fortin and Stéphane Bélair Meteorological Research Division Environment
Development of the Canadian Precipitation Analysis (CaPA) and the Canadian Land Data Assimilation System (CaLDAS) Marco L. Carrera, Vincent Fortin and Stéphane Bélair Meteorological Research Division Environment
Images of the Month. Mostly dry conditions during the peak winter months over the Western Cape
 I S S U E 2 0 1 7-0 9 1 8 S E P T E M B E R 2 0 1 7 I N S T I T U T E F O R S O I L, C L I M A T E A N D W A T E R C O N T E N T S : 1. Rainfall 2 2. Standardized Precipitation Index 159 th Edition 4 3.