WEST CATARACT CREEK DAM FINAL DESIGN REPORT
|
|
|
- Camron Wilcox
- 5 years ago
- Views:
Transcription
1 DAMsel In Distress Engineering 2112 S Huffer Ln Flagstaff, AZ (520) WEST CATARACT CREEK DAM FINAL DESIGN REPORT Prepared for: Dr. Charles Schlinger Mr. Mark Lamer
2 TABLE OF CONTENTS Contents Acknowledgements 1 Project Description 2 Background 4 Analysis 6 Conclusion 17 Final Recommendations 18 Summary of Project Costs 19 References 21
3 ACKNOWLEDGEMENTS Acknowledgements Throughout the course of this project, our team would not have been able to progress as well as we did without the help of several professionals in this field. Firstly we would like to thank the Arizona Department of Water Resources (ADWR), for giving us vital documents regarding the dam s construction, various inspections, blueprints, and improvements that have occurred from 1946 to We would also like to thank Craig Brown, dam safety inspector for ADWR, for his helpfulness. When our team needed the most recent information, Craig Brown was able to ensure that we gained access to all of the more recent documents from 2007 to 2013, including ADWR s 2013 Dam Break Analysis. It is also important to acknowledge the help from our technical advisor and capstone professors, Dr. Charles Schlinger, whose technical guidance pointed our team in the right direction and aided our analysis. Our team would also like to thank our other capstone professors, Dr. Wilbert Odem, Mark Lamer, and Dr. Bridget Bero, who gave us constructive criticism and valuable feedback that helped our team strive to become better. Page 1
. N Figure 1- Project Location (Google Maps) Cataract Creek is considered a significant safety concern by ADWR.")
4 PROJECT DESCRIPTION Project Description West Cataract Creek Dam is an earthen dam located about 2 miles west of Williams, AZ along Interstate 40. The exact location of the dam is portrayed below in Figure 1 (Google Maps). N Figure 1- Project Location (Google Maps) Cataract Creek is considered a significant safety concern by ADWR. The most recent inspection from 2013 confirms that this classification is appropriate for now but requests that a dam break analysis be performed in order to confirm it. According to ADWR, a significant safety concern means that a loss of life is unlikely and the economic losses are low to high in the event of a dam failure (Resources). The goal of this project is to analyze the functionality and safety of the dam in order to determine the likelihood of a potential failure, and give recommendations based on the findings. The client would also like to know what impacts a dam break would have on the City of Williams. Page 2
5 PROJECT DESCRIPTION After a complete background check on the dam s history, four failure modes were chosen for the analysis based on the likelihood of their occurrence. These failure modes consist of: slope stability, overtopping, spillway failure, and internal erosion. All topography, geometry, geotechnical, and hydrological data necessary to complete these analyses will be collected by DAMsel in Distress Engineering. The four failure modes are also classified as either a sunny-day failure, or a rainy day failure. CURRENT CONDITION The dam s geometry has not changed since improvements made in Currently there are two issues with the dam facility. The first issue involves the outlet pipes below the dam. The valves at the end of the pipes are out of service and there is a lack of an upstream valve which causes water pressurization within the pipes. Second, there is no Emergency Action Plan (EAP) for the community downstream in the event of a dam breach. CONSTRAINTS AND LIMITATIONS A couple constraints and limitations have occurred throughout this project. One of the main limitations occurred during surveying. The closest benchmark to the project site was across Interstate 40 and DAMsel in Distress Engineering did not have the appropriate equipment to tie into it. Without this benchmark, the true elevations obtained through surveying are unknown. An alternative method was also unsuccessful; the closest base station was out of range for a Network GPS Survey. However even with these constraints, elevations and distances relative to one another were still able to be accurately recorded. Another constraint had to do with obtaining documents from the appropriate parties. Arizona Department of Water Resources only had digital copies of the records through Documents from 2007 to the present day were obtained from Craig Brown at a much later during this project s lifetime. Page 3
6 BACKGROUND Background The dam was constructed from May 4, 1947 to November 30, 1947 in order to impound Cataract Lake for water storage and recreational purposes. The analysis that was used to design the dam included factoring in values for drainage area, discharge, runoff, design storms, and soils information. In 1967, a design analysis was done to determine the effectiveness of the dam. From March 1, 1968 to May 1, 1968, a two foot tall concrete weir was added to the spillway along with a few feet on the crest of the dam. Both designs (the original and the revision) evaluated the dam to the 100 year storm event. Figure As-Built Improvements (ADWR) Various inspections were performed from 1978 to In the more recent inspections, the dam was flagged for having pressurized pipes running through it and for not having an Emergency Action Plan (EAP) in place. In 1982, Gonzalez Estate was constructed, and was being used to attenuate any overtopping flow from the Cataract Creek Dam. In 2005, the spillway was widened, to a total bottom width of 80 feet. Freeboard was noted during an inspection to be 8.3 feet. Page 4
7 BACKGROUND In 2013, ADWR performed a dam break analysis detailing the effects on downstream conditions in case of a dam failure. A complete summarized chronology of the dam s history can be found in Appendix A. Page 5
8 ANALYSIS Analysis SURVEYING A survey of the dam was performed in order to get the general dimensions of the dam along with the elevations of the spillway and the crest of the dam. A comprehensive survey of the entire lake area was not required due to the availability of a topographic map, with storage capacity at each elevation that was generated when the dam was created in It was assumed that the general topography and overall capacity of the dam had not changed since the dam was created in 1947 or that if it had changed that the amount was insignificant. The difference in the elevation of the dam crest and the spillway was used as the freeboard of the dam. A sketch of the dam and spillway was created using the list of survey points in AutoCAD Civil3D and can be seen in Appendix B. Figure 3- Surveyed Points (AutoCAD Civil 3D) Page 6
9 ANALYSIS HYDROLOGY Hydrology data for the area surrounding West Cataract Lake needed to be found and analyzed in order to approximate the impact any given flood would have on Williams, Arizona. The first step taken to find hydrologic data was to access the Federal Emergency Management Agency s website. From the FEMA website, four floodplain maps for the City of Williams were collected and imported together into AutoCAD Civil 3D in a way that showed the entirety of the floodplains affecting Williams. In this way, it would be a simpler task to imagine the results of a dam break, since the existing floodplains would be heavily compounded by the water coming from the dam. These FEMA maps can be viewed in Appendix C (FEMA). In addition to analyzing the floodplain maps from FEMA, National Streamflow Statistics software was used for the dam s regional area. The NSS software was used to achieve preliminary rough estimate hydrographs that would give a range of inflows into the reservoir. The values generated by the NSS software can also be viewed as part of Appendix C (NSS). Since these inflow hydrographs were very rough estimates and required minimal input, further analysis had to be completed using real storm data as well as actual conditions of the project area. This process will be explained further in the section titled Overtopping. SLOPE STABILITY A slope stability analysis evaluates a slope for failure using specific soil properties such as cohesion, friction angle, and soil classification, and is considered a sunny day failure. In a slope stability failure, a portion of the slope shears off at the weakest plane or slip surface. This type of failure would significantly reduce the capacity of the dam by eliminating portions of the cross sectional area. Typically, steeper slopes with weaker soil are the most susceptible to this type of failure. It is important to consider slope stability as a major failure mode for West Cataract Creek Dam since it has a relatively steep slope and because the properties of the soil that makes up the dam are unknown. One of the most popular programs to evaluate slope stability is Slide by Rocscience. The methods within Slide used by the team for the slope stability analysis were the simplified Bishop and Janbu methods. Slide requires the user to input a two dimensional cross section of the slope in question along with soil properties, and any reservoirs or water Page 7

10 ANALYSIS tables relevant. The cross section for West Cataract Creek Dam was created by scaling off a contour map of the dam from the as-built drawings. This cross section was put into the software along with the reservoir at full capacity as shown in Figure 4, below. Figure 4 - Slide Input (RocScience) Soil properties were assumed since no soils report for the composition of the dam was provided and soil samples were not taken as a part of the project. Initially, the general properties of clayey gravel (GC) and clayey sands (SC) were assumed based on a report of the soil found in the surrounding area of the dam. These properties yielded high factors of safety so more conservative properties were assumed. The final model in the Slide software used unconsolidated, undrained soil with a friction angle of zero. Results from the Slide software display the slip surface factors of safety in a color-coded gradient, ranging from red to blue for low to high factors of safety, respectively. Outputs from the software for the front and back slopes can be found in Figures 5 and 6, below. Page 8


11 ANALYSIS Figure 5 - Slide Ouput - Front Slope (RocScience) Figure 6 - Slide Output - Back Slope (RocScience) The factors of safety of the worst case slip surfaces throughout the dam from the front and from the back were 3.6 and 1.6, respectively. Both of these values are above the required factor of safety of 1.5, resulting in a stable dam. This method of analysis can only show an estimate of the slope stability since the soil properties were assumed, however, conservative values were used to increase the confidence in the results. Page 9
12 ANALYSIS OVERTOPPING Overtopping is a rainy day failure when the spillway capacity of a reservoir is met and exceeded causing water from the reservoir to start flowing over the crest of the dam. Bentley PondPack was the main tool used to analyze the reservoir and spillway capacities for multiple recurrence interval storms under different conditions of the watershed. This software was chosen for the analysis because an accurate model reflecting the project area could be created, as well as the software was able to run both Pre-Burn and Post- Burn scenarios next to each other. The first step to complete this analysis was to access NOAA Atlas 14 in order to get storm data for Williams, Arizona. NOAA Atlas 14 provided the team with rainfall intensities for many different recurrence interval storms for multiple storm durations. The storm data table used for this analysis can be found in Appendix D of this document. Once the storm data was obtained, the next step the team needed to take was to delineate the watershed that feeds West Cataract Lake and compare it to the value that was found in the obtained ADWR documents. In order to do this, a topographic map of the project area was obtained from the ArcGIS website and imported it into AutoCAD Civil 3D. Once the map was in Civil 3D, the contour lines were followed in order to find the total area of land that feeds into West Cataract Lake. The total area of the watershed found by DAMsel in Distress Engineering was 6.02 square miles which was very close to the area of the watershed found by ADWR. A map of the delineated watershed can be found in Appendix D of this report. After the total watershed was found, it was decided to split the watershed into two separate catchment areas with the Interstate 40 as the dividing line. After this division was completed, the areas of the two new watersheds were found to be 3.52 square miles for the catchment south of Interstate 40 and 2.50 square miles for the catchment north of Interstate 40. Once the watershed was divided into two, the time of concentration needed to be found for each of the catchments. Time of concentration was found using the Kirpich Equation (Bains): T c = L 0.77 S Where Tc is the time of concentration in minutes, L is the maximum length of flow in feet, and S is the watershed gradient in feet per foot or the difference in elevation between the most remote point of the watershed and the outlet into the reservoir divided by the maximum length of flow. The following table shows the input values for each catchment, as well as the obtained time of concentration used to create the PondPack model. Page 10
13 ANALYSIS Table 1 - Time of Concentration Calculation Catchment Length of Flow Gradient Time of Concentration North of I-40 13,709 feet ft./ft minutes South of I-40 25,344 feet ft./ft. 50 minutes After getting acquainted with the PondPack software, it was decided to use the SCS Curve Method in order to predict direct runoff and infiltration from each catchment. The SCS Curve Method was created by the Soil Conservation Service and is based on the area s hydrologic soil group, hydrologic condition and land use. Since the team was asked to compare pre-burn and post-burn catchment conditions, two SCS Curve Numbers needed to be found. Using a study completed by the U.S. Forest Service Coronado National Forest that incorporated the WILDCAT4 model for runoff and infiltration and was used to estimate peak flow runoff for pre- and post-burn conditions on a fire that occurred in Arizona, curve numbers of and were used for pre- and post-burn conditions respectively (Greenberg and Hawkins). These two values were obtained by knowing that the hydrologic soil group of the two catchments were classified as a C as well as taking into account a high severity burn, since Northern Arizona is prone to wildfires. After all the information was found for the catchments, a storage rating curve for the reservoir of West Cataract Lake needed to be calculated. ADWR simplified this process by provided storage capacities from the pond invert to the crest of the weir in the spillway, however linear interpolation needed to be done in order to estimate the capacity of the reservoir from the crest of the spillway weir to the crest of the dam. The following table show the values that were obtained for the reservoir storage, in acre-feet, compared to the water surface elevation. Page 11


14 ANALYSIS Table 2 - Reservoir Storage Capacity From this table, a storage capacity curve was created. Figure 7 shows the storage capacity curve obtained from the values in Table 2. Figure 7 - Reservoir Capacity Curve (PondPack) Page 12

15 ANALYSIS Once the reservoir capacity was found for water surface elevations up to the crest of the dam, the emergency spillway capacity was calculated in order to find the peak flow the spillway can pass without causing the headwater to back up and flow over the crest of the dam. Since a weir was constructed in the spillway to increase the capacity of the reservoir, the Broad-Crested Weir Equation was used to calculate outflow values that the spillway can adequately pass. This equation is: Q = B ( ) (g) 1 2(H) 3 2 Where Q is the outflow in cubic feet per second (cfs), B is the width of the weir in feet, g is gravitational acceleration in feet per square second, and H is the water surface elevation above the crest of the weir in feet. Using a weir width of 80 feet that was obtained during the survey process, as well as a gravitational acceleration of 32.2 ft/s 2, Table 3 shows the outflow values obtained using the Broad-Crested Weir Equation. Table 3 - Outflow Capacity Table From the table above, it can be seen that the emergency spillway can handle a maximum outflow capacity of cfs at the water surface elevation equal to the crest of the dam. Page 13


16 ANALYSIS After the storm data, catchment areas, reservoir capacity and spillway capacity were entered into the PondPack model, which a layout can be found in Appendix D, models were run for the 1, 2, 5, 10, 25, 50, 100, 200, 500 and 1000 year recurrence interval storms for both pre- and post-burn conditions. Table 4 shows the relevant storms and outputs from PondPack for pre-burn conditions to show that the spillway is adequate to pass outflows from every recurrence interval storm, including the 1000 year storm. Table 4 - PondPack Output Table for Pre-Burn Conditions After the pre-burn model was run, a post-burn model was completed to compare what would happen when the watershed experienced a severe burn. Table 5 shows the relevant storms and outputs from PondPack for post-burn conditions to show the adequacy of the spillway for the post-burn conditions. Table 5 - PondPack Output Table for Post-Burn Conditions Page 14
17 ANALYSIS It can be seen from the two tables above that the spillway is adequate to pass flows from any storm under pre-burn conditions, and can pass the flows from all storm events excluding the 500 and 1000 year event after the watershed experiences a severe burn. SPILLWAY FAILURE Spillway Failure is another rainy day failure, defined as a scenario in which the existing concrete weir is removed during a return event. This was analyzed as a follow up to the overtopping analysis, because the consequences of a spillway failure would be the most critical during a large storm. The PondPack model set up for the overtopping analysis was used again, but starting elevation was defined as the pond invert, as opposed to the previously used This is because 6811 was chosen based on the bottom elevation of the concrete weir, but a spillway failure necessitates the weir being removed. Using both pre-burn and post-burn situations, it was clear that the removal of the concrete weir would make a substantial difference, causing much more water to pass by the dam and go on to potentially damage something downstream. The spillway failure analysis revealed that a 100 year storm in a pre-burn scenario, or a 5 year storm in a post-burn scenario would result in flows high enough to produce 2.5 feet of water going through the spillway unhindered. INTERNAL EROSION Evidence of seepage at the dam site has led to concerns of internal erosion, which would be a sunny day failure. The seepage that was identified on the downstream side of the dam did not contain visible particles of soil and was insufficient to cause internal erosion. For this reason internal erosion was omitted from the analyses performed on the dam. A flow net analysis is a way to estimate seepage velocities through a dam cross-section. This method requires known soil properties, which the team was not given, making this method of analysis difficult to perform. If soil properties were assumed the analysis may be performed, but may not be realistic. Since seepage at the site was minimal and no particles were apparent and soil properties were unknown, the team decided that a flow net analysis would not be necessary. Page 15
18 ANALYSIS ADWR DAM BREAK ANALYSIS In October of 2013, ADWR performed a dam-break analysis in which they looked into the possibilities of a sunny-day as well as a rainy-day dam break. As one might predict, the rainy-day failure caused greater depths downstream, affecting more of Williams than the sunny day failure. In the rainy day failure, the dam was assumed to be at full capacity when it broke, resulting in all the water flooding downstream. The most affected areas affected are a hotel and a gas station about 1.5 miles downstream, which are completely flooded with about nine feet of water. I-40 and a small part of Williams consisting of less than 30 residential homes are also affected, with an average of a foot of water flooding into the area. This dam break analysis was a static dam break analysis, meaning that only the depth of water was included, and not the velocities. ADWR s static dam break analysis is included in Appendix E. Page 16
19 CONCLUSION Conclusion Based on the failure modes that were thoroughly analyzed throughout this project, there is not a serious chance of the dam breaking. Only extreme worst-case scenarios caused a failure, meaning that the dam and concrete weir are very unlikely to fail. The main reason that ADWR is concerned with the dam calling it a Significant safety concern, is because of the downstream risks involved, and the fact that the Emergency Action Plan is not finalized. Page 17
20 FINAL RECOMMENDATIONS Final Recommendations RECOMMENDATION 1 This team s first recommendation is for ADWR or a third party to perform a dynamic dam break analysis, which would include velocities. The dam break analysis on downstream conditions done in October of 2013 only considered water depths and not velocities. This means that the water going into the Williams area may be a higher threat than initially determined from the static analysis. RECOMMENDATION 2 Our team s second recommendation is for the Emergency Action Plan to be finalized. While the EAP has been created, it has not been finalized or implemented, meaning that it cannot be used in the unlikely event of a dam break. Finalize and implement the EAP. This will become even more necessary if the dam does get changed from a significant safety concern to a high safety concern. RECOMMENDATION 3 Improve and repair outlet works. Existing outlet works are unable to be opened due to lack of maintenance. Downstream valves cause high pressures in the pipes, thus upstream valves should be added in order to reduce pressures in pipes. While there is currently not enough evidence to warrant an internal erosion analysis, if this problem is not fixed, then the condition of the dam may change away from its current state. RECOMMENDATION 4 This team s final recommendation is to remove deep-rooted vegetation. In the various inspections of this dam, vegetation was consistently noted as a concern, especially a growth of cattails downstream of the dam. In order to finally dispel any seepage concerns, this vegetation should be removed. Page 18

21 SUMMARY OF PROJECT COSTS Summary of Project Costs Because there are no construction or material costs associated with this project, all costs are for engineering services that were spent during this project. The proposed Gantt chart followed by the final official Gantt chart are located in Appendix F of this document due to the size of the images. The tasks do change a fair amount due to some confusion of the project s scope, but the second Gantt chart shows the final tasks with the amount of time that was closely followed. Due to the uncertainty of the precise number of hours that should be allotted to the different tasks, there was somewhat of a discrepancy between the proposed budget and the actual budget. The following is the proposed budget, which was created for the proposal in May 2014 before the start of the project. Table 6 - Proposed Cost Summary Some tasks were dropped because other tasks took much more time than originally predicted, and the billable rate per hour was decreased to compensate for this unexpected change. All of the updated values can be seen in the table on the following page, which is the most recent version of the budget: Page 19
22 SUMMARY OF PROJECT COSTS Table 7 - Updated Cost Summary Task Total Hours Billable Rate Total Cost Literature Review 199 $40/hr. $7,960 Website 11.5 $75/hr. $863 Site Surveying & Inventory 27 $75/hr. $2,025 Hydro Analysis 65 $75/hr. $4,875 Overtopping Analysis 43.5 $75/hr. $3,263 Erosion Analysis 17 $75/hr. $1,275 Slope Stability Analysis 48.5 $75/hr. $3,638 Spillway Failure Analysis 27 $75/hr. $2,025 Final Report* 76.5 $75/hr. $5,738 Total Hours 515 Total Cost $31,662 This new total cost is the official number that the client will be charged for the team s dam safety analysis. Page 20
23 REFERENCES References AutoCAD Civil 3D 2015, Software Bains, Edminster, Frevert, Schwab. Soil & Water Conservation Engineering. n.d. Bentley PondPack, Software FEMA. "FEMA." 28 July Flood Map Service Center. 3 October Google Maps. October October Greenberg, R. J. and R. H. Hawkins. WILDCAT 4 Flow Model. Tucson: School of Renewable Natural Resources, University of Arizona, NSS. "NSS, Version 6." 11 May USGS. 27 September Resources, Arizona Department of Water. 20 March ADWR. 4 September RocScience Slide 6.0, Software Page 21
24 Appendix A West Cataract Creek Dam Chronology
25 Timeline for West Cataract Creek Dam Dam was designed in 1946, with the following factors considered o Drainage area of 5.5 square miles Run-off factor of 20-25% o Discharge of 2,000 cfs o Maximum 1 hour precipitation of 3.3 inches o Design 100 year flood was 1.5 inches/hour for 3 hours o Soil samples were taken, and were run through tests to find various properties Dam was constructed from May 4, 1947 to November 30, 1947 In 1967, a design analysis was done to determine the effectiveness of the dam o Peak discharge was re-computed as 3600 cfs o Drainage area of 6.2 square miles o 100 year 1 hour rainfall was 2.3 inches o Time of concentration was calculated as 60 minutes Revision from March 1, 1968 to May 1, 1968 o 2 foot concrete wall placed across spillway Inspection in 1978 Gonzalez Estate constructed just before 1982, and was being used to hold overtopping flow from the West Cataract Creek Dam 8 feet of freeboard confirmed during April 10, 1984 inspection o 3 feet during 100 year flood o No freeboard during PMP storm As of 1986 inspection o Cited inadequate spillway capacity, causing the dam to be a significant safety concern o Licensed in July 18, 1986 o Valves tested in January 1986-no issues Left in open position o Spillway enlargement due to happen Unclear if this was done o Recommended calculating 100-year flood and ½ PMF flows, and modify spillway accordingly EAP plan was adopted by Williams in 1986 that applied to all dams owned by Williams Inspection on October 1, 1997 o Valve box needs repaired 1
26 Inspection from May 30, 2001 o Rusted valves o No maintenance on outlet valves o Evidence of seepage On July 10, 2001, spillway was still reported to be inadequate On August 10, 2001, ADWR began sending monthly notices to the city of Williams about the Significant Safety Concern for West Cataract Creek Dam May 2004 inspection o Outlet Pipe without Upstream Controls resulting in pressurized pipes through the dam o Evidence of seepage In 2005, spillway was widened, to a bottom width of 75 feet o Freeboard now 8.3 feet o Shotcrete and riprap used to reduce the noticed seepage in April 2005 Final notice from ADWR to Williams, Arizona was on March 20, 2007 o Around this time, Williams stated that responsibility for the dam changed to the Kaibab National Forest As of 2013, a draft for an Emergency Action Plan supposedly exists, but has not been put in place 2
27 Appendix B Survey Data 1. Survey Data
28 Survey Data Northing Easting Elevation Notes Spillway Wall (N) Spillway Wall (S) Spillway Edge Spillway Edge Spillway Edge Spillway Edge Top of Concrete Top of Concrete Top of Concrete Top of Concrete Backside Slope Edge Top of Dam Point Backside Slope Edge Front Side SE BS SE FS SE BS SE FS SE BS SE FS SE BS SE FS SE BS SE FS SE BS SE FS SE BS SE FS SE BS SE FS SE BS SE FS SE BS SE FS SE FS SE FS SE FS SE FS SE FS SE BS SE 1
29 FS SE BS SE FS SE BS SE FS SE BS SE Top Center of Dam - South FS Top Edge BS TE FS TE BS TE FS TE BS TE FS TE BS TE FS TE BS TE FS TE BS TE FS TE BS TE BS SE BS SE BS Second Nail 2
30 Appendix C HYDROLOGY DATA 1. NSS output 2. FEMA dfirm Map

31 NSS Output 1
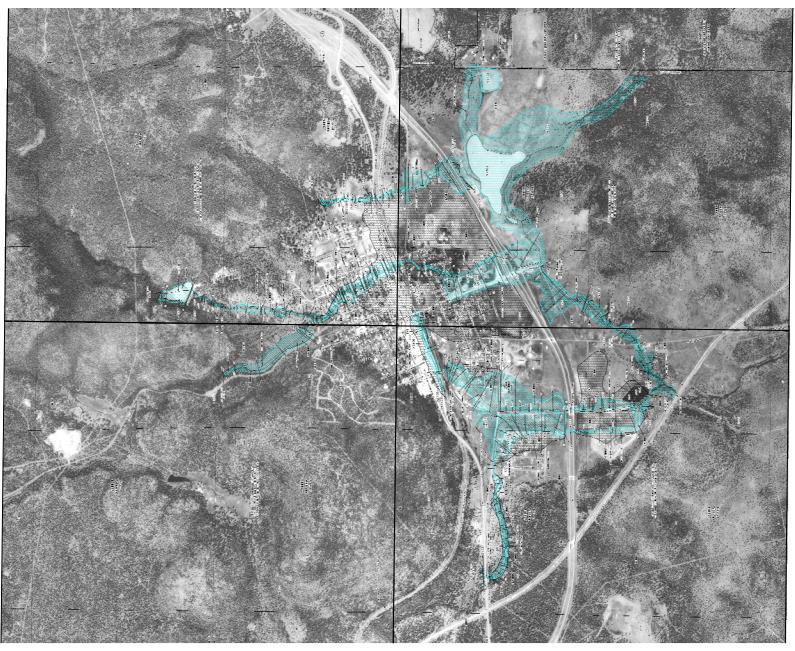
32 FEMA Floodplains 2
33 Appendix D Overtopping Analysis 1. NOAA Atlas 14 Storm Data 2. Watershed Delineation 3. Bentley PondPack Model

34 NOAA Atlas 14 Storm Data 1
35 Watershed Delineation 2

36 N Bentley PondPack Model 3
37 4
38 Appendix E ADWR Dam Safety Analysis

39 Downstream Effects of a Sunny Day Failure as determined by ADWR


40 Affected hotel and gas station north of I-40 Depth of water over I-40 as well as affected Williams homes.

41 Downstream Effects of a Rainy Day Failure as determined by ADWR


42 Affected hotel and gas station north of I-40 Depth of water over I-40 as well as affected Williams homes.
43 Appendix F Gantt Charts
44 Proposed Gantt Chart
45 Final Gantt Chart
INFLOW DESIGN FLOOD CONTROL SYSTEM PLAN 40 C.F.R. PART PLANT YATES ASH POND 2 (AP-2) GEORGIA POWER COMPANY
 GEORGIA POWER COMPANY") INFLOW DESIGN FLOOD CONTROL SYSTEM PLAN 40 C.F.R. PART 257.82 PLANT YATES ASH POND 2 (AP-2) GEORGIA POWER COMPANY EPA s Disposal of Coal Combustion Residuals from Electric Utilities Final Rule (40 C.F.R.
INFLOW DESIGN FLOOD CONTROL SYSTEM PLAN 40 C.F.R. PART 257.82 PLANT YATES ASH POND 2 (AP-2) GEORGIA POWER COMPANY EPA s Disposal of Coal Combustion Residuals from Electric Utilities Final Rule (40 C.F.R.
THE NEED FOR AN ADDITIONAL SPILLWAY AT THE SANFORD DAM BOILING SPRING LAKES, NC. Presentation for The Brunswick County Commissioners April 20, 2015
 THE NEED FOR AN ADDITIONAL SPILLWAY AT THE SANFORD DAM BOILING SPRING LAKES, NC Presentation for The Brunswick County Commissioners April 20, 2015 The Sanford Dam Earth Dam constructed in 1961 Drainage
Section 4: Model Development and Application
 Section 4: Model Development and Application The hydrologic model for the Wissahickon Act 167 study was built using GIS layers of land use, hydrologic soil groups, terrain and orthophotography. Within
Emergency Action Plan (EAP) Tata Pond Dam
 Tata Pond Dam") For Official Use Only Not for Public Distribution 02/03/16 Emergency Action Plan (EAP) Tata Pond Dam State of Connecticut Dam ID: 0000 Town or City, County, Connecticut Name of Dam Owner Dam Hazard Classification
For Official Use Only Not for Public Distribution 02/03/16 Emergency Action Plan (EAP) Tata Pond Dam State of Connecticut Dam ID: 0000 Town or City, County, Connecticut Name of Dam Owner Dam Hazard Classification
APPENDIX B HYDROLOGY
 APPENDIX B HYDROLOGY TABLE OF CONTENTS 1.0 INTRODUCTION... 1 2.0 PROBABLE MAXIMUM PRECIPITATION (PMP)... 1 3.0 DESIGN FLOW CALCULATION... 1 4.0 DIVERSION CHANNEL SIZING... 2 5.0 REFERENCES... 4 LIST OF
Study 16.5 Probable Maximum Flood (PMF)
") Initial Study Report Meeting Study 16.5 Probable Maximum Flood (PMF) October 22, 2014 Prepared by 10/22/2014 1 Study 16.5 Objectives Develop a site-specific PMP to be used for the derivation of the PMF
Initial Study Report Meeting Study 16.5 Probable Maximum Flood (PMF) October 22, 2014 Prepared by 10/22/2014 1 Study 16.5 Objectives Develop a site-specific PMP to be used for the derivation of the PMF
9. PROBABLE MAXIMUM PRECIPITATION AND PROBABLE MAXIMUM FLOOD
 9. PROBABLE MAXIMUM PRECIPITATION AND PROBABLE MAXIMUM FLOOD 9.1. Introduction Due to the size of Watana Dam and the economic importance of the Project to the Railbelt, the Probable Maximum Flood (PMF)
North Carolina Simplified Inundation Maps For Emergency Action Plans December 2010; revised September 2014; revised April 2015
 North Carolina Simplified Inundation Maps For Emergency Action Plans December 2010; revised September 2014; revised April 2015 INTRODUCTION Emergency Action Plans (EAPs) are critical to reducing the risks
CCR Rule Annual Inspection Report (cont.) 2
 2") The inspection findings consisted of maintenance items and items that were not observed to be signs or potential signs of significant structural weakness. No deficiencies or disrupting conditions that
The inspection findings consisted of maintenance items and items that were not observed to be signs or potential signs of significant structural weakness. No deficiencies or disrupting conditions that
Study 16.5 Probable Maximum Flood (PMF)
") Initial Study Report Meeting Study 16.5 Probable Maximum Flood (PMF) March 30, 2016 Prepared by 3/30/2016 1 Study 16.5 Status ISR documents (ISR Part D Overview): Status: Initial Study Report: Parts A,
Initial Study Report Meeting Study 16.5 Probable Maximum Flood (PMF) March 30, 2016 Prepared by 3/30/2016 1 Study 16.5 Status ISR documents (ISR Part D Overview): Status: Initial Study Report: Parts A,
STRUCTURAL STABILITY ASSESSMENT
 STRUCTURAL STABILITY ASSESSMENT CFR 257.73(d) Bottom Ash Pond Complex Cardinal Plant Brilliant, Ohio October, 2016 Prepared for: Cardinal Operating Company Cardinal Plant Brilliant, Ohio Prepared by: Geotechnical
PRELIMINARY DRAFT FOR DISCUSSION PURPOSES
 Memorandum To: David Thompson From: John Haapala CC: Dan McDonald Bob Montgomery Date: February 24, 2003 File #: 1003551 Re: Lake Wenatchee Historic Water Levels, Operation Model, and Flood Operation This
TSEGI WASH 50% DESIGN REPORT
 TSEGI WASH 50% DESIGN REPORT 2/28/2014 Daniel Larson, Leticia Delgado, Jessica Carnes I Table of Contents Acknowledgements... IV 1.0 Project Description... 1 1.1 Purpose... 1 Figure 1. Erosion of a Headcut...
HISTORY OF CONSTRUCTION FOR EXISTING CCR SURFACE IMPOUNDMENT PLANT GASTON ASH POND 40 CFR (c)(1)(i) (xii)
(1)(i) (xii)") HISTORY OF CONSTRUCTION FOR EXISTING CCR SURFACE IMPOUNDMENT PLANT GASTON ASH POND 40 CFR 257.73(c)(1)(i) (xii) (i) Site Name and Ownership Information: Site Name: E.C. Gaston Steam Plant Site Location:
HISTORY OF CONSTRUCTION FOR EXISTING CCR SURFACE IMPOUNDMENT PLANT GASTON ASH POND 40 CFR 257.73(c)(1)(i) (xii) (i) Site Name and Ownership Information: Site Name: E.C. Gaston Steam Plant Site Location:
LOMR SUBMITTAL LOWER NEHALEM RIVER TILLAMOOK COUNTY, OREGON
 LOMR SUBMITTAL LOWER NEHALEM RIVER TILLAMOOK COUNTY, OREGON Prepared for: TILLAMOOK COUNTY DEPARTMENT OF COMMUNITY DEVELOPMENT 1510-B THIRD STREET TILLAMOOK, OR 97141 Prepared by: 10300 SW GREENBURG ROAD,
Continuing Education Course #101 Drainage Design with WinTR-55
 1 of 5 Continuing Education Course #101 Drainage Design with WinTR-55 1. WinTR-55 uses the Kinematic Wave method for calculating storm runoff rates and volumes. 2. According to the Velocity Method, the
YELLOWSTONE RIVER FLOOD STUDY REPORT TEXT
 YELLOWSTONE RIVER FLOOD STUDY REPORT TEXT TECHNICAL REPORT Prepared for: City of Livingston 411 East Callender Livingston, MT 59047 Prepared by: Clear Creek Hydrology, Inc. 1627 West Main Street, #294
Limited Visual Dam Safety Inspections OA Oahu Reservoir No Oahu, Hawaii
 Limited Visual Dam Safety Inspections OA00137 Oahu Reservoir No. 155 Oahu, Hawaii Prepared by: U.S. ARMY CORPS OF ENGINEERS HONOLULU DISTRICT STATE OF HAWAII DEPARTMENT OF LAND AND NATURAL RESOURCES May
design, construction, operation, and maintenance of the BAP is consistent with recognized and generally accepted good engineering standards.
 design, construction, operation, and maintenance of the BAP is consistent with recognized and generally accepted good engineering standards. In addition to the field inspection, Associated Engineers, Inc.
Appendix E Guidance for Shallow Flooding Analyses and Mapping
 Appendix E Guidance for Shallow Flooding Analyses and Mapping E.1 Introduction Different types of shallow flooding commonly occur throughout the United States. Types of flows that result in shallow flooding
Chapter 7 Mudflow Analysis
 Chapter 7 Mudflow Analysis 7.0 Introduction This chapter provides information on the potential and magnitude of mud floods and mudflows that may develop in Aspen due to rainfall events, snowmelt, or rain
President s Day Weekend Storm Community Meeting and Workshop April 17, 2017
 President s Day Weekend Storm Community Meeting and Workshop April 17, 2017 Meeting outline 1. Progress update on the City of San Jose s recovery efforts 2. Water district presentation on: Weather situation
Technical Memorandum No
 Pajaro River Watershed Study in association with Technical Memorandum No. 1.2.10 Task: Evaluation of Four Watershed Conditions - Sediment To: PRWFPA Staff Working Group Prepared by: Gregory Morris and
LOCATED IN INDIAN RIVER COUNTY PREPARED FOR S.J.R.W.M.D. AND F.W.C.D. DECEMBER, 2003 Updated 2007 Updated May 2014 PREPARED BY
 FELLSMERE WATER CONTROL DISTRICT EAST MASTER DRAINAGE PLAN AND STORMWATER HYDROLOGIC ANALYSIS OF THE GRAVITY DRAINAGE SYSTEM LOCATED BETWEEN THE EAST BOUNDARY, LATERAL U, THE MAIN CANAL, AND DITCH 24 LOCATED
Sediment Trap. At multiple locations within the project site where sediment control is needed.
 Sediment Trap SE-3 Objectives EC Erosion Control SE Sediment Control TR Tracking Control WE Wind Erosion Control Non-Stormwater NS Management Control Waste Management and WM Materials Pollution Control
Coal Combustion Residuals Unit Inflow Design Flood Control System Plan
 Coal Combustion Residuals Unit Inflow Design Flood Control System Plan Virginia Electric and Power Company Chesterfield Power Station Upper (East) Pond Chesterfield County, Virginia GAI Project Number:
Summary of Hydraulic and Sediment-transport. Analysis of Residual Sediment: Alternatives for the San Clemente Dam Removal/Retrofit Project,
 Appendix N SUMMARY OF HYDRAULIC AND SEDIMENT-TRANSPORT ANALYSIS OF RESIDUAL SEDIMENT: ALTERNATIVES FOR THE SAN CLEMENTE DAM REMOVAL/RETROFIT PROJECT, CALIFORNIA the San Clemente Dam Removal/Retrofit Project,
Stage Discharge Tabulation for Only Orifice Flow
 Stage Discharge Tabulation for Only Orifice Flow DEPTH STAGE DISCHARGE (meters) (feet) (meters) (feet) (m 3 /s) (ft 3 /s) 0 0.20 0.40 0.60 0.80 1.00 1.20 1.40 1.60 1.80 2.00 0.7 1.3 2.0 2.6 3.3 3.9 4.6
UPPER COSUMNES RIVER FLOOD MAPPING
 UPPER COSUMNES RIVER FLOOD MAPPING DRAFT BASIC DATA NARRATIVE FLOOD INSURANCE STUDY SACRAMENTO COUTY, CALIFORNIA Community No. 060262 November 2008 Prepared By: CIVIL ENGINEERING SOLUTIONS, INC. 1325 Howe
Determination of Urban Runoff Using ILLUDAS and GIS
 Texas A&M University Department of Civil Engineering Instructor: Dr. Francisco Olivera CVEN689 Applications of GIS to Civil Engineering Determination of Urban Runoff Using ILLUDAS and GIS Tae Jin Kim 03.
Modeling Great Britain s Flood Defenses. Flood Defense in Great Britain. By Dr. Yizhong Qu
 Modeling Great Britain s Flood Defenses AIRCurrents Editor s note: AIR launched its Inland Flood Model for Great Britain in December 2008. The hazard module captures the physical processes of rainfall-runoff
L OWER N OOKSACK R IVER P ROJECT: A LTERNATIVES A NALYSIS A PPENDIX A: H YDRAULIC M ODELING. PREPARED BY: LandC, etc, LLC
 L OWER N OOKSACK R IVER P ROJECT: A LTERNATIVES A NALYSIS A PPENDIX A: H YDRAULIC M ODELING PREPARED BY: LandC, etc, LLC TABLE OF CONTENTS 1 Introduction... 1 2 Methods... 1 2.1 Hydraulic Model... 1 2.2
Rock Sizing for Small Dam Spillways
 Rock Sizing for Small Dam Spillways STORMWATER MANAGEMENT PRACTICES Photo 1 Rock-lined spillway on a construction site sediment basin Photo 2 Rock-lined spillway on a small farm dam 1. Introduction A chute
Sediment Trap. A temporary runoff containment area, which promotes sedimentation prior to discharge of the runoff through a stabilized spillway.
 Sediment Trap SC-15 Source: Caltrans Construction Site Best Management Practices Manual, 2003. Description A temporary runoff containment area, which promotes sedimentation prior to discharge of the runoff
Hydrology and Hydraulics Design Report. Background Summary
 To: National Park Services Montezuma Castle National Monument Richard Goepfrich, Facility Manager From: Multicultural Technical Engineers Date: Tuesday - February 13, 2018 Subject: 30% Hydrology and Hydraulics
REDWOOD VALLEY SUBAREA
 Independent Science Review Panel Conceptual Model of Watershed Hydrology, Surface Water and Groundwater Interactions and Stream Ecology for the Russian River Watershed Appendices A-1 APPENDIX A A-2 REDWOOD
3.0 TECHNICAL FEASIBILITY
 3.0 TECHNICAL FEASIBILITY 3.1 INTRODUCTION To enable seasonal storage and release of water from Lake Wenatchee, an impoundment structure would need to be constructed on the lake outlet channel. The structure
PRELIMINARY CULVERT ANALYSIS REPORT FOR CULVERT NO. 008-C OREGON AVENUE OVER PINEHURST CREEK
 PRELIMINARY CULVERT ANALYSIS REPORT FOR CULVERT NO. 008-C OREGON AVENUE OVER PINEHURST CREEK Prepared for The District of Columbia Department of Transportation Washington, D.C. Prepared by Parsons Transportation
ENGINEERING HYDROLOGY
 ENGINEERING HYDROLOGY Prof. Rajesh Bhagat Asst. Professor Civil Engineering Department Yeshwantrao Chavan College Of Engineering Nagpur B. E. (Civil Engg.) M. Tech. (Enviro. Engg.) GCOE, Amravati VNIT,
Chapter 7 Mudflow Analysis
 Chapter 7 Mudflow Analysis 7.0 Introduction This chapter provides information on the potential and magnitude of mud floods and mudflows that may develop in Aspen due to rainfall events, snowmelt, or rain
Attachment 3: Fragility Curve Determinations DRAFT
 Attachment 3: Fragility Curve Determinations DRAFT CELRC-TS-DG 4 October 2017 MEMORANDUM FOR PM-PL SUBJECT: Fragility Curve Determination for McCook Levee North and South of 47 th Street Introduction 1.
A Simple Procedure for Estimating Loss of Life from Dam Failure. Wayne J. Graham, P.E. 1
 A Simple Procedure for Estimating Loss of Life from Dam Failure Wayne J. Graham, P.E. 1 INTRODUCTION Evaluating the consequences resulting from a dam failure is an important and integral part of any dam
Objectives: After completing this assignment, you should be able to:
 Data Analysis Assignment #1 Evaluating the effects of watershed land use on storm runoff Assignment due: 21 February 2013, 5 pm Objectives: After completing this assignment, you should be able to: 1) Calculate
Appendix 15 Computational Methodology
 Appendix 15 Computational Methodology Introduction This Appendix describes the process used by the risk team to determine the final loss exceedence values in the risk analysis. The process involved the
Bushkill Creek 3 rd Street Dam Removal Analysis
 Bushkill Creek 3 rd Street Dam Removal Analysis HEC HMS Runoff and Routing Model Stephen Beavan, Melanie DeFazio, David Gold, Peter Mara and Dan Moran CE 421: Hydrology Fall 2010 December 15, 2010 Contents
LOMR SUBMITTAL LOWER NESTUCCA RIVER TILLAMOOK COUNTY, OREGON
 LOMR SUBMITTAL LOWER NESTUCCA RIVER TILLAMOOK COUNTY, OREGON Prepared for: TILLAMOOK COUNTY DEPARTMENT OF COMMUNITY DEVELOPMENT 1510-B THIRD STREET TILLAMOOK, OR 97141 Prepared by: 10300 SW GREENBURG ROAD,
9. Flood Routing. chapter Two
 9. Flood Routing Flow routing is a mathematical procedure for predicting the changing magnitude, speed, and shape of a flood wave as a function of time at one or more points along a watercourse (waterway
Suitable Applications Sediment traps should be considered for use:
 Categories EC Erosion Control SE Sediment Control TC Tracking Control WE Wind Erosion Control Non-Stormwater NS Management Control Waste Management and WM Materials Pollution Control Legend: Primary Objective
Certification Process for North Indio East Side Dike in the Coachella Valley
 Certification Process for North Indio East Side Dike in the Coachella Valley September 7, 2016 Brady McDaniel (Northwest Hydraulic Consultants) Contributors Andrey Shvidchenko, Brent Wolfe and Jimmy Pan
HURRICANE SANDY LIMITED REEVALUATION REPORT UNION BEACH, NEW JERSEY DRAFT ENGINEERING APPENDIX SUB APPENDIX A PRELIMINARY FLOODWALL DESIGN
 HURRICANE SANDY LIMITED REEVALUATION REPORT UNION BEACH, NEW JERSEY DRAFT ENGINEERING APPENDIX SUB APPENDIX A PRELIMINARY FLOODWALL DESIGN March 2014Revised March 2015 UNITED STATES ARMY CORPS OF ENGINEERS
ARTICLE 5 (PART 2) DETENTION VOLUME EXAMPLE PROBLEMS
 DETENTION VOLUME EXAMPLE PROBLEMS") ARTICLE 5 (PART 2) DETENTION VOLUME EXAMPLE PROBLEMS Example 5.7 Simple (Detention Nomograph) Example 5.8 Offsite and Unrestricted Areas (HEC-HMS) Example 5.9 Ponds in Series w/ Tailwater (HEC-HMS) Example
ARTICLE 5 (PART 2) DETENTION VOLUME EXAMPLE PROBLEMS Example 5.7 Simple (Detention Nomograph) Example 5.8 Offsite and Unrestricted Areas (HEC-HMS) Example 5.9 Ponds in Series w/ Tailwater (HEC-HMS) Example
Sacramento River Bank Protection Project
 2005 - FIELD RECONNAISSANCE REPORT OF BANK EROSION SITES - SACRAMENTO RIVER FLOOD CONTROL LEVEES AND TRIBUTARIES Sacramento River Bank Protection Project Project No. 32-0530.10, Task 3 Prepared for: U.S.
Attachment B to Technical Memorandum No.2. Operations Plan of Ross Valley Detention Basins
 Attachment B to Technical Memorandum No.2 Operations Plan of Ross Valley Detention Basins Operations Plan of Ross Valley Detention Basins Stetson Engineers Inc. January 26, 2011 1.0 Introduction Achieving
Stormwater Capacity Analysis for Westover Branch Watershed
 Stormwater Capacity Analysis for Westover Branch Watershed Pimmit Run Little Pimmit Run, Mainstem Stohman's Run Gulf Branch Pimmit Run Tributary Little Pimmit Run, W. Branch Little Pimmit Run, E. Branch
Design Storms for Hydrologic Analysis
 Design Storms for Hydrologic Analysis Course Description This course is designed to fulfill two hours of continuing education credit for Professional Engineers. Its objective is to provide students with
WATER MANAGEMENT REPORT FOR PAGE ESTATES
 WATER MANAGEMENT REPORT FOR PAGE ESTATES SLB Consulting of SW Florida, LLC PO Box 2826 Bonita Springs, FL. 34133 Phone: 239-948-9566 sandra@slbconsult.com C.O.A. # 25395 September 1, 2014 Sandra L. Bottcher
Rock Sizing for Batter Chutes
 Rock Sizing for Batter Chutes STORMWATER MANAGEMENT PRACTICES Photo 1 Rock-lined batter chute Photo 2 Rock-lined batter chute 1. Introduction In the stormwater industry a chute is a steep drainage channel,
Issue 44: Phase II & III H&H Issues Date: 07/03/2006 Page 1
 Background Phase I of the NCFMP studies have primarily focused on the coastal plain and sandhills physiographic regions in of the State. Phase II and III study areas will focus on the piedmont, foothills,
STORMWATER MANAGEMENT REPORT
 STORMWATER MANAGEMENT REPORT THE FAIRWAYS AT EDGEWOOD LOTS 5 & 6, BLOCK 1201 TOWNSHIP OF RIVER VALE BERGEN COUNTY, NEW JERSEY PREPARED BY: DAPHNE A. GALVIN PROFESSIONAL ENGINEER LICENSE NO. 24GE03434900
INTRODUCTION TO HYDROLOGIC MODELING USING HEC-HMS
 INTRODUCTION TO HYDROLOGIC MODELING USING HEC-HMS By Thomas T. Burke, Jr., PhD, PE Luke J. Sherry, PE, CFM Christopher B. Burke Engineering, Ltd. October 8, 2014 1 SEMINAR OUTLINE Overview of hydrologic
APPENDIX G APPENDIX G SEDIMENT CONTAINMENT SYSTEM DESIGN RATIONALE
 APPENDIX G SEDIMENT CONTAINMENT SYSTEM DESIGN RATIONALE March 18, 2003 This page left blank intentionally. March 18, 2003 G-2 FIGURES Page # Figure G.1 Estimated Runoff from Precipitation Over Different
GRAPEVINE LAKE MODELING & WATERSHED CHARACTERISTICS
 GRAPEVINE LAKE MODELING & WATERSHED CHARACTERISTICS Photo Credit: Lake Grapevine Boat Ramps Nash Mock GIS in Water Resources Fall 2016 Table of Contents Figures and Tables... 2 Introduction... 3 Objectives...
Report for Area Drainage Studies for 1320 MW (2x660 MW) THERMAL POWER PROJECT AT MIRZAPUR, U.P.
 THERMAL POWER PROJECT AT MIRZAPUR, U.P.") Report for Area Drainage Studies for 1320 MW (2x660 MW) THERMAL POWER PROJECT AT MIRZAPUR, U.P. 1. Introduction M/s Welspun Energy Uttar Pradesh Ltd. (WEUPL) is putting up 1320 MW (2 x 660 MW) coal fired
Report for Area Drainage Studies for 1320 MW (2x660 MW) THERMAL POWER PROJECT AT MIRZAPUR, U.P. 1. Introduction M/s Welspun Energy Uttar Pradesh Ltd. (WEUPL) is putting up 1320 MW (2 x 660 MW) coal fired
Louisiana s NIKE Approach to EAPs: Just Do It
 Louisiana s NIKE Approach to EAPs: Presented to: Just Do It 2007 Louisiana Transportation Engineering Conference Navigating the Waves of Change Tuesday, February 13, 2007 Baton Rouge River Center Presented
[1] Performance of the sediment trap depends on the type of outlet structure and the settling pond surface area.
![[1] Performance of the sediment trap depends on the type of outlet structure and the settling pond surface area.](/thumbs/76/74245181.jpg "[1] Performance of the sediment trap depends on the type of outlet structure and the settling pond surface area.") Sediment Trench SEDIMENT CONTROL TECHNIQUE Type 1 System Sheet Flow Sandy Soils Type 2 System [1] Concentrated Flow Clayey Soils Type 3 System [1] Supplementary Trap Dispersive Soils [1] Performance of
Sediment Trench SEDIMENT CONTROL TECHNIQUE Type 1 System Sheet Flow Sandy Soils Type 2 System [1] Concentrated Flow Clayey Soils Type 3 System [1] Supplementary Trap Dispersive Soils [1] Performance of
January 22, Coronado National Forest 300 West Congress Street Tucson, AZ Jim Upchurch, Forest Supervisor. Dear Mr.
 January 22, 2015 Coronado National Forest 300 West Congress Street Tucson, AZ 85701 Attn: Jim Upchurch, Forest Supervisor Dear Mr. Upchurch: In your letter dated January 16, 2015, you requested that Hudbay
NORTHUMBERLAND COUNTY, PA
 QUAKER RUN Stream and Wetland Restoration As-Built Completion Report and First Year Monitoring Data Coal Township NORTHUMBERLAND COUNTY, PA Upstream Before Upstream After Prepared for: COAL TOWNSHIP 805
NRC Workshop Probabilistic Flood Hazard Assessment (PFHA) Jan 29-31, Mel Schaefer Ph.D. P.E. MGS Engineering Consultants, Inc.
 Jan 29-31, Mel Schaefer Ph.D. P.E. MGS Engineering Consultants, Inc.") Stochastic Event Flood Model (SEFM) Stochastic Modeling of Extreme Floods A Hydrological Tool for Analysis of Extreme Floods Mel Schaefer Ph.D. P.E. MGS Engineering Consultants, Inc. Olympia, WA NRC Workshop
Stochastic Event Flood Model (SEFM) Stochastic Modeling of Extreme Floods A Hydrological Tool for Analysis of Extreme Floods Mel Schaefer Ph.D. P.E. MGS Engineering Consultants, Inc. Olympia, WA NRC Workshop
Tarbela Dam in Pakistan. Case study of reservoir sedimentation
 Tarbela Dam in Pakistan. HR Wallingford, Wallingford, UK Published in the proceedings of River Flow 2012, 5-7 September 2012 Abstract Reservoir sedimentation is a main concern in the Tarbela reservoir
Birecik Dam & HEPP Downstream River Arrangement R. Naderer, G. Scharler Verbundplan GmbH, 5021 Salzburg, Austria
 Birecik Dam & HEPP Downstream River Arrangement R. Naderer, G. Scharler Verbundplan GmbH, 5021 Salzburg, Austria e-mail: scharlerg@verbund.co.at Abstract Birecik Dam & HEPP on the Euphrates river in Turkey
USGS Flood Inundation Mapping of the Suncook River in Chichester, Epsom, Pembroke and Allenstown, New Hampshire
 USGS Flood Inundation Mapping of the Suncook River in Chichester, Epsom, Pembroke and Allenstown, New Hampshire NH Water & Watershed Conference Robert Flynn, USGS NH-VT Water Science Center March 23, 2012
Dam Break Analysis Using HEC-RAS and HEC-GeoRAS A Case Study of Ajwa Reservoir
 Journal of Water Resources and Ocean Science 2016; 5(6): 108-113 http://www.sciencepublishinggroup.com/j/wros doi: 10.11648/j.wros.20160506.15 ISSN: 2328-7969 (Print); ISSN: 2328-7993 (Online) Case Report
JUNE 2004 Flood hydrology of the Waiwhetu Stream
 JUNE 2004 Flood hydrology of the Waiwhetu Stream Laura Watts Resource Investigations Contents 1. Introduction 1 2. Catchment description 2 3. Data availability and quality 3 3.1 Rainfall data 3 3.2 Water
PONDNET.WK1 - Flow and Phosphorus Routing in Pond Networks
 PONDNET.WK1 - Flow and Phosphorus Routing in Pond Networks Version 2.1 - March 1989 William W. Walker, Jr. Ph.D., Environmental Engineer 1127 Lowell Road, Concord, Massachusetts 01742 508-369-8061 PONDNET.WK1
FRIENDS OF THE EEL RIVER
 FRIENDS OF THE EEL RIVER Working for the recovery of our Wild & Scenic River, its fisheries and communities. Frank Blackett, Regional Engineer Office of Energy Projects Division of Dam Safety and Inspections
VINCENT COOPER Flood Hazard Mapping Consultant
 FLOOD HAZARD MAPPING OF GRENADA FINAL REPORT (NON-TECHNICAL) By VINCENT COOPER Flood Hazard Mapping Consultant For the Caribbean Development Bank January, 2006 TABLE OF CONTENTS INTRODUCTION 1 METHODOLOGY
Stormwater Guidelines and Case Studies. CAHILL ASSOCIATES Environmental Consultants West Chester, PA (610)
") Stormwater Guidelines and Case Studies CAHILL ASSOCIATES Environmental Consultants West Chester, PA (610) 696-4150 www.thcahill.com Goals and Challenges for Manual State Stormwater Policy More Widespread
Stormwater Guidelines and Case Studies CAHILL ASSOCIATES Environmental Consultants West Chester, PA (610) 696-4150 www.thcahill.com Goals and Challenges for Manual State Stormwater Policy More Widespread
Rock Sizing for Waterway & Gully Chutes
 Rock Sizing for Waterway & Gully Chutes WATERWAY MANAGEMENT PRACTICES Photo 1 Rock-lined waterway chute Photo 2 Rock-lined gully chute 1. Introduction A waterway chute is a stabilised section of channel
Appendix O. Sediment Transport Modelling Technical Memorandum
 Appendix O Sediment Transport Modelling Technical Memorandum w w w. b a i r d. c o m Baird o c e a n s engineering l a k e s design r i v e r s science w a t e r s h e d s construction Final Report Don
LIQUEFACTION OF EARTH EMBANKMENT DAMS TWO CASE HISTORIES: (1) LIQUEFACTION OF THE EMBANKMENT SOILS, AND (2) LIQUEFACTION OF THE FOUNDATIONS SOILS
 LIQUEFACTION OF THE EMBANKMENT SOILS, AND (2) LIQUEFACTION OF THE FOUNDATIONS SOILS") LIQUEFACTION OF EARTH EMBANKMENT DAMS TWO CASE HISTORIES: (1) LIQUEFACTION OF THE EMBANKMENT SOILS, AND (2) LIQUEFACTION OF THE FOUNDATIONS SOILS Antonio Fernandez, Ph.D. 1 ABSTRACT Paul C. Rizzo Associates,
LIQUEFACTION OF EARTH EMBANKMENT DAMS TWO CASE HISTORIES: (1) LIQUEFACTION OF THE EMBANKMENT SOILS, AND (2) LIQUEFACTION OF THE FOUNDATIONS SOILS Antonio Fernandez, Ph.D. 1 ABSTRACT Paul C. Rizzo Associates,
UGRC 144 Science and Technology in Our Lives/Geohazards
 UGRC 144 Science and Technology in Our Lives/Geohazards Flood and Flood Hazards Dr. Patrick Asamoah Sakyi Department of Earth Science, UG, Legon College of Education School of Continuing and Distance Education
Technical Memorandum. To: From: Copies: Date: 10/19/2017. Subject: Project No.: Greg Laird, Courtney Moore. Kevin Pilgrim and Travis Stroth
 Technical Memorandum To: From: Greg Laird, Courtney Moore Kevin Pilgrim and Travis Stroth 5777 Central Avenue Suite 228 Boulder, CO 80301 www.otak.com Copies: [Electronic submittal] Date: 10/19/2017 Subject:
This is a digital document from the collections of the Wyoming Water Resources Data System (WRDS) Library.
 Library.") This is a digital document from the collections of the Wyoming Water Resources Data System (WRDS) Library. For additional information about this document and the document conversion process, please contact
This is a digital document from the collections of the Wyoming Water Resources Data System (WRDS) Library. For additional information about this document and the document conversion process, please contact
StreamStats: Delivering Streamflow Information to the Public. By Kernell Ries
 StreamStats: Delivering Streamflow Information to the Public By Kernell Ries U.S. Department of the Interior U.S. Geological Survey MD-DE-DC District 410-238-4317 kries@usgs.gov StreamStats Web Application
CASE STUDY #9 - Brushy Fork Dam, Sugar Grove, West Virginia
 CASE STUDY #9 - Brushy Fork Dam, Sugar Grove, West Virginia Brushy Fork Dam is a flood control structure built by the Soil Conservation Service southeast of the city of Franklin in Pendleton County, West
 Red River Flooding June 2015 Caddo and Bossier Parishes Presented by: Flood Technical Committee Where the Rain Falls Matters I-30 versus I-20 I-20 Backwater and Tributary Floods (Localized) 2016 Flood
WP2.1 BREACH FORMATION LARGE SCALE EMBANKMENT FAILURE
 WP2. BREACH FORMATION LARGE SCALE EMBANKMENT FAILURE Kjetil Arne Vaskinn, Sweco Gröner Norway Aslak Løvoll, Norconsult AS Norway Kaare Höeg, Norwegian Geotechnical Institute (NGI), Norway WP2. BREACH FORMATION
Rosgen Classification Unnamed Creek South of Dunka Road
 Rosgen Classification Unnamed Creek South of Dunka Road Prepared for Poly Met Mining Inc. September 2013 Rosgen Classification Unnamed Creek South of Dunka Road Prepared for Poly Met Mining Inc. September
DRAFT ONONDAGA LAKE CAPPING AND DREDGE AREA AND DEPTH INITIAL DESIGN SUBMITTAL H.4 SEISMIC SLOPE STABILITY ANALYSES
 DRAFT ONONDAGA LAKE CAPPING AND DREDGE AREA AND DEPTH INITIAL DESIGN SUBMITTAL H.4 SEISMIC SLOPE STABILITY ANALYSES Parsons P:\Honeywell -SYR\444576 2008 Capping\09 Reports\9.3 December 2009_Capping and
CONCEPTUAL AND TECHNICAL CHALLENGES IN DEFINING FLOOD PLANNING AREAS IN URBAN CATCHMENTS
 CONCEPTUAL AND TECHNICAL CHALLENGES IN DEFINING FLOOD PLANNING AREAS IN URBAN CATCHMENTS C Ryan 1, D Tetley 2, C Kinsey 3 1 & 2 Catchment Simulation Solutions, NSW 3 Co-ordinator Stormwater and Structural
Pequabuck River Flooding Study and Flood Mitigation Plan The City of Bristol and Towns of Plainville and Plymouth, CT
 Pequabuck River Flooding Study and Flood Mitigation Plan The City of Bristol and Towns of Plainville and Plymouth, CT Raymond Rogozinski and Maged Aboelata The City of Bristol and Towns of Plainville and
Engineering Hydrology
 Engineering Hydrology Prof. Rajesh Bhagat Asst. Professor Civil Engineering Department Yeshwantrao Chavan College Of Engineering Nagpur B. E. (Civil Engg.) M. Tech. (Enviro. Engg.) GCOE, Amravati VNIT,
GEOL 1121 Earth Processes and Environments
 GEOL 1121 Earth Processes and Environments Wondwosen Seyoum Department of Geology University of Georgia e-mail: seyoum@uga.edu G/G Bldg., Rm. No. 122 Seyoum, 2015 Chapter 6 Streams and Flooding Seyoum,
PENNSYLVANIA DEPARTMENT OF TRANSPORTATION ENGINEERING DISTRICT 3-0
 PENNSYLVANIA DEPARTMENT OF TRANSPORTATION ENGINEERING DISTRICT 3-0 LYCOMING COUNTY S.R.15, SECTION C41 FINAL HYDROLOGIC AND HYDRAULIC REPORT STEAM VALLEY RUN STREAM RELOCATION DATE: June, 2006 REVISED:
EFFICIENCY OF THE INTEGRATED RESERVOIR OPERATION FOR FLOOD CONTROL IN THE UPPER TONE RIVER OF JAPAN CONSIDERING SPATIAL DISTRIBUTION OF RAINFALL
 EFFICIENCY OF THE INTEGRATED RESERVOIR OPERATION FOR FLOOD CONTROL IN THE UPPER TONE RIVER OF JAPAN CONSIDERING SPATIAL DISTRIBUTION OF RAINFALL Dawen YANG, Eik Chay LOW and Toshio KOIKE Department of
2011 Flood: Technical Review of Lake Manitoba, Lake St. Martin and Assiniboine River Water Levels Summary
 2011 Flood: Technical Review of Lake Manitoba, Lake St. Martin and Assiniboine River Water Levels Summary October 2013 Introduction Manitoba experienced unprecedented flooding in 2011. While flooding was
Chapter 10 - Sacramento Method Examples
 Chapter 10 Sacramento Method Examples Introduction Overview This chapter presents two example problems to demonstrate the use of the Sacramento method. These example problems use the SACPRE and HEC-1 computer
The Stochastic Event Flood Model Applied to Minidoka Dam on the Snake River, Idaho
 The Stochastic Event Flood Model Applied to Minidoka Dam on the Snake River, Idaho K. L. Bullard 1, M. G. Schaeffer 2, B. A. Barker 3, D. Sutley 4, and V. Leverson 5 1 Bureau of Reclamation, Flood Hydrology
Submitted to: St. Johns River Power Park New Berlin Road Jacksonville, FL 32226
 RUN-ON/RUN-OFF CONTROL SYSTEM PLAN RUN-ON AND RUN-OFF CONTROL SYSTEM PLAN St. Johns River Power Park Byproduct Storage Area B Phase I Development Submitted to: St. Johns River Power Park 11201 New Berlin
Lecture 14: Floods. Key Questions
 Lecture 14: Floods Key Questions 1. What is an upstream flood? 2. What is a downstream flood? 3. What were the setup conditions that cause floods? 4. What is a 100-year flood? 5. How are 100-year flood