ICEBERGS IN THE BARENTS SEA
|
|
|
- Lewis Boone
- 5 years ago
- Views:
Transcription

1 ICEBERGS IN THE BARENTS SEA Mapping ice and snow conditions in the Barents Sea, part-report 1 Icebergs Leif J Dalsgaard, Petroleum Safety Authority Norway Tore Syversen, Sintef Mars
2 Goals Achieve better understanding of the extent of and uncertainty about icebergs and growlers (ice chunks below 200t) in the Barents Sea. Achieve better understanding of methods for mapping and forecasting snow and ice, and acquire experience data from other relevant sectors and operations elsewhere. 2

3 Contents Background and goals Classification Lifecycle Ocean currents and temperatures in the Barents Sea Historical observations Sizes Seasonal variations Southernmost positions Relationship between the occurrence of sea ice and icebergs Probable developments in their occurrence 3
4 Size classification Description Sail height [m] Length at waterline [m] Typical mass [tonnes] Comparison Growler <1 <5 <200 Small car Bergy bit See attached Word file x10 3 Small house Small iceberg x10 3-4x10 5 Office building Medium-sized iceberg x10 5-5x10 6 Hotel Large iceberg x10 6-2x10 7 Shopping centre Very large iceberg >75 >200 >2x10 7 Big hotel complex 4
5 Size distribution of icebergs in the Barents Sea More than 70% of observed icebergs are bergy bits Growlers are assumed to be under-reported The commonest type of large iceberg is tabular in shape Source: Abramov, V, Atlas of Arctic icebergs, Backbone Publishing Company,


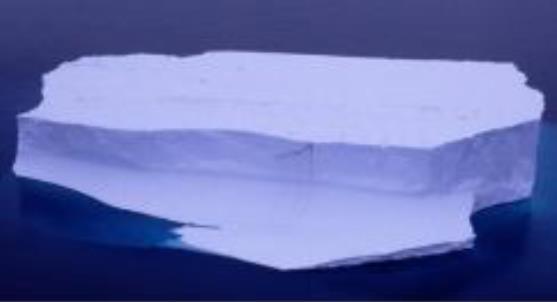
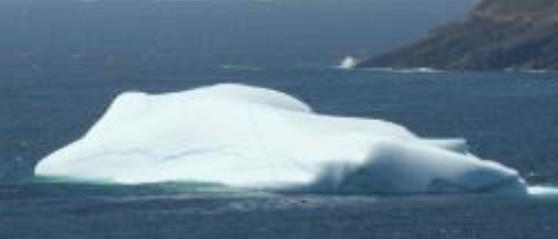
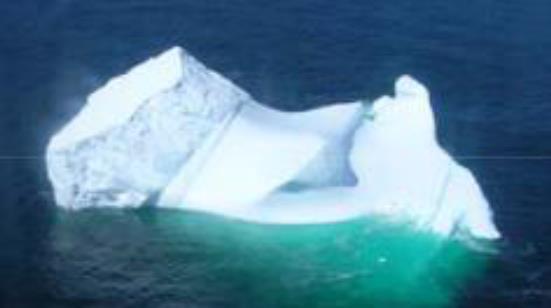
6 Iceberg shapes Tabular Pinnacle Wedged Drydocked Blocky Domed Non-tabular 6
![Origins Svalbard Austfonna, Kvitøya, Edgeøya, Kong Karls Land Annual production about 4km 3 [1] Franz Josef Land About 40 ice-covered islands Annual production about 4.](/docs-images/84/89327807/images/7-0.jpg "4km 3 [2] Novaya Zemlya North-western part Annual production about 1.")
7 Origins Svalbard Austfonna, Kvitøya, Edgeøya, Kong Karls Land Annual production about 4km 3 [1] Franz Josef Land About 40 ice-covered islands Annual production about 4.4km 3 [2] Novaya Zemlya North-western part Annual production about 1.5km 3 [2] At least icebergs are produced annually in the Barents Sea 7 [1] Hagen, J O et al, Glaciers in Svalbard: Mass balance, runoff and freshwater flux, Polar Research vol 22, pp , [2]Kubyshkin, N V et al, Determination of the area of generation of big icebergs in the Barents Sea Temperature distribution analysis, Proc 16th International Offshore and Polar Engineering Conference, San Francisco, pp , 2006.
![Iceberg drift Core temperature from original glacier is preserved [1] Icebergs drift because of currents and winds From ICEBASE: average speed 0.25m/s, maximum speed 1.](/docs-images/84/89327807/images/8-0.jpg "4m/s [1] Tidal influences generally give icebergs a circular pattern of movement [2] Simulations show that 77% of the icebergs go aground, mostly around the calving area and in the area between")
8 Iceberg drift Core temperature from original glacier is preserved [1] Icebergs drift because of currents and winds From ICEBASE: average speed 0.25m/s, maximum speed 1.4m/s [1] Tidal influences generally give icebergs a circular pattern of movement [2] Simulations show that 77% of the icebergs go aground, mostly around the calving area and in the area between Svalbard and Hopen [2] Average lifetime is 241 days [3] 8 [1] Løseth, S and Carstens, T, Sea ice and iceberg observations in the western Barents Sea in 1987, Cold Regions Science and Technology 24, pp , [2] Zubakin, G K et al, Estimates of ice and iceberg spreading in the Barents Sea, 14th International Offshore and Polar Engineering Conference, Toulon, May [3] Keghouche, I et al, Modelling dynamics and thermodynamics of icebergs in the Barents Sea from 1987 to 2005, Journal of Geophysical Research, vol 115, C12062, 2010.

9 Depth conditions in the Barents Sea The Barents Sea is relatively shallow average depth 230m Deepest in the west between the Finnmark coast and Bear Island Shallow east of Svalbard Spitsbergen Bank 30-60m Storbanken m Sentralbanken m Polar front largely determined by depth conditions in the west 9

10 Sea temperature and ocean currents The Polar front forms the interface between cold Arctic water and the warmer Atlantic water The front is more diffuse and variable in the eastern area Atlantic water is warmer and has a higher salt content than the Arctic water North winds affect the amount of Atlantic water entering from the south Coastal water and currents along the Finnmark coast 10
11 Decay mechanisms Splitting Iceberg splits in two or into several large pieces Calving Iceberg loses many small components Melting Especially at the waterline Depends on water temperature, waves and currents Main cause of iceberg decay in the Barents Sea 11
12 Speed of decay Simulations show that an iceberg loses 79% of its mass in 4 days at a sea temperature of 11.9 C and wave heights of 5m At 1.1 C, 19% of the mass is lost under the same conditions [1] Icebergs surrounded by ice melt at a far slower rate [1] Kubat, I et al, An operational iceberg deterioration model, Proc 16th Int Offshore and Polar Engineering Conference, Lisbon, pp ,

13 , average of 52 observations per year Aerial observations stepped up from 1951 Since 1951, average of 600 observations per year Since 1950, average of 54 flights per year Observations per expedition highest in 1955, 1960, 1987 and 1991 That could be because these were years with many icebergs, but also because the expeditions were concentrated in areas which normally have many icebergs

14 Other campaigns ICEBASE 1987 Three field campaigns in winter/autumn Investigated ice conditions in the western Barents Sea, initiated by oil companies Results included identifying drift speeds for two icebergs IDAP Built on ICEBASE, initiated by OKN Found more icebergs than expected in 1988, particularly on the Spitsbergen Bank A number of expeditions to Franz Josef Land SNOP Norwegian-Soviet collaboration Some iceberg observations Generally speaking, little reported 14
15 Extreme southern positions South of 75 N 1929 and 2003, south of 70 N 1963, 1971 and 1989, south of 72 N Average southernmost position 73.1 N [1] 1881 was also a year when icebergs were observed off Tromsø [1] Zubakin, G K et al, Icebergs of the western sector of the Russian Arctic, Proc 18th Int Conf on Port and Ocean Eng Under Arctic Conditions, vol 2, pp , Portland, [2] Buzin, I V and Zubakin, G K, Estimation of extreme severe ice seasons, second year ice and icebergs in the Barents Sea and area of Shtokman deposit, Third Norway Russia Arctic Offshore Workshop, St Petersburg, [3] Spring, W and Sangolt, A, Results of the ice data acquisition program (IDAP) in the Barents Sea , Proc 12th Int Conf on Port and Ocean Eng Under Arctic Conditions, vol 1, pp , Hamburg, Most of these southernmost occurrences can be attributed to north winds blowing over long periods [2][3] 15

16 Occurrence of icebergs in Barents South-East Icebergs have been observed in or close to Barents South-East in seven of the past 90 years This is the observed figure. We do not know the actual occurrence Bergy bits and growlers are likely to occur in years when sea ice reaches particularly far south 16
17 Some extreme southern positions of icebergs 17 Source: Zubakin, G K et al, Spatial distribution of icebergs in the Barents Sea based on archived data and observations of 2003, Proc 18th International Conference on Port and Ocean Engineering Under Arctic Conditions (POAC-05), vol 2, pp , 2005.
18 Probable development The quantity of warm, salty Atlantic water has increased over the past 30 years at the expense of Arctic water [1] The Polar front in the eastern Barents Sea appears to be retreating north [1] A substantial reduction in ice extent has occurred over the past 30 years[2] Various climate models show that ice extent will continue to retreat in coming years, but with a possible advance from 2030 [3] Warmer water and less extensive ice indicate a lower frequency of icebergs south of 75 N [1] Oziel, L et al, The Barents Sea frontal zones and water masses variability ( ), Ocean Science, vol 12, pp , [2] Polyak, L et al, History of sea ice in the Arctic, Quaternary Science Reviews (2010), doi: /j.quascirev [3] Hughes, N E and Wagner, P M, Kunnskap og varsling av isutbredelse og isfjell Barentshavet SØ og Jan Mayen, MET Report 26, ISSN ,


19 Satellite detection Synthetic aperture radar (SAR) with dual mode is used to detect icebergs Sentinel 1-A and 1-B provide good coverage of the Barents Sea. The EW mode gives 40m resolution across a 400km breadth, daily coverage as in the image below right The IW mode gives 40m resolution down to 5m across a 250km breadth, but not on a daily basis EW mode is standard, while IW must be booked in advance Higher resolution generally means a smaller coverage area and longer between each satellite pass Sentinel-1 is freely available. Successors to RADARSAT-2 are planned in
20 Existing services DMI has operational services for detecting icebergs around Greenland, which also cover a small part of the northern Barents Sea Specify the number of icebergs in an area of 10x10km 80 N Does not detect icebergs embedded in ice Ships can potentially be identified as icebergs Can detect icebergs with a minimum size of 40m 75 N 10 E 15 E 20 E 25 E 30 E 35 E 20

21 Conclusions Icebergs in the southern Barents Sea originate mainly in Franz Josef Land They are relatively small compared with the Antarctic, and the great majority are bergy bits North winds are the main cause of long-distance iceberg drift in the Barents Sea The Polar front separates Arctic water from warmer and saltier Atlantic water Icebergs which drift into Atlantic water will experience accelerated melting Warm water combined with waves have the biggest impact on iceberg decay Reliable observations of icebergs in or close to Barents South-East have been made in seven of the past 90 years A possible correlation exists between iceberg occurrences to the south and the southernmost extent of sea ice Icebergs larger than 40m can be detected from satellites. Icebergs as small as 5m can be detected, but such satellite images must be booked in advance and only cover a small area 21
Ice surveys, meteorological and oceanographic data What is available and up-to-date?
 Ice surveys, meteorological and oceanographic data What is available and up-to-date? Leader of the Norwegian Ice Service +47 77 62 13 15 - nick.hughes@met.no Norwegian Meteorological Institute met.no 1
Determination of the Area of Generation of Big Icebergs in the Barents Sea Temperature Distribution Analysis
 Proceedings of the Sixteenth (6) International Offshore and Polar Engineering Conference San Francisco, California, USA, May 28-June 2, 6 Copyright 6 by The International Society of Offshore and Polar
Regional Sea Ice Outlook for Greenland Sea and Barents Sea - based on data until the end of May 2013
 Regional Sea Ice Outlook for Greenland Sea and Barents Sea - based on data until the end of May 2013 Sebastian Gerland 1*, Max König 1, Angelika H.H. Renner 1, Gunnar Spreen 1, Nick Hughes 2, and Olga
Modeling dynamics and thermodynamics of icebergs in the Barents Sea from 1987 to 2005
 JOURNAL OF GEOPHYSICAL RESEARCH, VOL. 115,, doi:10.1029/2010jc006165, 2010 Modeling dynamics and thermodynamics of icebergs in the Barents Sea from 1987 to 2005 I. Keghouche, 1 F. Counillon, 1 and L. Bertino
Monitoring Sea Ice with Space-borne Synthetic Aperture Radar
 Monitoring Sea Ice with Space-borne Synthetic Aperture Radar Torbjørn Eltoft UiT- the Arctic University of Norway CIRFA A Centre for Research-based Innovation cirfa.uit.no Sea ice & climate Some basic
Claim: Arctic, antarctic and Greenland ice loss is accelerating due to global warming REBUTTAL
 Claim: Arctic, antarctic and Greenland ice loss is accelerating due to global warming REBUTTAL Satellite and surface temperature records and sea surface temperatures show that both the East Antarctic Ice
THE INCORPORATION OF AN OCEAN TEMPERATURE PROFILE INTO AN EXISTING ICEBERG DETERIORATION MODEL CANADA CANADA
 POAC 11 Montréal, Canada Proceedings of the 21 st International Conference on Port and Ocean Engineering under Arctic Conditions July 10-14, 2011 Montréal, Canada THE INCORPORATION OF AN OCEAN TEMPERATURE
APPENDIX B PHYSICAL BASELINE STUDY: NORTHEAST BAFFIN BAY 1
 APPENDIX B PHYSICAL BASELINE STUDY: NORTHEAST BAFFIN BAY 1 1 By David B. Fissel, Mar Martínez de Saavedra Álvarez, and Randy C. Kerr, ASL Environmental Sciences Inc. (Feb. 2012) West Greenland Seismic
Floating Ice: Progress in Addressing Science Goals
 Polar Floating Ice: Progress in Addressing Science Goals Stephen Howell 1, Leif Toudal Pedersen 2 and Roberto Saldo 3 1 Environment Canada, Climate Research Division, Toronto, Canada 2 Danish Meteorological
Validation of sea ice concentration in the myocean Arctic Monitoring and Forecasting Centre 1
 Note No. 12/2010 oceanography, remote sensing Oslo, August 9, 2010 Validation of sea ice concentration in the myocean Arctic Monitoring and Forecasting Centre 1 Arne Melsom 1 This document contains hyperlinks
Grosvenor Teacher Fellowship: A Life-Changing Expedition to the Arctic By Jenny Bolch
 Grosvenor Teacher Fellowship: A Life-Changing Expedition to the Arctic By Jenny Bolch Hearing the thunderous crash of a glacier calving next to you, in the bright sunlight of midnight, isn't something
Ocean Circulation. In partnership with Dr. Zafer Top
 Ocean Circulation In partnership with Dr. Zafer Top Samantha Hampton Honors Science December 15, 2014 Ocean Circulation is the large scale movement of waters in the ocean basins. Dr. Zafer Top studies
U. S. Department of Commerce National Oceanic and Atmospheric Administration
 Observers Guide to U. S. Department of Commerce National Oceanic and Atmospheric Administration National Ocean Service Office of Response and Restoration National Environmental Satellite, Data, and Information
Polar Portal Season Report 2016
 Polar Portal Season Report 2016 Less ice both on land and at sea This year s report is the fourth since the Polar Portal was launched, and as an introduction, we have chosen to take a look at the trends
Measuring recent dynamic behaviour of Svalbard glaciers to investigate calving and surging
 Measuring recent dynamic behaviour of Svalbard glaciers to investigate calving and surging Adrian Luckman, Swansea University, UNIS Doug Benn, Heidi Sevestre, University of St Andrews Suzanne Bevan, Swansea
SNOW DEPTH AND SURFACE CONDITIONS OF AUSTFONNA ICE CAP (SVALBARD) USING FIELD OBSERVATIONS AND SATELLITE ALTIMETRY
 USING FIELD OBSERVATIONS AND SATELLITE ALTIMETRY") SNOW DEPTH AND SURFACE CONDITIONS OF AUSTFONNA ICE CAP (SVALBARD) USING FIELD OBSERVATIONS AND SATELLITE ALTIMETRY Alexei Kouraev (1,2), Benoît Legrésy (1), Frédérique Rémy (1), Andrea Taurisano (3,4),
SNOW DEPTH AND SURFACE CONDITIONS OF AUSTFONNA ICE CAP (SVALBARD) USING FIELD OBSERVATIONS AND SATELLITE ALTIMETRY Alexei Kouraev (1,2), Benoît Legrésy (1), Frédérique Rémy (1), Andrea Taurisano (3,4),
EO-Based Ice and Iceberg Monitoring in Support of Offshore Engineering Design and Tactical Operations
 EO-Based Ice and Iceberg Monitoring in Support of Offshore Engineering Design and Tactical Operations Desmond Power, C-CORE ESA Industry Workshop on Satellite EO for the Oil and Gas Sector Overview Operations
Sep May Ppt Anomaly (N = 60)
") balance (annual net balance and its summer/winter components) measures how climate affects the health of Arctic glaciers. As most 2007 08 measurements are not yet available, we report results for the 2006
balance (annual net balance and its summer/winter components) measures how climate affects the health of Arctic glaciers. As most 2007 08 measurements are not yet available, we report results for the 2006
Cruise Report R/V Oceania, AREX 2007
 Powstańców Warszawy 55, PL - 81-712 Sopot, P.O. Box 68 March 15, 2008 Cruise Report R/V Oceania, AREX 2007 Ship: R/V Oceania Cruise: AREX 2007 Dates: 19.06.2007 05.08.2007 Port Calls: Gdansk (Poland) Longyearbyen
NASA Images of Antarctica and the Arctic covered in both land and sea ice
 ICE SHELVES ACTIVITY 1: DECODING THE ROLE OF ANTARCTIC ICE IN GLOBAL CLIMATE Ice Shelves play a critical role in Antarctica, serving as a buffer between the ocean and the continental ice sheet covering
A Synthesis of Results from the Norwegian ESSAS (N-ESSAS) Project
 Project") A Synthesis of Results from the Norwegian ESSAS (N-ESSAS) Project Ken Drinkwater Institute of Marine Research Bergen, Norway ken.drinkwater@imr.no ESSAS has several formally recognized national research
A Synthesis of Results from the Norwegian ESSAS (N-ESSAS) Project Ken Drinkwater Institute of Marine Research Bergen, Norway ken.drinkwater@imr.no ESSAS has several formally recognized national research
Forecasting Polar Lows. Gunnar Noer The Norwegian Meteorological Institute in Tromsø
 Forecasting Polar Lows Gunnar Noer The Norwegian Meteorological Institute in Tromsø Longyearbyen Hopen Bear Island Jan Mayen Tromsø Gunnar Noer Senior forecaster / developer for polar meteorology The Norwegian
Freeze-Up Studies of the Alaskan Beaufort and Chukchi Seas: through Coastal Frontiers Corporation Vaudrey & Associates, Inc.
 Freeze-Up Studies of the Alaskan Beaufort and Chukchi Seas: 2009-10 through 2015-16 Coastal Frontiers Corporation Vaudrey & Associates, Inc. Joint-Industry Sponsors U.S. Department of the Interior Bureau
Where is Earth s Water?
 PASSAGE 1 Where is Earth s Water? Our planet contains a limited amount of water that is always in motion. The water that comes out of your faucet moved through the atmosphere, flowed across Earth s surface,
Sea ice concentration off Dronning Maud Land, Antarctica
 Rapportserie nr. 117 Olga Pavlova and Jan-Gunnar Winther Sea ice concentration off Dronning Maud Land, Antarctica The Norwegian Polar Institute is Norway s main institution for research, monitoring and
Polar Portal Season Report 2013
 Polar Portal Season Report 2013 All in all, 2013 has been a year with large melting from both the Greenland Ice Sheet and the Arctic sea ice but not nearly as large as the record-setting year of 2012.
The Ocean Floor THE VAST WORLD OCEAN
 OCEANOGRAPHY Name Color all water LIGHT BLUE. Color all land LIGHT GREEN. Label the 5 Oceans: Pacific, Atlantic, Indian, Arctic, Antarctic. Label the 7 Continents: N.America, S.America, Europe, Asia, Africa,
Arctic Adaptation Research Considerations and Challenges
 Arctic Adaptation Research Considerations and Challenges Dr Grete K. Hovelsrud, Research Director CICERO- Center for International Climate and Environmental Research Oslo, Norway Many Strong Voices Stakeholder
Earth Observation + Artificial Intelligence = Smart Society 2.0
 Earth Observation + Artificial Intelligence = Smart Society 2.0 Dag Anders Moldestad Norwegian Space Centre Dag.anders.moldestad@spacecentre.no 22 51 18 09 Automatic sea ice analysis based on AMSR2 & Sentinel-1
The importance of long-term Arctic weather station data for setting the research stage for climate change studies
 The importance of long-term Arctic weather station data for setting the research stage for climate change studies Taneil Uttal NOAA/Earth Systems Research Laboratory Boulder, Colorado Things to get out
Weather and ice information as a tool for arctic marine and offshore services
 Weather and ice information as a tool for arctic marine and offshore services World Meteorological Organization Executive Council Panel of Experts on Polar Observations, Research and Services President
Exemplar for Internal Achievement Standard. Mathematics and Statistics Level 3
 Exemplar for internal assessment resource Mathematics and Statistics for Achievement Standard 91580 Exemplar for Internal Achievement Standard Mathematics and Statistics Level 3 This exemplar supports
1. Oceans. Example 2. oxygen.
 1. Oceans a) Basic facts: There are five oceans on earth, making up about 72% of the planet s surface and holding 97% of the hydrosphere. Oceans supply the planet with most of its oxygen, play a vital
WATER FLUXES THROUGH THE BARENTS SEA. Harald Loengl), Vladimir Ozhigin2) and Bjørn Ådlandsvikl)
, Vladimir Ozhigin2) and Bjørn Ådlandsvikl)") ICES C.M. 1995 CM 1995/Mini:lO WATER FLUXES THROUGH THE BARENTS SEA by Harald Loengl), Vladimir Ozhigin2) and Bjørn Ådlandsvikl) l)lnstitute of Marine Research, P.O. Box 1870 Nordnes, 5024 Bergen, Norway
ICES C.M. 1995 CM 1995/Mini:lO WATER FLUXES THROUGH THE BARENTS SEA by Harald Loengl), Vladimir Ozhigin2) and Bjørn Ådlandsvikl) l)lnstitute of Marine Research, P.O. Box 1870 Nordnes, 5024 Bergen, Norway
Dates and Positions of Polar lows over the Nordic Seas between 2000 and 2010
 no. 16/2010 Polar Lows Dates and Positions of Polar lows over the Nordic Seas between 2000 and 2010 Gunnar Noer and Trond Lien report Title Dates and positions of polar lows over the Nordic Seas between
Risk factors, risk types and the probability of unwanted accidents in the Arctic
 Risk factors, risk types and the probability of unwanted accidents in the Arctic Nataliya A Marchenko, The University Centre in Svalbard, Longyearbyen, Norway 1 Navigation Safety and Risk Assessment Challenges
Climate. Annual Temperature (Last 30 Years) January Temperature. July Temperature. Average Precipitation (Last 30 Years)
 January Temperature. July Temperature. Average Precipitation (Last 30 Years)") Climate Annual Temperature (Last 30 Years) Average Annual High Temp. (F)70, (C)21 Average Annual Low Temp. (F)43, (C)6 January Temperature Average January High Temp. (F)48, (C)9 Average January Low Temp.
Climate Annual Temperature (Last 30 Years) Average Annual High Temp. (F)70, (C)21 Average Annual Low Temp. (F)43, (C)6 January Temperature Average January High Temp. (F)48, (C)9 Average January Low Temp.
BRÂNDUŞA CHIOTOROIU 1, E. ȘEMȘEDIN 2
 Riscuri şi catastrofe, an XV, vol. 19, nr. 2/2016 Information on weather and sea conditions onboard polar cruise ships BRÂNDUŞA CHIOTOROIU 1, E. ȘEMȘEDIN 2 ABSTRACT. Information on weather and sea conditions
Chapter 2. Changes in Sea Level Melting Cryosphere Atmospheric Changes Summary IPCC (2013)
") IPCC (2013) Ice is melting faster (sea ice, glaciers, ice sheets, snow) Sea level is rising More ocean heat content More intense rainfall More severe drought Fewer frosts More heat waves Spring is arriving
IPCC (2013) Ice is melting faster (sea ice, glaciers, ice sheets, snow) Sea level is rising More ocean heat content More intense rainfall More severe drought Fewer frosts More heat waves Spring is arriving
IMPACTS OF A WARMING ARCTIC
 The Earth s Greenhouse Effect Most of the heat energy emitted from the surface is absorbed by greenhouse gases which radiate heat back down to warm the lower atmosphere and the surface. Increasing the
Laboratory Benchmark for Models of the Transport in the Kara Sea
 Laboratory Benchmark for Models of the Transport in the Kara Sea Thomas McClimans SINTEF Civil and Environmental Engineering N-7465 Trondheim Norway voice: +47 73592417 fax: +47 73 592376 email: thomas.mcclimans@civil.sintef.no
The State of the cryosphere
 The State of the cryosphere Course outline Introduction The cryosphere; what is it? The Earth; a unique planet Cryospheric components Classifications Lecture outlines The State of the cryosphere The State
1. Introduction 2. Organization of the meeting 3. Project aims, hypothesis and structure 4. AWAKE phases 5. Project prolongation? 6.
 Second meeting 1. Introduction 2. Organization of the meeting 3. Project aims, hypothesis and structure 4. AWAKE phases 5. Project prolongation? 6. Additional measurements? 7. Papers!!!!! 8. EGU 2015 9.
GEOGRAPHY OCEAN TYPES OF OCEANS Economics Importance of Oceans to Man Relief of the ocean floor Continental Shelf Importance of Continental Shelf
 GEOGRAPHY OCEAN The oceans and seas occupy about 71 per cent of the total earth surface which means that about 29 percent of the earth s surface is occupied by the land. The study of the oceans. The water
Z046 Seismic Characteristics of Gas Migration Structures on the North Atlantic Margin Imaged by High-resolution 3D Seismic
 Z046 Seismic Characteristics of Gas Migration Structures on the North Atlantic Margin Imaged by High-resolution 3D Seismic O.K. Eriksen* (P-Cable 3D Seismic), C. Berndt (IFM-GEOMAR), S. Buenz (University
Sentinel-1 Mission Status
 Sentinel-1 Mission Status Pierre Potin, Sentinel-1 Mission Manager, ESA Luca Martino, Technical Support Engineer, ESA... and the Sentinel-1 operations team PSTG SAR Coordination Working Group 14 December
SEVERE WEATHER AND FRONTS TAKE HOME QUIZ
 1. Most of the hurricanes that affect the east coast of the United States originally form over the A) warm waters of the Atlantic Ocean in summer B) warm land of the southeastern United States in summer
Polar Portal Season Report 2018
 Polar Portal Season Report 2018 Unusual weather resulted in an atypical melting season in the Arctic The 2017-18 season in the Arctic has once again been extraordinary. A cold summer with high levels of
Detection, tracking and study of polar lows from satellites Leonid P. Bobylev
 Detection, tracking and study of polar lows from satellites Leonid P. Bobylev Nansen Centre, St. Petersburg, Russia Nansen Centre, Bergen, Norway Polar lows and their general characteristics International
Surface Circulation Ocean current Surface Currents:
 All Write Round Robin G1. What makes up the ocean water? G2. What is the source of the salt found in ocean water? G3. How does the water temperature affect the density of ocean water? G4. How does the
What are the consequences of melting pack ice?
 The Hydrosphere s Cryosphere: A-Pack Ice: (Sea Ice) They are large sheets of ice found in the oceans around Antarctica and in the Arctic Ocean. Smaller ones are called ice floes. Example 1: What are the
Ice sheet freshwater forcing
 Jan Lenaerts Utrecht University University of Colorado Ice sheet freshwater forcing Photo: Reijmer, 2011 Sea level meeting 5 to ~6 pm, South Bay Goal: Sea level rise and its impacts on coastal populations
Challenges for SAR operations in the Barents Sea. Tor Einar Berg, Beate Kvamstad
 Challenges for SAR operations in the Barents Sea Tor Einar Berg, Beate Kvamstad MARINTEK, Trondheim, Norway, Tor.E.Berg@marintek.sintef.no This paper gives a brief overview of challenges in SAR operations
Physical Oceanography
 Physical Oceanography SECTION 15.1 The Oceans In your textbook, read about modern oceanography. For each item in Column A, write the letter of the matching item in Column B. e b c d a Column A 1. German
Remote Sensing 4 Global mass changes from remote sensing
 Remote Sensing 4 Global mass changes from remote sensing Nick Barrand School of Geography, Earth & Environmental Sciences University of Birmingham, UK Why glacier mass changes? o Water resources o Energy
Update on Climate Science. Professor Richard Betts, Met Office
 Update on Climate Science Professor Richard Betts, Met Office The science of climate change Crown copyright Met Office Prof Richard Betts Head of Climate Impacts Research Crown copyright Met Office Observing
The History of Svalbard - Exercise 2017
 Mandatory exercise. 66 % correct answers required to pass for final exam. *Required 1. Email address * 2. Student Name (Last name, first name) * Discovery and early history 3. According to Norwegian tradition
Chapter 1 Section 2. Land, Water, and Climate
 Chapter 1 Section 2 Land, Water, and Climate Vocabulary 1. Landforms- natural features of the Earth s land surface 2. Elevation- height above sea level 3. Relief- changes in height 4. Core- most inner
Brita Horlings
 Knut Christianson Brita Horlings brita2@uw.edu https://courses.washington.edu/ess431/ Natural Occurrences of Ice: Distribution and environmental factors of seasonal snow, sea ice, glaciers and permafrost
Laivan nimi Kausi Lähtöpäivä Kohde Risteilyn nimi Midnatsol 18/ EUROPE The Treasures of Portugal Midnatsol 18/ EUROPE
 Midnatsol 18/19 2018-03-31 EUROPE The Treasures of Portugal Midnatsol 18/19 2018-04-10 EUROPE Azores, Madeira, Canary Islands - Atlantic Island Exploration Midnatsol 18/19 2018-04-24 EUROPE Portugal, Spain,
3. Climate Change. 3.1 Observations 3.2 Theory of Climate Change 3.3 Climate Change Prediction 3.4 The IPCC Process
 3. Climate Change 3.1 Observations 3.2 Theory of Climate Change 3.3 Climate Change Prediction 3.4 The IPCC Process 3.1 Observations Need to consider: Instrumental climate record of the last century or
Canadian Ice Service
 Canadian Ice Service Key Points and Details concerning the 2009 Arctic Minimum Summer Sea Ice Extent October 1 st, 2009 http://ice-glaces.ec.gc.ca 1 Key Points of Interest Arctic-wide The Arctic-wide minimum
REPORT OF JOINT RUSSIAN/NORWEGIAN AERIAL SURVEYS IN THE BARENTS SEA IN SEPTEMBER 2001
 T E P O R T IE R 2002 E IN JO R I S I M R / PI NRO S REPORT OF JOINT RUSSIAN/NORWEGIAN AERIAL SURVEYS IN THE BARENTS SEA IN SEPTEMBER 2001 Institute of Marine Research - IMR Polar Research Institute of
Climate Change in Newfoundland & Labrador
 Climate Change in Newfoundland & Labrador Impacts and Adaptation Newleef Conference 08 October 2015 Met-Ocean Services The Team 55 personnel; 24/7 operational weather forecast desk; Equipment technician
ICES Journal of Marine Science
 ICES Journal of Marine Science ICES Journal of Marine Science (2012), 69(5), 833 840. doi:10.1093/icesjms/fss075 Atlantic water temperature and climate in the Barents Sea, 2000 2009 Vladimir D. Boitsov,
Operational ice charting in mid-latitudes using Near-Real-Time SAR imagery
 Operational ice charting in mid-latitudes using Near-Real-Time SAR imagery Sergey Vernyayev Ice Engineer ICEMAN.KZ Carles Debart Project Manager Energy, Environment and Security Yevgeniy Kadranov Ice charting
Regional Outlook for the Bering-Chukchi-Beaufort Seas Contribution to the 2018 Sea Ice Outlook
 Regional Outlook for the Bering-Chukchi-Beaufort Seas Contribution to the 2018 Sea Ice Outlook 25 July 2018 Matthew Druckenmiller (National Snow and Ice Data Center, Univ. Colorado Boulder) & Hajo Eicken
Ocean & Sea Ice SAF. Validation of ice products January September Version 1.0. September 2004
 Ocean & Sea Ice SAF Validation of ice products January 2002 - September 2004 Version 1.0 September 2004 Keld Q. Hansen, Morten Lind, Søren Andersen 1 INTRODUCTION... 3 2 PRODUCTS VALIDATION METHODS...
Determination of sea ice sensitivity to warm ocean currents through the Barents Sea using SSM/I and SAR imagery
 Geoinformation for European-wide Integration, Benes (ed.) 2003 Millpress, Rotterdam, ISBN 90-77017-71-2 Determination of sea ice sensitivity to warm ocean currents through the Barents Sea using SSM/I and
This satellite image of an Ellesmere Island glacier that reaches the sea in the Greely Fjord reveals growing meltwater ponds on the glacier's surface
 This satellite image of an Ellesmere Island glacier that reaches the sea in the Greely Fjord reveals growing meltwater ponds on the glacier's surface as well as icebergs that have calved off the glacier
Snow cover measurement and variation analysis
 Snow cover measurement and variation analysis Konosuke Sugiura / Associate Professor, University of Toyama Fig.1 The rapid progression of snow cover extent in the northern hemisphere in October 2012. Red:
Currents & Gyres Notes
 Currents & Gyres Notes Current A river of water flowing in the ocean. 2 Types of Currents Surface Currents wind-driven currents that occur in the top 100m or less Deep Currents density-driven currents
The surface of the ocean floor is as varied as the land. The five major oceans, from largest to smallest, are
 11.1 Ocean Basins The surface of the ocean floor is as varied as the land. The five major oceans, from largest to smallest, are w the Pacific w the Atlantic w the Indian w the Southern w the Arctic The
Arctic sea ice falls below 4 million square kilometers
 SOURCE : http://nsidc.org/arcticseaicenews/ Arctic sea ice falls below 4 million square kilometers September 5, 2012 The National Snow and Ice Data Center : Advancing knowledge of Earth's frozen regions
Chapter outline. Reference 12/13/2016
 Chapter 2. observation CC EST 5103 Climate Change Science Rezaul Karim Environmental Science & Technology Jessore University of science & Technology Chapter outline Temperature in the instrumental record
EONav Satellite data in support of maritime route optimization
 EONav Satellite data in support of maritime route optimization Leif Eriksson Department of Space, Earth and Environment Chalmers University of Technology Outline Why is maritime navigation support needed?
Features of dense water cascades off the Arctic shelves
 V.V.Ivanov,3, G.I.Shapiro, Features of dense water cascades off the Arctic shelves. School of Earth Ocean and Environmental Science, University of Plymouth, UK. P.P. Shirshov Institute of Oceanology RAS,
The Southern Ocean. Copyright 2010 LessonSnips
 The Southern Ocean Even though oceanographers currently define five oceans on earth, in reality there is but one ocean. The fact that the ocean is one single entity and the divisions of the ocean are man-made
How Will Melting Ice Sheets Affect Us?
 PASSAGE 4 How Will Melting Ice Sheets Affect Us? Variation is normal. During the last ice age, for example, ice sheets also covered much of North America and Scandinavia. Why is what s happening now different
Distribution and Variability of Icebergs in the Eastern Davis Strait 63 N to 68 N
 Greenland Survey 2001-1 Distribution and Variability of Icebergs in the Eastern Davis Strait 63 N to 68 N Bureau of Minerals and Petroleum Prepared by Håkon Gjessing Karlsen and Jørgen Bille-Hansen Greenland
In the Realm of the Polar Bear
 In the Realm of the Polar Bear Experience the incredible scenery of Svalbard s most remote regions. On this circumnavigation of Spitsbergen you will be able to view the low-hanging Midnight Sun creating
Earth Science and Climate Change
 Earth Science and Climate Change Dr. Mary L. Cleave February 7, 2007 YOU ARE HERE 3 Land Use Changes Over Time Lingering Doubts on Temperature Trends Have Been Resolved 1st CCSP Synthesis & Assessment
After losing huge amount, Greenland ice is melting faster than ever
 After losing huge amount, Greenland ice is melting faster than ever By Washington Post, adapted by Newsela staff on 01.05.16 Word Count 861 A melting iceberg floats along a fjord leading away from the
ICE is less dense than water about 92% of the density of water; it floats. This is unlike the behavior of most substances, which generally are denser
 ICE is less dense than water about 92% of the density of water; it floats. This is unlike the behavior of most substances, which generally are denser as solids than as liquids (right). This is a result
Arctic oceanography; the path of North Atlantic Deep Water
 Chapter 7 Arctic oceanography; the path of North Atlantic Deep Water The importance of the Southern Ocean for the formation of the water masses of the world ocean poses the question whether similar conditions
ATOC OUR CHANGING ENVIRONMENT Class 19 (Chp 6) Objectives of Today s Class: The Cryosphere [1] Components, time scales; [2] Seasonal snow
![ATOC OUR CHANGING ENVIRONMENT Class 19 (Chp 6) Objectives of Today s Class: The Cryosphere [1] Components, time scales; [2] Seasonal snow](/thumbs/95/126309683.jpg "ATOC OUR CHANGING ENVIRONMENT Class 19 (Chp 6) Objectives of Today s Class: The Cryosphere [1] Components, time scales; [2] Seasonal snow") ATOC 1060-002 OUR CHANGING ENVIRONMENT Class 19 (Chp 6) Objectives of Today s Class: The Cryosphere [1] Components, time scales; [2] Seasonal snow cover, permafrost, river and lake ice, ; [3]Glaciers and
ATOC 1060-002 OUR CHANGING ENVIRONMENT Class 19 (Chp 6) Objectives of Today s Class: The Cryosphere [1] Components, time scales; [2] Seasonal snow cover, permafrost, river and lake ice, ; [3]Glaciers and
How will climate change affect the Cold Water Prawn?
 INTERNATIONAL COLD WATER PRAWN FORUM 2013 How will climate change affect the Cold Water Prawn? Paul Wassmann The Arctic Ocean: decisive facts in express speed Photo: R. Caeyers The worlds largest and broadest
Heat in the Barents Sea: transport, storage, and surface fluxes
 Author(s) 2010. This work is distributed under the Creative Commons Attribution 3.0 License. Ocean Science Heat in the Barents Sea: transport, storage, and surface fluxes L. H. Smedsrud 1, R. Ingvaldsen
There and back again. An illustration of needs for cross-scale and cross-discipline collaboration and data sharing
 There and back again. An illustration of needs for cross-scale and cross-discipline collaboration and data sharing Late-summer distribution of freshwater (blue) around Svalbard, from model simulations.
VIDEO/LASER HELICOPTER SENSOR TO COLLECT PACK ICE PROPERTIES FOR VALIDATION OF RADARSAT SAR BACKSCATTER VALUES
 VIDEO/LASER HELICOPTER SENSOR TO COLLECT PACK ICE PROPERTIES FOR VALIDATION OF RADARSAT SAR BACKSCATTER VALUES S.J. Prinsenberg 1, I.K. Peterson 1 and L. Lalumiere 2 1 Bedford Institute of Oceanography,
CMIP5-based global wave climate projections including the entire Arctic Ocean
 CMIP5-based global wave climate projections including the entire Arctic Ocean 1 ST International Workshop ON Waves, storm Surges and Coastal Hazards Liverpool, UK, 10-15 September 2017 Mercè Casas-Prat,
Ice on Earth: An overview and examples on physical properties
 Ice on Earth: An overview and examples on physical properties - Ice on Earth during the Pleistocene - Present-day polar and temperate ice masses - Transformation of snow to ice - Mass balance, ice deformation,
A Warming Arctic: Regional Drama with Global Consequences
 A Warming Arctic: Regional Drama with Global Consequences Norway: Temperature in March was 3,8 C above the normal, 4th highest since 1900 Monthly precipitation for Norway was 120 % above the normal Temperaturein
Water balance studies in two catchments on Spitsbergen, Svalbard
 120 Northern Research Basins Water Balance (Proceedings of a workshop held at Victoria, Canada, March 2004). IAHS Publ. 290, 2004 Water balance studies in two catchments on Spitsbergen, Svalbard ÀNUND
Ocean & Sea Ice SAF. Validation of ice products January March Version 1.1. May 2005
 Ocean & Sea Ice SAF Validation of ice products January 2002 - March 2005 Version 1.1 May 2005 Morten Lind, Keld Q. Hansen, Søren Andersen 1 INTRODUCTION... 3 2 PRODUCTS VALIDATION METHODS... 3 3 GENERAL
Warmer, wetter, wilder Arctic heritage
 Nordic Conference on Climate Change Adaptation Climate change in the Arctic: Warmer, wetter, wilder Arctic heritage Anne-Cathrine Flyen Anne-Cathrine Flyen Architect/Researcher Building preservation, climate
Ice Observations on the Churchill River using Satellite Imagery
 CGU HS Committee on River Ice Processes and the Environment 15 th Workshop on River Ice St. John s, Newfoundland and Labrador, June 15-17, 2009 Ice Observations on the Churchill River using Satellite Imagery
Tore Henriksen a & Geir Ulfstein b a Faculty of Law, University of Tromsø, Tromsø, Norway. Available online: 18 Feb 2011
 This article was downloaded by: [Bibliotheek van het Vredespaleis] On: 03 May 2012, At: 03:44 Publisher: Taylor & Francis Informa Ltd Registered in England and Wales Registered Number: 1072954 Registered
SEA ICE AND GLOBAL WARMING
 jkjk SEA ICE AND GLOBAL WARMING Lesson plan for grades K- 3 By: Laura Sanders, Environmental Science Institute, March 2011 Length of lesson: two 30- minute class periods SOURCES AND RESOURCES: Atmospheric
Appendix 1: UK climate projections
 Appendix 1: UK climate projections The UK Climate Projections 2009 provide the most up-to-date estimates of how the climate may change over the next 100 years. They are an invaluable source of information