OFFICE DE CONSULTATION PUBLIQUE DE MONTRÉAL
|
|
|
- Clare Park
- 5 years ago
- Views:
Transcription
1 OFFICE DE CONSULTATION PUBLIQUE DE MONTRÉAL September 4, 2013 MOJTABA SAMIMI 1


2 Objectives To demonstrate the remarkable effects of the Sun in complex climate of Montréal. To improve the quality of the city for the people using simple practical solutions. To advance the solar-climatic guidelines in different scale for future design. 2
3 Introduction Method and Analysis Conclusion 3
4 Introduction Facts and Factors: Current and future challenges: Energy resources, Energy efficiency, Pollution, Heat island effect, Climate change, Global warming, etc. The role of climatic response of a city in providing health, comfort and safety for people inside and outside buildings. Bold effect of municipalities, urban planners, architects and landscape architects in the process of decision making and decision taking. 4
5 Problem Definition Passive solutions: to receive more from the Sun in cold times and to be protected in hot times (Comfort factors). Active solutions: to receive more from the pure and unlimited energy of the Sun (Energy efficiency). To put the active and the passive strategies into a dialectical relationship to fashion a culture of Solar-Climatic Vision that traverses the scales, like the sun itself, from human scale to the urban and territorial as well as global scale. 5
6 Method and Analysis Basics SOLARCHVISION Analysis A new approach for solar-climatic analysis of indoor and outdoor spaces in different scales: human scale, building scale, urban scale, etc. 6

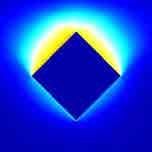
7 Montréal Sun Path 7

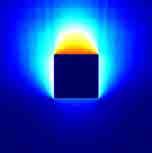
8 Montréal Solar Radiation Direct Beam ( ) 8

 Le Corbusier")
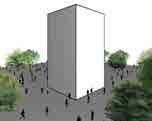
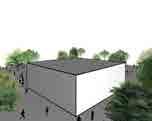
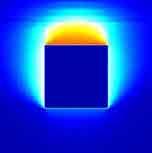
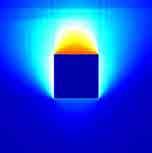
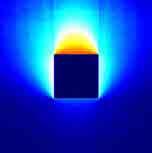
9 Montréal Solar +/- Effects Direct Beam ( ) Le Corbusier drawing 9

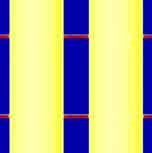
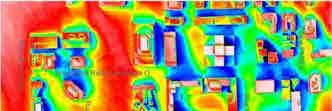
10 Montréal Pattern of Direct Solar Radiation: 70 s 10
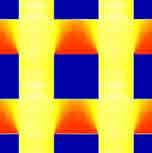
11 Montréal Pattern of Direct Solar Radiation: 80 s 11
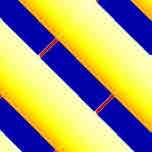
12 Montréal Pattern of Direct Solar Radiation: 90 s 12
13 Montréal Pattern of Direct Solar Radiation: 2000 s 13
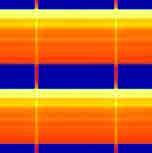
14 Montréal Pattern of Air Temperature Radiation: 70 s 14
15 Montréal Pattern of Air Temperature Radiation: 80 s 15
16 Montréal Pattern of Air Temperature Radiation: 90 s 16
17 Montréal Pattern of Air Temperature Radiation: 2000 s 17
18 Montréal Low and High Temperatures in 2003 (a year with remarkable minimum and maximum temperatures) 18
19 Montréal Solar Radiation Model in 2003 (a year with remarkable minimum and maximum temperatures) 19
20 Munich Solar Radiation Model in Typical Meteorological Year Data Source: US Department of Energy The sunniest city of Germany has much less in comparison with Montréal 20
21 Montréal Solar Radiation Model in Typical Meteorological Year Data Source: US Department of Energy 21
, National Climate Data and Information Archive of Canada - CWEEDS files")
22 Normalization of Direct Beam Radiation (from June 21 to December 21) in Quebec - Canada Data Source: Long Term Data ( ), National Climate Data and Information Archive of Canada - CWEEDS files 22
 in Quebec - Canada Data")

23 Normalization of Direct Beam Radiation (from December 21 to June 21) in Quebec - Canada Data Source: Long Term Data ( ), National Climate Data and Information Archive of Canada - CWEEDS files 23
24 Montréal Change in Solar Positive and Negative Effects through Decades: 70 24
25 Montréal Change in Solar Positive and Negative Effects through Decades: 80 s 25
26 Montréal Change in Solar Positive and Negative Effects through Decades: 90 s 26
27 Montréal Change in Solar Positive and Negative Effects through Decades: 2000 s 27


28 Montréal Total Daily Solar Radiation On Different Directions & Slopes December 21 N W S E N March 21 N W S E N June 21 N W S E N 28


29 Montréal Yearly Diagrams for Different Directions & Slopes Total Solar Radiation N W S E N Optimized Active Analysis N W S E N Optimized Passive Analysis N W S E N 29
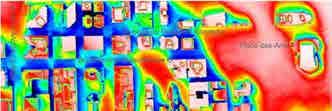
30 1. Solar-climatic Spatial Analysis for Montréal 2. Montréal Case Studies Urban spaces: Montréal Downtown (from Bell Center to Place-des-Arts). Open spaces: Mount Royal Chalet (Kondiaronk Belvedere). Building spaces: Fontaine School at Nuns' Island (OCPM open project). 30
31 Montréal Year-Cycle Indoor Analysis of Different Proportions and Orientations 31


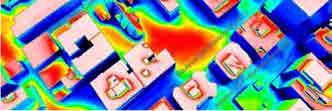
32 Montréal Year-Cycle Outdoor Analysis of Different Proportions and Orientations Constant Floor Plans & Volume 32

33 Montréal Year-Cycle Outdoor Analysis of Different Proportions and Orientations in Fabric Constant Floor Plans & Volume 33


34 Montréal Year-Cycle Analysis of Different Heights and Orientations Constant Floor Plans & Volume 34


35 Montréal Year-Cycle Analysis of Different Heights and Orientations in Fabric Constant Floor Plans & Volume 35


36 Montréal Year-Cycle Analysis of Different Heights and Orientations Variable Volumes with Constant Roof Plan 36


37 Montréal Year-Cycle Analysis of Different Heights and Orientations in Fabric Variable Volumes with Constant Roof Plan 37


38 TORONTO Comparison and Analysis of Different Urban Fabric the General Orientations in Toronto and Montréal Source: GoogleEarth MONTRÉAL 38


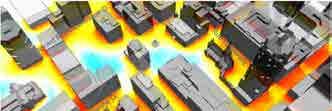
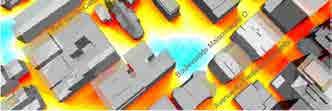
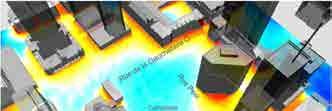
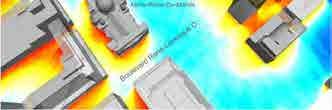
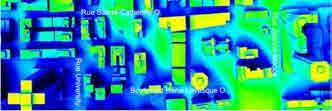
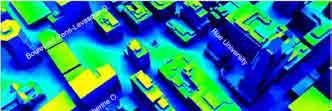
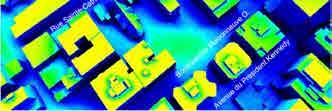
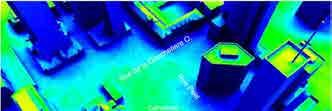
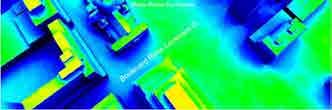
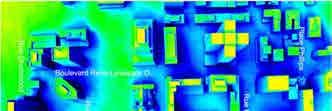
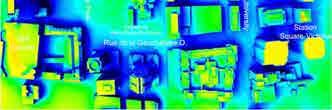
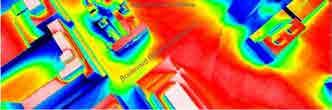
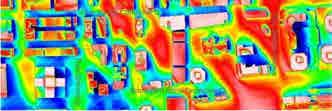
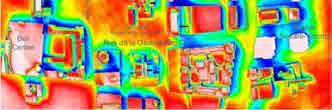
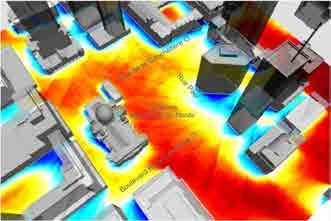
39 Year-Cycle Analysis of Downtown Urban Fabric 39

40 Reflector design to increase performance of solar collectors and PVs (instaled almost vertical) to minimize snow and dust on the surface of the collector. Year-Cycle Analysis Reflector design to bring daylight to the dark side of the buildings and urban areas. 40
41 Year-Cycle Analysis 41
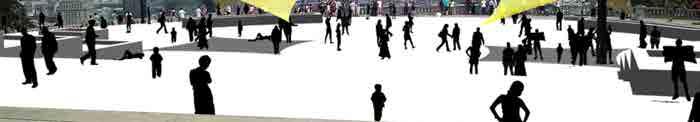
42 Year-Cycle Radiation Model 42

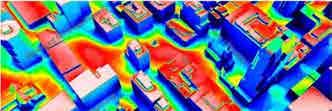
43 Summer Radiation Model 43


44 Summer Analysis: from June 21 to Sep


45 Summer Analysis of Downtown Urban Fabric: : from June 21 to September 22 45

46 Summer Analysis of Downtown Urban Fabric: from June 21 to September 22 46
47 Summer Analysis of Downtown Urban Fabric: from June 21 to September 22 47

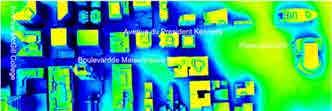
48 Winter Analysis of Downtown Urban Fabric: from December 21 to March 21 48

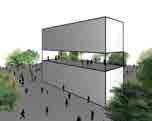
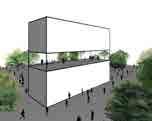
49 Mount Royal Chalet Summer Analysis Image source: maps.google.ca View to Mount Royal Chalet 49


50 Mount Royal Chalet Summer Analysis Image source: maps.google.ca 1 st Alternative 50
51 Mount Royal Chalet Summer Analysis Image source: maps.google.ca 2 nd Alternative 51

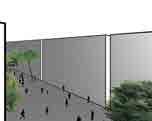
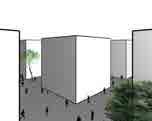
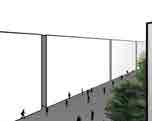
52 Mount Royal Chalet Tensile structures can protect the visitors from the rain and the snow in several months of the year. In winter they also let desirable sun rays hit the ground. On the other side, in summer they protect visitors from the undesirable solar radiation during the day. Moreover attractive dynamic perspectives would be created from different points of the site and the city during the day and night. 2 nd Alternative 52

53 Mount Royal Chalet Tensile structures can protect the visitors from the rain and the snow in several months of the year. In winter they also let desirable sun rays hit the ground. On the other side, in summer they protect visitors from the undesirable solar radiation during the day. Moreover attractive dynamic perspectives would be created from different points of the site and the city during the day and night. 1 st Alternative 53


54 View from Mount Royal Chalet 54
55 1 st Alternative 55


56 2 nd Alternative 56
57 Current Orientation Fontaine School at Nuns' Island (OCPM open project). 57

.")
58 Current Orientation Second Choice Fontaine School at Nuns' Island (OCPM open project). 58
.")
59 Current Orientation Second Choice Better Classrooms Better Classrooms Fontaine School at Nuns' Island (OCPM open project). 59


60 Better Playground Better Classrooms Fontaine School at Nuns' Island (OCPM open project). 60
61 Active Analysis: Plot of Solar Radiation Comparison of Hourly Plots on the Openings at Different Direction of two Choices Passive Analysis: Plot of Solar +/- Effects 61
62 Active Analysis: Plot of Solar Radiation Comparison of Daily Plots on the Openings at Different Direction of two Choices Passive Analysis: Plot of Solar +/- Effects 62
63 55% decrease in received solar radiation in June! Active Analysis: Plot of Solar Radiation Comparison of Total Daily Plots on the All Openings of two Choices of the School Project Passive Analysis: Plot of Solar +/- Effects 55% decrease in received negative effects of the Sun in July! 50% increase in received positive effects of the Sun in January! 63
64 Conclusion Necessity of basic researches and applied guidelines on solar-climatic planning. Necessity of solar-climatic analysis and design optimization to improve comfort and energy efficiency in different stages of design as well as different scales: (urban planning, architectural design and landscape architecture) 64
65 Solar Radiation, Solar Effects Climatic Response, Energy Efficiency, Comfort, Health, Safety, Global Warming, Heat Island Effect, Human Scale, Building Scale, City Scale, Province Scale, Global Scale Urban Planning, Architectural Design, Landscape Architecture, Design Analysis, Form Finding, Performance Optimization, Reflectors, Solar Collectors, Shading Devices, Trees, Tensile Structures, Benches, Bus Stops, Pedestrians, Public Spaces 65
66 66
67 Merci Beaucoup Les Montréalaises!. Special thanks to Kaveh Rashidzadeh for his intellectual assistance from Paris. 67
68 References CWEEDS files (Canadian Weather Energy and Engineering Datasets) for different stations in Canada between 1953 and TMY-EPW files for different stations around the world from US Department of Energy. "SOLARCHVISION Studies on Young Cities Project Book, SAMIMI M., NASROLLAHI F., TU-Berlin, External and Internal Solar-Climatic Performance Analysis of Building Geometries using SOLARCHVISION Paper, SAMIMI M., NILI M.Y., NASROLLAHI F., PARVIZSEDGHY L., VAHABI-MOGHADDAM D., CISBAT 2011, EPFL University, Lausanne, Switzerland. "A New Approach for Solar Analysis of Buildings Paper, SAMIMI M., PARVIZSEDGHY L. & ADIB A., WORLDCOMP'08 The 2008 International Conference on Software Engineering Research & Practice. Website of Office de consultation publique de Montréal: 68
PREDICTING OVERHEATING RISK IN HOMES
 PREDICTING OVERHEATING RISK IN HOMES Susie Diamond Inkling Anastasia Mylona CIBSE Simulation for Health and Wellbeing 27th June 2016 - CIBSE About Inkling Building Physics Consultancy Susie Diamond Claire
Why the Earth has seasons. Why the Earth has seasons 1/20/11
 Chapter 3 Earth revolves in elliptical path around sun every 365 days. Earth rotates counterclockwise or eastward every 24 hours. Earth closest to Sun (147 million km) in January, farthest from Sun (152
SEASONAL AND DAILY TEMPERATURES
 1 2 3 4 5 6 7 8 9 10 11 12 SEASONAL AND DAILY TEMPERATURES Chapter 3 Earth revolves in elliptical path around sun every 365 days. Earth rotates counterclockwise or eastward every 24 hours. Earth closest
Section 1: Overhang. Sizing an Overhang
 Section 1: Overhang A horizontal overhang is a straightforward method for shading solar glazing in summer. Passive heating strategies call for major glazed areas (solar glazing) in a building to be oriented
Institut national des sciences appliquées de Strasbourg GENIE CLIMATIQUE ET ENERGETIQUE APPENDICES
 Institut national des sciences appliquées de Strasbourg GENIE CLIMATIQUE ET ENERGETIQUE APPENDICES DEVELOPMENT OF A TOOL, BASED ON THE THERMAL DYNAMIC SIMULATION SOFTWARE TRNSYS, WHICH RUNS PARAMETRIC
Laboratory Exercise #7 - Introduction to Atmospheric Science: The Seasons and Daily Weather
 Laboratory Exercise #7 - Introduction to Atmospheric Science: The Seasons and Daily Weather page - Section A - Introduction: This lab consists of questions dealing with atmospheric science. We beginning
A Typical Meteorological Year for Energy Simulations in Hamilton, New Zealand
 Anderson T N, Duke M & Carson J K 26, A Typical Meteorological Year for Energy Simulations in Hamilton, New Zealand IPENZ engineering trenz 27-3 A Typical Meteorological Year for Energy Simulations in
Atmospheric Composition and Structure
 Atmospheric Composition and Structure Weather and Climate What is weather? The state of the atmosphere at a specific time and place. Defined by: Humidity, temperature, wind speed, clouds, precipitation,
L.O: EARTH'S 23.5 DEGREE TILT ON ITS AXIS GIVES EARTH ITS SEASONS March 21 (SPRING), June 21(SUMMER), Sept 22 (AUTUMN) & Dec 21(WINTER)
, June 21(SUMMER), Sept 22 (AUTUMN) & Dec 21(WINTER)") L.O: EARTH'S 23.5 DEGREE TILT ON ITS AXIS GIVES EARTH ITS SEASONS March 21 (SPRING), June 21(SUMMER), Sept 22 (AUTUMN) & Dec 21(WINTER) 1. The apparent daily path of the Sun changes with the seasons because
L.O: EARTH'S 23.5 DEGREE TILT ON ITS AXIS GIVES EARTH ITS SEASONS March 21 (SPRING), June 21(SUMMER), Sept 22 (AUTUMN) & Dec 21(WINTER) 1. The apparent daily path of the Sun changes with the seasons because
Seasons Page 520. A. What Causes Seasons?
 Seasons Page 520 A. What Causes Seasons? 1. Seasons are caused by the tilt of the earth s axis as it moves around the sun. 2. Seasons happen because the Earth is tilted on its axis at a 23.5 angle. 3.
PAUL RUDOLPH Oriental Masonic Gardens
 1 PAUL RUDOLPH Oriental Masonic Gardens Latitude _ 41.3 N Longitude _ 72.9 W Climate: transition between Cfa _ Humid Subtropical and Dfa_ Humid Continental climate 2 Paul Rudolph INTRODUCTION Fig. 1 -
Considerations of Urban Design and Microclimate in Historical Buildings Environment under Climate Change
 Considerations of Urban Design and Microclimate in Historical Buildings Environment under Climate Change Research team: Dr. Esther H.K. Yung, Mr. Z.N. Tan, Dr. C.K. Chau, Prof. Edwin, H.W. Chan Department
The quantification of shading for the built environment in South Africa
 Contents The quantification of shading for the built environment in South Africa 25 October 2018 Dr. Dirk Conradie Email: dconradi@csir.co.za Presentation Content Aim of research Climate maps Passive design
Temporal and Spatial Distribution of Tourism Climate Comfort in Isfahan Province
 2011 2nd International Conference on Business, Economics and Tourism Management IPEDR vol.24 (2011) (2011) IACSIT Press, Singapore Temporal and Spatial Distribution of Tourism Climate Comfort in Isfahan
Hourly Solar Radiation Analysis of Buildings within 48 Facings in FuZhou, China
 UIA 2017 Seoul World Architects Congress O-0201 ourly Solar Radiation Analysis of Buildings within 48 Facings in FuZhou, China Chou, Chia-Peng *1, Yu, Zhihong * 2 1 Professor, College of Architecture and
Vertical Illuminance Measurement for Clear Skies in Tehran
 Armanshahr Architecture & Urban Development, 5(8), 11-19, Spring Summer 2012 ISSN: 2008-5079 Vertical Illuminance Measurement for Clear Skies in Tehran Mohammadjavad Mahdavinejad 1*, Soha Matoor 2 and
1 A 3 C 2 B 4 D. 5. During which month does the minimum duration of insolation occur in New York State? 1 February 3 September 2 July 4 December
 INSOLATION REVIEW 1. The map below shows isolines of average daily insolation received in calories per square centimeter per minute at the Earth s surface. If identical solar collectors are placed at the
Laboratory Exercise #7 - Introduction to Atmospheric Science: The Seasons
 Laboratory Exercise #7 - Introduction to Atmospheric Science: The Seasons page - 1 Section A - Introduction: This lab consists of both computer-based and noncomputer-based questions dealing with atmospheric
TILT, DAYLIGHT AND SEASONS WORKSHEET
 TILT, DAYLIGHT AND SEASONS WORKSHEET Activity Description: Students will use a data table to make a graph for the length of day and average high temperature in Utah. They will then answer questions based
Daylight and Sun Study
 Ulleråker Existing project Daylight and Sun Study 2018-03-20 New Proposal Shadow Range Analysis from sunrise to sunset on 21st of June for existing condition and new proposal. Daylight Facts Quality: -
Page 1. Name:
 Name: 1) What is the primary reason New York State is warmer in July than in February? A) The altitude of the noon Sun is greater in February. B) The insolation in New York is greater in July. C) The Earth
Experimental and Theoretical Study on the Optimal Tilt Angle of Photovoltaic Panels
 Experimental and Theoretical Study on the Optimal Tilt Angle of Photovoltaic Panels Naihong Shu* 1, Nobuhiro Kameda 2, Yasumitsu Kishida 2 and Hirotora Sonoda 3 1 Graduate School, Kyushu Kyoritsu University,
Practice Questions: Seasons #1
 1. Seasonal changes on Earth are primarily caused by the A) parallelism of the Sun's axis as the Sun revolves around Earth B) changes in distance between Earth and the Sun C) elliptical shape of Earth's
ANALYSIS OF HUMAN THERMAL CONDITIONS IN WINTER FOR DIFFERENT URBAN STRUCTURES IN ERZURUM
 ANALYSIS OF HUMAN THERMAL CONDITIONS IN WINTER FOR DIFFERENT URBAN STRUCTURES IN ERZURUM Prof. Dr. Hasan Yılmaz Assist. Prof. Dr. Nalan D. Yıldız Assist. Prof. Dr. Ugur Avdan Res. Assist. Ahmet Koç Prof.
Name Date. What s the weather like today? Watch the beginning of the video Basics of geography- climate.
 FACTORS THAT INFLUENCE CLIMATE worksheet 1 STARTER Look at the weather symbols and answer: What s the weather like today? WHAT S CLIMATE? Watch the beginning of the video Basics of geography- climate.
CLIMATE OVERVIEW. Thunder Bay Climate Overview Page 1 of 5
 CLIMATE OVERVIEW The climate in the Thunder Bay area is typical of a mid-latitude inland location with a Great Lake Moderating influence. The moderating effect of Lake Superior results in cooler summer
Investigating Climate Change
 Teacher s Notes Summary Aims Activities Teacher info Timing Resources Curriculum links Differentiation Investigating Climate Change Children ask parents and older relatives to recall their experiences
VISUALIZING CLIMATE DATA AS A 3D CLIMATE TORUS
 Y. Ikeda, C. M. Herr, D. Holzer, S. Kaijima, M. J. Kim. M, A, Schnabel (eds.), Emerging Experience in Past, Present and Future of Digital Architecture, Proceedings of the 20th International Conference
Weather in Saskatchewan. John Paul Cragg Warning Preparedness Meteorologist Environment and Climate Change Canada
 Weather in Saskatchewan John Paul Cragg Warning Preparedness Meteorologist Environment and Climate Change Canada The Climate of Saskatchewan -35 Average January Low Temperature -30-25 -20-15 -10-5 0 5
C L I M A T E R E S P O N S I V E U R B A N D E S I G N F O R G R E E K P U B L I C S P A C E
 C L I M A T E R E S P O N S I V E U R B A N D E S I G N F O R G R E E K P U B L I C S P A C E Prepared by: Ioannis Karakounos With the guidance of: Raphael Lafargue Kristina Von Bomhard Concept Make public
AHEAD OF THE STORM: Extreme Weather Resilience in the City of Toronto
 AHEAD OF THE STORM: Extreme Weather Resilience in the City of Toronto David MacLeod Toronto Environment and Energy Office Environmental Applied Science and Management Symposium 2013 March 21, 2013 Ahead
Project 2. Introduction: 10/23/2016. Josh Rodriguez and Becca Behrens
 Project 2 Josh Rodriguez and Becca Behrens Introduction: Section I of the site Dry, hot Arizona climate Linen supply and cleaning facility Occupied 4am-10pm with two shifts of employees PHOENIX, ARIZONA
Luminous Data Analysis and Quality Assurance of Climate Based Daylighting Simulation. Francesco Anselmo
 Luminous Data Analysis and Quality Assurance of Climate Based Daylighting Simulation Francesco Anselmo 2 Windows 3 Recent window design Le Corbusier A sheet of glass and three partition walls make an ideal
Winter Thermal Comfort in 19 th Century Traditional Buildings of the Town of Florina, in North-Western Greece
 PLEA2 - The 22 nd Conference on Passive and Low Energy Architecture. Beirut, Lebanon, 13-16 November 2 Winter Thermal Comfort in 19 th Century Traditional Buildings of the Town of Florina, in North-Western
Outdoor Thermal Comfort and Local Climate Change: Exploring Connections
 Outdoor Thermal Comfort and Local Climate Change: Exploring Connections ROBERTA COCCI GRIFONI 1, MARIANO PIERANTOZZI 2, SIMONE TASCINI 1 1 School of Architecture and Design E. Vittoria, University of Camerino,
What Is It Like Outside?
 What Is It Like Outside? Focus: Students will describe daily changes in temperature and weather. Specific Curriculum Outcomes Students will be expected to: 1.0 pose questions that lead to exploration and
My Community vs. Nunavut Weather and Climate
 My Community vs. Nunavut Content Areas Social Studies, Science, Technology Objective Students will differentiate between weather and climate. For 1 month, they will collect and graph daily temperature
ASTROLab. parc national du Mont-Mégantic SCHOOL GROUPS
 parc national du Mont-Mégantic 2017-2018 SCHOOL GROUPS DAYTIME ASTRONOMY Guided Tour Located right at the foot of the mountain, the is an astronomy activity centre offering an observation area, a high
CONSIDERATIONS ABOUT THE INFLUENCE OF CLIMATE CHANGES AT BAIA MARE URBAN SYSTEM LEVEL. Mirela COMAN, Bogdan CIORUŢA
 SCIENTIFIC RESEARCH AND EDUCATION IN THE AIR FORCE AFASES2017 CONSIDERATIONS ABOUT THE INFLUENCE OF CLIMATE CHANGES AT BAIA MARE URBAN SYSTEM LEVEL Mirela COMAN, Bogdan CIORUŢA Faculty of Engineering,
Orientation of Building
 Orientation of Building Prof. S.K.Gupta 1 1 Dean &DirectorAmity University HaryanaPanchgaon, Manesar, Gurgaon I. INTRODUCTION The need to conserve essential building materials has drawn attention again
Determination of Optimum Fixed and Adjustable Tilt Angles for Solar Collectors by Using Typical Meteorological Year data for Turkey
 Determination of Optimum Fixed and Adjustable Tilt Angles for Solar Collectors by Using Typical Meteorological Year data for Turkey Yohannes Berhane Gebremedhen* *Department of Agricultural Machinery Ankara
Study on Reusing Abandoned Chimneys as Solar Chimneys to Induce Breeze in Residential Areas
 Study on Reusing Abandoned Chimneys as Solar Chimneys to Induce Breeze in Residential Areas AZUSA TAKAYAMA 1, KOICHI ASANO 1, SHIGEMITSU SHUCHI 1 and KENICHI HASEGAWA 1 1 Faculty of Systems Science and
C) the seasonal changes in constellations viewed in the night sky D) The duration of insolation will increase and the temperature will increase.
 the seasonal changes in constellations viewed in the night sky D) The duration of insolation will increase and the temperature will increase.") 1. Which event is a direct result of Earth's revolution? A) the apparent deflection of winds B) the changing of the Moon phases C) the seasonal changes in constellations viewed in the night sky D) the
1. Which event is a direct result of Earth's revolution? A) the apparent deflection of winds B) the changing of the Moon phases C) the seasonal changes in constellations viewed in the night sky D) the
ABOUT UNCERTAINTIES IN SIMULATION MODELS FOR BUILDING SYSTEMS CONTROL
 ABOUT UNCERTAINTIES IN SIMULATION MODELS FOR BUILDING SYSTEMS CONTROL Kristina Orehounig, Matthias Schuss, Claus Pröglhöf, and Ardeshir Mahdavi Department of Building Physics and Building Ecology Vienna
Temperature Changes OBJECTIVES PREPARATION SCHEDULE MATERIALS. The students. For each student. For each team of two. For the class
 activity 3 Temperature Changes OBJECTIVES Students observe changes in air temperature and discover the role of the Sun in heating Earth. The students measure and record outdoor air temperature at three
Solar Control in Traditional Architecture, Potentials for Passive Design in Hot and Arid Climate
 Solar Control in Traditional Architecture, Potentials for Passive Design in Hot and Arid Climate Wael A. Yousef Mousa, MA.ᵃ Werner Lang, Prof. Dr.-Ing.ᵇ ᵃ ᵇInstitute of Energy Efficient and Sustainable
VISUALISATION AS A TOOL TO GUIDE STREET TREE PLANTING FOR OPTIMAL BENEFIT GAIN
 VISUALISATION AS A TOOL TO GUIDE STREET TREE PLANTING FOR OPTIMAL BENEFIT GAIN Dr Ana Macias PhD Forestry Engineer, Arbocity, Spain Co-author: Kieron J. Doick 1. Introduction 2. Methodology 3. Results
WEATHER AND CLIMATE (K.ES.NGSS)
") TM WEATHER AND CLIMATE (K.ES.NGSS) UNIT AT A GLANCE ACTIVITY 1 - Weather Watchers: Making Observations QUESTIONS: What do we need to know about the weather, and what do we need to find out? Preparation:
TM WEATHER AND CLIMATE (K.ES.NGSS) UNIT AT A GLANCE ACTIVITY 1 - Weather Watchers: Making Observations QUESTIONS: What do we need to know about the weather, and what do we need to find out? Preparation:
Patterns of Change on Earth
 TEKS collect and analyze data to identify sequences and predict patterns of change in shadows, tides, seasons, and the observable appearance of the Moon over time Patterns of Change on Earth Patterns and
Analysis Global and Ultraviolet Radiation in Baghdad City, Iraq
 Analysis Global and Ultraviolet Radiation in Baghdad City, Iraq Ali M. Alsalihi 1 Siaf H. Abdulatif 1,2 1.Department of Atmospheric Sciences, College of science, Al-Mustansiriyah University, Baghdad, Iraq
Daylighting Buildings Nexus November 12, 2009
 Daylighting Buildings Nexus November 12, 2009 Holly Wasilowski, Registered Architect, LEED AP Doctor of Design Student in Sustainable Design Harvard Graduate School of Design Agenda: Introduction Rules
Water vapour above Switzerland over the last 12 years
 Water vapour above Switzerland over the last 12 years June Morland*, Martine Collaud**, Klemens Hocke*, Pierre Jeannet**, Christian Mätzler* *Institute of Applied Physics, University of Bern **MeteoSwiss
PROPOSAL OF SEVEN-DAY DESIGN WEATHER DATA FOR HVAC PEAK LOAD CALCULATION
 Ninth International IBPSA Conference Montréal, Canada August 5-8, PROPOSAL OF SEVEN-DAY DESIGN WEATHER DATA FOR HVAC PEAK LOAD CALCULATION Hisaya ISHINO Faculty of Urban Environmental Sciences, Metropolitan
Case Study Las Vegas, Nevada By: Susan Farkas Chika Nakazawa Simona Tamutyte Zhi-ya Wu AAE/AAL 330 Design with Climate
 Case Study Las Vegas, Nevada By: Susan Farkas Chika Nakazawa Simona Tamutyte Zhi-ya Wu AAE/AAL 330 Design with Climate Professor Alfredo Fernandez-Gonzalez School of Architecture University of Nevada,
Natural Disasters and Storms in Philadelphia. What is a storm? When cold, dry air meets warm, moist (wet) air, there is a storm.
 air, there is a storm.") Natural Disasters and Storms in Philadelphia 1. What is a natural disaster? 2. Does Philadelphia have many natural disasters? o Nature (noun) everything in the world not made No. Philadelphia does not
Natural Disasters and Storms in Philadelphia 1. What is a natural disaster? 2. Does Philadelphia have many natural disasters? o Nature (noun) everything in the world not made No. Philadelphia does not
not for commercial-scale installations. Thus, there is a need to study the effects of snow on
 1. Problem Statement There is a great deal of uncertainty regarding the effects of snow depth on energy production from large-scale photovoltaic (PV) solar installations. The solar energy industry claims
The effect of urban environment on the cooling degree hours and its effect on the C.O.P. of air-conditioning unit
 International Workshop on Energy Performance and Environmental The effect of urban environment on the cooling degree hours and its effect on the C.O.P. of air-conditioning unit N.M. Papanikolaou, M. Santamouris
Thermal Comfort Conditions for a Tropical City, Salvador Brazil
 September 2004 Page 1 of 1 Thermal Comfort Conditions for a Tropical City, Salvador Brazil Telma Andrade 1,2, Jussana Nery 1, Tereza Freire 1, Lutz Katzschner 3 and Danilo Fortuna 1 1 Federal University
Analysis of Typical Meteorological Year for Seeb/Muscat, Oman
 Analysis of Typical Meteorological Year for Seeb/Muscat, Oman Y. H. Zurigat 1, N. M. Sawaqed 2, H. Al-Hinai 3 and B. A. Jubran 4 1 Department of Mechanical Engineering, University of Jordan, Amman-Jordan
Climate.tgt, Version: 1 1
 Name: Key Concepts Choose the letter of the best answer. (5 points each) 1. 2. 3. 4. 5. 6. 7. 8. 9. 10. Date: A city located in the middle of North America experiences extreme temperature changes during
Your web browser (Safari 7) is out of date. For more security, comfort and the best experience on this site: Update your browser Ignore
 is out of date. For more security, comfort and the best experience on this site: Update your browser Ignore") Your web browser (Safari 7) is out of date. For more security, comfort and the best experience on this site: Update your browser Ignore Activitydevelop Family Version THE REASO N FO R THE SEASO NS How
Your web browser (Safari 7) is out of date. For more security, comfort and the best experience on this site: Update your browser Ignore Activitydevelop Family Version THE REASO N FO R THE SEASO NS How
Vermont Soil Climate Analysis Network (SCAN) sites at Lye Brook and Mount Mansfield
 sites at Lye Brook and Mount Mansfield") Vermont Soil Climate Analysis Network (SCAN) sites at Lye Brook and Mount Mansfield 13 Years of Soil Temperature and Soil Moisture Data Collection September 2000 September 2013 Soil Climate Analysis Network
Vermont Soil Climate Analysis Network (SCAN) sites at Lye Brook and Mount Mansfield 13 Years of Soil Temperature and Soil Moisture Data Collection September 2000 September 2013 Soil Climate Analysis Network
TREES Training for Renovated Energy Efficient Social housing
 TREES Training for Renovated Energy Efficient Social housing Intelligent Energy -Europe programme, contract n EIE/05/110/SI2.420021 Section 2 Tools 2.1 Simplified heating load calculation Tamas CSOKNYAI
Activity 2.2: Recognizing Change (Observation vs. Inference)
") Activity 2.2: Recognizing Change (Observation vs. Inference) Teacher Notes: Evidence for Climate Change PowerPoint Slide 1 Slide 2 Introduction Image 1 (Namib Desert, Namibia) The sun is on the horizon
Activity 2.2: Recognizing Change (Observation vs. Inference) Teacher Notes: Evidence for Climate Change PowerPoint Slide 1 Slide 2 Introduction Image 1 (Namib Desert, Namibia) The sun is on the horizon
Vantage Pro Technical Reference
 Vantage Pro Technical Reference Davis Instruments 3465 Diablo Ave. Hayward, CA 94545 Created: 9/11/01 Calculations of Derived Variables The following parameters do not have any sensors or circuitry. They
KETCHUM ARTS COMMISSION INTERACTIVE ART CALL FOR ARTISTS Request for Qualifications
 KETCHUM ARTS COMMISSION INTERACTIVE ART CALL FOR ARTISTS Request for Qualifications I N T R O D U C T I O N The City of Ketchum, Idaho, invites professional artists, architects or designers to apply for
CLIMATE. UNIT TWO March 2019
 CLIMATE UNIT TWO March 2019 OUTCOME 9.2.1Demonstrate an understanding of the basic features of Canada s landscape and climate. identify and locate major climatic regions of Canada explain the characteristics
Unit 2 Text Worksheet # 2
 Unit 2 Text Worksheet # 2 Read Pages 74-77 1. Using fig. 5.1 on page 75 identify: Climatic Region the most widespread climatic region in the low latitudes two climatic subregions with dry conditions for
CHAPTER 3. The sun and the seasons. Locating the position of the sun
 zenith 90 observer summer solstice 75 altitude angles equinox 52 winter solstice 29 Figure 3.1: Solar noon altitude angles for Melbourne SOUTH winter midday shadow WEST summer midday shadow summer EAST
Climate of Columbus. Aaron Wilson. Byrd Polar & Climate Research Center State Climate Office of Ohio.
 Climate of Columbus Aaron Wilson Byrd Polar & Climate Research Center http://bpcrc.osu.edu/greenteam Overview Historical Climatology Climate Change & Impacts Projected Changes Summary 2 Historical Climatology
Performance of Fixed Horizontal Shading Devices in South Facing Residential Buildings in Dhaka
 Global Science and Technology Journal Vol. 1. No. 1. July 2013 Issue. Pp.88-99 Performance of Fixed Horizontal Shading Devices in South Facing Residential Buildings in Dhaka Saiful Hasan Tariq* and Mahbuba
ASSESSMENT OF THERMAL SENSATION OF RESIDENTS IN THE SOUTHERN GREAT PLAIN, HUNGARY
 ASSESSMENT OF THERMAL SENSATION OF RESIDENTS IN THE SOUTHERN GREAT PLAIN, HUNGARY KOVÁCS A. 1, KÁNTOR NOÉMI 2, ÉGERHÁZI LILLA ANDREA 1 ABSTRACT. Assessment of thermal sensation of residents in the Southern
Earth-Sun Relationships. The Reasons for the Seasons
 Earth-Sun Relationships The Reasons for the Seasons Solar Radiation The earth intercepts less than one two-billionth of the energy given off by the sun. However, the radiation is sufficient to provide
Climatically Adapted Piloti Arrangement and Ratio of Residential Blocks in a Subtropical Climate City
 Climatically Adapted Piloti Arrangement and Ratio of Residential Blocks in a Subtropical Climate City Zeng Zhou 1, Qinli Deng 2, Akashi Mochida 2 1 Wuhan University, China, haomaoz@hotmail.com 2 Tohoku
teachers and students(gong 2005). For example: square, foot path, lawn area, lakeside area, building of the around. The quality of campus semi-open sp
. For example: square, foot path, lawn area, lakeside area, building of the around. The quality of campus semi-open sp") Measurement of Summer Outdoor Thermal Environment of Campus Open Space and Validation the Simulation Model Guang Chen 1, Lihua Zhao 1,*, and Qiong Li 1 1 Building Environment and Energy Laboratory (BEEL),
Measurement of Summer Outdoor Thermal Environment of Campus Open Space and Validation the Simulation Model Guang Chen 1, Lihua Zhao 1,*, and Qiong Li 1 1 Building Environment and Energy Laboratory (BEEL),
Solar radiation and architectural design in Barcelona
 Solar radiation and architectural design in Barcelona Reconciling protection in summer and gain in winter Alexis AGUILAR 1 Carlos ALONSO 1 Helena COCH 1 Rafael SERRA 1 1 ABSTRACT: The principles of the
Socials Studies. Chapter 3 Canada s People 3.0-Human Geography
 Socials Studies Chapter 3 Canada s People 3.0-Human Geography Physical Geography Study of the natural features of the Earth s surface including landforms, climate, ocean currents and flora and fauna Human
Website Phone Mobile OVERVIEW Davis Vantage Pro2 Weather Station
 OVERVIEW If you're looking for a superior weather station, the Davis Vantage Pro2 Weather Station is as good as they come! Vantage Pro2 offers the professional weather observer and the serious weather
Chapter 2 Available Solar Radiation
 Chapter 2 Available Solar Radiation DEFINITIONS Figure shows the primary radiation fluxes on a surface at or near the ground that are important in connection with solar thermal processes. DEFINITIONS It
The map shows ocean currents in the northern Atlantic Ocean. Which location most likely has the warmest climate?
 6 th Grade Final Exam Study Guide 1. Use the map below to answer this question. The map shows ocean currents in the northern Atlantic Ocean. Which location most likely has the warmest climate? 2. Daylight
Factors That Affect Climate
 Factors That Affect Climate Factors That Affect Climate Latitude As latitude (horizontal lines) increases, the intensity of solar energy decreases. The tropical zone is between the tropic of Cancer and
5. In which diagram is the observer experiencing the greatest intensity of insolation? A) B)
 B)") 1. Which factor has the greatest influence on the number of daylight hours that a particular Earth surface location receives? A) longitude B) latitude C) diameter of Earth D) distance from the Sun 2. In
1. Which factor has the greatest influence on the number of daylight hours that a particular Earth surface location receives? A) longitude B) latitude C) diameter of Earth D) distance from the Sun 2. In
ARCH 1250 APPLIED ENVIRONMENTAL STUDIES. CLASS TWO - CLIMATE Macroclimate and Microclimate
 APPLIED ENVIRONMENTAL STUDIES CLASS TWO - Macroclimate and Microclimate Part 1: Climate Overview John Seitz, RA, LEED AP Assistant Adjunct Professor Professor Paul C. King, RA, AIA, ARA Assistant Professor
Solar Resource Mapping in South Africa
 Solar Resource Mapping in South Africa Tom Fluri Stellenbosch, 27 March 2009 Outline The Sun and Solar Radiation Datasets for various technologies Tools for Solar Resource Mapping Maps for South Africa
THERMAL COMFORT IN HIGHLY GLAZED BUILDINGS DETERMINED FOR WEATHER YEARS ON ACCOUNT OF SOLAR RADIATION. Dominika Knera 1 and Dariusz Heim 1
 THERMAL COMFORT IN HIGHLY GLAZED BUILDINGS DETERMINED FOR WEATHER YEARS ON ACCOUNT OF SOLAR RADIATION Dominika Knera 1 and Dariusz Heim 1 1 Department of Heat and Mass Transfer, Lodz University of Technology
Heat Alert and Response Systems in Canada
 Heat Alert and Response Systems in Canada Development of Climate Information Systems for Heat Health Early Warning Workshop Chicago, Illinois July 28-30 Sharon Jeffers Meteorological Service of Canada
330: Daytime urban heat island intensity in London during the winter season
 330: Daytime urban heat island intensity in London during the winter season Giridharan Renganathan Brunel University Abstract This paper will present results of the daytime urban heat island intensity
Seasonal & Diurnal Temp Variations. Earth-Sun Distance. Eccentricity 2/2/2010. ATS351 Lecture 3
 Seasonal & Diurnal Temp Variations ATS351 Lecture 3 Earth-Sun Distance Change in distance has only a minimal effect on seasonal temperature. Note that during the N. hemisphere winter, we are CLOSER to
Extreme Temperature Protocol in Middlesex-London
 Clean Air Partnership Webinar March 17, 2009 Extreme Temperature Protocol in Middlesex-London Presented by Iqbal Kalsi, MBA, CPHI(C), CCEP iqbal.kalsi@mlhu.on.ca 1 History Informal monitoring, tracking
Simulation Study of Building Envelope Performance Using Microclimatic Meteorological Data
 Purdue University Purdue e-pubs International High Performance Buildings Conference School of Mechanical Engineering 2010 Simulation Study of Building Envelope Performance Using Microclimatic Meteorological
Available online at ScienceDirect. Energy Procedia 78 (2015 )
") Available online at www.sciencedirect.com ScienceDirect Energy Procedia 78 (2015 ) 2560 2565 6th International Building Physics Conference, IBPC 2015 The influence of different hourly typical meteorological
Available online at www.sciencedirect.com ScienceDirect Energy Procedia 78 (2015 ) 2560 2565 6th International Building Physics Conference, IBPC 2015 The influence of different hourly typical meteorological
Which graph best shows the relationship between intensity of insolation and position on the Earth's surface? A) B) C) D)
 B) C) D)") 1. The hottest climates on Earth are located near the Equator because this region A) is usually closest to the Sun B) reflects the greatest amount of insolation C) receives the most hours of daylight D)
1. The hottest climates on Earth are located near the Equator because this region A) is usually closest to the Sun B) reflects the greatest amount of insolation C) receives the most hours of daylight D)
SHADOW IMPACT STUDY REPORT
 SHADOW IMPACT STUDY REPORT 175 Zoo Park Road Town of Wasaga Beach Date: September 2017 Prepared for: Simcoe County Housing Corporation Prepared by: MacNaughton Hermsen Britton Clarkson Planning Limited
Over the course of this unit, you have learned about different
 70 People and Weather TA L K I N G I T O V E R Over the course of this unit, you have learned about different aspects of earth s weather and atmosphere. Atmospheric scientists, climatologists, hydrologists,
What Is the Relationship Between Earth s Tilt and the Seasons?
 Learning Set 2 Why Are There Differences in Temperature? Review Images and Graphics While reading about Earth s tilt and the seasons, pay particular attention to the graphics included. How do they help
Which Earth latitude receives the greatest intensity of insolation when Earth is at the position shown in the diagram? A) 0 B) 23 N C) 55 N D) 90 N
 0 B) 23 N C) 55 N D) 90 N") 1. In which list are the forms of electromagnetic energy arranged in order from longest to shortest wavelengths? A) gamma rays, x-rays, ultraviolet rays, visible light B) radio waves, infrared rays, visible
1. In which list are the forms of electromagnetic energy arranged in order from longest to shortest wavelengths? A) gamma rays, x-rays, ultraviolet rays, visible light B) radio waves, infrared rays, visible
Ice Hazard Mitigation and Monitoring on the Veterans Glass City Skyway Bridge
 Ice Hazard Mitigation and Monitoring on the Veterans Glass City Skyway Bridge Presenters: T. Audet, L. Istefan, D. Nims Authors: A. Abdelaal 1, D. Nims 1, L. Istefan 2, T. Audet 2, A. Helmicki 3, V. Hunt
Average Weather For Coeur d'alene, Idaho, USA
 Average Weather For Coeur d'alene, Idaho, USA Information courtesy of weatherspark.com Location This report describes the typical weather at the Coeur d'alene Air Terminal (Coeur d'alene, Idaho, United
Experimental Performance and Numerical Simulation of Double Glass Wall Thana Ananacha
 Experimental Performance and Numerical Simulation of Double Glass Wall Thana Ananacha Abstract This paper reports the numerical and experimental performances of Double Glass Wall are investigated. Two
LESSON PLAN - Optimum Orientation of Solar Panels Using Soltrex Data
 LESSON PLAN - Optimum Orientation of Solar Panels Using Soltrex Data Title of Lesson: Optimum Orientation of Solar Panels Using Soltrex Data Description of class: High School physics, astronomy, or environmental