Surface Radiation Budgets in Support of the GEWEX Continental Scale. International Project (GCIP) and the GEWEX Americas Prediction Project
|
|
|
- Barnaby Fitzgerald
- 6 years ago
- Views:
Transcription
1 Surface Radiation Budgets in Support of the GEWEX Continental Scale International Project (GCIP) and the GEWEX Americas Prediction Project (GAPP), including the North American Land Data Assimilation System (NLDAS) Project Rachel T. Pinker (1), J. Dan Tarpley (2), Istvan Laszlo (2), Kenneth E. Mitchell (3), Paul R. Houser (4), Eric F. Wood (5), John C. Schaake (6), Alan Robock (7), Dag Lohmann (3), Brian A. Cosgrove (8), Justin Sheffield (5), Qingyun Duan (6), Lifeng Luo (7), and R. Wayne Higgins (9) (1) Department of Meteorology, University of Maryland (2) Satellite Research Laboratory, NOAA/NESDIS (3) NCEP Environmental Modeling Center (NOAA/NWS) (4) NASA/GSFC Hydrological Sciences Branch (5) Department of Civil and Environmental Engineering, Princeton University (6) Office of Hydrologic Development (NOAA/NWS) (7) Department of Environmental Sciences, Rutgers University (8) SAIC/NASA GSFC Hydrological Sciences Branch and Data Assimilation Office (9) NCEP Climate Prediction Center (NOAA/NWS) For Submission to: Journal of Geophysical Research GCIP3 Special Issue December 2002
2 Abstract In support of the World Climate Research Program (WCRP) GEWEX Continental-scale International Project (GCIP) and the GEWEX Americas Prediction Project (GAPP), real time estimates of shortwave radiative fluxes, both at the surface and at the top of the atmosphere, are being produced by the National Oceanic and Atmospheric Administration (NOAA)/National Environmental Satellite Data and Information Service (NESDIS), using observations from the GOES-8 Imager. The inference scheme used has been developed at the Department of Meteorology, University of Maryland (UMD), and atmospheric and surface model input parameters are produced and provided by the NOAA/National Centers for Environmental Prediction (NCEP). The derived radiative fluxes are evaluated on hourly, daily, and monthly time scales, using observations at about fifty stations. The satellite estimates were found to be within acceptable limits during snow-free periods, but in case of snow cover, cloud detection over snow affected achievable accuracy. In what follows, this activity is discussed, and results from the evaluation of the derived fluxes against ground observations for a oneyear period, are presented. 2
3 1. Background Information on the spatial and temporal distribution of surface and top of the atmosphere (TOA) radiation budget is required for modeling the hydrologic cycle, for representing interactions and feedbacks between the atmosphere and the terrestrial biosphere [Dickinson, 1986; Henderson-Sellers, 1993; Betts et al., 1997], and for estimating global oceanic and terrestrial net primary productivity [Goward, 1989; Running et al. 1999; Platt, 1986]. Such information is also needed for validating climate models [Garrat et al., 1993; Wild et al., 1995; Wielicki et al., 2002] and for improving understanding of transport of heat, moisture, and momentum across the surfaceatmosphere interface [Berbery et al., 1999; Baumgartner and Anderson, 1999; Sui et al., 2002]. In the United States, the Interagency Committee on Earth and Environmental Sciences as well as the Intergovernmental Panel on Climate Change have identified clouds and the hydrologic cycle as the highest scientific priority for global change research [Gates et al., 1999; Houghton et al., 2001]. Studies of long-range weather forecasting, climate, climate change, and interannual variability, are presently conducted with the aid of numerical weather prediction and general circulation models. In order to use model results with confidence, there is a need to validate them on the same scales at which they are implemented. Ground observations, even of the most commonly measured parameters (e.g., surface air temperature), are very sparse. Satellite observations are considered the only source of global scale information that could be used for model evaluation. Of particular interest are surface radiative fluxes, due to their dominant role as forcing functions of surface energy budgets [Wood et al., 1997; Wielicki et al., 1995; Mitchell et al., 2002]. Information on surface radiative fluxes can also 3
4 improve our understanding of physical processes associated with heat, moisture and momentum transfer across the surface/atmosphere interface, and therefore, improve model parameterizations [Chen et al., 1996]. In the last two decades, it was demonstrated that radiative fluxes could be derived from satellite observations with reasonable accuracy [Pinker et al., 1995; Frouin and Pinker, 1995; Rossow and Zhang, 1995; Whitlock et al., 1995; Ohmura et al., 1998; Gupta et al., 1998]. Long term satellite observations over large spatial scales are now available to implement inference schemes for deriving radiative fluxes [Schiffer and Rossow, 1995; Rossow and Schiffer, 1999]. Among the objectives of the GEWEX Continental-scale International Project (GCIP) [WCRP-67, 1992] are: o determination of the time/space variability of the hydrologic cycle and the energy budgets over a continental scale; o o development and validation of macro-scale hydrologic models; and, utilization of existing and future satellite observations to achieve these objectives. The GEWEX Americas Prediction Project (GAPP) is a continuation of GCIP, having the ultimate objective of developing a capability for predicting variations in water resources, on time scales up to seasonal and interannual (NRC, 1998). NOAA/NESDIS is supporting GCIP/GAPP activities by developing new operational products from satellite observations [Leese, 1994; 1997]. This is a collaborative effort between NOAA/NESDIS, NOAA/National Centers for Environmental Prediction (NCEP), and the University of Maryland. Shortwave ( µm) radiative fluxes at the surface and at the top of the atmosphere, as derived from GOES observations, are part of 4
5 this product. The inferred shortwave radiative fluxes include upwelling and downwelling total and diffuse quantities, as well as spectral components (e.g., the photosynthetically active radiation (PAR)). At NOAA/NESDIS, the interface between the satellite data and the inference models has been developed [Tarpley et al., 1996]. NOAA/NCEP provides information on the state of the atmosphere and surface conditions, as available from the Eta model analyzed output fields [Rogers et al., 1996]. The University of Maryland is involved in model development, modifications [Pinker and Laszlo, 1992a; 1992b; Pinker et al., 2002], sensitivity studies [Meng et al., 2002], validation against ground observations, data archiving, and data distribution. The Surface Radiation Budget (SRB) model is implemented at NOAA/NESDIS in real time on an hourly basis, for 0.5-degree targets for an area bounded by W longitude and N latitude belts. For each target, at appropriate forecast times, selected data from the NCEP regional forecast model are delivered to the satellite data stream, to serve as inputs to the SRB model. This approach ensures timely and high quality information input to the satellite inference scheme. In turn, the derived radiative fluxes help to diagnose the NCEP forecast model as to its ability to predict correctly radiative fluxes. Initial evaluation of the SRB product was done at several levels, such as running the model operationally and off-line for same cases, as well as evaluation against ground truth, as available from independent projects such as the Baseline Surface Radiation Network (BSRN) [Ohmura et al., 1998; Whitlock et al., 1995], the Surface Radiation Monitoring Network (SURFRAD) [Hicks et al., 1996, Augustine et al., 2000], by independent investigators [Meng et al., 2002], and within the framework of the North American Land Data Assimilation System (N-LDAS) activity [Lou et al., 2002]. 5
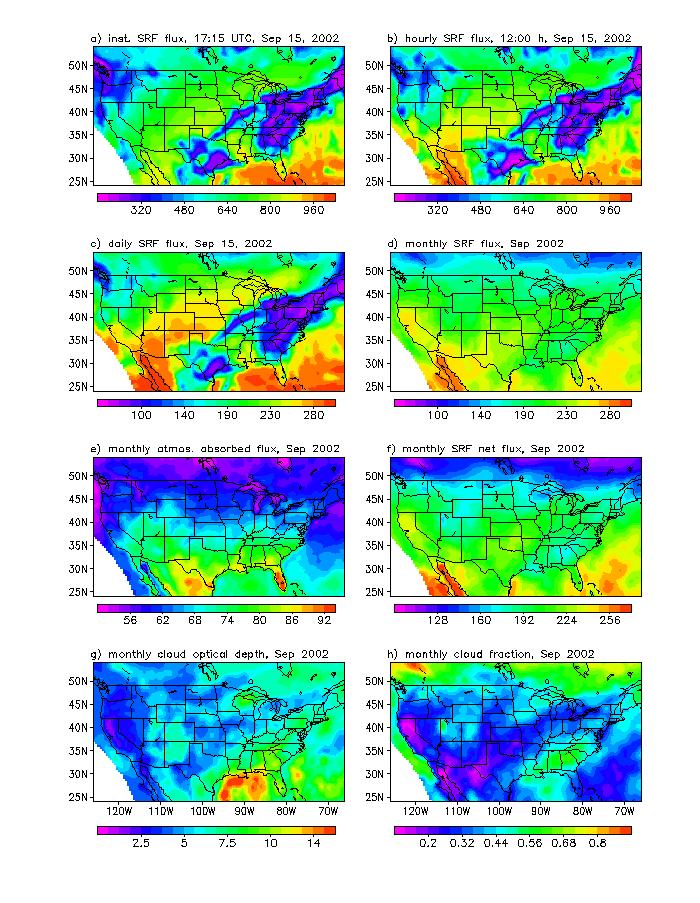
6 2. Current Status of Data Availability The first version of the experimental real time product is available from January All the input and output parameters, produced in support of GCIP/GAPP (currently, a total of 71), are stored at the University of Maryland, where the SRB data are evaluated against ground observations, partially quality controlled, and prepared for distribution via the World Wide Web and an anonymous ftp site, as described at: Four types of information is archived: satellite based information, used to drive the model; auxiliary data used to drive the model; Eta model output products relevant for hydrologic modeling; independently derived satellite products. Examples of surface shortwave radiation fields at various time scales, as well as examples of other products, such as net absorbed radiation at the surface and within the atmosphere, cloud amounts and cloud optical depths, are illustrated in Figure 1. Information on instantaneous, daily, monthly mean surface and TOA shortwave and photosynthetically active radiative fluxes are provided at the University of Maryland World Wide Web site almost in real time. 6
7 3. The inference model 3.1 General features A modified version of the GEWEX SRB algorithm [Pinker and Laszlo, 1992a; Whitlock et al., 1995; Ohmura et al., 1998] (Version 1.1), developed at the University of Maryland, is used. The model is driven with GOES-8 satellite data, as preprocessed at NOAA/NESDIS, and auxiliary information on the state of the atmosphere and the surface, as available from the NCEP Eta model (e.g., column water vapor), and from independent inputs to the Eta model (e.g., snow information, that till recently came from the United States Air Force products). In the model, radiative fluxes are determined by inferring the transmittance from the reflected radiation observed by the satellite. The inference technique is based on a radiative transfer scheme and is implemented spectrally. Thus, it is possible to compute shortwave fluxes at spectral intervals known to be of significance (e.g., photosynthetically active radiation). This is important, because current GCMs are run in a mode that separates shortwave fluxes at 0.7 µm [Roesch et al., 2002], to allow incorporation of newly derived satellite based parameters, such as fractional vegetation cover, derived from the Normal Difference Vegetation Index (NDVI), and for improving parameterizations of surface/atmosphere interactions [Gallo and Huang, 1998; Goward and Huemmrich, 1992; Townshend and Justice, 1995; Gutman et al., 1995]. In the model, shortwave fluxes are separated into direct and diffuse components, of interest for improved modeling of radiative interaction with vegetation and oceans. Other parameters that are derived include clear-sky and all-sky albedos at the top of the atmosphere and at the surface, and aerosol and cloud optical depths. The shortwave and spectral fluxes can be computed separately for clear and all-sky 7
8 conditions, thus making it possible to derive information on the radiative effects of clouds, known as "cloud radiative forcing" [Ramanathan et al., 1989]. In the SRB algorithm, the shortwave radiative fluxes are computed in the following five spectral intervals: , , , and µm. In each of the five spectral intervals, upward and downward fluxes at the top of the atmosphere and at the surface are computed by determining the spectral transmittance from the top-ofatmosphere shortwave reflectance. The latter is estimated from the narrowband radiance observed by the satellite, using a transformation between narrowband radiance and shortwave reflectance [Zhou et al., 1996] (for details see section 3.2). The spectral transmittances are determined by matching the satellite-derived shortwave reflectance with a shortwave reflectance obtained from modeled simulations. The spectral transmittance-reflectance relationships are available in the form of a table look-up. They are derived for discrete values of the solar zenith angle, amount of water vapor and ozone, aerosol and cloud optical thickness, using a delta-eddington radiative transfer method described in Joseph et al. [1976]. Radiative properties of aerosols and clouds are taken from the Standard Radiation Atmospheres [WCP-55, 1983] and from Stephens et al. [1984], respectively. Absorption by ozone and water vapor are parameterized following Lacis and Hansen [1974]. In deriving the fluxes, first the surface albedo is estimated from the clearest radiance observed over a number of days (clear-sky composite radiance), corrected for Rayleigh scattering, aerosol extinction, and absorption by ozone and water vapor. In this step, the amount of aerosol is specified according to the Standard Radiation Atmospheres [WCP-55, 1983]. Column amounts of ozone are as provided in the McClatchey atmospheres [Kneizys et al., 1988] and water vapor is from 8
9 the NCEP Eta model. Atmospheric transmittance-reflectance pairs are selected from the look-up table according to the solar zenith angle, water vapor and ozone amount, and are combined with the surface albedo to yield shortwave top-of-atmosphere reflectances. One set is for varying values of aerosol optical depth (clear sky case) and the other, for varying values of cloud optical depth (cloudy atmosphere). Finally, the shortwave reflectances derived from the instantaneous satellite-observed clear-sky and cloudy-sky radiances are matched with the clear and cloudy sets of transmittance-reflectance pairs, and clear-sky and cloudy-sky transmittances and fluxes are obtained. The clear-sky and cloudy-sky fluxes are then weighted according to the cloud cover (defined as the ratio of number of cloudy pixels to the total number of pixels) to get the all-sky fluxes. The various elements of the model have been tested in a number of different ways. The radiative transfer component has been evaluated in the framework of the Intercomparison of Radiation Codes in Climate Models (ICRCCM). The results were found to be in good agreement with those from high-resolution radiative-transfer models [Fouquart et al., 1991]. The differences in atmospheric absorption, when compared to high-resolution computations, are about 2% and 7% for the clear and the cloudy cases, respectively. Surface down-flux estimates have been compared with values measured at several locations and in the framework of various activities, such as the Satellite Algorithm Intercomparison sponsored by WCRP and NASA [Whitlock et al., 1995], reporting agreement with ground observations within 10 Wm -2 on a monthly time scale. The implementation of the model requires preprocessing of the satellite data and separation of clear and cloudy radiances. This is performed at NOAA/NESDIS [Tarpley et al., 1996], as described in section 4. 9
10 3.2 Modifications for GOES-8 Prior to the operational implementation of the SRB model at NOAA/NESDIS, spectral/angular corrections appropriate for the filter functions of GOES-8 [Menzel and Purdom, 1994] were developed [Zhou et al., 1996]. The visible channel on the GOES-8 satellite is a narrowband channel. To derive broadband fluxes requires development of narrow to broadband transformations for this satellite. A study was undertaken to obtain angularly dependent relationships between the broadband reflectance and the narrowband reflectance, as observed from the visible channel of GOES-8 ( µm). Top of atmosphere broadband and filtered narrowband reflectances (representing the visible channel of GOES-8) were simulated using the LOWTRAN 7 radiation code for various viewing and solar geometries (represented by angular bins) and considering different amounts of water vapor, ozone, aerosol and clouds (Figure 2). Surface albedo was also varied according to the spectrally and angularly dependent models of Briegleb et al. (1986), as representative of four broad surface types: ocean, vegetation, desert and snow. For each surface type, two sets of transformation coefficients were derived by performing linear least-square regressions between the simulated narrowband and broadband reflectances. One set of coefficient was obtained from regressions for individual angular bins, while the other was derived using all angular bins. The difference in the broadband albedo obtained from the two sets of transformation coefficients depended on the solar zenith angle and the narrowband reflectance. Large solar angles and bright scenes produced large differences of the broadband albedo. For narrowband reflectances less than about 0.15, the broadband albedos derived from the two sets of transformations generally differed by less than 1%. In the current version of the SRB model as 10
11 implemented by NOAA/NESDIS, the transformation based on the ensemble of simulations is in use. 4. The implementation process The process of inferring surface radiative fluxes from the satellite observations involves: the interception of the real time satellite data at NOAA/NESDIS; building transfer capabilities between the Eta model products and the satellite data; building an interface between the satellite data and the inference model; executing the inference scheme; displaying the data in real time on the World Wide Web; and storing the data at the University of Maryland for quality control and data distribution. The latter includes parallel processing, preprocessing of original data into information at different time scales, model improvements, and archiving and distribution, as illustrated in Figure 3. In what follows, each activity will be described independently. 4.1 Real-time operation at NOAA In Table 2, a list of quantities required as input to the algorithm is presented. In Table 3, the algorithm outputs are listed. The satellite input to the model for each grid cell is clear sky radiance, composite clear sky radiance (this is the clearest radiance seen during several days), cloudy radiance, and fractional cloud-cover over the selected grid. Total precipitable water and, if available, the total ozone are accessed from the NCEP Eta weather forecast model. 4.2 Processing of GOES-8 Imager Data The GOES GCIP products are derived hourly for targets that are centered at 0.5 latitude/longitude intervals. Coverage extends from 24 to 54 N latitude and 66 to
12 W longitude. The targets consist of 9 x 8 arrays of 4 km center-to-center pixels (at nadir), where the visible data have been averaged up to 4 km resolution, to coincide with the 4 km resolution infrared pixels. The methodology to derive quantities that are directly computed from the hourly GOES data is based on the one used at NESDIS in the early stages of insolation estimates [Tarpley, 1979; Justus, et al., 1986]. The cloud detection algorithm is based on the fact that from geostationary orbit, the clear-sky surface brightness at each location for a given hour changes very slowly in time. Changes that occur are caused by seasonal change in solar illumination geometry, and by changes in surface albedo, caused by seasonal variations in vegetation and surface conditions. The algorithm assumes that any partial cloud cover in a target increases the variance in the visible and infrared radiances over the target. The clear composite radiance (CCR) is an input to the model and serves as a threshold in the cloud detection algorithm. The CCR represents the target radiances under clear sky conditions with minimum aerosol and atmospheric contribution to the signal. The fields of CCR are maintained for every target at every daylight hour for which the solar zenith angle is less than 75. Updating of the CCR fields is done very conservatively, to avoid cloud contamination. The CCR fields are maintained for the visible data (Channel 1). Corresponding fields of clear sky visible standard deviations, σ 1, and thermal standard deviations (Channel 4), σ 4, are also maintained. For a specific target at a given observation time, the target is updated if it is certain that there are no clouds in the target. To insure completely clear conditions, a target is updated if the following tests are met: 12
13 1. There is no snow cover 2. A 1 < A 1 (min) + k 0 σ 1 (min) 3. σ 1 < k 1 σ 1 (min) 4. σ 4 < k 2 σ 4 (min) where A 1, σ 1, and σ 4 are the currently observed mean albedo and channels 1 and 4 standard deviations respectively, and A 1 (min), σ 1 (min), and σ 4 (min) are the clear sky values in the CCR fields. The value of k 0, k 1, and k 2 are specific for each target, although that the current practice is to use the same values everywhere. Values are 1.5, 4.0 and 4.0 respectively. When the observation from a target meets the above criteria, the CCR is updated with a weighted average of the new and the old values, with the new given a weight of The coefficients are strictly selected to prevent sub-pixel cloud cover from being included in the radiances. This conservative approach prevents cloud contamination from slowly brightening the CCR fields. If specific targets in the CCR field do not require an update for a prolonged period of time, the above criteria are relaxed, until new values are obtained. 4.3 Cloud Detection The values of A 1 (min) and σ 1 (min) are used to define thresholds between clear and partly cloudy pixels, in the cloud detection algorithm. Each pixel in each target is classified by its top of the atmosphere albedo as being clear, partly cloudy, or cloudy, according to the following criteria: If A i < A 1 (min) + k 3 σ 1 (min) A 1 (min) + k 3 σ 1 (min) < A i < 35% albedo the pixel is clear the pixel is mixed, 13
14 A i > 35% albedo, the pixel is cloudy, k 3 is currently set to 9.0 everywhere. The above criteria were chosen by taking images of different scenes and calculating the cloud amounts with varying thresholds, until the cloud amounts matched the visual observations, particularly, for optically thick clouds that have a large effect on insolation. For each category of pixel in the target (clear, mixed, and cloudy), mean albedo and mean brightness temperatures in each thermal band are calculated, and the number of pixels in each is counted. The mixed pixel count is redistributed into the clear and cloudy counts, by weighting the number of mixed pixels by the mean albedo of the mixed pixels, according to the following procedure: n (cloudy) = n(cloudy) + f * n(mixed) n (clear) = n(clear) + (1 - f) * n(mixed) where f = (A(mixed) - A th )/(35% albedo - A th ). A(mixed) is the mean albedo of the mixed pixels, and A th = A 1 (min) + k 3 σ 1 (min) is the brightness threshold between clear and mixed pixels. The final number of clear and cloudy pixels, n and n, respectively, are converted to clear and cloudy fraction dividing by 72 the number of pixels in the target. The clear and cloudy sky albedos, the cloudy and clear fractions, and the composite clear albedo are then provided to the insolation algorithm, along with target snow cover, and the total precipitable water. The cloud detection method described here is successful in identifying optically thick cloud cover, 14
15 15 but it is less reliable for detecting thin cirrus clouds. However, thin cirrus has much less effect on insolation, which is the primary quantity that is being retrieved, so more complex cloud detection schemes are not required. Until late 1998, the U.S. Air Force daily snow cover data were used. The snow cover currently used is the NESDIS operational daily snow product [Ramsay, 1998]. The total precipitable water is from 6 and 12 hour Eta model forecast fields, interpolated to the target location and observation time 6. Results and Discussion About fifty ground observing stations are used to evaluate the satellite estimates of the surface shortwave fluxes. These include four Surface Radiation (SURFRAD) stations (Goodwin Creek, MS; Boulder, CO; Bondville, Il; Fort Peck, MT) [Hicks et al., 1996], twenty one stations from the Arizona Meteorological Network (AZMET) [Brown, 1989], about 20 stations from the Illinois State Water Survey [Hollinger et al., 1994] and about ten stations from the Integrated Surface Irradiance Study (ISIS)[Hicks et al., 1996]. ISIS provides basic surface radiation data with repeatability, consistency, and accuracy based on reference standards maintained at levels better than 1% to address questions of spatial distributions and time trends, at sites selected to be (1) regionally representative, (2) long-term continuous, and (3) strategic foci. It should be noted that the SURFRAD network is also part of ISIS, which operates at two levels: Level 1 monitors incoming radiation only, and Level 2 (SURFRAD) focuses on surface radiation balance. The stations used in the validation effort are unevenly distributed over the United States or within the respective states as shown for Illinois and Arizona in Figure 4. The evaluation 15
16 16 against ground truth is done at the following time scales: 1) hourly; 2) daily; and 3) monthly. At the SURFRAD sites, data of high temporal resolution are available. The three-minute observations are being used here in experiments to evaluate time/space compatibility between ground and satellite observations. The quality of all model input parameters is not fully known. While there is confidence in the precipitable water information, as discussed and evaluated in Yarosh et al. [1996], less confidence can be placed on the snow information. Consequently, the Air Force snow information was replaced at the beginning of 1999 by the new NOAA/NESDIS Interactive Multisensor Snow and Ice Mapping System (IMS) product [Ramsay, 1998]. The ground observations on SW radiative fluxes are accepted as provided by each investigator, who follow calibration and quality control procedures, as described in each relevant publication. There is no cross-calibration between the various networks. Some of the results presented, include all available ground truth, as well as all available satellite observations, while others include preliminary quality controlled data, such as eliminating observations outside a 3-sigma limit. The options followed will be specified in each case. 6.1 Validation results on hourly time scale Results are presented for eleven months of 1996, except for ISIS stations for which only five months of data have been processed. For December 1996, satellite observations were available only for about two weeks, and therefore, December was not included in the statistics. In Figures 5(a), 5(b), 5(c), and 5(d), results on hourly time 16
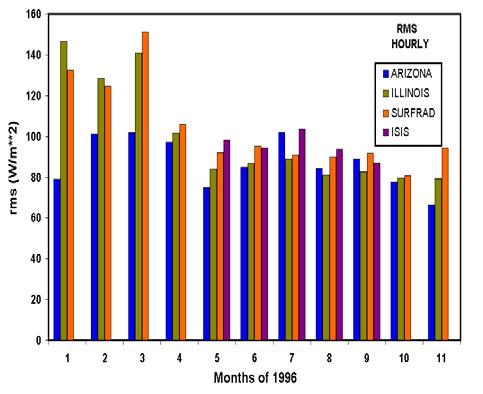
17 17 scales for Arizona, Illinois, SURFRAD, and ISIS stations, respectively, are presented. Due to the large amount of data, the figures include data points from only one month. Statistical results, independently for each month, are presented in Figures 9 and 10. The data used in the comparison were subjected to preliminary quality control measures, by eliminating cases outside a 3-sigma limit. Experiments have indicated that for most cases, such a limit is below 300 W m -2. To simplify computations, the elimination criteria were set to that latter limit. Given are the root mean square (rms) error, the bias, correlation coefficient, total number of available observations, the number of observations that were out of the 3-sigma limit, and the percentage of points eliminated from the total number of observations. The average rms for Arizona, Illinois, SURFRAD, and ISIS stations were 87, 100, 104 and 77 W m -2, respectively. As evident from Figures 9 and 10, the largest errors occur during the wintertime in regions affected by snow. As discussed, information on snow cover is deficient, and the methodology to identify clouds over snow requires improvements. Were we to eliminate the snow months from the statistics over Illinois and the SURFRAD locations, the rms error would be reduced to 83 and 90 W m -2, respectively. This amounts to about 15% of the mean value. The corresponding biases were 29 W m -2 and 30 W m -2 respectively, indicating that the satellite tended to overestimate the surface observations. The reason for this overestimate is not yet fully understood. Possibly, this is related to changes occurring in the calibration of the satellite sensor, needed improvements in cloud screening methods, or incorrect information on aerosol optical depths. Preliminary investigations indicate [Meng et al., 2002], that correcting for possible degradation of the visible sensor could reduce the bias substantially. No large differences were found for these different 17
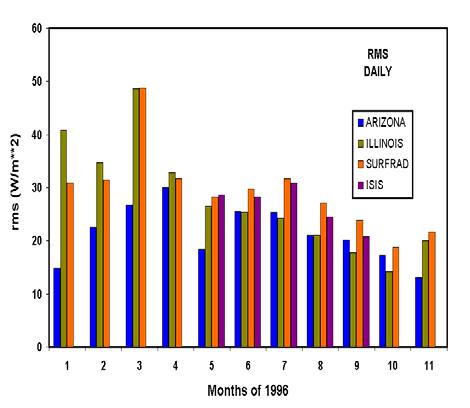
18 18 locations during the snow free months. The average percentage of points eliminated from the analysis under the 3-sigma limit was 1.7% for Arizona, 8.5% for Illinois (for snow free conditions), 6.3% for the SURFRAD, and 4.9% for ISIS. 6.2 Evaluation of results on daily time scale In Figures 6(a), 6(b), 6(c), and 6(d) results on daily time scales for Arizona, Illinois, the SURFRAD and the ISIS stations, respectively, are presented. Due to the large number of data points only four months have been included in these figures. For Arizona, data are included for January, May, June, and November. For Illinois and the SURFRAD stations, data from January, May, August, and November were used. For the ISIS stations, data from May-September were used. Statistical results, computed independently for each month, are presented in Figures 9 and 10. Given are the rms error, the bias, correlation coefficient, number of days when ground observations were available for the entire day, number of days when satellite observations were available for more than four observations per day (statistics were computed only for days when more than four satellite observations were available), and the percentage of cases eliminated because of above reasons, namely, not a complete or compatible record of either ground or satellite observations. The average rms for Arizona, Illinois, the SURFRAD and ISIS stations were 21, 28, 29 W m -2, and 26, respectively. Were we to eliminate the snow months from the statistics over Illinois and the SURFRAD locations, the rms error would reduce to 21 and 26 W m -2, respectively. This amounts to about 10 % of the mean value. The corresponding biases were 29 W m -2 and 30 W m -2, respectively, indicating that the satellite tended to overestimate the surface observations. No large differences were 18
19 19 found for these different locations. As evident, the larger errors for the Illinois and SURFRAD stations were found during the winter months, and most likely, are related to errors in snow cover. It should be noted that in subsequent years, the number of missing satellite data during the course of the day was reduced, as NOAA readiness for producing routinely this product improved. 6.3 Evaluation of results on monthly time scale In Figures 7(a), 7(b), 7(c) and 7(d) results on monthly time scales for Arizona, Illinois, SURFRAD and ISIS are presented. Statistical summaries for the SURFRAD stations are presented in Figures 9 and 10. The average rms for Arizona, Illinois, SURFRAD and the ISIS stations were 12, 16, 14 and 15 W m -2, respectively. In Figure 8, results for the diurnal variation of the shortwave fluxes are illustrated for the SURFRAD stations during May The results are encouraging, because until now, no information was available for validating or driving models that resolve the diurnal cycle. 6.4 Validation experiments at high temporal resolution In Figure 11, we present preliminary results from comparisons between the satellite derived SW fluxes and measurements from the SURFRAD network, using a range of time scales. The following two experiments were performed over the SURFRAD stations at Bondville, Illinois: a) using ground observations averaged over one hour, centered at the time of the satellite overpass, and satellite observations averaged over 3, 9, 15, and 60 minutes; b) using ground observations averaged over 3, 9, 15, and 60 minutes, and instantaneous satellite inferred surface flux. As evident from the figure, the best results were obtained when both the satellite and ground observations 19
20 20 were averaged over a one-hour interval. It is reasonable to expect that this particular time averaging depends on the average speed of cloud movement in this climatic region, and that at other locations, different optimal averaging periods would be found. 6.5 Special results At some locations, data from more than one source were available. For example, at Bondville, Illinois, observations are being made by the Illinois Water Survey, and by SURFRAD, at a distance of several meters from each other. Preliminary comparisons between these two stations for several months indicated discrepancies as illustrated in Figure 12a. After discussions with site scientists, the sources of such discrepancies were found, and corrected (Appendix A). Similarly, at Tucson, AZ, data were available from the AZMET network (32.17 N; W; 713 m elevation), as well as from the University of Arizona (W. D. Sellers, private communication). The differences between these two stations are illustrated in Figure 12b. As evident, they can be quite high, and the causes of these differences are not fully known. In Figure 13, we present the frequency distribution of the hourly ground observations (G) (upper panel) and satellite observations (S) (middle panel), in intervals of 40 W m -2, using data from all the stations in Arizona (a), SURFRAD and ISIS. The difference between the satellite estimates and the ground observations is illustrated in the lower panel. As evident, this difference is in the range between 0 to 5 %, indicating that both types of observations represent a similar radiation climate. 20
21 Estimates of accuracies of surface observations In the framework of the ARM activity, radiation measurements are being made at the Oklahoma Central Facility site located near Billings, Oklahoma using three sets of independent radiometers. These are operated and maintained per BSRN specifications [Michalsky et al., 1991]. The instruments include an Eppley PSP, 8-48 Black and White, NIP and PIR. Sci Tech trackers are used; the instruments are calibrated once per year and cleaned daily. Such observations for five years ( ) are used to develop best estimate criteria. Calculated are mean and average absolute deviations of the yearly 95% level values. Defined are yearly best, typical and worst disagreements [Shi and Long, 2002]. The operational limits are presented in Table 1 and are reported in units of W/m -2 : The best estimates of global shortwave are believed to be obtained by adding the direct and diffuse beams. Most instruments are not operated under best conditions, and therefore, these documented errors need to be considered when interpreting the evaluation of the satellite estimates against the ground observations. 7. Selected examples of data use Estimates of surface radiative fluxes from GOES satellite observations, both SW and PAR, as well as albedo values, have been used in various investigations, spanning a broad range of topics. Examples will be presented in the areas of meso-scale model improvements, hydrologic modeling, estimation of net primary productivity, and oceanic applications. 21
22 Assessments of operational models Assessment of land surface energy budgets, from regional and global models has been performed by Berbery et al. [1998; 1999] for one summer month (August 1997) and for one winter month (January 1998). The operational models are: the Eta model, the Mesoscale Analysis and Prediction System (MAPS) and the Global Environmental Multiscale (GEM). The National Center for Environmental Prediction/National Center for Atmospheric Research (NCEP/NCAR) Reanalysis model outputs, also were used for comparison purposes. Surface energy budgets, derived from various models, were compared against ground truth, using data from the Southern Great Plains Region. Additionally, the NOAA/NESDIS satellite estimates were used to evaluate the shortwave surface radiation. It was shown that the shortwave radiation biases of the models were of the order of W m -2. Daily time series showed that model estimates tended to miss the amplitude of the day-to-day variability. It is currently believed that this is the result of difficulties in parameterizing the total cloud cover. Results of Berbery et al. [1999] showed that the previous adjustments to the radiation scheme in the Eta model still require further corrections; similarly, their results prompted improvements to the parameterizations in MAPS, which as a result performed closer to the other models during the second month. The WCRP GEWEX Continental-scale International Project was originally aimed to assess the accuracy at which water and energy budgets can be closed on a continental scale [NRC, 1998]. The Mississippi River Basin was chosen as a first continental scale experiment because the Mississippi River Basin is one of the major river systems of the world and it has a very dense observational infrastructure and is rich in historic meteorological data. Results summarizing the findings on the Water 22
23 23 and Energy Budget Synthesis (WEBS) in the Mississippi River Basin are presented in Roads et al. [2002]. Information on radiative fluxes as derived from satellite observations was used in the evaluation process. 7.2 Assessments of research models Climate and numerical weather prediction models support now sophisticated land surface process schemes for partitioning energy and moisture fluxes at the surface. These schemes are responsible for maintaining soil moisture fields for model initialization, and for use in estimating runoff. These schemes are normally driven by model estimates of precipitation, radiation, cloud cover and air temperature and humidity. The models do not estimate precipitation accurately, nor do they forecast cloud cover or radiation well. Errors and bias in model forecasts of these quantities cause the soil moisture to drift away from reality. Uncoupled surface models are being tested in Land Data Assimilation Schemes (LDAS) [Mitchell et al., 2002] in which surface models are forced as much as possible with real observations instead of model output. Satellite observations of cloud cover and insolation and rain gage and radar observations of precipitation are used to force the uncoupled models. The assumption being that the real observations are not affected by the NWP model biases and therefore will maintain better soil moisture fields that can be used to initialize NWP models. Examples of such applications are given in Cosgrove et al. [2002] and Lou et al. [2002]. 7.3 Hydrologic modeling Climate and numerical weather prediction models have advanced to fairly sophisticated land surface process schemes for partitioning the energy and moisture 23
24 24 fluxes at the surface. These schemes are responsible for maintaining soil moisture fields for model initialization, and for use in estimating runoff. The schemes are normally driven by model estimates of precipitation, radiation, cloud cover and air temperature and humidity. The models do not estimate precipitation accurately, nor do they forecast cloud cover or radiation well. Errors and bias in model forecasts of these quantities cause the soil moisture to drift away from reality. Uncoupled surface models are being tested in Land Data Assimilation Schemes (LDAS) in which surface models are forced as much as possible with real observations instead of model output. Satellite observations of cloud cover and insolation and rain gage and radar observations of precipitation are used to force the uncoupled models. The assumption being that the real observations are not affected by the NWP model biases and therefore will maintain better soil moisture fields that can be used to initialize NWP models. 7.4 Net primary productivity At the Midwestern Climate Center, Illinois State Water Survey, work is in progress on estimating operationally, large area corn and soybean yield estimates. The area of study is the nine-state region of Illinois, Indiana, Iowa, Kentucky, Michigan, Minnesota, Missouri, Ohio, and Wisconsin that account for about 70% of the United States production of both corn and soybean. The yield estimation models [e.g., Jones and Kiniry, 1986; Wilkerson et al., 1983] require a set of variety coefficients, soil characteristics, daily weather data such as precipitation, max and min temperature, solar radiation (from which the photosynthetically active radiation (PAR) is estimated), and planting dates, depth and density. Till now, solar radiation was estimated from such parameters as cloud cover. The surface observing cloud networks are being replaced 24
25 25 with the Automated Surface Observing System (ASOS) stations, which do not measure cloud cover above 12,000 ft. Therefore, there is a concern about the effect this might have on the estimation of solar radiation by conventional methods. An experiment was conducted (K. Kunkel, private communication), to derive corn yields for the 1996 growing season, once using conventionally derived information on PAR which enters the model, and once, satellite derived estimates as produced for GCIP. The model yields were generated for 87 crop-reporting districts in the central United States, where each data point represents a value for a single crop-reporting district. These preliminary results indicate that replacing the current sources of information on surface radiative fluxes with satellite inferred values, is a viable option. 7.5 Oceanic applications As discussed in Baumgartner and Anderson [1998], in middle to low latitudes, the net shortwave radiation is the largest daytime component of the net air-sea heat flux. Errors in this component will also propagate into estimates of net heat fluxes. Currently, most coastal ocean models rely on surface fields as available from Numerical Weather Prediction models for surface boundary conditions. Using buoy observations made during a recent one year Coastal Mixing and Optics (CMO) Experiment at a mid-shelf location south of Cape Cod, Massachusetts, surface flux fields as available from three regional Numerical Weather Prediction models, that were in operation during 1996 and 1997 at the U.S. National Centers for Environmental Prediction (NCEP), were evaluated against the observations. The models used are: the Eta-48, Eta-29, and the Rapid Update Cycle (RUC-1) version. It was found that the models overestimated the net ocean-toatmosphere heat flux by about 83 and 74 W m -2 for the Eta-29 and RUC-1 models, 25
26 26 respectively. Experiments were conducted for the period July through September 1996, where the shortwave fluxes as produced in support of GCIP were used. It was found that the use of such fluxes in the CMO flux fields reduced the variability in the net heat flux errors by 46%. It is also claimed that the accuracy at hourly time scales would have improved. The correlation coefficients between the observations and the flux fields with and without the GCIP shortwave information over the same period are and 0.863, respectively. 8. Current and Future Activities During GCIP, operational numerical weather prediction models and associated 4-D data assimilation systems have been implemented at NCEP [Chen et al., 1996], and the operational output from the Eta model, as it evolves, is provided to NESDIS, for input to the SRB model. On the other hand, to meet the needs for the validation of the Eta model, NOAA/NESDIS is preparing a unique validation data set that contains Eta model forecast data mapped to the GCIP product output. They extract the 00Z run of the Eta model and pick up the 12, 18 and 24 hour forecast fields of total cloud amount, components of the SW and LW radiation budgets, skin temperature, vegetation fraction, albedo, snow cover, latent and sensible heat flux, surface heat flux, and total soil water content. This data is accessed only once a day, then mapped to 0.5 lat/long grid. Added are to the current GOES products: surface temperature (gridded ASOS, albedo, delta T(12-6) and delta T(18-12). Since February 1999, snow information, that was originally available from the Air Force product was replaced by a new product, as developed at NESDIS, and cloud screening methods, in particular, over snow, are being revisited. As of this writing, the 26
27 27 SRB data have been used by numerous investigators to evaluate meso-scale models [Berbery, 1998], computations of surface fluxes over the Atlantic Bight (Baumgartner and Anderson, 1999), evaluating crop production models (K. Kunkel, private communication), and snow melt [Cline and Carroll, 1998]. 9. Summary A joint activity between several branches of NOAA and the University of Maryland, to develop, implement, and use surface shortwave radiative fluxes, as recently available from operational GOES satellites, has been described. This capability was implemented by NOAA/NESDIS in real time, starting in mid 1995, and is continuing into present time. Based on results of evaluation against ground truth for 1996, it was found that the rms errors on hourly time scale were about 90 Wm -2, about 25 W m -2 on daily time scale, and about 20 W m -2 on monthly time scale. Experiments were also performed with different averaging time periods and different spatial integrations. The satellite estimates used are as obtained from the real-time runs, without adjustments for satellite sensor degradation and without "tuning" to local conditions. The accuracy of this product has been found to be better than currently believed to be achievable from numerical models. Therefore, the product in its present form has been found useful in a wide range of studies and applications. Still, many unresolved outstanding issues require further development and improvement. The key areas where improvements are needed are related to information about snow cover distribution, and cloud detection over snow. This is a difficult issue, and would require the use of additional channels, that are available on the GOES satellites. During the winter months, difficulties were encountered with reported snow amounts. This led to errors in cloud estimates and, 27
28 28 subsequently, in the surface fluxes, as evident from the statistics presented in Figures 9 and 10 for the winter months, in areas known to have snow. Strikingly, Arizona did not have this problem during the winter. Calibration of the satellite sensors is still a problem, and will require additional attention. To obtain accurate assessments of satellite capabilities to estimate surface radiative fluxes, there is a need to improve the quality of the ground observing stations, as well as their representativeness for each satellite grid cell. Work is in progress to remove known problems, and to expand the validation process to other climatic regions of the United States. Acknowledgments. The work at the University of Maryland was supported by grants NA86GPO202 and NA06GPO404 from NOAA/OGP and by NOAA grant NA57WC0340 to University of Maryland's Cooperative Institute for Climate Studies (R. T. Pinker, PI). The work on this project by NCEP/EMC, NWS/OHD, and NESDIS/ORA was supported by the NOAA OGP grant for the NOAA Core Project for GCIP/GAPP (co-pis K. Mitchell, J. Schaake, D. Tarpley). The work by NASA/GSFC/HSB was supported by NASA's Terrestrial Hydrology Program (P. Houser, PI). The work by Rutgers University was supported by NOAA OGP GAPP grant GC99-443b (A. Robock, PI). The work by Princeton was supported by NOAA OGP GAPP grant NA86GP0258 (E. Wood, PI). The work by NCEP/CPC was supported by NOAA/NASA GAPP Project 8R1DA114 (W. Higgins, PI). We thank NOAA for the SURFRAD data that were provided to the project at no cost. Thanks are due to Q.-H. Li for assistance in the evaluation of the satellite retrievals; to Dr. S. Hollinger for arranging the prompt transfer of ground observations from the Illinois Water Survey; Drs. J. DeLuisi, J. Augustine, and 28
29 29 C. Long for helpful discussions of the SURFRAD data; Dr. W. D. Sellers, for providing the University of Arizona, Tucson data; to Dr. K. Kunkel, for providing results from as yet unpublished work; and to Kevin Fitch, Navid Golpayegani and Wen Meng for building and maintaining the GCIP/GAPP Web site. The authors thank Byron Raines (Raytheon, STX) for his sustained effort in building and maintaining the NESDIS software system. Some figures were drawn with GrADS, created by Brian Doty. APPENDIX A The differences found in the observations from the two adjacent radiometers at Bondville, Illinois were investigated in depth (J. Augustine, private communication). One station belongs to the SURFRAD network, which operates an Eppley PSP, while the other is operated by the Illinois Water Survey Network, under the direction of Dr. S. Hollinger, using alternating black and white sectors as detectors. Initially, we compared observations for November and December, 1995 with satellite inferred values and found that the SURFRAD measurements were always lower than those from the Bondville BEARS site (here after, the Bondville instrument). The initial suspicion was that the differences appeared to be the result of a calibration offset in one of the instruments, because the absolute difference between measurements increased with the degree of downwelling irradiance. The calibration of the SURFRAD instrument was traced to National Renewable Energy Laboratory (NREL) during the summer of To resolve this issue, it was agreed (J. Augustine and S. Hollinger), that after the routine SURFRAD instrument exchange at Bondville, all instruments will be sent to Boulder, Colorado to be compared to the Surface Radiation Research Branch (SRRB) of the NOAA's Air 29
30 30 Resources Laboratory standard set of Eppley PSP instruments. For this purpose, the SRRB standard PSPs were recalibrated at NREL during September of The new sensitivity factors were applied to the standards, and the sensitivity factors that have been used while they were at Bondville, were applied to the returning pyranometers. The intercomparison has shown that qualitatively, all instruments saw the same signal, and none has shown anomalous behavior. It is usual for these instruments to produce slight negative signals at night owing to the inner dome cooling to space. The magnitude of these signals was evaluated, and found to be in a range that did not explain the differences between the two radiometers. Subsequently, the returning radiometers were gauged against each other, by forming ratios to the mean of the three standards. During two clear days of calibration, ratios of the SURFRAD radiometers to the mean of the standards are clustered near 1.0, but they did show a slight cosine error with respect to that of the standards. The Bondville instrument showed a systematic offset and a more severe cosine problem. During the cloudy period of the calibration, the SURFRAD instruments and the Bondville instrument showed unexplained random differences with respect to the standards. The mean ratio at 50 degrees of solar zenith angle (at this angle NREL computes sensitivity factors) for one SURFRAD instrument was 0.994, while for the other, it was For the Bondville instrument, it was 1.051, which translates to a bias of 5.1%, close to what we have. 30
31 31 References Augustine J. A., DeLuisi J. J., C. Long, NSURFRAD - A national surface radiation budget network for atmospheric research, Bull. Amer. Met. Soc., 81, , Baumgartner, M. F., and S. P. Anderson, Evaluation of NCEP regional numerical weather prediction model surface fields over the Middle Atlantic Bight, J. Geoph. Res., Oceans, 104 (C8): , Berbery E. H., K. Mitchell, S. Benjamin, T. Smirnova, H. Ritchie, R. Hogue and E. Radeva, Assessment of surface heat fluxes from regional models, GEWEX News, August 1998 issue. Berbery E. H., K. Mitchell, S. Benjamin, T. Smirnova, H. Ritchie, R. Hogue and E. Radeva, Assessment of surface heat fluxes from regional models, J Geophys. Res.- Atmos., 104 (D16): , Betts, A. K., J. H. Ball, A. C. J. Beljaars, M. J. Miller, and P. Viterbo, Land surface atmosphere interaction: A review based on observational and global modeling perspectives, J. Geophys. Res., 101, D3, , Briegleb, B. P., P. Minnis, V. Ramanathan and E. Harrison, Comparison of regional clear sky albedos inferred from satellite observations and model calculations, J. Climate Appl. Meteor., 25, , Brown, P., Accessing the Arizona Meteorological Network by Computer, The University of Arizona, College of Agriculture, Tucson, AZ 85721,
32 32 Chen, F., K. Mitchell, J. Schaake, Y. Xue, H. Pan, V. Koren, Q. Duan, and A. Betts, Modeling of land surface evaporation by four schemes and comparison with FIFE observations, J. Geophys. Res., 101, , Cline, D. and T. Carroll, Operational Automated Production of Daily, High Resolution, Cloud-free Snow Cover Maps of the Continental U. S, Mississippi River Climate Conference, June 8-12, 1998, St. Louis, Missouri, 1998 Cosgrove, B., K. Mitchell, P. Houser, E. Wood, A. Robock, J. Schaake, D. Lohmann, J. Sheffield, L. Luo, Q. Duan, D. Lettenmaier, R. T. Pinker. D. Tarpley, W. Higgins, An examination of Land Surface Model Spin-up Behavior in the North American Land Data Assimilation Systems (NLDAS) Project, Submitted for publication in JGR-Atmospheres, Cosgrove, B., D. Lohmann, K. Mitchell, P. Houser, E. Wood, J. Schaake, J. Sheffield, Q. Duan, D. Lettenmaier, R. T. Pinker, D. Tarpley, W. Higgins, Realtime and Retrospective Forcing in the North American Land Data Assimilation Systems (NLDAS) Project, Submitted for publication in JGR-Atmospheres, Dickinson, R., Global climate and its connection to the biosphere, In Climate-Vegetation Interactions, Rosenzweig, C. and R. Dickinson (eds.), Proceedings of a workshop held at NASA/Goddard Space Flight Center, Greenbelt, MD, January 27-29, 1986, p. 5-8, Fouquart. Y., B. Bonnel, and V. Ramaswamy, Intercomparing shortwave radiation codes for climate studies, J. Geophys. Res., 96, , Frouin, R., and R. T. Pinker, Estimating Photosynthetically Active Radiation (PAR) at the Earth s Surface from satellite observations, Remote Sens. Environ., 51,
33 33 Gallo, K. P. and A. Huang, Evaluation of the NDVI and sensor zenith angle values associated with the Global Land AVHRR 1-km data set, Int. J. Remote Sens, 19, , Garrat, J. R., P. B. Krummel, and E. A. Kowalczyk, The surface energy balance at local and regional scales-a comparison of general circulation model results with observations, J. Climate, 6, , Gates, W. L. et al., An overview of the results of the Atmospheric Model Intercomparison Project (AMIP) Bull. Amer. Met. Soc., 80, 29-56, Goward, S. N., Satellite bioclimatology, J. Climate, 2, , Goward, S. N., and K. F. Huemmrich, Vegetation canopy PAR absorptance and the Normalized Difference Vegetation Index-an assessment using the SAIL model. Remote Sens. Environ., 39, , Gupta, S. K., A. C. Wilber, N. A. Ritchey, C. H. Whitlock, and P. W. Stackhouse, Comparison of surface radiation fluxes in the NCEP/NCAR Reanalysis and the Langley 8-year SRB dataset, First WCRP International Conference on Reanalysis, Silver Spring, MD, October, Gutman, G., J. D. Tarpley, A. Ignatov, and S. Olson, The enhanced NOAA global land dataset from the advanced very-high resolution radiometer, Bull. Amer. Meteor. Soc., 76, , Henderson-Sellers, A., The project for intercomparison of land-surface parameterization schemes, Bull. Amer. Meteor. Soc., 74, , Hicks, B. B, J. J. DeLuisi, and D. Matt, The NOAA Integrated Surface Irradiance Study (ISIS): New Surface Radiation Monitoring Network, Bull. Amer. Meteor. Soc., 77, 33
34 , Hollinger, S. E., B. C. Reinke, and R. A. Peppler, Illinois Climate Network: Site Description, Instrumentation, and Data Management Illinois State Water Survey Circular 178, WARM Network Publication 1, 63 pp, Houghton, J. T., Y. Ding, D. J. Griggs, M. Noguer, P. J. van der Linden, X. Dai, K. Maskell, and C. A. Johnson, Eds., Climate Change 2001: The Scientific Basis. Cambridge Univ. Press, Cambridge, UK, 881 pp., Jones, C. A., and J. R. Kiniry [Eds], CERES-Maize: A simulation model of maize growth and development, Texas A & M University Press, College Station, 194 pp., Joseph, J. H., W. J. Wiscombe, and J. A. Weinman, The delta-eddington approximation for radiative transfer, J. Atmos. Sci., 33, , Justus, C. G., M. V. Paris, and J. D. Tarpley, Satellite-measured insolation in the United States, Mexico, and South America, Remote Sensing of the Environment, 20, 57-83, Kneizys, F.X., E. P. Shettles, L. W. Abreu, J.H. Chetwynd, G. P. Anderson, W. O. Anderson, J. E. A. Selby, and S. A. Clough, Guide to LOWTRAN 7, AFGL-TR-017, Lacis, A. A., and J. E. Hansen, A parameterization for the absorption of solar radiation in the earth's atmosphere, J. Atmos. Sci., 31, , Leese, J. A., Implementation Plan for the GEWEX Continental Scale International Project (GCIP). Vol. 3: Strategy Plan for Data Management, International GEWEX Project Office Publication Series No. 9, 49 pp,
35 35 Leese, J. A., Major Activities Plan for 1998, 1999 and Outlook for 2000 for the GEWEX Continental - scale International Project (GCIP), IGPO Publication Series No. 26, {Available from International GEWEX Project Office, 1100 Wayne Av., Suite 1225, Silver Spring, MD, 20910]. Luo, L., A. Robock, B. Cosgrove, K. Mitchell, P. Houser, E. Wood, J. Schaake, D. Lohmann, J. Sheffield, Q. Duan, D. Lettenmaier, R. T. Pinker, D. Tarpley, W. Higgins, Validation of Forcing of the North American Land Data Assimilation System (N-LDAS), Submitted for publication in JGR-Atmospheres, Meng, C. J., R. T. Pinker, J. D. Tarpley, and I. Laszlo, Use of ARM and CASES radiation measurements for evaluating GOES-8 satellite estimates of surface radiative fluxes, To be submitted to JGR Special Issue, Menzel, W. P. and J. F. Purdom, Introducing GOES-I: The first of a new generation of geostationary operational environmental satellites, Bull. Amer. Meteor. Soc., 75, , Michalsky J., E. Dutton, M. Rubes, D. Nelson, T. Stoffel, M. Wesley, M. Splitt, J. DeLuisi, Optimal measurement of surface shortwave irradiance using current instrumentation, J. Atmos. and Oceanic Tech., 16 (1): 55-69, Mitchell, K., D. Lohmann, P. Houser, E. Wood, A. Robock, J. Schaake, B. Cosgrove, J. Sheffield, L. Luo, Q. Duan, D. Lettenmaier, R. T. Pinker, D. Tarpley, W. Higgins, J. Meng, A. Bailey, F. Wen, The Multi-institution North American Land Data Assimilation System (N-LDAS): Leveraging multiple GCIP products in a real-time and retrospective distributed hydrological modeling system at continental scale, Submitted for publication in JGR-Atmospheres,
36 36 NRC, GCIP: Global Energy and Water Cycle Experiment (GEWEX) Continental-Scale International project: A Review of Progress and Opportunities. 1998, Report of the Global Energy and Water Cycle Experiment (GEWEX) Panel Climate Research Committee Board on Atmospheric Sciences and Climate Commission on Geosciences, Environment and Resources, National Research Council, National Academy Press, Washington DC, 93 pages. Ohmura, A., E. G. Dutton, B. Forgan, C. Frohlich, H. Gilgen, H. Hegner, A. Heimo, G. Konig-Langlo, B. McArthur, G. Muller, R. Philipona, R. T. Pinker, C. H. Whitlock, K. Dehne, and M. Wild, Baseline Surface Radiation Network (BSRN/WCRP): New Precision Radiometry for Climate Research, Bull. Amer. Met. Soc., 79, , Pinker, R. T. and I. Laszlo, Modeling surface solar irradiance for satellite applications on a global scale, J. Appl. Meteor., 31, , 1992a. Pinker R. T., and I. Laszlo, Global distribution of photosynthetically active radiation as observed from satellites, J. Climate, 5, 56-65, 1992b. Pinker, R. T., I. Laszlo, C. H. Whitlock and T. P. Charlock, Radiative Flux Opens New Window on Climate Research, EOS, 76, No. 15, April 11, Pinker, R. T., I. Laszlo, J. D. Tarpley and K. Mitchell, Geostationary Satellite Products for Surface Energy Balance Models, Advances in Space Research, in press, Platt, T., Primary production of the ocean water column as a function of surface light intensity: Algorithms for remote sensing, Deep Sea Res., 33, ,
37 37 Ramanathan, V., R. D. Cess, E. F. Harrison, P. Minnis, B. R. Barkstrom, E. Ahmad, and D. Hartmann, Cloud-radiative forcing and climate: Results from the Earth Radiation Budget Experiment, Science, 243, 57-63, Ramsay, Bruce, The interactive multisensor snow and ice mapping system, Hydrol. Process., 12, , Roesch, A., M. Wild, R. T. Pinker, and A. Ohmura, Comparison of spectral surface albedos and their impact on the GCM simulated surface climate, J. Geophys. Res., in press, Rossow W. B, R. A. Schiffer, Advances in understanding clouds from ISCCP, Bull. Am. Met. Soc., 80 (11): , Running, S. W., Collatz, G. J., Washburne, J., S. Sorooshian, Land Ecosystems and Hydrology. EOS Science Plan 5: , Roads, J., R. Lawford, E. Bainto, H. Berbery, B. Fekete, K. Gallo, A. Grundstein, W. Higgins, J. Janowiak, M. Kanamitsu, V. Lakshmi, D. Leathers, D. Lettenmaier, Q. Li, L. Luo, E. Maurer, T. Meyers, D. Miller, K. Mitchell, T. Mote, R. Pinker, T. Reichler, D. Robinson, A. Robock, J. Smith, G. Srinivasan, K. Vinnikov, T. von der Haar, C. Vorosmarty, S. Williams, E. Yarosh, GCIP Water and Energy Budget Synthesis (WEBS), In press, JGR-Atmospheres, Rogers, E., T. L. Black, D. G. Deavan, and G. J. DiMego, Changes to the operational "Early" Eta analysis/forecast system at the National Centers for Environmental Prediction, Weath. Forecasting, 11, ,
38 38 Rossow, W. B, and Y.-C. Zhang, Calculation of surface and top of the atmosphere radiative fluxes from physical quantities based on ISCCP data sets, 2. Validation and first results, J. Geophys. Res., 97, , Schiffer, R. A. and W. B. Rossow, ISCCP global radiance data set: A new resource for climate research, Bull. Amer. Meteor. Soc., 66, , Shi, Y., and C. N. Long, Techniques and Methods used to determine the Best Estimate of Radiation Fluxes at SGP Central Facility, 12th ARM Science Team Meeting Proceedings, St. Petersburg, Florida, April 8-12, Stephens, G. L., S. Ackerman and E. A. Smith, A shortwave parameterization revised to improve cloud absorption, J. Atmos. Sci., 41, , Sui, C.-H., M.M. Rienecker, X. Li, K.-M. Lau, I. Laszlo, and R.T. Pinker, The impacts of daily surface forcing in the upper ocean over tropical Pacific: A numerical study. J. Climate (in press). Tarpley, J. D., Estimating incident solar radiation at the surface from geostationary, J. Appl. Meteor., 18, , Tarpley, J. D., R. T. Pinker, and I. Laszlo, Experimental GOES Shortwave Radiation Budget for GCIP, Second International Scientific Conference on the Global Energy and Water Cycle, June 1996, Washington, D.C., 1996 Townshend, J. G. R., and C. O. Justice, Spatial variability of images and the monitoring of changes in the Normalized Difference Vegetation Index, Int. J. Remote Sens., 16, , WCP-55, World Climate Research Report of the experts meeting on aerosols and their climatic effects, Williamsburg, Virginia, March 1983, Eds: A. Deepak and H.E. Gerber, 107 pp.,
39 39 WCRP-67, GEWEX Continental Scale International Project, WMO/TD-No. 461, Weinreb, M. P., Calibration of GOES-I imager and sounder, AGU Spring, 1994 Meeting, May 23-27, Baltimore, MD, A22B-8, 83. Wielicki, B. A. et al., Mission to planet Earth: Role of clouds and Radiation in Climate, Bull. Amer. Meteor. Soc., 76, , Wielicki, B. A., R. d. Cess, M. D. King, D. A. Randall, E. F. Harrison, Mission to planet earth-role of clouds and radiation in climate, 76 (11): , Wielicki B. A, A. d. Del Genio, T. M. Wong, J. Y. Chen, B. E. Carlson, R. P. Allan, F. Robertson, H. Jacobowitz, A. Slingo, D. A. Randall, J. T. Kiehl, B. J. Soden, C. T. Gordon, A. J. Miller, S. K. Yang, J. Susskind, Changes in tropical clouds and radiation Response, Science, 296 (5576): U2-U Wild, M., A. Ohmura, H. Gilgen, and E. Roeckner, Validation of GCM simulated radiative fluxes using surface observations, J. Climate, 8, , Wilkerson, G. G., J. W. Jones, K. J. Boote, K. T. Ingram, and J. W. Mishoe, Modeling soybean growth for crop management, Trans. of the ASAE, 26, 63-73, Whitlock, C. H., T. P. Charlock, W. F. Staylor, R. T. Pinker, I. Laszlo, A. Ohmura, H. Gilgen, T. Konzelman, R. C. DiPasquale, C. D. Moats, S. R. LeCroy and N. A. Ritchey, First Global WCRP Shortwave surface Radiation Budget Data Set, Bull. Amer. Meteor. Soc. 76, No. 6, 1-18, Wood, E. F., D. P. Lettenmaier, X. Liang, B. Nijssen, and S. W. Wetzel, Hydrological modeling of continental scale basins, Review of Earth and Planetary Sciences, 25, Yarosh, E. S., C. F. Ropelewski, and K. E. Mitchell, Comparison of humidity 39
40 40 observations and ETA model analyses and forecasts for water balance studies, Journal of Geophysical Research, V, 101, No. D18, p , Zhou, L., I. Laszlo, and R. T. Pinker, Development of narrow to broadband transformations for GOES 8, Second International Scientific Conference on the Global Energy and Water Cycle, June 1996, Washington, D.C., 1996 Table 1. Operational limits on measured short-wave [after Shi and Long, 2002] Best Typical Worst Diffuse SW Direct Norma; Upwelling SW
41 41 Table 2. Clear-sky radiance Input Parameter Quantities required by the GCIP/SRB model. Function Calculate fluxes for clear-sky conditions Cloudy radiance Calculate fluxes for cloudy conditions Composite clear radiance Calculate surface albedo Target fractional cloud cover Weight clear and cloudy fluxes Water vapor and ozone amount Select atmospheric transmittance Snow cover Weight snow-free surface albedo and snow albedo Geometric corrections Solar and satellite zenith angles, sunsatellite relative azimuth angle Target latitude and longitude Scene type, surface albedo model, and climatological aerosol loading 41
42 42 Table 3. Output parameters from the GCIP SRB Model. clr-clear; cldy-cloudy. Parameter Unit aerosol optical depth at 0.55 µm - cloud optical depth at 0.55 µm - top of atmosphere down-flux (clr+cldy) W m -2 top of atmosphere up-flux (clr+cldy) W m -2 surface down-flux (clr+cldy) W m -2 surface up-flux (clr+cldy) W m -2 top of atmosphere up-flux (clr) W m -2 surface down-flux (clr) W m -2 surface up-flux (clr) W m -2 diffuse surface-down flux (clr+cldy) W m -2 diffuse PAR W m -2 global (direct+diffuse) PAR W m -2 42
43 43 List of Figures Figure 1. Illustration of the spatial distribution of selected parameters available from the GOES-8 GCIP/GAPP product: a) Instantaneous surface short-wave radiative flux (W/m 2 ), for 17:15 UTC, September 15, b) Same as above, hourly averaged for 12:00 noon. The hourly averaged data are stored and displayed in LST, making the time zones visible. To minimize this effect, the noon hour was selected for the hourly integration. c) Same as above, for the daily mean values for September 15, d) Same as above, for the monthly mean values for September e) Monthly mean atmospheric short-wave absorption, namely, the difference between the top of the atmosphere and the surface monthly mean values, for September f) Monthly mean surface net short-wave flux for September g) Monthly mean cloud optical depth for September h) Monthly mean cloud fraction for September Figure 2. Top of the atmosphere broadband and filtered narrow-band reflectances (representing the visible channel of GOES-8) as simulated with the LOWTRAN 7 radiation code for various viewing and solar geometries (represented by angular bins), considering different amounts of water vapor, ozone, aerosol, clouds and surface types. 43
44 44 Figure 3. Figure 4. A summary of the processing sequence of the SRB product. Location of ground stations used in the validation effort. Figure 5. (a) Evaluation of results on hourly time scales for 19 stations in Arizona. (b) (c) Evaluation of results on hourly time scales for 21 station in Illinois Evaluation of results on hourly time scales for four SURFRAD stations. (d) Evaluation of results on hourly time scales for 10 ISIS stations. Figure 6. (a) Evaluation of results on daily time scale for 19 stations in Arizona. (b) (c) Evaluation of results on daily time scale for 21 station in Illinois Evaluation of results on daily time scale for four SURFRAD stations. (d) Evaluation of results on daily time scale ten ISIS stations. Figure 7. (a) Evaluation of results on monthly time scale for 19 stations in Arizona. (b) Evaluation of results on monthly time scale for 21 stations in Illinois. (c) Evaluation of results on daily time scale for the four SURFRAD stations. (d) Evaluation of results on monthly time scale for ten ISIS stations. Figure 8. Evaluation of results of the monthly mean hourly values for four SURFRAD stations, May
45 45 Figure 9. The rms and bias for the four groups of stations (Arizona, Illinois, SURFRAD, ISIS), on hourly, daily, and monthly time scales. Figure 10. Figure 11. Same as above for correlation coefficients. Experiments in evaluation using different time scales of: a) SURFRAD ground observation b) satellite estimates. Figure 12. Comparison of ground observations from two adjacent stations in: (a) Bondville, Illinois; one stations belongs to the Illinois Water Survey, and the other one is a SURFRAD station. (b) Tucson, Arizona; one station belongs to the AZMET network, while the other is located on the Campus of the University of Arizona. Figure 13. The frequency distribution of hourly averaged SW downward fluxes using: a) all 19 ground stations in Arizona, and corresponding satellite estimates for the ground observing locations, for eleven months of b) all 21 ground stations in Illinois, and corresponding satellite estimates for the ground observing locations, for eleven months of c) all four SURFRAD ground stations, and corresponding satellite estimates for the ground observing locations, for eleven months of d) all ten ISIS ground stations, and corresponding satellite estimates for the ground observing locations, for five months of
46 46 46
47 47 Figure 1. Illustration of the spatial distribution of selected parameters available from the GOES-8 GCIP/GAPP product: a) Instantaneous surface shortwave radiative flux (Wm -2 ), for 17:15 UTC, September 15, b) Same as above, hourly averaged for 12:00 noon. The hourly averaged data are stored and displayed in LST, making the time zones visible. To minimize this effect, the noon hour was selected for the hourly integration. c) Same as above, for the daily mean values for September 15, d) Same as above, for the monthly mean values for September e) Monthly mean atmospheric shortwave absorption, namely, the difference between the top of the atmosphere and the surface monthly mean values, for September f) Monthly mean surface net shortwave flux for September g) Monthly mean cloud optical depth for September h) Monthly mean cloud fraction for September
48 48 Figure 2. Top of the atmosphere broadband and filtered narrowband reflectances (representing the visible channel of GOES-8) as simulated with the LOWTRAN 7 radiation code for various viewing and solar geometries (represented by angular bins), considering different amounts of water vapor, ozone, aerosol, clouds and surface types. 48
49 49 Figure 3. A summary of the processing sequence of the SRB product. 49

50 50 Figure 4. Location of ground stations used in the validation effort. 50
51 51 5a 5b 5c) 5d) Figure 5. Evaluation of results on hourly time scale for:a) 19 Arizona AZMET stations; b) 21 Illinois stations; c) four SURFRAD stations; and d) ten ISIS stations. Due to data density, only one month of data is presented here. 51
52 52 6a 6b 6c 6d) Figure 6. Evaluation of results on daily time scale for:a) 19 Arizona AZMET stations; b) 21 Illinois stations; c) four SURFRAD stations; and, d) ten ISIS stations. Due to data density, only four months of data is used (five months for ISIS). 52
53 53 7a 7b 7c) 7d Figure 7. Evaluation of results on monthly time scale for:a) 19 Arizona AZMET stations; b) 21 Illinois stations; c) four SURFRAD stations; and d) ten ISIS stations. Eleven months of data were used (five for ISIS stations). 53
54 54 Figure 8. Evaluation of results for the monthly mean diurnal cycle for the SURFRAD stations for May

55 55 55
Land Data Assimilation at NCEP NLDAS Project Overview, ECMWF HEPEX 2004
 Dag.Lohmann@noaa.gov, Land Data Assimilation at NCEP NLDAS Project Overview, ECMWF HEPEX 2004 Land Data Assimilation at NCEP: Strategic Lessons Learned from the North American Land Data Assimilation System
P1.34 MULTISEASONALVALIDATION OF GOES-BASED INSOLATION ESTIMATES. Jason A. Otkin*, Martha C. Anderson*, and John R. Mecikalski #
 P1.34 MULTISEASONALVALIDATION OF GOES-BASED INSOLATION ESTIMATES Jason A. Otkin*, Martha C. Anderson*, and John R. Mecikalski # *Cooperative Institute for Meteorological Satellite Studies, University of
Radiative Climatology of the North Slope of Alaska and the Adjacent Arctic Ocean
 Radiative Climatology of the North Slope of Alaska and the Adjacent Arctic Ocean C. Marty, R. Storvold, and X. Xiong Geophysical Institute University of Alaska Fairbanks, Alaska K. H. Stamnes Stevens Institute
TRENDS IN DIRECT NORMAL SOLAR IRRADIANCE IN OREGON FROM
 TRENDS IN DIRECT NORMAL SOLAR IRRADIANCE IN OREGON FROM 1979-200 Laura Riihimaki Frank Vignola Department of Physics University of Oregon Eugene, OR 970 lriihim1@uoregon.edu fev@uoregon.edu ABSTRACT To
Introducing NREL s Gridded National Solar Radiation Data Base (NSRDB)
") Introducing NREL s Gridded National Solar Radiation Data Base (NSRDB) Manajit Sengupta Aron Habte, Anthony Lopez, Yu Xi and Andrew Weekley, NREL Christine Molling CIMMS Andrew Heidinger, NOAA International
Introducing NREL s Gridded National Solar Radiation Data Base (NSRDB) Manajit Sengupta Aron Habte, Anthony Lopez, Yu Xi and Andrew Weekley, NREL Christine Molling CIMMS Andrew Heidinger, NOAA International
D. Lohmann, Pablo Grunman, and Kenneth Mitchell (2004), Land data assimilation at NOAA/NCEP/EMC, in Proceedings of the 2 nd international CAHMDA
, Land data assimilation at NOAA/NCEP/EMC, in Proceedings of the 2 nd international CAHMDA") D. Lohmann, Pablo Grunman, and Kenneth Mitchell (2004), Land data assimilation at NOAA/NCEP/EMC, in Proceedings of the 2 nd international CAHMDA workshop on: The Terrestrial Water Cycle: Modelling and
D. Lohmann, Pablo Grunman, and Kenneth Mitchell (2004), Land data assimilation at NOAA/NCEP/EMC, in Proceedings of the 2 nd international CAHMDA workshop on: The Terrestrial Water Cycle: Modelling and
2nd Annual CICS-MD Science Meeting November 6-7, 2013 Earth System Science Interdisciplinary Center University of Maryland, College Park, MD
 Development of Algorithms for Shortwave Radiation Budget from GOES-R R. T. Pinker, M. M. Wonsick GOES-R Algorithm Working Group Radiation Budget Application Team John A. Augustine (NOAA); Hye-Yun Kim (IMSG);
Surface Radiation Budget from ARM Satellite Retrievals
 Surface Radiation Budget from ARM Satellite Retrievals P. Minnis, D. P. Kratz, and T. P. charlock Atmospheric Sciences National Aeronautics and Space Administration Langley Research Center Hampton, Virginia
SUNY Satellite-to-Solar Irradiance Model Improvements
 SUNY Satellite-to-Solar Irradiance Model Improvements Higher-accuracy in snow and high-albedo conditions with SolarAnywhere Data v3 SolarAnywhere Juan L Bosch, Adam Kankiewicz and John Dise Clean Power
APPLICATIONS WITH METEOROLOGICAL SATELLITES. W. Paul Menzel. Office of Research and Applications NOAA/NESDIS University of Wisconsin Madison, WI
 APPLICATIONS WITH METEOROLOGICAL SATELLITES by W. Paul Menzel Office of Research and Applications NOAA/NESDIS University of Wisconsin Madison, WI July 2004 Unpublished Work Copyright Pending TABLE OF CONTENTS
Antarctic Cloud Radiative Forcing at the Surface Estimated from the AVHRR Polar Pathfinder and ISCCP D1 Datasets,
 JUNE 2003 PAVOLONIS AND KEY 827 Antarctic Cloud Radiative Forcing at the Surface Estimated from the AVHRR Polar Pathfinder and ISCCP D1 Datasets, 1985 93 MICHAEL J. PAVOLONIS Cooperative Institute for
VALIDATION OF THE OSI SAF RADIATIVE FLUXES
 VALIDATION OF THE OSI SAF RADIATIVE FLUXES Pierre Le Borgne, Gérard Legendre, Anne Marsouin Météo-France/DP/Centre de Météorologie Spatiale BP 50747, 22307 Lannion, France Abstract The Ocean and Sea Ice
Solar Insolation and Earth Radiation Budget Measurements
 Week 13: November 19-23 Solar Insolation and Earth Radiation Budget Measurements Topics: 1. Daily solar insolation calculations 2. Orbital variations effect on insolation 3. Total solar irradiance measurements
History of Earth Radiation Budget Measurements With results from a recent assessment
 History of Earth Radiation Budget Measurements With results from a recent assessment Ehrhard Raschke and Stefan Kinne Institute of Meteorology, University Hamburg MPI Meteorology, Hamburg, Germany Centenary
SATELLITE BASED ASSESSMENT OF THE NSRDB SITE IRRADIANCES AND TIME SERIES FROM NASA AND SUNY/ALBANY ALGORITHMS
 SATELLITE BASED ASSESSMENT OF THE NSRDB SITE IRRADIANCES AND TIME SERIES FROM NASA AND SUNY/ALBANY ALGORITHMS Paul W. Stackhouse, Jr 1, Taiping Zhang 2, William S. Chandler 2, Charles H. Whitlock 2, James
Evaluation of Satellite and Reanalysis Products of Downward Surface Solar Radiation over East Asia
 International Workshop on Land Use/Cover Changes and Air Pollution in Asia August 4-7th, 2015, Bogor, Indonesia Evaluation of Satellite and Reanalysis Products of Downward Surface Solar Radiation over
Changes in Earth s Albedo Measured by satellite
 Changes in Earth s Albedo Measured by satellite Bruce A. Wielicki, Takmeng Wong, Norman Loeb, Patrick Minnis, Kory Priestley, Robert Kandel Presented by Yunsoo Choi Earth s albedo Earth s albedo The climate
Seeking a consistent view of energy and water flows through the climate system
 Seeking a consistent view of energy and water flows through the climate system Robert Pincus University of Colorado and NOAA/Earth System Research Lab Atmospheric Energy Balance [Wm -2 ] 340.1±0.1 97-101
Global Urban-Scale Land-Atmosphere Modeling with the Land Information System
 Global Urban-Scale Land-Atmosphere Modeling with the Land Information System C. D. Peters-Lidard 1, S. V. Kumar 2, Y. Tian 2, J. L. Eastman 2, and P. R. Houser 1 1* NASA, Goddard Space Flight Center Hydrological
An Annual Cycle of Arctic Cloud Microphysics
 An Annual Cycle of Arctic Cloud Microphysics M. D. Shupe Science and Technology Corporation National Oceanic and Atmospheric Administration Environmental Technology Laboratory Boulder, Colorado T. Uttal
Ellsworth Dutton & Paul Stackhouse NOAA, Earth System Research Lab & NASA, Langley Radiation Sciences
 Surface Radiation Budget Observations: From Instantaneous Point Measurements to Longterm Global Means, Progress and Challenges (with emphasis on broadband downwelling components) Ellsworth Dutton & Paul
EVALUATING SOLAR RESOURCE VARIABILITY FROM SATELLITE AND GROUND-BASED OBSERVATIONS
 EVALUATING SOLAR RESOURCE VARIABILITY FROM SATELLITE AND GROUND-BASED OBSERVATIONS Mary Anderberg, Dave Renné, Thomas Stoffel, and Manajit Sengupta National Renewable Energy Laboratory 1617 Cole Blvd.
John R. Mecikalski #1, Martha C. Anderson*, Ryan D. Torn #, John M. Norman*, George R. Diak #
 P4.22 THE ATMOSPHERE-LAND EXCHANGE INVERSE (ALEXI) MODEL: REGIONAL- SCALE FLUX VALIDATIONS, CLIMATOLOGIES AND AVAILABLE SOIL WATER DERIVED FROM REMOTE SENSING INPUTS John R. Mecikalski #1, Martha C. Anderson*,
Michael B. Ek 1, Youlong Xia 1,2, Jesse Meng 1,2, and Jiarui Dong 1,2
 Michael B. Ek 1, Youlong Xia 1,2, Jesse Meng 1,2, and Jiarui Dong 1,2 1 Land-Hydrology Team Environmental Modeling Center (EMC) National Centers for Environmental Prediction (NCEP) National Weather Service
9.4. The newly released 5-year Terra-based monthly CERES radiative flux and cloud product. David R. Doelling, D. F. Keyes AS&M, Inc.
 9.4 The newly released 5-year Terra-based monthly CERES radiative flux and cloud product David R. Doelling, D. F. Keyes AS&M, Inc., Hampton, VA D. F. Young, B. A. Wielicki, T. Wong NASA Langley Research
1.0 BACKGROUND 1.1 Surface Radiation
 1.0 BACKGROUND 1.1 Surface Radiation Meteorologists have utilized recent advances in computer speeds and atmospheric models to create increasingly accurate models of the environment. The computational
Evaluation of a New Land Surface Model for JMA-GSM
 Evaluation of a New Land Surface Model for JMA-GSM using CEOP EOP-3 reference site dataset Masayuki Hirai Takuya Sakashita Takayuki Matsumura (Numerical Prediction Division, Japan Meteorological Agency)
Chapter 2 Available Solar Radiation
 Chapter 2 Available Solar Radiation DEFINITIONS Figure shows the primary radiation fluxes on a surface at or near the ground that are important in connection with solar thermal processes. DEFINITIONS It
Real-time and retrospective forcing in the North American Land Data Assimilation System (NLDAS) project
 project") JOURNAL OF GEOPHYSICAL RESEARCH, VOL. 108, NO. D22, 8842, doi:10.1029/2002jd003118, 2003 Real-time and retrospective forcing in the North American Land Data Assimilation System (NLDAS) project Brian A.
JOURNAL OF GEOPHYSICAL RESEARCH, VOL. 108, NO. D22, 8842, doi:10.1029/2002jd003118, 2003 Real-time and retrospective forcing in the North American Land Data Assimilation System (NLDAS) project Brian A.
Modeling the Arctic Climate System
 Modeling the Arctic Climate System General model types Single-column models: Processes in a single column Land Surface Models (LSMs): Interactions between the land surface, atmosphere and underlying surface
Validation of the North American Land Data Assimilation System (NLDAS) retrospective forcing over the southern Great Plains
 retrospective forcing over the southern Great Plains") JOURNAL OF GEOPHYSICAL RESEARCH, VOL. 108, NO. D22, 8843, doi:10.1029/2002jd003246, 2003 Validation of the North American Land Data Assimilation System (NLDAS) retrospective forcing over the southern Great
JOURNAL OF GEOPHYSICAL RESEARCH, VOL. 108, NO. D22, 8843, doi:10.1029/2002jd003246, 2003 Validation of the North American Land Data Assimilation System (NLDAS) retrospective forcing over the southern Great
REVISION OF THE STATEMENT OF GUIDANCE FOR GLOBAL NUMERICAL WEATHER PREDICTION. (Submitted by Dr. J. Eyre)
") WORLD METEOROLOGICAL ORGANIZATION Distr.: RESTRICTED CBS/OPAG-IOS (ODRRGOS-5)/Doc.5, Add.5 (11.VI.2002) COMMISSION FOR BASIC SYSTEMS OPEN PROGRAMME AREA GROUP ON INTEGRATED OBSERVING SYSTEMS ITEM: 4 EXPERT
WORLD METEOROLOGICAL ORGANIZATION Distr.: RESTRICTED CBS/OPAG-IOS (ODRRGOS-5)/Doc.5, Add.5 (11.VI.2002) COMMISSION FOR BASIC SYSTEMS OPEN PROGRAMME AREA GROUP ON INTEGRATED OBSERVING SYSTEMS ITEM: 4 EXPERT
THE LAND-SAF SURFACE ALBEDO AND DOWNWELLING SHORTWAVE RADIATION FLUX PRODUCTS
 THE LAND-SAF SURFACE ALBEDO AND DOWNWELLING SHORTWAVE RADIATION FLUX PRODUCTS Bernhard Geiger, Dulce Lajas, Laurent Franchistéguy, Dominique Carrer, Jean-Louis Roujean, Siham Lanjeri, and Catherine Meurey
Snow Process Modeling in the North American Land Data Assimilation System (NLDAS). Part I: Evaluation of Model Simulated Snow Cover Extent
. Part I: Evaluation of Model Simulated Snow Cover Extent") Snow Process Modeling in the North American Land Data Assimilation System (NLDAS). Part I: Evaluation of Model Simulated Snow Cover Extent Justin Sheffield 1, Ming Pan 1, Eric F. Wood 1, Kenneth E. Mitchell
Snow Process Modeling in the North American Land Data Assimilation System (NLDAS). Part I: Evaluation of Model Simulated Snow Cover Extent Justin Sheffield 1, Ming Pan 1, Eric F. Wood 1, Kenneth E. Mitchell
Land Surface Processes and Their Impact in Weather Forecasting
 Land Surface Processes and Their Impact in Weather Forecasting Andrea Hahmann NCAR/RAL with thanks to P. Dirmeyer (COLA) and R. Koster (NASA/GSFC) Forecasters Conference Summer 2005 Andrea Hahmann ATEC
Evaluating Parametrizations using CEOP
 Evaluating Parametrizations using CEOP Paul Earnshaw and Sean Milton Met Office, UK Crown copyright 2005 Page 1 Overview Production and use of CEOP data Results SGP Seasonal & Diurnal cycles Other extratopical
Net Surface Shortwave Radiation from GOES Imagery Product Evaluation Using Ground-Based Measurements from SURFRAD
 Remote Sens. 2015, 7, 10788-10814; doi:10.3390/rs70810788 Article OPEN ACCESS remote sensing ISSN 2072-4292 www.mdpi.com/journal/remotesensing Net Surface Shortwave Radiation from GOES Imagery Product
A HIGH RESOLUTION EUROPEAN CLOUD CLIMATOLOGY FROM 15 YEARS OF NOAA/AVHRR DATA
 A HIGH RESOLUTION EUROPEAN CLOUD CLIMATOLOGY FROM 15 YEARS OF NOAA/AVHRR DATA R. Meerkötter 1, G. Gesell 2, V. Grewe 1, C. König 1, S. Lohmann 1, H. Mannstein 1 Deutsches Zentrum für Luft- und Raumfahrt
Flux Tower Data Quality Analysis in the North American Monsoon Region
 Flux Tower Data Quality Analysis in the North American Monsoon Region 1. Motivation The area of focus in this study is mainly Arizona, due to data richness and availability. Monsoon rains in Arizona usually
Radiation balance of the Earth. 6. Earth radiation balance under present day conditions. Top of Atmosphere (TOA) Radiation balance
 Radiation balance") Radiation balance of the Earth Top of Atmosphere (TOA) radiation balance 6. Earth radiation balance under present day conditions Atmospheric radiation balance: Difference between TOA and surface radiation
Radiation balance of the Earth Top of Atmosphere (TOA) radiation balance 6. Earth radiation balance under present day conditions Atmospheric radiation balance: Difference between TOA and surface radiation
PRODUCING SATELLITE-DERIVED IRRADIANCES IN COMPLEX ARID TERRAIN
 PRODUCING SATELLITE-DERIVED IRRADIANCES IN COMPLEX ARID TERRAIN Richard Perez ASRC, the University at Albany 251 Fuller Rd. Albany, NY 12203 perez@asrc.cestm.albany.edu Pierre Ineichen, CUEPE, University
NEAR REAL TIME GLOBAL RADIATION AND METEOROLOGY WEB SERVICES AVAILABLE FROM NASA
 NEARREAL TIMEGLOBALRADIATIONANDMETEOROLOGYWEBSERVICESAVAILABLE FROMNASA ABSTRACT WilliamS.Chandler JamesM.Hoell DavidWestberg CharlesH.Whitlock TaipingZhang ScienceSystems&Applications,Inc. OneEnterpriseParkway,Suite200
OPTIMISING THE TEMPORAL AVERAGING PERIOD OF POINT SURFACE SOLAR RESOURCE MEASUREMENTS FOR CORRELATION WITH AREAL SATELLITE ESTIMATES
 OPTIMISING THE TEMPORAL AVERAGING PERIOD OF POINT SURFACE SOLAR RESOURCE MEASUREMENTS FOR CORRELATION WITH AREAL SATELLITE ESTIMATES Ian Grant Anja Schubert Australian Bureau of Meteorology GPO Box 1289
Variability in Global Top-of-Atmosphere Shortwave Radiation Between 2000 And 2005
 Variability in Global Top-of-Atmosphere Shortwave Radiation Between 2000 And 2005 Norman G. Loeb NASA Langley Research Center Hampton, VA Collaborators: B.A. Wielicki, F.G. Rose, D.R. Doelling February
Influence of variations in low-level moisture and soil moisture on the organization of summer convective systems in the US Midwest
 Influence of variations in low-level moisture and soil moisture on the organization of summer convective systems in the US Midwest Jimmy O. Adegoke 1, Sajith Vezhapparambu 1, Christopher L. Castro 2, Roger
Interannual variability of top-ofatmosphere. CERES instruments
 Interannual variability of top-ofatmosphere albedo observed by CERES instruments Seiji Kato NASA Langley Research Center Hampton, VA SORCE Science team meeting, Sedona, Arizona, Sep. 13-16, 2011 TOA irradiance
Improved Fields of Satellite-Derived Ocean Surface Turbulent Fluxes of Energy and Moisture
 Improved Fields of Satellite-Derived Ocean Surface Turbulent Fluxes of Energy and Moisture First year report on NASA grant NNX09AJ49G PI: Mark A. Bourassa Co-Is: Carol Anne Clayson, Shawn Smith, and Gary
Recommendations from COST 713 UVB Forecasting
 Recommendations from COST 713 UVB Forecasting UV observations UV observations can be used for comparison with models to get a better understanding of the processes influencing the UV levels reaching the
1.11 CROSS-VALIDATION OF SOIL MOISTURE DATA FROM AMSR-E USING FIELD OBSERVATIONS AND NASA S LAND DATA ASSIMILATION SYSTEM SIMULATIONS
 1.11 CROSS-VALIDATION OF SOIL MOISTURE DATA FROM AMSR-E USING FIELD OBSERVATIONS AND NASA S LAND DATA ASSIMILATION SYSTEM SIMULATIONS Alok K. Sahoo *, Xiwu Zhan** +, Kristi Arsenault** and Menas Kafatos
Satellite-to-Irradiance Modeling A New Version of the SUNY Model
 Satellite-to-Irradiance Modeling A New Version of the SUNY Model Richard Perez 1, James Schlemmer 1, Karl Hemker 1, Sergey Kivalov 1, Adam Kankiewicz 2 and Christian Gueymard 3 1 Atmospheric Sciences Research
Comparison of Aircraft Observed with Calculated Downwelling Solar Fluxes during ARESE Abstract
 Comparison of Aircraft Observed with Calculated Downwelling Solar Fluxes during ARESE Abstract The objectives of the Atmospheric Radiation Measurement (ARM) Enhanced Shortwave Experiment (ARESE) are to
Inter- Annual Land Surface Variation NAGS 9329
 Annual Report on NASA Grant 1 Inter- Annual Land Surface Variation NAGS 9329 PI Stephen D. Prince Co-I Yongkang Xue April 2001 Introduction This first period of operations has concentrated on establishing
(1) AEMET (Spanish State Meteorological Agency), Demóstenes 4, Málaga, Spain ABSTRACT
 AEMET (Spanish State Meteorological Agency), Demóstenes 4, Málaga, Spain ABSTRACT") COMPARISON OF GROUND BASED GLOBAL RADIATION MEASUREMENTS FROM AEMET RADIATION NETWORK WITH SIS (SURFACE INCOMING SHORTWAVE RADIATION) FROM CLIMATE MONITORING-SAF Juanma Sancho1, M. Carmen Sánchez de Cos1,
COMPARISON OF GROUND BASED GLOBAL RADIATION MEASUREMENTS FROM AEMET RADIATION NETWORK WITH SIS (SURFACE INCOMING SHORTWAVE RADIATION) FROM CLIMATE MONITORING-SAF Juanma Sancho1, M. Carmen Sánchez de Cos1,
A Longwave Broadband QME Based on ARM Pyrgeometer and AERI Measurements
 A Longwave Broadband QME Based on ARM Pyrgeometer and AERI Measurements Introduction S. A. Clough, A. D. Brown, C. Andronache, and E. J. Mlawer Atmospheric and Environmental Research, Inc. Cambridge, Massachusetts
Assimilation of satellite derived soil moisture for weather forecasting
 Assimilation of satellite derived soil moisture for weather forecasting www.cawcr.gov.au Imtiaz Dharssi and Peter Steinle February 2011 SMOS/SMAP workshop, Monash University Summary In preparation of the
VALIDATION RESULTS OF THE OPERATIONAL LSA-SAF SNOW COVER MAPPING
 VALIDATION RESULTS OF THE OPERATIONAL LSA-SAF SNOW COVER MAPPING Niilo Siljamo, Otto Hyvärinen Finnish Meteorological Institute, Erik Palménin aukio 1, P.O.Box 503, FI-00101 HELSINKI Abstract Hydrological
V = V o e m τ (1) P4.35 AN AEROSOL OPTICAL DEPTH PRODUCT FOR NOAA'S SURFRAD NETWORK
 P4.35 AN AEROSOL OPTICAL DEPTH PRODUCT FOR NOAA'S SURFRAD NETWORK") P4.35 AN AEROSOL OPTICAL DEPTH PRODUCT FOR NOAA'S SURFRAD NETWORK John A. Augustine*, Joseph J. Michalsky, and Gary B. Hodges NOAA Earth System Research Laboratory Global Monitoring Division Boulder, Colorado
P4.35 AN AEROSOL OPTICAL DEPTH PRODUCT FOR NOAA'S SURFRAD NETWORK John A. Augustine*, Joseph J. Michalsky, and Gary B. Hodges NOAA Earth System Research Laboratory Global Monitoring Division Boulder, Colorado
Using satellite-derived snow cover data to implement a snow analysis in the Met Office global NWP model
 Using satellite-derived snow cover data to implement a snow analysis in the Met Office global NWP model Pullen, C Jones, and G Rooney Met Office, Exeter, UK amantha.pullen@metoffice.gov.uk 1. Introduction
P4.23 INTRODUCING THE GOES IMAGER CLEAR-SKY BRIGHTNESS TEMPERATURE (CSBT) PRODUCT
 PRODUCT") P4.23 INTRODUCING THE GOES IMAGER CLEAR-SKY BRIGHTNESS TEMPERATURE (CSBT) PRODUCT Anthony J. Schreiner Cooperative Institute for Meteorological Satellite Studies (CIMSS) University of Wisconsin-Madison
P4.23 INTRODUCING THE GOES IMAGER CLEAR-SKY BRIGHTNESS TEMPERATURE (CSBT) PRODUCT Anthony J. Schreiner Cooperative Institute for Meteorological Satellite Studies (CIMSS) University of Wisconsin-Madison
Snow process modeling in the North American Land Data Assimilation System (NLDAS): 1. Evaluation of model-simulated snow cover extent
: 1. Evaluation of model-simulated snow cover extent") JOURNAL OF GEOPHYSICAL RESEARCH, VOL. 108, NO. D22, 8849, doi:10.1029/2002jd003274, 2003 Snow process modeling in the North American Land Data Assimilation System (NLDAS): 1. Evaluation of model-simulated
JOURNAL OF GEOPHYSICAL RESEARCH, VOL. 108, NO. D22, 8849, doi:10.1029/2002jd003274, 2003 Snow process modeling in the North American Land Data Assimilation System (NLDAS): 1. Evaluation of model-simulated
Towards a better use of AMSU over land at ECMWF
 Towards a better use of AMSU over land at ECMWF Blazej Krzeminski 1), Niels Bormann 1), Fatima Karbou 2) and Peter Bauer 1) 1) European Centre for Medium-range Weather Forecasts (ECMWF), Shinfield Park,
Evidence of Clear-Sky Daylight Whitening: Are we already conducting geoengineering?
 Evidence of Clear-Sky Daylight Whitening: Are we already conducting geoengineering? Chuck Long (NOAA ESRL GMD/CIRES) Jim Barnard & Connor Flynn (PNNL) Are we already conducting geoengineering? We think
Shortwave Radiative Transfer in the Earth s Atmosphere: Current Models and Validation
 Shortwave Radiative Transfer in the Earth s Atmosphere: Current Models and Validation Jennifer Delamere, Eli Mlawer, and Tony Clough Atmospheric & Environmental Research, Inc. Summary AER builds radiative
Chapter 4 Nadir looking UV measurement. Part-I: Theory and algorithm
 Chapter 4 Nadir looking UV measurement. Part-I: Theory and algorithm -Aerosol and tropospheric ozone retrieval method using continuous UV spectra- Atmospheric composition measurements from satellites are
An Overview of Atmospheric Analyses and Reanalyses for Climate
 An Overview of Atmospheric Analyses and Reanalyses for Climate Kevin E. Trenberth NCAR Boulder CO Analysis Data Assimilation merges observations & model predictions to provide a superior state estimate.
Interaction of North American Land Data Assimilation System and National Soil Moisture Network: Soil Products and Beyond
 Interaction of North American Land Data Assimilation System and National Soil Moisture Network: Soil Products and Beyond Youlong Xia 1,2, Michael B. Ek 1, Yihua Wu 1,2, Christa Peters-Lidard 3, David M.
5. General Circulation Models
 5. General Circulation Models I. 3-D Climate Models (General Circulation Models) To include the full three-dimensional aspect of climate, including the calculation of the dynamical transports, requires
A Time Series of Photo-synthetically Available Radiation at the Ocean Surface from SeaWiFS and MODIS Data
 A Time Series of Photo-synthetically Available Radiation at the Ocean Surface from SeaWiFS and MODIS Data Robert Frouin* a, John McPherson a, Kyozo Ueyoshi a, Bryan A. Franz b a Scripps Institution of
Actual and insolation-weighted Northern Hemisphere snow cover and sea-ice between
 Climate Dynamics (2004) 22: 591 595 DOI 10.1007/s00382-004-0401-5 R. A. Pielke Sr. Æ G. E. Liston Æ W. L. Chapman D. A. Robinson Actual and insolation-weighted Northern Hemisphere snow cover and sea-ice
Radiation in climate models.
 Lecture. Radiation in climate models. Objectives:. A hierarchy of the climate models.. Radiative and radiative-convective equilibrium.. Examples of simple energy balance models.. Radiation in the atmospheric
ERBE Geographic Scene and Monthly Snow Data
 NASA Contractor Report 4773 ERBE Geographic Scene and Monthly Snow Data Lisa H. Coleman, Beth T. Flug, Shalini Gupta, Edward A. Kizer, and John L. Robbins Science Applications International Corporation
GHI CORRELATIONS WITH DHI AND DNI AND THE EFFECTS OF CLOUDINESS ON ONE-MINUTE DATA
 GHI CORRELATIONS WITH DHI AND DNI AND THE EFFECTS OF CLOUDINESS ON ONE-MINUTE DATA Frank Vignola Department of Physics 1274 University of Oregon Eugene, OR 97403-1274 e-mail: fev@uoregon.edu ABSTRACT The
CORRELATION BETWEEN ATMOSPHERIC COMPOSITION AND VERTICAL STRUCTURE AS MEASURED BY THREE GENERATIONS OF HYPERSPECTRAL SOUNDERS IN SPACE
 CORRELATION BETWEEN ATMOSPHERIC COMPOSITION AND VERTICAL STRUCTURE AS MEASURED BY THREE GENERATIONS OF HYPERSPECTRAL SOUNDERS IN SPACE Nadia Smith 1, Elisabeth Weisz 1, and Allen Huang 1 1 Space Science
NOAA MSU/AMSU Radiance FCDR. Methodology, Production, Validation, Application, and Operational Distribution. Cheng-Zhi Zou
 NOAA MSU/AMSU Radiance FCDR Methodology, Production, Validation, Application, and Operational Distribution Cheng-Zhi Zou NOAA/NESDIS/Center for Satellite Applications and Research GSICS Microwave Sub-Group
An algorithm for estimating downward shortwave radiation from GMS 5 visible imagery and its evaluation over China
 JOURNAL OF GEOPHYSICAL RESEARCH, VOL. 115,, doi:10.1029/2009jd013457, 2010 An algorithm for estimating downward shortwave radiation from GMS 5 visible imagery and its evaluation over China Ning Lu, 1,2
May 3, :41 AOGS - AS 9in x 6in b951-v16-ch13 LAND SURFACE ENERGY BUDGET OVER THE TIBETAN PLATEAU BASED ON SATELLITE REMOTE SENSING DATA
 Advances in Geosciences Vol. 16: Atmospheric Science (2008) Eds. Jai Ho Oh et al. c World Scientific Publishing Company LAND SURFACE ENERGY BUDGET OVER THE TIBETAN PLATEAU BASED ON SATELLITE REMOTE SENSING
Observational Needs for Polar Atmospheric Science
 Observational Needs for Polar Atmospheric Science John J. Cassano University of Colorado with contributions from: Ed Eloranta, Matthew Lazzara, Julien Nicolas, Ola Persson, Matthew Shupe, and Von Walden
P1.20 MICROWAVE LAND EMISSIVITY OVER COMPLEX TERRAIN: APPLIED TO TEMPERATURE PROFILING WITH NOGAPS ABSTRACT
 P1.0 MICROWAVE LAND EMISSIVITY OVER COMPLEX TERRAIN: APPLIED TO TEMPERATURE PROFILING WITH NOGAPS Benjamin Ruston *1, Thomas Vonder Haar 1, Andrew Jones 1, and Nancy Baker 1 Cooperative Institute for Research
2009 Progress Report To The National Aeronautics and Space Administration NASA Energy and Water Cycle Study (NEWS) Program
 Program") 2009 Progress Report To The National Aeronautics and Space Administration NASA Energy and Water Cycle Study (NEWS) Program Proposal Title: Grant Number: PI: The Challenges of Utilizing Satellite Precipitation
2009 Progress Report To The National Aeronautics and Space Administration NASA Energy and Water Cycle Study (NEWS) Program Proposal Title: Grant Number: PI: The Challenges of Utilizing Satellite Precipitation
SATELLITE OBSERVATIONS OF CLOUD RADIATIVE FORCING FOR THE AFRICAN TROPICAL CONVECTIVE REGION
 SATELLITE OBSERVATIONS OF CLOUD RADIATIVE FORCING FOR THE AFRICAN TROPICAL CONVECTIVE REGION J. M. Futyan, J. E. Russell and J. E. Harries Space and Atmospheric Physics Group, Blackett Laboratory, Imperial
EVALUATION OF THE UAH GOES INSOLATION PRODUCT THROUGH COMPARISON WITH PYRANOMETER MEASUREMENTS AND ANALYSIS DATASETS
 EVALUATION OF THE UAH GOES INSOLATION PRODUCT THROUGH COMPARISON WITH PYRANOMETER MEASUREMENTS AND ANALYSIS DATASETS Peiyang Cheng *, Arastoo Pour-Biazar, Richard McNider, and John Mecikalski Department
Influence of Clouds and Aerosols on the Earth s Radiation Budget Using Clouds and the Earth s Radiant Energy System (CERES) Measurements
 Measurements") Influence of Clouds and Aerosols on the Earth s Radiation Budget Using Clouds and the Earth s Radiant Energy System (CERES) Measurements Norman G. Loeb Hampton University/NASA Langley Research Center Bruce
Influence of Clouds and Aerosols on the Earth s Radiation Budget Using Clouds and the Earth s Radiant Energy System (CERES) Measurements Norman G. Loeb Hampton University/NASA Langley Research Center Bruce
Can we measure from satellites the cloud effects on the atmospheric radiation budget?
 1 Can we measure from satellites the cloud effects on the atmospheric radiation budget? Ehrhard Raschke University of Hamburg Institute of Meteorology Abstract Clouds modify all radiation budget components
Introduction to Climate ~ Part I ~
 2015/11/16 TCC Seminar JMA Introduction to Climate ~ Part I ~ Shuhei MAEDA (MRI/JMA) Climate Research Department Meteorological Research Institute (MRI/JMA) 1 Outline of the lecture 1. Climate System (
Assessing the Radiative Impact of Clouds of Low Optical Depth
 Assessing the Radiative Impact of Clouds of Low Optical Depth W. O'Hirok and P. Ricchiazzi Institute for Computational Earth System Science University of California Santa Barbara, California C. Gautier
The North American Land Data Assimilation System (NLDAS)
") The North American Land Data Assimilation System (NLDAS) Kenneth Mitchell and Dag Lohmann NCEP/EMC, Camp Springs, MD 20746 United States Kenneth.Mitchell@noaa.gov ABSTRACT This paper describes the purpose,
The North American Land Data Assimilation System (NLDAS) Kenneth Mitchell and Dag Lohmann NCEP/EMC, Camp Springs, MD 20746 United States Kenneth.Mitchell@noaa.gov ABSTRACT This paper describes the purpose,
OSI SAF SST Products and Services
 OSI SAF SST Products and Services Pierre Le Borgne Météo-France/DP/CMS (With G. Legendre, A. Marsouin, S. Péré, S. Philippe, H. Roquet) 2 Outline Satellite IR radiometric measurements From Brightness Temperatures
Decadal variability in the Earth s reflectance as observed by Earthshine Enric Pallé
 Decadal variability in the Earth s reflectance as observed by Earthshine Enric Pallé Big Bear Solar Observatory, NJIT The albedo sets the input to the climate heat engine P in = Cπ R 2 E (1 A); Solar constant
EUMETSAT LSA-SAF EVAPOTRANSPIRATION PRODUCTS STATUS AND PERSPECTIVES
 EUMETSAT LSA-SAF EVAPOTRANSPIRATION PRODUCTS STATUS AND PERSPECTIVES Arboleda, N. Ghilain, F. Gellens-Meulenberghs Royal Meteorological Institute, Avenue Circulaire, 3, B-1180 Bruxelles, BELGIUM Corresponding
Remote Sensing Applications for Land/Atmosphere: Earth Radiation Balance
 Remote Sensing Applications for Land/Atmosphere: Earth Radiation Balance - Introduction - Deriving surface energy balance fluxes from net radiation measurements - Estimation of surface net radiation from
DEVELOPMENT OF A LARGE-SCALE HYDROLOGIC PREDICTION SYSTEM
 JP3.18 DEVELOPMENT OF A LARGE-SCALE HYDROLOGIC PREDICTION SYSTEM Ji Chen and John Roads University of California, San Diego, California ABSTRACT The Scripps ECPC (Experimental Climate Prediction Center)
CGMS Baseline. Sustained contributions to the Global Observing System. Endorsed by CGMS-46 in Bengaluru, June 2018
 CGMS Baseline Sustained contributions to the Global Observing System Best Practices for Achieving User Readiness for New Meteorological Satellites Endorsed by CGMS-46 in Bengaluru, June 2018 CGMS/DOC/18/1028862,
1.5 HIGH-RESOLUTION LAND DATA ASSIMILATION IN THE NCAR/ATEC 1.5 REAL-TIME FDDA AND FORECASTING SYSTEM
 1.5 HIGH-RESOLUTION LAND DATA ASSIMILATION IN THE NCAR/ATEC 1.5 REAL-TIME FDDA AND FORECASTING SYSTEM Andrea N. Hahmann, Yubao Liu, Fei Chen, Kevin W. Manning, Thomas T. Warner, and Laurie Carlson Research
Land Surface Temperature Measurements From the Split Window Channels of the NOAA 7 Advanced Very High Resolution Radiometer John C.
 Land Surface Temperature Measurements From the Split Window Channels of the NOAA 7 Advanced Very High Resolution Radiometer John C. Price Published in the Journal of Geophysical Research, 1984 Presented
Snow Modeling and Observations at NOAA S National Operational Hydrologic Remote Sensing Center
 Snow Modeling and Observations at NOAA S National Operational Hydrologic Remote Sensing Center Thomas R. Carroll National Operational Hydrologic Remote Sensing Center, National Weather Service, National
Air sea satellite flux datasets and what they do (and don't) tell us about the air sea interface in the Southern Ocean
 tell us about the air sea interface in the Southern Ocean") Air sea satellite flux datasets and what they do (and don't) tell us about the air sea interface in the Southern Ocean Carol Anne Clayson Woods Hole Oceanographic Institution Southern Ocean Workshop Seattle,
Air sea satellite flux datasets and what they do (and don't) tell us about the air sea interface in the Southern Ocean Carol Anne Clayson Woods Hole Oceanographic Institution Southern Ocean Workshop Seattle,
Satellite data assimilation for Numerical Weather Prediction II
 Satellite data assimilation for Numerical Weather Prediction II Niels Bormann European Centre for Medium-range Weather Forecasts (ECMWF) (with contributions from Tony McNally, Jean-Noël Thépaut, Slide
P3.24 EVALUATION OF MODERATE-RESOLUTION IMAGING SPECTRORADIOMETER (MODIS) SHORTWAVE INFRARED BANDS FOR OPTIMUM NIGHTTIME FOG DETECTION
 SHORTWAVE INFRARED BANDS FOR OPTIMUM NIGHTTIME FOG DETECTION") P3.24 EVALUATION OF MODERATE-RESOLUTION IMAGING SPECTRORADIOMETER (MODIS) SHORTWAVE INFRARED BANDS FOR OPTIMUM NIGHTTIME FOG DETECTION 1. INTRODUCTION Gary P. Ellrod * NOAA/NESDIS/ORA Camp Springs, MD
P3.24 EVALUATION OF MODERATE-RESOLUTION IMAGING SPECTRORADIOMETER (MODIS) SHORTWAVE INFRARED BANDS FOR OPTIMUM NIGHTTIME FOG DETECTION 1. INTRODUCTION Gary P. Ellrod * NOAA/NESDIS/ORA Camp Springs, MD
Lecture 3. Background materials. Planetary radiative equilibrium TOA outgoing radiation = TOA incoming radiation Figure 3.1
 Lecture 3. Changes in planetary albedo. Is there a clear signal caused by aerosols and clouds? Outline: 1. Background materials. 2. Papers for class discussion: Palle et al., Changes in Earth s reflectance
Study of the Influence of Thin Cirrus Clouds on Satellite Radiances Using Raman Lidar and GOES Data
 Study of the Influence of Thin Cirrus Clouds on Satellite Radiances Using Raman Lidar and GOES Data D. N. Whiteman, D. O C. Starr, and G. Schwemmer National Aeronautics and Space Administration Goddard