Monitoring: Spore Trapping. Presenter John Rupe
|
|
|
- Barbara Kelly
- 6 years ago
- Views:
Transcription
1 Monitoring: Spore Trapping Presenter John Rupe
2 Projects Florida SBR Collection Network UF, UI, USDA-ARS Dry and rain deposition Syngenta Spore Trap Network Syngenta, UA Dry deposition Detection of SBR Spores in Rain USDA-ARS, UM Rain deposition
3 Objectives Determine spore distribution during the season Determine possible inoculum sources Efficacy of spore trapping in forecasting soybean rust
4 Florida SBR Collection Network Funded by USDA NRI Biosecurity grant USDA RMA-CSREES Interagency Agreement Spore traps Passive, dry deposition Rain deposition

5 Spore Traps
6 Spore Traps Passive, dry deposition Glass slide coated with petroleum jelly Rain deposition Funnel 36 cm dia. Filters-47 mm in diameter, 12 µm pore Changed weekly
7 Florida Spore Traps Traps located in 18 counties and sampled from February to October Tested by qpcr Of the 408 samples from passive traps, 44 were positive (11%) Of the 408 sample from rainwater traps, 17 were positive (4%)
8 Florida Passive Traps 2006 Month of First Detection 3 March April May June July August Negative Not - 15 tested
9 Florida Rain Traps 2006 Month of First Detection 6 June July August Negative Not - 15 tested
10 Illinois Spore Traps samples were collected throughout the state mostly in July and August and mostly on a weekly basis These included passive (microscope slides) and active traps 12 of the passive traps had "rust-like" spores; none of the active traps were rust positive based on PCR assays Rust was first found 10 October only one trap in southern Illinois was still active through September and part of October; no spores were found on passive traps during that time
11 Conclusions No strong geographic or temporal pattern Did not collect spores from adjacent diseased plots September and October data being analyzed.


12 GIS Analysis of the Syngenta Spore Trap Network Data 2006 Season Acknowledgements University of Arkansas Iowa State University St. Louis University State Universities & Land Grant Extension Personnel Syngenta Pathology Staff & Technical Service Representatives Syngenta GIS staff USDA PIPE Web Site & ZEDX Inc.

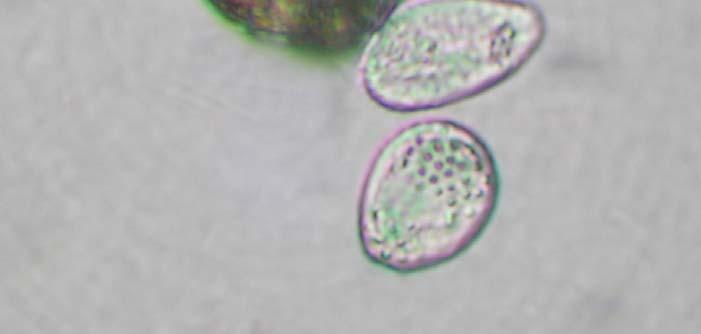

13 Soybean Rust-like Spores
14 Overview:2005 and Traps States Slide total SBR-like
15 Slide numbe Slides with SBR-like Spores May 1-Jun 2-Jun 1-July 2-July 1-Aug 2-Aug 1-Sept 2-Sept 1-Oct 2-Oct

16 USDA Rust Positive Counties & Syngenta Spore Trap Network May 2006 USDA Data Sources: USDA PIPE Web Site


17 USDA Rust Positive Counties & Syngenta Spore Trap Network June 2006 USDA Data Sources: USDA PIPE Web Site

18 USDA Rust Positive Counties & Syngenta Spore Trap Network July 2006 USDA Data Sources: USDA PIPE Web Site


19 USDA Rust Positive Counties & Syngenta Spore Trap Network August 2006 USDA Data Sources: USDA PIPE Web Site

20 USDA Rust Positive Counties & Syngenta Spore Trap Network September 2006 USDA Data Sources: USDA PIPE Web Site

21 USDA Rust Positive Counties & Syngenta Spore Trap Network October 2006 USDA Data Sources: USDA PIPE Web Site
22 USDA Rust Positive Counties & Syngenta Spore Trap Network November 2006 October 2006 USDA Data Sources: USDA PIPE Web Site

23 USDA Rust Positive Counties & Syngenta Spore Trap Network November 2006 USDA Data Sources: USDA PIPE Web Site


24 Detection of Phakopsora pachyrhizi spores in rain using a real-time PCR assay Valeria Avanzato, 2006 Valeria Avanzato, 2006 Valeria Avanzato, 2006


25 People Les Szabo and Charlie Barnes USDA-ARS Cereal Disease Laboratory University of Minnesota Funding provided by USDA-ARS ARS and the United Soybean Board
26 People Van Bowersox and Karen Harlin Illinois State Water Survey National Atmospheric Deposition Program/ National Trends Network National Atmospheric Deposition Program A Cooperative Research Support Program of the State Agricultural Experiment Stations (NRSP-3) Federal and State Agencies and Non-Governmental Research Organizations

27 NADP Sites 110 sites

28 NADP Collectors Active, collects only Wet deposition Approximately 14 diameter Monitored weekly
29 Overview Detection of Phakopsora pachyrhizi Rain samples filtered DNA extracted from half filters Nested real-time PCR assay specific for P. pachyrhizi
30 Results 1,581 rain samples May 9 - August 29th 270 samples tested positive for P. pachyrhizi Turn around time was less than 3 weeks from the collection start date
31 Proportion of Relative qpcr Scores for Number of Positives May June July August Relative Score High Trace
32 Number of Positive Samples May 16 - Aug 29, 2006
33 Summary 270 of 1581 rain samples were positive (17%) for P. pachyrhizi in 2006 Positives were found in every state except North Dakota A bimodal temporal pattern in spore deposition was observed Highest frequency of detection and spore load was observed in August No correlation between spore detection and amount of rain


34 Summary Temporal pattern similar in 2005 and 2006 Three fold increase in the number of positive samples in 2006 compared to 2005 Spore load also increased in 2006 compared to 2005
35 Overall Summary Phakopsora pachyrhizi spores are widely distributed early in the season Highest concentrations in August and September Spore viability may be very low
Application of the Integrated Aerobiology Modeling System to Soybean Rust Forecasting in 2006
 Application of the Integrated Aerobiology Modeling System to Soybean Rust Forecasting in 2006 Scott A. Isard Penn State University & Joseph M. Russo ZedX Inc. Integrated Aerobiology Modeling System (IAMS)
Global Movements of Rust Pathogens in the Atmosphere
 Global Movements of Rust Pathogens in the Atmosphere Scott A. Isard Departments of Plant Pathology and Meteorology Pennsylvania State University University Park, PA USA 16802 & Joseph M. Russo Senior Research
An assessment of the risk of aerial transport of rust pathogens to the Western Hemisphere and within North America
 An assessment of the risk of aerial transport of rust pathogens to the Western Hemisphere and within North America Scott A. Isard Departments of Plant Pathology and Meteorology Pennsylvania State University
Prince Edward County Appellation 2015 Growing Season Summary
 Overview Prince Edward County Appellation 215 Growing Season Summary The 215 growing season in the Prince Edward County appellation ended with above normal heat units. Daytime temperatures typically averaged
Country Presentation-Nepal
 Country Presentation-Nepal Mt.Everest, Shiva Pd. Nepal, DHM South Asia Drought Monitor Workshop Dhaka Bangladesh 2 th April 215 Overview Brief Climatology Climate activities- DHM PPCR (Pilot Program for
Swine Enteric Coronavirus Disease (SECD) Situation Report Mar 5, 2015
 Situation Report Mar 5, 2015") Animal and Plant Health Inspection Service Veterinary Services Swine Enteric Coronavirus Disease (SECD) Situation Report Mar 5, 2015 Information current as of 12:00 pm MDT, 03/04/2015 This report provides
Animal and Plant Health Inspection Service Veterinary Services Swine Enteric Coronavirus Disease (SECD) Situation Report Mar 5, 2015 Information current as of 12:00 pm MDT, 03/04/2015 This report provides
Swine Enteric Coronavirus Disease (SECD) Situation Report Sept 17, 2015
 Situation Report Sept 17, 2015") Animal and Plant Health Inspection Service Veterinary Services Swine Enteric Coronavirus Disease (SECD) Situation Report Sept 17, 2015 Information current as of 12:00 pm MDT, 09/16/2015 This report provides
Animal and Plant Health Inspection Service Veterinary Services Swine Enteric Coronavirus Disease (SECD) Situation Report Sept 17, 2015 Information current as of 12:00 pm MDT, 09/16/2015 This report provides
WHEN IS IT EVER GOING TO RAIN? Table of Average Annual Rainfall and Rainfall For Selected Arizona Cities
 WHEN IS IT EVER GOING TO RAIN? Table of Average Annual Rainfall and 2001-2002 Rainfall For Selected Arizona Cities Phoenix Tucson Flagstaff Avg. 2001-2002 Avg. 2001-2002 Avg. 2001-2002 October 0.7 0.0
Swine Enteric Coronavirus Disease (SECD) Situation Report June 30, 2016
 Situation Report June 30, 2016") Animal and Plant Health Inspection Service Veterinary Services Swine Enteric Coronavirus Disease (SECD) Situation Report June 30, 2016 Information current as of 12:00 pm MDT, 06/29/2016 This report provides
Animal and Plant Health Inspection Service Veterinary Services Swine Enteric Coronavirus Disease (SECD) Situation Report June 30, 2016 Information current as of 12:00 pm MDT, 06/29/2016 This report provides
North Central U.S. Climate Summary and Outlook Webinar July 21, 2016
 North Central U.S. Climate Summary and Outlook Webinar July 21, 2016 Stuart Foster State Climatologist for Kentucky Department of Geography and Geology Western Kentucky University Stuart.foster@wku.edu
Jackson County 2013 Weather Data
 Jackson County 2013 Weather Data 61 Years of Weather Data Recorded at the UF/IFAS Marianna North Florida Research and Education Center Doug Mayo Jackson County Extension Director 1952-2008 Rainfall Data
Making a Climograph: GLOBE Data Explorations
 Making a Climograph: A GLOBE Data Exploration Purpose Students learn how to construct and interpret climographs and understand how climate differs from weather. Overview Students calculate and graph maximum
Sampling, Storage and Pre-Treatment Techniques
 1. Sampling Protocol Sample needs to be representative of the body of water (or other matrix) from where it originates. Sampling Considerations A. Location B. Frequency (hourly, daily) C. Spatial and temporal
U.S. Outlook For October and Winter Thursday, September 19, 2013
 About This report coincides with today s release of the monthly temperature and precipitation outlooks for the U.S. from the Climate Prediction Center (CPC). U.S. CPC October and Winter Outlook The CPC
The Climate of Bryan County
 The Climate of Bryan County Bryan County is part of the Crosstimbers throughout most of the county. The extreme eastern portions of Bryan County are part of the Cypress Swamp and Forest. Average annual
The Climate of Payne County
 The Climate of Payne County Payne County is part of the Central Great Plains in the west, encompassing some of the best agricultural land in Oklahoma. Payne County is also part of the Crosstimbers in the
Modeling of peak inflow dates for a snowmelt dominated basin Evan Heisman. CVEN 6833: Advanced Data Analysis Fall 2012 Prof. Balaji Rajagopalan
 Modeling of peak inflow dates for a snowmelt dominated basin Evan Heisman CVEN 6833: Advanced Data Analysis Fall 2012 Prof. Balaji Rajagopalan The Dworshak reservoir, a project operated by the Army Corps
REVISED** Agricultural Dust Explosions in 2002* The primary explosion occurred in the bucket elevator in seven cases and in a pelleting plant.
 REVISED** Department of Grain Science 201 Shellenberger Hall Manhattan, KS 66506-2201 785-532-6161 Fax: 785-532-7010 http://www.oznet.ksu.edu/dp_grsi/ February 15, 2003 REVISED March 15, 2003 Agricultural
Highlights of the 2006 Water Year in Colorado
 Highlights of the 2006 Water Year in Colorado Nolan Doesken, State Climatologist Atmospheric Science Department Colorado State University http://ccc.atmos.colostate.edu Presented to 61 st Annual Meeting
Applications/Users for Improved S2S Forecasts
 Applications/Users for Improved S2S Forecasts Nolan Doesken Colorado Climate Center Colorado State University WSWC Precipitation Forecasting Workshop June 7-9, 2016 San Diego, CA First -- A short background
The Climate of Grady County
 The Climate of Grady County Grady County is part of the Central Great Plains, encompassing some of the best agricultural land in Oklahoma. Average annual precipitation ranges from about 33 inches in northern
El Nino 2015 in South Sudan: Impacts and Perspectives. Raul Cumba
 El Nino 2015 in South Sudan: Impacts and Perspectives Raul Cumba El Nino 2015-2016 The El Nino Event of 2015-2016 The 2015/16 El Nino Event Officially declared in March 2015 Now approaching peak intensity
November 2018 Weather Summary West Central Research and Outreach Center Morris, MN
 November 2018 Weather Summary Lower than normal temperatures occurred for the second month. The mean temperature for November was 22.7 F, which is 7.2 F below the average of 29.9 F (1886-2017). This November
2010 Growing Season. Prince Edward County Report
 2010 Growing Season Prince Edward County Report WIN Staff November 10, 2010 Overview It is always remarkable how each growing season is unique as a result of yearly variations in weather. Changes occur
Application and verification of ECMWF products in Croatia
 Application and verification of ECMWF products in Croatia August 2008 1. Summary of major highlights At Croatian Met Service, ECMWF products are the major source of data used in the operational weather
1999 Day Precip Comments 2000 Day Precip Comments 2000 Day Precip Comments July January
 1999 Day Precip Comments 2000 Day Precip Comments 2000 Day Precip Comments July January 11 1.00 22 0.60 0.00 11.15 12 0.25 23 1.55 0.00 18.15 15 0.40 24 0.10 August 6-11 fog hvy-lite 16 0.75 26 0.05 0.00
Chiang Rai Province CC Threat overview AAS1109 Mekong ARCC
 Chiang Rai Province CC Threat overview AAS1109 Mekong ARCC This threat overview relies on projections of future climate change in the Mekong Basin for the period 2045-2069 compared to a baseline of 1980-2005.
Passive Diffusion Monitoring
 Passive Diffusion Monitoring for Ammonia in the US U.S. Lear, G. 1, C. Sweet 2,3, M. Caughey 3, C. Lehmann 2,3, T. Dombek 2,3, and D. Gay 2,3 1 U.S. Environmental Protection Agency Clean Air Markets Division
Changing Hydrology under a Changing Climate for a Coastal Plain Watershed
 Changing Hydrology under a Changing Climate for a Coastal Plain Watershed David Bosch USDA-ARS, Tifton, GA Jeff Arnold ARS Temple, TX and Peter Allen Baylor University, TX SEWRU Objectives 1. Project changes
Champaign-Urbana 1998 Annual Weather Summary
 Champaign-Urbana 1998 Annual Weather Summary ILLINOIS STATE WATER SURVEY Audrey Bryan, Weather Observer 2204 Griffith Dr. Champaign, IL 61820 wxobsrvr@sparc.sws.uiuc.edu The development of the El Nìno
A summary of the weather year based on data from the Zumwalt weather station
 ZUMWALT PRAIRIE WEATHER 2016 A summary of the weather year based on data from the Zumwalt weather station Figure 1. An unusual summer storm on July 10, 2016 brought the second-largest precipitation day
The Climate of Kiowa County
 The Climate of Kiowa County Kiowa County is part of the Central Great Plains, encompassing some of the best agricultural land in Oklahoma. Average annual precipitation ranges from about 24 inches in northwestern
Geostatistical Analysis of Rainfall Temperature and Evaporation Data of Owerri for Ten Years
 Atmospheric and Climate Sciences, 2012, 2, 196-205 http://dx.doi.org/10.4236/acs.2012.22020 Published Online April 2012 (http://www.scirp.org/journal/acs) Geostatistical Analysis of Rainfall Temperature
2008 Growing Season. Niagara Region
 28 Growing Season Niagara Region Weather INnovations Staff November 14, 28 Overview The start of the 28 growing season looked promising. After an extremely dry 27 growing season, soil moisture levels had
Evaluation of NDDOT Fixed Automated Spray Technology (FAST) Systems November 24, 2009
 Systems November 24, 2009") Evaluation of NDDOT Fixed Automated Spray Technology (FAST) Systems November 4, 009 Shawn Birst, PE Program Director, ATAC Associate Research Fellow Upper Great Plains Transportation Institute North Dakota
Evaluation of NDDOT Fixed Automated Spray Technology (FAST) Systems November 4, 009 Shawn Birst, PE Program Director, ATAC Associate Research Fellow Upper Great Plains Transportation Institute North Dakota
YACT (Yet Another Climate Tool)? The SPI Explorer
? The SPI Explorer") YACT (Yet Another Climate Tool)? The SPI Explorer Mike Crimmins Assoc. Professor/Extension Specialist Dept. of Soil, Water, & Environmental Science The University of Arizona Yes, another climate tool for
YACT (Yet Another Climate Tool)? The SPI Explorer Mike Crimmins Assoc. Professor/Extension Specialist Dept. of Soil, Water, & Environmental Science The University of Arizona Yes, another climate tool for
January 25, Summary
 January 25, 2013 Summary Precipitation since the December 17, 2012, Drought Update has been slightly below average in parts of central and northern Illinois and above average in southern Illinois. Soil
Interannual variation of MODIS NDVI in Lake Taihu and its relation to climate in submerged macrophyte region
 Yale-NUIST Center on Atmospheric Environment Interannual variation of MODIS NDVI in Lake Taihu and its relation to climate in submerged macrophyte region ZhangZhen 2015.07.10 1 Outline Introduction Data
Central Region Climate Outlook May 15, 2014
 Central Region Climate Outlook May 15, 2014 Dr. Jim Angel State Climatologist IL State Water Survey University of Illinois jimangel@illinois.edu 217-333-0729 Chicago-area flooding General Information Providing
Natural Disasters and Storms in Philadelphia. What is a storm? When cold, dry air meets warm, moist (wet) air, there is a storm.
 air, there is a storm.") Natural Disasters and Storms in Philadelphia 1. What is a natural disaster? 2. Does Philadelphia have many natural disasters? o Nature (noun) everything in the world not made No. Philadelphia does not
Natural Disasters and Storms in Philadelphia 1. What is a natural disaster? 2. Does Philadelphia have many natural disasters? o Nature (noun) everything in the world not made No. Philadelphia does not
Variability of Reference Evapotranspiration Across Nebraska
 Know how. Know now. EC733 Variability of Reference Evapotranspiration Across Nebraska Suat Irmak, Extension Soil and Water Resources and Irrigation Specialist Kari E. Skaggs, Research Associate, Biological
National Wildland Significant Fire Potential Outlook
 National Wildland Significant Fire Potential Outlook National Interagency Fire Center Predictive Services Issued: September, 2007 Wildland Fire Outlook September through December 2007 Significant fire
NATIONAL HYDROPOWER ASSOCIATION MEETING. December 3, 2008 Birmingham Alabama. Roger McNeil Service Hydrologist NWS Birmingham Alabama
 NATIONAL HYDROPOWER ASSOCIATION MEETING December 3, 2008 Birmingham Alabama Roger McNeil Service Hydrologist NWS Birmingham Alabama There are three commonly described types of Drought: Meteorological drought
PRELIMINARY ASSESSMENT OF SURFACE WATER RESOURCES - A STUDY FROM DEDURU OYA BASIN OF SRI LANKA
 PRELIMINARY ASSESSMENT OF SURFACE WATER RESOURCES - A STUDY FROM DEDURU OYA BASIN OF SRI LANKA THUSHARA NAVODANI WICKRAMAARACHCHI Hydrologist, Water Resources Secretariat of Sri Lanka, Room 2-125, BMICH,
NATIONAL WEATHER SERVICE
 January 2016 February 9, 2016 This was a dry month across the HSA despite one large and several smaller snowfalls. Most locations ended up 1-2 inches below normal for the month. The driest locations at
2018 Annual Review of Availability Assessment Hours
 2018 Annual Review of Availability Assessment Hours Amber Motley Manager, Short Term Forecasting Clyde Loutan Principal, Renewable Energy Integration Karl Meeusen Senior Advisor, Infrastructure & Regulatory
Drought Characterization. Examination of Extreme Precipitation Events
 Drought Characterization Examination of Extreme Precipitation Events Extreme Precipitation Events During the Drought For the drought years (1999-2005) daily precipitation data was analyzed to find extreme
Local Ctimatotogical Data Summary White Hall, Illinois
 SWS Miscellaneous Publication 98-5 STATE OF ILLINOIS DEPARTMENT OF ENERGY AND NATURAL RESOURCES Local Ctimatotogical Data Summary White Hall, Illinois 1901-1990 by Audrey A. Bryan and Wayne Armstrong Illinois
Climate Change Impact on Air Temperature, Daily Temperature Range, Growing Degree Days, and Spring and Fall Frost Dates In Nebraska
 EXTENSION Know how. Know now. Climate Change Impact on Air Temperature, Daily Temperature Range, Growing Degree Days, and Spring and Fall Frost Dates In Nebraska EC715 Kari E. Skaggs, Research Associate
PYROGEOGRAPHY OF THE IBERIAN PENINSULA
 PYROGEOGRAPHY OF THE IBERIAN PENINSULA Teresa J. Calado (1), Carlos C. DaCamara (1), Sílvia A. Nunes (1), Sofia L. Ermida (1) and Isabel F. Trigo (1,2) (1) Instituto Dom Luiz, Universidade de Lisboa, Lisboa,
DROUGHT ASSESSMENT USING SATELLITE DERIVED METEOROLOGICAL PARAMETERS AND NDVI IN POTOHAR REGION
 DROUGHT ASSESSMENT USING SATELLITE DERIVED METEOROLOGICAL PARAMETERS AND NDVI IN POTOHAR REGION Researcher: Saad-ul-Haque Supervisor: Dr. Badar Ghauri Department of RS & GISc Institute of Space Technology
Champaign-Urbana 2001 Annual Weather Summary
 Champaign-Urbana 2001 Annual Weather Summary ILLINOIS STATE WATER SURVEY 2204 Griffith Dr. Champaign, IL 61820 wxobsrvr@sws.uiuc.edu Maria Peters, Weather Observer January: After a cold and snowy December,
UNITED STATES AND SOUTH AMERICA OUTLOOK (FULL REPORT) Wednesday, April 18, 2018
 Wednesday, April 18, 2018") T-storm Weather Summary Coolness continues over the next week in much of the central U.S., most likely producing the coldest April since 1907 in the Corn Belt, but followed by seasonable to mild weather
T-storm Weather Summary Coolness continues over the next week in much of the central U.S., most likely producing the coldest April since 1907 in the Corn Belt, but followed by seasonable to mild weather
Wheat Outlook July 24, 2017 Volume 26, Number 44
 Today s Newsletter Market Situation Crop Progress 1 Weather 1 Grain Use 5 Market Situation Crop Progress. The U.S. spring wheat crop condition index this week is down only one point to 277 with 96% of
Minnesota s Climatic Conditions, Outlook, and Impacts on Agriculture. Today. 1. The weather and climate of 2017 to date
 Minnesota s Climatic Conditions, Outlook, and Impacts on Agriculture Kenny Blumenfeld, State Climatology Office Crop Insurance Conference, Sep 13, 2017 Today 1. The weather and climate of 2017 to date
Who is polluting the Columbia River Gorge?
 Who is polluting the Columbia River Gorge? Final report to the Yakima Nation Prepared by: Dan Jaffe, Ph.D Northwest Air Quality, Inc. 7746 Ravenna Avenue NE Seattle WA 98115 NW_airquality@hotmail.com December
Quantification of Icelandic dust export: proposal of a combined measurement and modeling experiment
 Quantification of Icelandic dust export: proposal of a combined measurement and modeling experiment Konrad Kandler, Stephan Weinbruch, Kerstin Schepanski Technische Universität Darmstadt, Applied Geosciences
UNITED STATES AND SOUTH AMERICA OUTLOOK (FULL REPORT) Thursday, December 28, 2017
 Thursday, December 28, 2017") T-storm Weather Summary Despite scattered t-storms Sat.-Sun. in central and northern areas in Argentina, more will likely be needed especially in sunflower areas of the southwest. Some t-storms likely
T-storm Weather Summary Despite scattered t-storms Sat.-Sun. in central and northern areas in Argentina, more will likely be needed especially in sunflower areas of the southwest. Some t-storms likely
US Drought Status. Droughts 1/17/2013. Percent land area affected by Drought across US ( ) Dev Niyogi Associate Professor Dept of Agronomy
 Dev Niyogi Associate Professor Dept of Agronomy") Droughts US Drought Status Dev Niyogi Associate Professor Dept of Agronomy Deptof Earth Atmospheric Planetary Sciences Indiana State Climatologist Purdue University LANDSURFACE.ORG iclimate.org climate@purdue.edu
Droughts US Drought Status Dev Niyogi Associate Professor Dept of Agronomy Deptof Earth Atmospheric Planetary Sciences Indiana State Climatologist Purdue University LANDSURFACE.ORG iclimate.org climate@purdue.edu
The Climate of Marshall County
 The Climate of Marshall County Marshall County is part of the Crosstimbers. This region is a transition region from the Central Great Plains to the more irregular terrain of southeastern Oklahoma. Average
Midwest/Great Plains Climate-Drought Outlook September 20, 2018
 Midwest/Great Plains Climate-Drought Outlook September 20, 2018 Brian Fuchs National Drought Mitigation Center University of Nebraska-Lincoln School of Natural Resources September 20, 2018 General Information
A Review of the 2007 Water Year in Colorado
 A Review of the 2007 Water Year in Colorado Nolan Doesken Colorado Climate Center, CSU Mike Gillespie Snow Survey Division, USDA, NRCS Presented at the 28 th Annual AGU Hydrology Days, March 26, 2008,
Analysis of Historical Pattern of Rainfall in the Western Region of Bangladesh
 24 25 April 214, Asian University for Women, Bangladesh Analysis of Historical Pattern of Rainfall in the Western Region of Bangladesh Md. Tanvir Alam 1*, Tanni Sarker 2 1,2 Department of Civil Engineering,
The Colorado Drought : 2003: A Growing Concern. Roger Pielke, Sr. Colorado Climate Center.
 The Colorado Drought 2001-2003: 2003: A Growing Concern Roger Pielke, Sr. Colorado Climate Center Prepared by Tara Green and Odie Bliss http://climate.atmos.colostate.edu 2 2002 Drought History in Colorado
Memo. I. Executive Summary. II. ALERT Data Source. III. General System-Wide Reporting Summary. Date: January 26, 2009 To: From: Subject:
 Memo Date: January 26, 2009 To: From: Subject: Kevin Stewart Markus Ritsch 2010 Annual Legacy ALERT Data Analysis Summary Report I. Executive Summary The Urban Drainage and Flood Control District (District)
MISSION DEBRIEFING: Teacher Guide
 Activity 2: It s Raining Again?! Using real data from one particular location, students will interpret a graph that relates rainfall to the number of cases of malaria. Background The relationship between
The Climate of Haskell County
 The Climate of Haskell County Haskell County is part of the Hardwood Forest. The Hardwood Forest is characterized by its irregular landscape and the largest lake in Oklahoma, Lake Eufaula. Average annual
TEXAS WILDLAND FIRE POTENTIAL WINTER/SPRING 2018/2019
 TEXAS WILDLAND FIRE POTENTIAL WINTER/SPRING 2018/2019 Texas A&M Forest Service Predictive Services Prepared December 12 th 2018 Brad Smith Luke Kanclerz Scott Breit Tom Spencer Mike Dunivan 2 Fire Potential
Department of Grain Science and Industry. Agricultural Dust Explosions in 1996*
 Department of Science and Industry 201 Shellenberger Hall Manhattan, Kansas 66506-2201 913-532-6161 FAX: 913-532-7010 February 3, 1997 Agricultural Dust Explosions in 1996* The title of this report has
ZANER WHEN DOES WEATHER MATTER? For more information, call: Or visit: Zaner is proud to present
 ZANER The market has been under pressure the past three weeks. The 9 and 20 day moving average have met, for the first time since September and again falls below 40. Zaner is proud to present WHEN DOES
The Climate of Pontotoc County
 The Climate of Pontotoc County Pontotoc County is part of the Crosstimbers. This region is a transition region from the Central Great Plains to the more irregular terrain of southeast Oklahoma. Average
NatGasWeather.com Daily Report
 NatGasWeather.com Daily Report Issue Time: 5:15 pm EST Sunday, February 28 th, 2016 for Monday, Feb 29 th 7-Day Weather Summary (February 28 th March 5 th ): High pressure will dominate much of the US
Effect of El Niño Southern Oscillation (ENSO) on the number of leaching rain events in Florida and implications on nutrient management
 on the number of leaching rain events in Florida and implications on nutrient management") Effect of El Niño Southern Oscillation (ENSO) on the number of leaching rain events in Florida and implications on nutrient management C. Fraisse 1, Z. Hu 1, E. H. Simonne 2 May 21, 2008 Apopka, Florida
Effect of El Niño Southern Oscillation (ENSO) on the number of leaching rain events in Florida and implications on nutrient management C. Fraisse 1, Z. Hu 1, E. H. Simonne 2 May 21, 2008 Apopka, Florida
The U. S. Winter Outlook
 The 2017-2018 U. S. Winter Outlook Michael Halpert Deputy Director Climate Prediction Center Mike.Halpert@noaa.gov http://www.cpc.ncep.noaa.gov Outline About the Seasonal Outlook Review of 2016-17 U. S.
Central Ohio Air Quality End of Season Report. 111 Liberty Street, Suite 100 Columbus, OH Mid-Ohio Regional Planning Commission
 217 218 Central Ohio Air Quality End of Season Report 111 Liberty Street, Suite 1 9189-2834 1 Highest AQI Days 122 Nov. 217 Oct. 218 July 13 Columbus- Maple Canyon Dr. 11 July 14 London 11 May 25 New Albany
The National Atmospheric Deposition Program (NADP)
") The National Atmospheric Deposition Program (NADP) Christopher Lehmann Director, Central Analytical Laboratory National Atmospheric Deposition Program Illinois State Water Survey - Prairie Research Institute
The National Atmospheric Deposition Program (NADP) Christopher Lehmann Director, Central Analytical Laboratory National Atmospheric Deposition Program Illinois State Water Survey - Prairie Research Institute
The Climate of Seminole County
 The Climate of Seminole County Seminole County is part of the Crosstimbers. This region is a transition region from the Central Great Plains to the more irregular terrain of southeastern Oklahoma. Average
The Climate of Murray County
 The Climate of Murray County Murray County is part of the Crosstimbers. This region is a transition between prairies and the mountains of southeastern Oklahoma. Average annual precipitation ranges from
Crop / Weather Update
 Crop / Weather Update The next will be published November 13, 2018, due to the Veteran s Day holiday on Monday. Corn Harvesting Progress 100% 90% 80% 70% 60% 50% 40% 30% 20% 10% 0% 9/9 9/16 9/23 9/30 10/7
Seasonal Hazard Outlook
 Winter 2016-2017 Current as of: October 21 Scheduled Update: December 614-799-6500 emawatch@dps.ohio.gov Overview Executive Summary Seasonal Forecast Heating Fuel Supply Winter Driving Preparedness Scheduled
Crop / Weather Update
 Crop / Weather Update Corn Crop Condition Percent of Acreage Rated Good or Excellent 85 80 75 70 65 60 55 50 45 The U.S. corn crop was rated 69% good-to-excellent on September 23, up 1% from week-ago,
FMEL Arboviral Epidemic Risk Assessment: Second Update for 2012 Week 23 (June 12, 2012)
") FMEL Arboviral Epidemic Risk Assessment: Second Update for 2012 Week 23 (June 12, 2012) Current Assesment of SLW\WN Epidemic Risk Figure 1. A map of peninsular Florida indicating areas currently at Medium
FMEL Arboviral Epidemic Risk Assessment: Second Update for 2012 Week 23 (June 12, 2012) Current Assesment of SLW\WN Epidemic Risk Figure 1. A map of peninsular Florida indicating areas currently at Medium
Agricultural Science Climatology Semester 2, Anne Green / Richard Thompson
 Agricultural Science Climatology Semester 2, 2006 Anne Green / Richard Thompson http://www.physics.usyd.edu.au/ag/agschome.htm Course Coordinator: Mike Wheatland Course Goals Evaluate & interpret information,
Volume XIV, Number 1 January 6, 2014
 Research & Extension for the Potato Industry of Idaho, Oregon, & Washington Andrew Jensen, Editor. ajensen@potatoes.com; 208-939-9965 www.nwpotatoresearch.com Volume XIV, Number 1 January 6, 2014 Accuracy
Application and verification of ECMWF products in Croatia - July 2007
 Application and verification of ECMWF products in Croatia - July 2007 By Lovro Kalin, Zoran Vakula and Josip Juras (Hydrological and Meteorological Service) 1. Summary of major highlights At Croatian Met
Application and verification of ECMWF products in Norway 2008
 Application and verification of ECMWF products in Norway 2008 The Norwegian Meteorological Institute 1. Summary of major highlights The ECMWF products are widely used by forecasters to make forecasts for
John Laznik 273 Delaplane Ave Newark, DE (302)
") Office Address: John Laznik 273 Delaplane Ave Newark, DE 19711 (302) 831-0479 Center for Applied Demography and Survey Research College of Human Services, Education and Public Policy University of Delaware
Office Address: John Laznik 273 Delaplane Ave Newark, DE 19711 (302) 831-0479 Center for Applied Demography and Survey Research College of Human Services, Education and Public Policy University of Delaware
The Climate of Texas County
 The Climate of Texas County Texas County is part of the Western High Plains in the north and west and the Southwestern Tablelands in the east. The Western High Plains are characterized by abundant cropland
New NOAA Precipitation-Frequency Atlas for Wisconsin
 New NOAA Precipitation-Frequency Atlas for Wisconsin #215966 Presentation to the Milwaukee Metropolitan Sewerage District Technical Advisory Team January 16, 2014 Michael G. Hahn, P.E., P.H. SEWRPC Chief
Analysis of Rainfall and Other Weather Parameters under Climatic Variability of Parbhani ( )
") International Journal of Current Microbiology and Applied Sciences ISSN: 2319-7706 Volume 7 Number 06 (2018) Journal homepage: http://www.ijcmas.com Original Research Article https://doi.org/10.20546/ijcmas.2018.706.295
International Journal of Current Microbiology and Applied Sciences ISSN: 2319-7706 Volume 7 Number 06 (2018) Journal homepage: http://www.ijcmas.com Original Research Article https://doi.org/10.20546/ijcmas.2018.706.295
2007 Area Source Emissions Inventory Methodology 670 RANGE IMPROVEMENT
 San Joaquin Valley AIR POLLUTION CONTROL DISTRICT 2007 Area Source Emissions Inventory Methodology 670 RANGE IMPROVEMENT I. Purpose This document describes the Area Source Methodology used to estimate
The Palfai Drought Index (PaDI) Expansion of applicability of Hungarian PAI for South East Europe (SEE) region Summary
 Expansion of applicability of Hungarian PAI for South East Europe (SEE) region Summary") The Palfai Drought Index () Expansion of applicability of Hungarian PAI for South East Europe (SEE) region Summary In Hungary the Palfai drought index (PAI) worked out for users in agriculture and in water
The Palfai Drought Index () Expansion of applicability of Hungarian PAI for South East Europe (SEE) region Summary In Hungary the Palfai drought index (PAI) worked out for users in agriculture and in water
Eric Snodgrass Co-Founder and Senior Atmospheric Scientist of Agrible, Inc Director of Undergraduate Studies Department of Atmospheric Sciences
 Eric Snodgrass Co-Founder and Senior Atmospheric Scientist of Agrible, Inc Director of Undergraduate Studies Department of Atmospheric Sciences University Of Illinois Urbana-Champaign snodgrss@illinois.edu
Causes of high PM 10 values measured in Denmark in 2006
 Causes of high PM 1 values measured in Denmark in 26 Peter Wåhlin and Finn Palmgren Department of Atmospheric Environment National Environmental Research Institute Århus University Denmark Prepared 2 October
September 2018 Weather Summary West Central Research and Outreach Center Morris, MN
 September 2018 Weather Summary The mean temperature for September was 60.6 F, which is 1.5 F above the average of 59.1 F (1886-2017). The high temperature for the month was 94 F on September 16 th. The
Long Term Renewables Forecast Hauser Plads 10, 4 DK-1127 Copenhagen K Denmark
 Area: Germany Client: xxx Issued: 08:00 UTC 26.08.2016 Next update: 02.09.2016 Overview During 27-29 Aug a low pressure is passing south of UK towards southern Scandinavia and the connected fronts are
Twelve Moons Curriculum Overview
 Twelve Moons Twelve Moons Curriculum Overview 1. Instructions The curriculum is arranged by book section, in order. Feel free to teach in any order you wish. The curriculum adheres to three objectives
Why Models Need Standards Update on AgGateway Initiative
 Why Models Need Standards Update on AgGateway Initiative Joe Russo, Jean Batzer, Mark Gleason and Roger Magarey Midwest Weather Working Group 6 th Annual Meeting Austin, Texas August 9, 2013 Copyright
Sierra Weather and Climate Update
 Sierra Weather and Climate Update 2014-15 Kelly Redmond Western Regional Climate Center Desert Research Institute Reno Nevada Yosemite Hydroclimate Workshop Yosemite Valley, 2015 October 8-9 Percent of
DROUGHT IN MAINLAND PORTUGAL
 DROUGHT IN MAINLAND Ministério da Ciência, Tecnologia e Ensino Superior Instituto de Meteorologia, I. P. Rua C Aeroporto de Lisboa Tel.: (351) 21 844 7000 e-mail:informacoes@meteo.pt 1749-077 Lisboa Portugal